


Introduction
Recently, the press has carried a series of articles complaining that Australia’s productivity growth has stalled and that a lot of the blame lies with the low or negative productivity growth in the non-market sector. The degree of productivity growth tends to be correlated with growth in living standards, although not necessarily the quality of life. That is clear in the government’s well-being statement (Australian Government 2023).
Krugman famously wrote:
Productivity isn’t everything, but in the long run it is almost everything. A country’s ability to improve its standard of living over time depends almost entirely on its ability to raise its output per worker (Krugman Reference Krugman1994).
Krugman’s quote is generally taken to mean that productivity and living standards are almost interchangeable in discussions about either. While GDP per capita is the basis of our standard measure of productivity, there are obviously genuine debates about whether GDP and well-being are all that well correlated. To illustrate the point, as nations improve their ability to produce fossil fuels and weapons systems, it is hard to say that human welfare is increased. There are also measurement issues given that GDP does not take account of depreciation or environmental degradation and includes the incomes of non-residents. Policy implications are often unclear and misconceived. For example, the Coalition Government in Australia (2013–2022) stressed its commitment to increasing productivity growth. However, it introduced labour market and other reforms that may well have increased profits but had zero or negative effects on productivity growth (Saunders and Denniss Reference Saunders and Denniss2021). Policies to reduce labour costs will weaken the incentive for business to economise on labour and work against a productivity agenda.
The recent discussion has a notable new twist which puts much of the blame for low productivity growth on the public sector. The mechanisms are more nuanced than a simple correlation of productivity determining living standards. John Nevile (Reference Nevile1975) made an important contribution in the context of the 1975 national wage case, in which he argued that only productivity in the market sector was relevant for wage-setting purposes. In estimating real incomes, we use an inflation adjustment based on prices in the market sector, and therefore, to be consistent, we should use productivity in the market sector. The contribution of productivity in the non-market sector is excluded, not because it is any less important but because, as will be argued, it is both unmeasurable and its allocation does not take place through market transactions. Nevile’s arguments were based on the application of Keynesian and/or Kaleckian insights into the behaviour of national accounting magnitudes. The argument is still relevant when we ask questions of whether real wages and other incomes are keeping up with where they ‘should’ be. Nevile arguably played an important role in the introduction of quarterly wage indexation 50 years ago.
The purpose of this paper is to revisit the Nevile argument, and show how it might continue to apply in present discussions. In the following section, ‘Pointing to the Government’, we discuss the way in which low public sector productivity growth has been treated by the press and economists who should know better. In these circles, it seems clear that low public sector productivity growth is dragging down living standards. It is of course true that, as measured, market sector productivity growth is greater than market plus non-market productivity growth. We show, in ‘How does the ABS measure productivity growth in the non-market sector’? that the non-market sector measurement is biased towards showing zero change in productivity. For example, for much of the non-market sector, output is proxied by inputs. As a result, measures of output per input become simply inputs per input. In other cases, equally unsatisfactory measures are used.
In our final substantive section, ‘The counter argument: We have been here before’, we take issue with the dragging-living-standards-down argument on two grounds. First, for most purposes, we effectively define living standards as people’s command over goods and services produced in the private sector, meaning productivity in the non-market sector is not relevant for these purposes. Second, as Nevile showed half a century ago, if wages in both sectors do not keep up with productivity in the market sector, then wages, which finance the bulk of consumer spending, will not keep up with the capacity of the private sector. Following that, we conclude the paper.
Pointing to the government
There has been a lot of concern expressed in recent years that slow productivity growth has been holding back living standards. Blame has been largely laid on the rise of services as a share of the economy, especially government services. The Productivity Commission (2025b, 9) said, ‘In the last decade, non-market (government-funded) health, education and care services have grown particularly rapidly in Australia. Since these sectors have lower measured productivity, their expansion weighs on overall productivity growth’. The head of the Productivity Commission, Danielle Wood, summed up by saying
So what that means is as those sectors [low productivity government service sectors] expand as a share of the economy, as they inevitably will, that will drive down productivity overall, and you have got to work harder elsewhere (McIlroy and Read Reference McIlroy and Read2024).
In discussing the role of the non-market sector, the RBA explicitly says: ‘The non-market sector … has grown as a share of the economy over recent years at a fairly rapid pace. Measured productivity … is low in these industries, and this has weighed on aggregate productivity’ (RBA 2025).
Birrell and McCloskey (Reference Birrell and McCloskey2019, 28) explicitly refer to this argument when they say, ‘More investment in health care and education will mean a further shift towards the nonmarket service sector of the economy where there is minimal growth in labour productivity’. Sinclair Davidson (Reference Davidson2024) has also put this argument, writing, ‘Over-government has turned up in the productivity statistics’ and ‘Government has expanded that part of the economy that is less productive at the expense of the part that is more productive’.
Other observers do not necessarily put that argument but only use the total productivity measures. For example, Kumar et al (Reference Kumar, Webber and Perry2009) discuss wages, inflation, and labour productivity in Australia without seeing the need to distinguish between total and market sector productivity measures. International studies of productivity that include Australia also fail to distinguish between market and total productivity (Meager and Speckesser Reference Meager and Speckesser2011). In a careful analysis of the link between wage growth and productivity, Bell and Keating (Reference Bell and Keating2019) fail to distinguish market and total productivity. There have also been press stories, especially in the Australian Financial Review, to the effect that low productivity growth in the public sector is dragging down Australia’s overall productivity performance.
The interest in productivity is in the implications for living standards. Obviously, if productivity growth is lower in the non-market sector, then, as a matter of simple arithmetic, aggregate productivity growth will also be lower than private sector productivity growth. But does this mean lower increases in living standards than would otherwise occur? Before proceeding any further, we should point out that, while the public discussion often focuses on the government or public sector versus the private sector, the relevant data sources distinguish between market and non-market sectors. The non-market sector includes ordinary government services together with not-for-profits that provide their services for free or almost free, such as unions, charities, environmental groups, and the Australia Institute. Some not-for-profits are included in the market sector, for example, some schools, colleges, universities, clinics, and hospitals (ABS 2015). Critics of the government tend to distinguish between the public and private sectors rather than non-market and market.
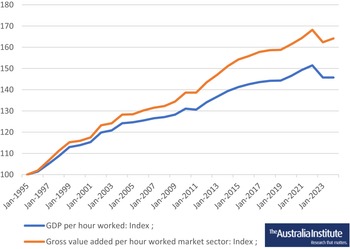
Before explicitly considering this question, Figure 1 demonstrates that productivity in the non-market sector is lower. This shows two productivity measures. First is GDP per hour worked and then gross value added per hour worked in the market sector expressed as an index with September 1994 = 100. Value added in the market sector is the equivalent of GDP in just the market sector. That is because GDP is equal to the value added from all parts of the economy. Value added in the market sector is merely GDP less value added in the non-market sector. (We ignore the minor contribution to GDP of taxes less subsidies on output.)
Productivity measures: GDP per hour worked and gross value added per hour worked in the market sector, indices, Sept 1994 = 100.
Source: ABS (2025a).

Over the period shown in Figure 1, productivity in the market sector grew by 64.9% while total GDP per hour worked grew by a more modest 44.3%. That equates to a significant amount over the three decades covered in Figure 1. This is why it is important to have an accurate analysis of the arguments in favour of choosing one productivity measure over the other. However, it is also necessary to consider how accurately the ABS measures non-market productivity and thereby overall productivity. We now turn to that discussion.
How does the ABS measure productivity growth in the non-market sector?
Labour productivityFootnote 1 is a measure of the amount of output per unit of labour. Generally, the unit of labour chosen is hours worked. So, productivity is the average output for an hour worked. That figure is rarely calculated because it is the increase over time that is of most interest. Over time, there is a general tendency for output per hour worked to increase.
Over the period covered in Figure 1, productivity in the market sector was 1.7% per annum but 1.2% for GDP as a whole. However, the non-market sector is almost completely dominated by service industries in which productivity is notoriously difficult to measure. That raises the issue of exactly how to accurately measure non-market output as a prelude to estimating productivity measures. According to the ABS
The approach to estimating non-market output for individually consumed non-market services is cost-weighted directly observed output (such as number of full-time equivalent student enrolments and number of hospital separations). While directly observed output measures provide superior output indicators to the cost-of-service delivery approach, the latter approach is still used extensively for collectively consumed services such as public administration and safety (ABS 2020).
In some areas, we have some quantification of that which can be measured (enrolments and hospital separations), however inadequate they may seem. The rest is simply measuring output by the value of inputs. To further illustrate the problem: if the number of nurses per bed goes down, is that an increase in hospital productivity or a decline in service quality? If the number of students per teacher goes down, is educational productivity lower or educational quality higher? When the value of output is simply measured as the value of the inputs, it means productivity over time will appear to have near zero growth. For much of the non-market sector, costs are used as a measure of output, which inevitably biases measured productivity growth towards zero. In other cases, measurable indicators are used, such as hospital separations, that are likely to be very poor indicators of the output. Indeed, it is unlikely that even in principle there would be agreement about what should be measured, let alone how it should be measured. These considerations throw doubt on the legitimacy of adding market and non-market sectors together in one summary statistic.
Some of the Productivity Commission’s (2025a) own work has delved more closely into non-market sector productivity. It admits quality is not captured in traditional approaches to measuring non-market sector productivity when, for example, estimates are based on the sort of physical measures mentioned above. Ordinary measures give estimates that multifactor productivity in the hospital sector grew, on average, by just 0.1% per year in the decade to 2018–19. But now it says the quality of some care and associated patient outcomes has improved significantly. When it could adjust for quality, it found productivity growth for the healthcare sector grew by about 3% per year between 2011-12 and the present, and that was much higher than the rest of the economy. As part of that, the Productivity Commission points out that cancer treatments were far more effective in 2024 than in 1995.
The most recent data are shown in Figure 1 as the downward 3.5% movement from 2021–22 with some small reversal since 2022–23. Since 2022–23, productivity in the market sector improved 1.1%, while productivity for the economy as a whole was unchanged. It is hard to believe that non-market workers suddenly became significantly worse at their jobs. Nevertheless, some recent figures have raised comments. Journalist John Kehoe (Reference Kehoe2024) wrote
As a result of all of this, economic growth slowed to just 0.8% through the year to September, and in per-person terms the economy has been shrinking for almost two years after adjusting for population growth. It is the most prolonged downturn since the 1991 recession. A better measure of living standards – disposable income per person – is 10.5% below its peak (Kehoe Reference Kehoe2024).
Importantly, disposable income per person includes income from all sources and deducts taxes paid as well as interest expenses. Productivity differences are just one factor contributing to the 10.5% figure. At least as important as productivity has been the large increase in interest charges on mortgages and personal credit. Nevertheless, the sudden fall in labour productivity raises some doubts about how good the measurements might be.
Another feature of the debate is the argument, implicit in a lot of discussion, that cutting back government spending by a few percentage points and letting the market sector expand by the same amount would generate a higher path of future productivity growth and so must necessarily be good. This is an assumption that the two approaches equally enhance living standards, making it preferable to opt for the one with the better prospects for productivity growth. That is a big assumption and, it would seem, one that none of the critics of government appear willing to make explicitly.
Before leaving this section, it is important to note that productivity has been lagging in other sectors of the economy. Finance and insurance have been flat since about 2012–13. Mining productivity has trended downwards since the early 2000s with an overall 22% decline from 2001–02 through to 2023–24.Footnote 2 Commentators seem reluctant to discuss these sectors as dragging down living standards. But the most important implication of this section is that we can have very little confidence in the productivity estimates for the non-market sector.
The counterargument: We have been here before
Obviously, if productivity growth is lower in the non-market sector, aggregate productivity growth will be lower than market sector productivity growth. But does this mean lower improvements in living standards than would otherwise occur? This question was the subject of a debate in the pages of the Australian Bulletin of Labour in the early/mid 1970s, to which we now turn. This argument was, and still is, very important when discussing national wage questions.
The answer is that we effectively define living standards as people’s command over goods and services produced in the market sector. As a result, productivity in the non-market sector is not relevant for these purposes.Footnote 3 We need only look at productivity in the market sector.
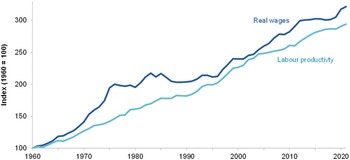
Obviously, given earlier comments, we know living standards entail more than market purchases. But that is not normally the point at issue. Rather, whenever people want to know whether living standards have changed, they use some measure of wages and adjust for what has happened to prices. So, a typical argument about real wage questions will look at the ABS wage price index (WPI) (ABS 2025c) and adjust it for any movements in the consumer price index (CPI) (ABS 2025b). For example, the Productivity Commission insists that productivity is the source of increases in real wages over time, saying, ‘In the long run, growth in real wages is driven almost entirely driven by labour productivity growth’ (Productivity Commission 2023, 1). The empirical evidence for that is given in a graph which shows a rough correlation between real wages and labour productivity going back to 1960. That graph is reproduced here as Figure 2.
Productivity Commission, Wages and productivity, 1960–2021, 1960 = 100.
Source: Brennan (Reference Brennan2022).

The data in Figure 2 shows that the association between wages and productivity is actually quite loose, especially given that both series trend upwards over time. The important thing is that the Productivity Commission’s measure of real wages is WPI or similar, adjusted for the consumer prices.Footnote 4
There is another useful example of how we deflate incomes to look at living standards. The International Monetary Fund and other international organisations use a standard basket of goods and services at market prices and work out how much it costs to purchase that same basket across countries. That then provides a means of comparing living standards by looking at how much income per person different countries have when their own currencies are deflated by the cost of buying the standard basket of goods and services (Callen Reference Callenn.d.). We now return to the main argument.
In the mid-1970s, John Neville (Reference Nevile1975) argued that previous measurements of productivity by Australian economists were wrong in the context of wage fixing by the Australian Conciliation and Arbitration Commission (ACAC).Footnote 5 At this time, wages were mostly determined centrally by the ACAC. There was general consensus among economists that these wage increases would be neither inflationary nor deflationary if wages were to increase at the same rate as prices plus productivity increases. The question at issue was the appropriate measure of productivity.
Nevile pointed to prior discussions and said the error by most contributors consisted of using measures of productivity growth derived from national accounts, which includes estimates for the production of goods and services that are not sold on the market. Most of the goods and services produced by the government are paid for from consolidated revenue and provided free. While we can discuss the way in which the productivity growth of the government sector is measured, this is not the central point. Rather, goods and services not bought and sold on the market are irrelevant for present purposes.
Nevile’s argument generated an exchange in the Australian Bulletin of Labour (Nevile Reference Nevile1976 and Whitehead Reference Whitehead1975). Nevile’s hypothetical example is set out in Table 1 with minor extensions. In the table, we use Nevile’s assumption of productivity growth in the private sector, which goes from an output of 100 to 400 with the same workforce. That means that, with employment of 200 in the private sector and a wage of $100, the output is $30,000 in year 1 and jumps to $120,000 in year 2 if wages match productivity and increase to $400. The government sector is assumed to have no productivity growth. It is further assumed that demand matches output, so there is no imbalance that would generate changes in the economy. We add another assumption: that workers spend all they earn (after tax) and businesses invest all they get (after-tax profit). Implicitly in the hypothetical economy, the value of a unit of production in the private sector is $1.50.Footnote 6
Hypothetical economy before and after productivity improvement with appropriate wage adjustments

We also have a balanced budget in which the government spends exactly what it raises in taxes. Output equals value added. Table 1 shows what happens when the wage increases from $100 in year 1 to $400 in year 2 to keep up with productivity in the private sector.
Nevile’s original contribution was to show that by increasing real wages in line with productivity just in the private sector, equilibrium would be stabilised with a constant share of income going between capital and labour. Demand would continue to equal output, and the budget would remain balanced. Most importantly, the adjustment would be consistent with price stability. In the context of ongoing inflation, we can say an adjustment for private sector productivity would not add to inflationary pressures.
Suppose wages are increased to $300 instead of $400 as would be implied by setting real wages against productivity for the economy as a whole and the market and non-market sectors. Under the assumptions spelt out, consumption would fall to $67,500, which implies a demand of 55,000 units from the private sector and an unsold production of 25,000 units. The latter is unsustainable and would result in a large contraction in the private sector.
The crux of Nevile’s argument is that we use an index of market prices when determining real incomes, and so it is purchases of market goods and services alone that should be relevant in calculating levels of, or changes in, living standards. Not only is this a good principle for setting wages, but it is also consistent with not adding to or subtracting from the level of stimulus already in the economy. It is consistent with maintaining macroeconomic balance.
To put Nevile’s argument in a simple example: suppose the private sector has 75% of the economy and 75% of the workforce. But the private sector sells to 100% of the workforce. The difference between what the private sector sells and what its own workforce buys is the 25% of output which is purchased by the government workers. Suppose also that output growth per unit of input in the private sector is measurable but assumed to be zero in the non-market sector.
Now, suppose productivity grows by 10% in the market sector over a number of years. Overall productivity rises by 7.5%. If wages go up by that amount, then purchases from the market sector would go up by 7.5%. But production is up 10% in the private sector, meaning output would go unsold, and that could trigger a downturn. However, if all wages increase by 10%, balance is restored. As the table makes clear, indexing wages for market sector prices restores balance – not only in the supply and demand for output but also in the wage profit share, the budget balance, the market non-market balance, and so on. It also affects our ability to obtain goods and services via the non-market sector. If private sector productivity goes up and taxation capacity increases, the number of nurses and teachers can also be increased, improving living standards. As outlined above, this would then have an effect on non-market sector ‘productivity’.
The table does not show how taxes are raised in this model, but it is worth noting here that with full indexation of non-market wages, the non-market share of national income would be constant. In that case, and if taxes are a constant share of national income, tax revenue will increase in proportion to national income, meaning the non-market or government budget balance will be unchanged as a proportion of national income. If instead taxes are progressive, then the budget balance would increase, potentially making room for additional non-market expenditures.
While Nevile’s argument was put in the context of national wage determinations, the same considerations go into whether we think living standards are rising or not. Generally, the measures of real magnitudes we use suggest that whether or not we are well off is based on the extent that we can purchase goods and services in the market. The difficulty in measuring non-market sector output means it is meaningful only to talk about living standards as the extent to which we can purchase goods and services in the market. Obviously, output from the non-market sector contributes to our well-being. However, our measures relate to command over market goods and services, while the benefits received from the non-market sector defy accurate and meaningful measurement. Incidentally, the Fair Work Commission still uses references to the market sector in making its decisions. In its latest annual wage review, it says, ‘In the market sector, there has been modest growth in labour productivity over the current multi-year cycle, which indicates some capacity for business to pay for a modest increase in real minimum wages’ (Fair Work Commission Reference Commission2025, 8). It explicitly says ‘it is necessary to differentiate between productivity growth in the market and non-market sectors’ (Fair Work Commission Reference Commission2025, 18).
We can also express some of the above arguments algebraically. Let expenditure E = N + M, where N is non-market activity and M is market activity and where M = C + I, being consumption, C, plus investment, I. It is assumed the non-market sector does not consume or invest but may provide government services and the like. There is no international trade.
On the income side of the national accounts, we have income, Y, equal to W + Π, where W is wages, and Π is profit. All profit is generated in the market sector, but wages are paid in both the non-market and market sectors, which we identify with the subscripts n and m, respectively, Wn and Wm.
We can now write
-
1. E = N + C + I, and
-
2. Y = Wn + Wm + Π
Suppose now productivity in the market sector is p, and there is no productivity growth in the non-market sector; then capacity, Ω, can be written as
-
3. Ω+1 = N + C.(1 + p) + I.(1 + p) using the subscript ‘+1’ to denote the time period following the productivity increase.
Using the classical assumption that all wages are spent, then C = Wn + Wm. For convenience, assume that all investment capacity is matched by demand. If all wages are increased in proportion to the productivity gains in the market sector, then, following the increase in wages, consumption demand will be
-
4. C+1 = (Wn + Wm).(1 + p), and expenditure will be given by
-
5. E+1 = N+1 + (Wn + Wm).(1 + p) + I.(1 + p), from which it can be readily confirmed that Ω+1 = E+1, so there is no excess capacity.
Now suppose instead wages in both the market and non-market sectors increase by the nation’s total productivity growth of αp, where α is the output share of the market sector. Now we would have total consumption equal to (Wn + Wm).(1 + αp). We also have an output gap, capacity minus expenditure, in the market sector:
-
6. Ω+1 – E+1 = (Wn + Wm).(1–α).p
This is the point Nevile was making. To maintain balance in the economy as a whole and to avoid excess capacity, it was necessary that all wages be adjusted for productivity improvements in the market sector. If there is excess capacity, or equivalently, a shortage of demand, then business will contract, investment will be reduced, and unemployment will rise.
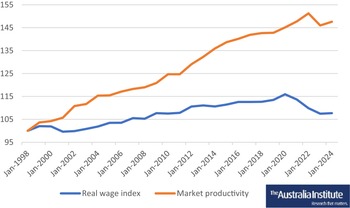
Incidentally, Figure 2 seems to suggest that real wages outpaced productivity from about the late 1990s or 2000. ABS figures do not necessarily confirm that and, indeed, show quite the opposite. In Figure 3, labour productivity per hour worked is compared with real wages. The latter are based on the wage index and the CPI. Wages and prices are based on the June quarter figures in each year. Our beginning point is dictated by the WPI, which started in September 1997.

Figure 3 shows unambiguously that real wages have fallen dramatically behind market sector productivity, which is the appropriate measure for wage-setting purposes. Kehoe (Reference Kehoe2024) puts the poor performance of the private sector down to its being squeezed by the government sector. Our analysis suggests that it may also have to do with living standards failing to keep up with market sector productivity, which reduces demand for the output of the market sector.
Conclusion
Low productivity growth in the non-market sector makes us worse off – or does it? No one is interested in productivity for its own sake. The interest is in the implications for living standards and, in practice, such things as wage fixing. Those who make such claims conflate the measurement of productivity in the economy as a whole with living standards. The conventional measures of real incomes use a particular income deflated by consumer prices. The incomes may be income per capita, a particular wage or wage index, or non-wage incomes, among other possibilities. That gives empirical content to a notion that one’s living standards refer to one’s ability to purchase goods and services. The upshot is that over time the increase in living standards (the command over market goods and services) on average should reflect productivity in the market sector alone.
This argument is very important when discussing principles for national wage setting. That is perhaps the most important practical application of productivity measures. In that context, John Nevile’s argument in earlier debates showed that wage determination using market sector productivity is the appropriate measure and is consistent with preserving macroeconomic balance. This is important, as it is not just that the use of productivity in the market sector implies a logical consistency when discussing real incomes. Market sector productivity increases need to be incorporated in wage increases so that wage movements are consistent with macroeconomic balance. The failure of real wages to keep up with productivity is likely to generate imbalances.
Our main conclusion is that the argument that slow productivity growth in the non-market sector is acting as a drag on living standards is the wrong perspective. Obviously, we all have an interest in knowing our public health system can fix our ailments. However, when it comes to living standards, we are primarily talking about purchasing power over market goods and services, and the appropriate measure for that is our incomes deflated by the CPI. This is not ideal, and for many purposes, it would be useful to have a measure that combines the market and non-market contributions to welfare. But for now, and for practical purposes, when discussing wages and productivity, it is the market productivity that is important.
To qualify for the services provided by the non-market sector, you usually do not need money; you receive the services if you meet certain criteria. To receive education services, you must be a certain age; you have to have qualified by success or participation in earlier grades, and so on. Eligibility for cancer treatments is primarily based on diagnosis and health condition, rather than finances. Rules are just different for access to the non-market sector. So, while an increase in efficiency in the non-market sector would be a good thing, it would not affect workers’ purchasing power over goods and services in the market.
This is very important. Access to non-market sector goods and services is important, often critically important, to our well-being, but non-market sector performance is usually irrelevant to our usual measure of living standards, which involves purchasing power. For that reason, when considering the real value of wages and how they relate to productivity, it is the productivity in the market sector we should be using. We should not be using measures that include the non-market sector. We might refer to this as the ‘Nevile principle’. The industrial relations system has changed significantly since Nevile’s paper was used by the ACTU in 1975. Yet it would seem Nevile’s arguments are still relevant for the annual wage reviews, which involve cash payments for workers and have little or nothing to do with access to non-market services. We might even refer to the ‘Nevile principle’ as the presumption that real wages should be adjusted for productivity increases in the market sector.
The other conclusion is that most attempts to examine living standards use measures such as GDP per capita divided by some price deflator. The latter is invariably the cost of a bundle of goods and services available in the market of the country concerned. These can only ever be partial indicators since they miss those things that national accounts do not measure, such as environmental issues, as well as the emphasis of this paper, the role of the non-market sector.
Funding statement
No external funding was received.
Competing interests
The author declares none.
David Richardson is employed by the Australia Institute.


 Open access

