


Introduction
Adolescence is a developmental period marked by profound changes within individuals and their social contexts, during which the need for social belonging becomes particularly salient. Peer and romantic relationships gain importance, and parental bonds are renegotiated, while social networks are often still unstable, leaving adolescents particularly vulnerable to feelings of loneliness (Dahl et al., Reference Dahl, Allen, Wilbrecht and Suleiman2018; Tomova et al., Reference Tomova, Andrews and Blakemore2021) – a subjective sense that one’s social connections fall short of personal needs (Hawkley & Cacioppo, Reference Hawkley and Cacioppo2010). Loneliness is a common experience during adolescence with 20.9% of 13–17-year-olds reporting feeling lonely (World Health Organization, 2025). Loneliness is associated with negative outcomes such as mental health problems, risky behaviors, disability, and education and employment difficulties in later life (Goosby et al., Reference Goosby, Bellatorre, Walsemann and Cheadle2013; Jefferson et al., Reference Jefferson, Barreto, Verity and Qualter2023; Matthews et al., Reference Matthews, Qualter, Bryan, Caspi, Danese, Moffitt, Odgers, Strange and Arseneault2023; Schinka et al., Reference Schinka, Van Dulmen, Mata, Bossarte and Swahn2013; Von Soest et al., Reference Von Soest, Luhmann and Gerstorf2020). Both dispositional and contextual factors shape adolescents’ susceptibility to loneliness (Buecker et al., Reference Buecker, Maes, Denissen and Luhmann2020b; Shrestha et al., Reference Shrestha, Sigdel, Pokharel and Columbus2025; Van Roekel et al., Reference Van Roekel, Scholte, Engels, Goossens and Verhagen2014). Maladaptive personality traits, such as Detachment and Negative Affectivity, may bias social perception and behavior, undermining relationship quality and heightening loneliness. At the same time, situational factors, particularly the presence and quality of social interactions, determine when loneliness emerges and how it fluctuates in daily life.
Adolescence as a developmental period of social vulnerability
Adolescence is marked by rapid biological, physiological, and socioemotional changes (Dahl et al., Reference Dahl, Allen, Wilbrecht and Suleiman2018; Kaurin et al., Reference Kaurin, Do, Ladouceur, Silk and Wright2023; Maciejewski et al., Reference Maciejewski, van Lier, Branje, Meeus and Koot2015). As youth face major environmental changes, adaptations to new social contexts, roles, and responsibilities become a central challenge of puberty (Dahl et al., Reference Dahl, Allen, Wilbrecht and Suleiman2018; Tomova et al., Reference Tomova, Andrews and Blakemore2021). These changes coincide with a heightened need for social belonging and acceptance, often prompting a shift of focus from family to peers (Blakemore & Mills, Reference Blakemore and Mills2014; Dahl et al., Reference Dahl, Allen, Wilbrecht and Suleiman2018). While parental bonds remain important during puberty (Kerr et al., Reference Kerr, Stattin, Biesecker, Ferrer-Wreder, Lerner, Easterbrooks and Mistry2003), they are marked by increasing conflicts, as autonomy needs are renegotiated against parental authority and responsibility (Branje, Reference Branje2018). Adolescents often withdraw from their parental relationships while still forming their identities and not being fully integrated into stable peer groups, leaving social needs potentially unmet and heightening the risk of social isolation – a perceived mismatch between desired and achieved social relations (Cacioppo et al., Reference Cacioppo, Cacioppo, Cole, Capitanio, Goossens and Boomsma2015; Goossens, Reference Goossens2018; Laursen & Hartl, Reference Laursen and Hartl2013). During adolescence, peer relationships take on greater importance, and youth become increasingly attuned to their social environment, making them particularly sensitive to exclusion and rejection from their peers (Tomova et al., Reference Tomova, Andrews and Blakemore2021). Moreover, adolescents tend to feel lonelier when they are alone than when they are with others (Van Roekel et al., Reference Van Roekel, Scholte, Engels, Goossens and Verhagen2014, Reference Van Roekel, Verhagen, Engels, Scholte, Cacioppo and Cacioppo2016). However, loneliness can arise as well in the presence of others, with its intensity varying according to the closeness of social ties (Van Roekel et al., Reference Van Roekel, Scholte, Engels, Goossens and Verhagen2014, Reference Van Roekel, Verhagen, Engels, Scholte, Cacioppo and Cacioppo2016). For example, adolescents felt loneliest in the presence of weaker social ties, such as classmates, compared to stronger social ties, such as friends or family (Van Roekel et al., Reference Van Roekel, Scholte, Engels, Goossens and Verhagen2014). School, similar to work or university, represents an involuntary context where adolescents spent substantial time with potentially lower-quality social contacts, including peers they dislike or fear being rejected by (Van Roekel et al., Reference Van Roekel, Scholte, Engels, Goossens and Verhagen2014). These findings underline that the subjective evaluation of a social interaction plays a crucial role in the emergence of loneliness (Lodder et al., Reference Lodder, Scholte, Goossens and Verhagen2017). These dynamics may help explain why loneliness is highly prevalent in this age group (World Health Organization, 2025) and rising from age 13 into the mid-20s (Von Soest et al., Reference Von Soest, Luhmann and Gerstorf2020).
Personality-related vulnerability to loneliness
The threshold at which loneliness emerges varies between individuals. The differential reactivity hypothesis states that individuals vary systemically in how they respond to social situations. Lonely individuals do not encounter more or different social stressors than less lonely individuals but react more strongly to these stressors (Cacioppo et al., Reference Cacioppo, Hawkley and Berntson2003). A broader interpretation of the differential reactivity hypothesis (Van Roekel et al., Reference Van Roekel, Verhagen, Engels, Scholte, Cacioppo and Cacioppo2016) proposes that people differ in their responsiveness to social situations, in part due to personality factors (Shrestha et al., Reference Shrestha, Sigdel, Pokharel and Columbus2025). Such differences may reflect preferences for certain types of social interactions (Cacioppo et al., Reference Cacioppo, Hawkley, Norman and Berntson2011; Mellor et al., Reference Mellor, Stokes, Firth, Hayashi and Cummins2008) or the attitude toward aloneness (Danneel et al., Reference Danneel, Maes, Vanhalst, Bijttebier and Goossens2018; Rodriguez et al., Reference Rodriguez, Schertz and Kross2025; Teppers et al., Reference Teppers, Klimstra, van Damme, Luyckx, Vanhalst and Goossens2013). Applying this framework to adolescence – a developmental period marked by heightened social sensitivity – suggests that personality traits may contribute not only to overall loneliness but also to its variability. Accordingly, the present study examines both average levels and within-person variability of loneliness in daily life and investigates whether personality traits are associated with differential reactivity to social situations.
In line with this theoretical framework, personality traits such as the Big Five are consistently linked to loneliness. Neuroticism, for instance, predicts both trait and state loneliness and greater variability of loneliness (Buecker et al., Reference Buecker, Maes, Denissen and Luhmann2020b; Shrestha et al., Reference Shrestha, Sigdel, Pokharel and Columbus2025; Terracciano et al., Reference Terracciano, Luchetti, Karakose, Milad, Zavala, Kekäläinen, Stephan, Hajek and Sutin2025) and is also strongly associated with personality disorders (PDs; Saulsman & Page, Reference Saulsman and Page2004). While most research has focused on normative personality traits, loneliness can also be viewed along a broader personality continuum, extending toward maladaptive traits and personality pathology (Reinhard et al., Reference Reinhard, Nenov-Matt and Padberg2022; Saulsman & Page, Reference Saulsman and Page2004). For example, PD symptom severity has been linked to loneliness (Reinhard et al., Reference Reinhard, Nenov-Matt and Padberg2022), possibly due to lower social satisfaction (Stepp et al., Reference Stepp, Pilkonis, Yaggi, Morse and Feske2009; Wilson et al., Reference Wilson, Elkins, Bair, Oleynick, Malone, McGue and Iacono2018). Individuals with PDs may therefore experience pronounced loneliness even in the presence of others, although the precise interplay requires further understanding (Reinhard et al., Reference Reinhard, Nenov-Matt and Padberg2022), and particularly so in youth.
Fluctuations in PD symptoms – which can vary substantially from day to day (Wright & Simms, Reference Wright and Simms2016) and affect interpersonal functioning (Kaurin et al., Reference Kaurin, Do, Ladouceur, Silk and Wright2023) – may heighten vulnerability to both elevated and more variable loneliness. Conceivably, this vulnerability is likely to be intensified in adolescence, a transitional stage already characterized by mood variability (Toenders et al., Reference Toenders, van der Cruijsen, Runze, van de Groep, Wierenga and Crone2024).
Maladaptive personality traits and loneliness
The onset of PDs often occurs during adolescence (De Clercq & De Fruyt, Reference De Clercq and De Fruyt2007; Oldham, Reference Oldham2019). The Alternative DSM-5 Model for Personality Disorders (AMPD; American Psychiatric Association, 2013; Suzuki et al., Reference Suzuki, Samuel, Pahlen and Krueger2015; van Dijk et al., Reference van Dijk, Krueger and Laceulle2021) suggests a dimensional assessment of PDs aiming to overcome limitations of categorical diagnoses, such as overlaps with other PDs. Within the AMPD, PDs are primarily defined by impairments in personality functioning and the expression of pathological personality traits, organized into the five domains: Negative Affect, Detachment, Antagonism, Disinhibition, and Psychoticism. Similarly, the ICD-11 moved away from categorical PD diagnoses introducing a dimensional framework that assesses PD severity (Swales, Reference Swales2022). In contrast to the AMPD, the ICD-11 uses the Anankastia domain instead of the Psychoticism domain. Dimensional assessments of PDs, such as maladaptive personality traits, provide greater diagnostic accuracy for distinguishing individuals with and without PDs (Pires et al., Reference Pires, Henriques-Calado, Sousa Ferreira, Bach, Paulino, Gama Marques, Ribeiro Moreira, Grácio and Gonçalves2021) and are particularly suited to adolescents, who may not yet show the full spectrum of categorical PD symptoms and higher fluctuations of those (Kaurin et al., Reference Kaurin, Do, Ladouceur, Silk and Wright2023). Early PD symptoms predict adverse adult outcomes – functional, academic, occupational, and relational (Jørgensen et al., Reference Jørgensen, Møller, Bo, Kongerslev, Hastrup, Chanen, Storebø, Poulsen, Beck and Simonsen2024; Winograd et al., Reference Winograd, Cohen and Chen2008), underscoring the need for early identification. Research on maladaptive personality traits and loneliness in daily life is scarce and yields mixed results.
Adolescents with elevated maladaptive personality traits must navigate not only the challenges linked to substantial developmental changes of puberty but also the interpersonal difficulties associated with these traits which can impede the development of stable social relationships. Understanding how maladaptive personality traits relate to loneliness across social contexts is central for the development of early, targeted interventions that address loneliness to mitigate common mental health challenges in adolescence and their long-term consequences. To capture the full spectrum of personality pathology symptoms, we assess pathological personality traits of the AMPD (American Psychiatric Association, 2013) and ICD-11 (World Health Organization, 2019), resulting in six domains. Understanding loneliness and its variability in adolescence, especially when linked to maladaptive personality traits, calls for fine-grained, longitudinal methods such as EMA, given the pronounced psychosocial fluctuations of this life stage. EMA enables the repeated, real-time measurement of emotional states, feelings of connectedness, interpersonal behaviors, and contextual influences, offering high ecological validity (Kaurin et al., Reference Kaurin, Do, Ladouceur, Silk and Wright2023; Maciejewski et al., Reference Maciejewski, van Lier, Branje, Meeus and Koot2015).
The present study
Adolescence represents a period of heightened vulnerability to both elevated and fluctuating feelings of loneliness, particularly in the presence of maladaptive personality traits. Building on this evidence, the present study examines how personality traits shape adolescents’ reactivity to changing social contexts, influencing both mean levels and within-person variability of loneliness.
This research extends prior work on individual differences by incorporating the complex within-person dynamics of loneliness that vary across social situations (Mund et al., Reference Mund, Maurer, Jeronimus and Buecker2025). Previous research suggests that both dispositional and contextual factors shape adolescents’ experiences of loneliness. For example, Shrestha et al. (Reference Shrestha, Sigdel, Pokharel and Columbus2025) demonstrated that personality traits, such as Neuroticism, influence the intensity and variability of loneliness in the daily life, whereas Van Roekel et al. (Reference Van Roekel, Scholte, Engels, Goossens and Verhagen2014) showed that social contexts play a crucial role in shaping daily feelings of loneliness. Building on these findings, the present EMA study integrates both perspectives by examining how maladaptive personality traits relate to loneliness and whether they moderate the link between different social contexts (e.g., being alone vs. with others, type of company) and loneliness in the daily lives of adolescents.
The present preregistered study integrates these perspectives by examining how loneliness varies across social contexts and timescales and how maladaptive personality traits moderate these associations. Using a 14-day Ecological Momentary Assessment (EMA) study with seven prompts and one end-of-day survey among adolescents aged 12– 21 years (Mage = 17.5, SD = 2.64), we capture momentary and daily loneliness, its variability, and links to maladaptive personality traits. By combining within-person processes and between-person differences, this study advances our understanding of the dynamic interplay between maladaptive personality traits and loneliness during a critical period of socio-emotional development.
Preregistered Hypotheses. In a first set of preregistered hypotheses, we expected that, at the within-person level, participants would report greater momentary loneliness when alone than when in social company (H1a), and that this pattern would be mirrored at the daily level, with more time spent alone predicting higher end-of-day loneliness (H1b). We further expected that loneliness in social contexts would vary by type of company (family, friends, partner, classmates/fellow students/colleagues; H1d). At the between-person level, we hypothesized that youth who more frequently reported being alone would also show higher average levels of loneliness overall (H1c). In our second set, we examined between-person effects of maladaptive personality traits, predicting that higher levels of maladaptive personality traits would be associated with elevated and more variable momentary loneliness (H2a–H2b) as well as elevated and more variable levels of end-of-day loneliness (H2c–H2d). In Set 3, we extend H1a–H1c by testing cross-level moderations, hypothesizing that maladaptive personality traits would amplify the within-person association between being alone and loneliness on a momentary (H3a) and a daily level (H3b), and that higher maladaptive personality traits would strengthen the between-person association between being more often alone and higher overall loneliness (H3c). To probe robustness and explore trait-and timescale-specific effects, we conducted several sensitivity analyses. Finally, exploratory analyses examined a potential mediating role of social satisfaction – as an operationalization for the quality of social relationships – via the association between being alone and loneliness.
Method
All study procedures were approved by the Institutional Review Board of the University of Wuppertal (SK/AE 230616).
Data collection
Data is derived from the READY study (full study protocol and preregistration: https://osf.io/7a8yf/). After an introductory session with a close person (peer or legal guardian, depending on participants’ age) and completion of baseline self-and informant reports, participants began the 14-day signal contingent EMA protocol. The EMA protocol consisted of seven (six on Sundays) momentary assessments and one evening assessment with questions about the day. Participants were recruited via schools, inpatient and outpatient clinics, sports clubs, and social psychiatric centers in Wuppertal, Germany, and nearby areas. To enhance compliance, participants were contacted twice during their participation (via telephone or email) and could receive up to 125€ compensation, depending on their response rate.
Sample
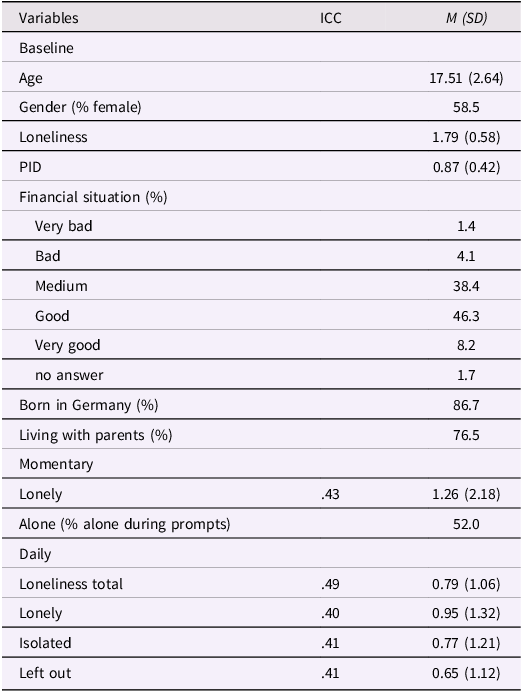
The total number of participants in our study is N = 294 (i.e., Level 2 units). Thus, based on a 14-day EMA protocol with six (Sundays) or seven (other days) prompts and one end-of-day, the maximum number of daily assessments in our sample is N = 32,340 (i.e., Level 1 units). Participants responded to 27,503 of the 32,340 scheduled prompts on the item assessing whether they were alone or with others, yielding an average response rate of 85.1%. Of these completed prompts, 14,313 indicated that participants were alone, and 13,190 indicated they were with others. Multilevel analyses were based on a larger set of prompt-level observations (N = 29,984), as models were estimated using full information maximum likelihood (FIML), which incorporates all available data and handles missing values at the variable level, allowing prompts with missing responses on this item to contribute when other variables were observed. For an overview of the descriptives see Table 1. Participants were aged 12– 21 years old (M = 17.51, SD = 2.64), with 58.5% identifying as female. Only one person did not provide gender information. Most participants rated their financial situation as good (46.26%), were born in Germany (86.73%), and lived with their parents (76.53%). For an overview of average levels of momentary loneliness by different age groups see Figure S1 in the Supplement. For further descriptive details (e.g., PID-5 and single domain level means) see Kaurin et al. (Reference Kaurin, Krakau, Wicher, Philippi and Shiner2025).
Descriptive information for key study variables

Table 1 Long description
A table summarizing descriptive information for key study variables. The table has 2 columns and 18 rows. The columns are labeled Variables and ICC M (SD). The rows are labeled as follows: Baseline, Age, Gender (percent female), Loneliness, PID, Financial situation (percent), Very bad, Bad, Medium, Good, Very good, no answer, Born in Germany (percent), Living with parents (percent), Momentary, Lonely, Alone (percent alone during prompts), Daily, Loneliness total, Lonely, Isolated, Left out. The values for each row are as follows: Age: 17.51 (2.64), Gender (percent female): 58.5, Loneliness: 1.79 (0.58), PID: 0.87 (0.42), Financial situation (percent): Very bad: 1.4, Bad: 4.1, Medium: 38.4, Good: 46.3, Very good: 8.2, no answer: 1.7, Born in Germany (percent): 86.7, Living with parents (percent): 76.5, Momentary: Lonely: 0.43, 1.26 (2.18), Alone (percent alone during prompts): 52.0, Daily: Loneliness total: 0.49, 0.79 (1.06), Lonely: 0.40, 0.95 (1.32), Isolated: 0.41, 0.77 (1.21), Left out: 0.41, 0.65 (1.12).
Note. N = 294 (between), N = 29,984 (within); PID = total score of maladaptive personality traits assessed via PID-5BF+.
Baseline measures
Maladaptive Personality Traits. Maladaptive traits were assessed with the German version of the Personality Inventory for DSM-5, Brief Form Plus (PID5BF+; Bach et al., Reference Bach, Kerber, Aluja, Bastiaens, Keeley, Claes, Fossati, Gutierrez, Oliveira, Pires, Riegel, Rolland, Roskam, Sellbom, Somma, Spanemberg, Strus, Thimm, Wright and Zimmermann2020). The 34-item inventory includes 17 facets that are assessed with two items each and combined into the six PID-5 domains: Negative Affect, Detachment, Antagonism, Disinhibition, Psychoticism, and Anankastia. Answers ranged on a 4-point Likert Scale from “Does not apply at all” (0) to “Applies exactly” (3). Assessment included self-report as well as an external rating by a close person (e.g., caregiver, peer, friend, sibling), resulting in a maximum score of 102 and a mean maximum score of 3. Internal consistency was good (α = 0.72–0.85), see Kaurin et al. (Reference Kaurin, Krakau, Wicher, Philippi and Shiner2025) for details.
Loneliness. Trait loneliness at baseline was assessed with the German version of the UCLA loneliness scale (Döring & Bortz, Reference Döring and Bortz1993). The 20-item measure comprises three dimensions of loneliness: feelings of loneliness, perceived emotional isolation, and perceived social isolation, with 10 items being revised items. Participants rate each item from “not at all true” (5) to “completely true” (1), resulting in a maximum score of 100 and a mean maximum score of 5. Reliability was excellent (α = 0.90).
Momentary measures
Loneliness. Experiences of loneliness were directly assessed via one item (“How lonely do you feel in the present moment?”). Participants could answer on a scale ranging from “not at all” (0) to “very much” (10).
Type of social company. Absence or presence of social company was assessed via the item “Who is with you?”. Answer selection included “Family members,” “Roommates,” “Partner,” “Friends,” Classmates/fellow students/colleagues,” “Person(s) on the internet,” “Other/unknown person(s),” “Nobody.”
Location. Current location was assessed via the item “Where are you?”. Answer selection included “At school/university/work,” “At home,” “At friends’ home,” “On the road (bus/train/car),” “Outside,” “Doing sports,” “On Vacation,” “At another location.”
Daily measures
Loneliness. End-of-day loneliness was captured with three items with one item asking directly targeting experiences of loneliness (“During the past 24 hours, how often did you feel lonely?”), and two items derived from the Revised UCLA Loneliness Scale (Russell et al., Reference Russell, Peplau and Cutrona1980; i.e., “During the past 24 hours, how often did you feel isolated?” UCLA-item 14; “During the past 24 hours, how often did you feel left out?”, UCLA-item 11). Participants could answer on a 5-point Likert Scale ranging from “Never” (0) to “Very often” (5).
Social satisfaction. End-of day satisfaction with social contact was assessed using the item “How satisfied were you with your social contact today?”. Participants responded on a scale ranging from “not at all” (0) to “very much” (10).
Full information on all measurements used in this study can be found elsewhere in a preregistered study information (https://osf.io/pqy7z).
Data analysis
Data wrangling and tests of moderations on between-person level (i.e., H3c) was conducted using R (version 4.3.3; R Core Team, 2024). To empirically test the preregistered hypotheses (https://osf.io/xptuv/), models were estimated in MPlus (Muthén & Muthén, Reference Muthén and Muthén2019) utilizing multilevel structural equation modeling (MSEM; Sadikaj et al., Reference Sadikaj, Wright, Dunkley, Zuroff, Moskowitz and Rauthmann2021). MSEM simultaneously models within-person (Level 1) and between-person (Level 2) variability, capturing both momentary fluctuations and stable individual differences. This approach models the complex relationships between the social context, loneliness, and maladaptive personality traits, testing both average levels and momentary deviations from each participant’s personal mean. In our analyses, the between-person model estimates associations among individual differences, akin to coefficients derived from cross-sectional designs (e.g., linking the amount of time spent alone to average loneliness). The within-person associations capture dynamic day-to-day coupling between variables, indicating whether fluctuations in loneliness may serve as a target for risk monitoring and therapy. Between-and within-person correlations (e.g., for Table 2) were computed simultaneously using MSEM.
Correlations among study variables at within-and between-person levels

Table 2 Long description
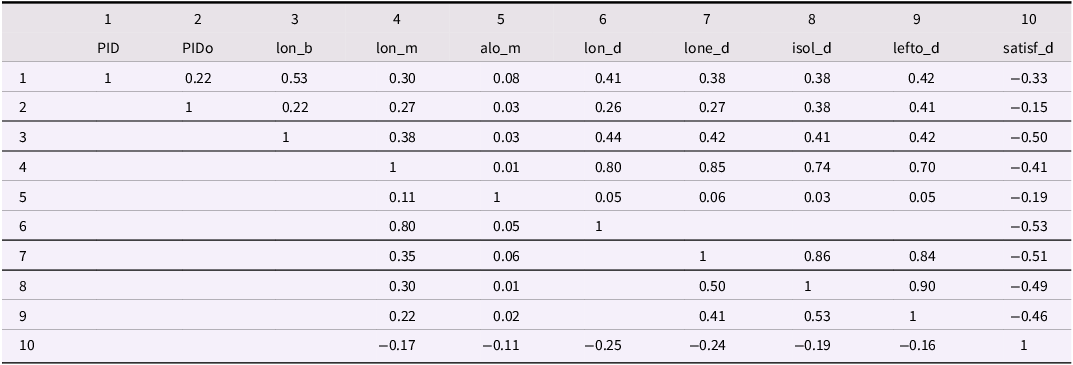
The table presents correlations among study variables at within-and between-person levels. It has 10 rows and 10 columns. The columns are labeled as PID, PIDo, lon_b, lon_m, alo_m, lon_d, lone_d, isol_d, lefto_d, and satisf_d. The rows are numbered from 1 to 10. Each cell contains a correlation value. Row 1: PID, 1; PIDo, 0.22; lon_b, 0.53; lon_m, 0.30; alo_m, 0.08; lon_d, 0.41; lone_d, 0.38; isol_d, 0.38; lefto_d, 0.42; satisf_d, -0.33. Row 2: PID, 2; PIDo, 0.22; lon_b, 0.22; lon_m, 0.27; alo_m, 0.03; lon_d, 0.26; lone_d, 0.27; isol_d, 0.38; lefto_d, 0.41; satisf_d, -0.15. Row 3: PID, 3; PIDo, 0.22; lon_b, 0.38; lon_m, 0.03; alo_m, 0.44; lon_d, 0.42; lone_d, 0.41; isol_d, 0.42; lefto_d, 0.42; satisf_d, -0.50. Row 4: PID, 4; PIDo, 0.01; lon_b, 0.80; lon_m, 0.80; alo_m, 0.85; lon_d, 0.74; lone_d, 0.70; isol_d, -0.41; lefto_d, -0.41; satisf_d, -0.41. Row 5: PID, 5; PIDo, 0.11; lon_b, 0.05; lon_m, 0.05; alo_m, 0.06; lon_d, 0.06; lone_d, 0.03; isol_d, 0.05; lefto_d, -0.19; satisf_d, -0.19. Row 6: PID, 6; PIDo, 0.80; lon_b, 0.05; lon_m, 1; alo_m, 0.06; lon_d, 1; lone_d, 0.86; isol_d, 0.84; lefto_d, -0.51; satisf_d, -0.51. Row 7: PID, 7; PIDo, 0.35; lon_b, 0.06; lon_m, 1; alo_m, 0.86; lon_d, 0.84; lone_d, -0.51; isol_d, -0.49; lefto_d, -0.46; satisf_d, -0.46. Row 8: PID, 8; PIDo, 0.30; lon_b, 0.01; lon_m, 0.50; alo_m, 1; lon_d, 0.90; lone_d, -0.49; isol_d, -0.46; lefto_d, -0.46; satisf_d, -0.46. Row 9: PID, 9; PIDo, 0.22; lon_b, 0.02; lon_m, 0.41; alo_m, 0.53; lon_d, 1; lone_d, -0.46; isol_d, -0.46; lefto_d, -0.46; satisf_d, -0.46. Row 10: PID, 10; PIDo, -0.17; lon_b, -0.11; lon_m, -0.25; alo_m, -0.24; lon_d, -0.19; lone_d, -0.16; isol_d, 1; lefto_d, -0.16; satisf_d, 1.
Note. N = 294 (between), N = 29,984 (within); PID = maladaptive personality traits assessed via PID-5BF+ (self-report); PIDo = maladaptive personality traits assessed via PID-5BF+ (informant-report); lon_b = baseline loneliness; lon_m = momentary loneliness; alo_m = momentary aloneness; lon_d = daily loneliness; lone_d = daily loneliness assessed via the items lonely; isol_d = daily loneliness assessed via the item isolated; lefto_d = daily loneliness assessed via the item left out; satisf_d = daily social satisfaction; values below the diagonal represent within-person coefficients, and values above the diagonal represent between-person coefficients. Values in bold are those for which the credibility interval did not contain zero.
MSEM further allows the estimation of random slopes (i.e., associations among momentary/daily variables that vary between individuals). The variability in those random slopes is understood as another between-person variable that may relate to additional between-person variables assessed outside the EMA protocol (here, dispositional assessments of maladaptive personality via the PID-5). This framework enables us to test whether momentary/daily deviations from a participant’s mean level of momentary/daily loneliness tend to co-occur with deviations in their momentary/daily social company, as well as their respective within-person associations are influenced by individual differences in maladaptive personality.
To assess the links between maladaptive personality traits and variability in loneliness experiences (across timescales), we regress individual differences in means and variances of momentarily assessed variables on PID-5 scales at the between-person level (e.g., Kaurin et al., Reference Kaurin, Do, Ladouceur, Silk and Wright2023). This approach, commonly referred to as a location (mean) – scale (variances) model in standard multilevel modeling literature, allows within-person residuals (i.e., each adolescent’s variability) to vary freely across individuals and become outcomes at the between-person level. Individual differences in residual variability are interpreted as differences in variability around each adolescent’s own mean over time, while individual differences in the random intercept reflect person-specific averages in momentarily assessed variables. Finally, these individual differences in means and variability were regressed on caregiver-and self-reported trait vulnerabilities, controlling for adolescents’ age.
Models were estimated in Mplus with Bayesian parameter estimation (Muthén & Muthén, Reference Muthén and Muthén2019). Missing data was assumed to be missing at random and accommodated using a Bayesian approach that uses all available data in estimation. It provides robust results regarding missing data with increasingly large samples (Asparouhov & Muthén, Reference Asparouhov and Muthén2010).
Covariates. At the between-person level, sex (0 = female; 1 = male; 2 = diverse; 3 = no answer; in the present study only 0, 1, and 3 were endorsed) and age (centered on mean age) were included as covariates. The variable indicating weekday or weekend were entered as within-person covariate.
Along with other parameters not reported in the tables (e.g., residual variances) full specifications and detailed output from all models will be uploaded at OSF (https://osf.io/63vbm/).
Tests of preregistered hypotheses
Maladaptive personality traits (Negative Affect, Detachment, Antagonism, Disinhibition, Psychoticism, Anankastia) were tested as a total score in Set 2 and 3. We expected a general positive association between loneliness and maladaptive personality.
Hypotheses Set 1. The dummy-coded variable momentary absence of social company was regressed on momentary (H1a) and end-of-day loneliness (H1b), calculated as the sum of the three single items assessing loneliness (Level 1). For H1c, average number of daily social company was correlated with mean momentary loneliness (Level 2). H1d examined differences in momentary loneliness by types of company (Level 1), with four individual models (family members, friends, partner, classmates/fellow students/colleagues).
Hypotheses Set 2. Average momentary (H2a) and end-of-day (H2c) loneliness were regressed on average levels of maladaptive personality traits (Level 2). Average momentary (H2b) and daily (H2d) variability of loneliness (i.e., mean deviation from individual loneliness mean) were regressed on maladaptive personality traits (Level 2).
Hypotheses Set 3. Maladaptive personality traits were added to the models as a moderator of the momentary and end-of-day within-person paths depicted in H1a (H3a) and H1b (H3b) and between-person paths depicted in H1c (H3c).
Sensitivity Analyses. We explored robustness and boundary conditions, including self-and informant-reported maladaptive personality traits and effects of the six individual PID-5 domains in separate models (Hypotheses Set 2, 3, and Exploratory Set B). As preregistered, we defined sensitivity analyses as additional analyses explicitly contrasting different operationalizations of loneliness (momentary vs. end-of-day, state vs. trait) to test whether substantive conclusions would change. Because momentary loneliness and end-of-day loneliness showed a very strong within-person association (r_within = 0.80, see Table 2), we concluded that such contrasts would be unlikely to provide additional insight into timescale-specific biases beyond the already reported parallel analyses. Similarly, mean momentary loneliness showed a significant moderate association with baseline UCLA loneliness (r_between = 0.38, see Table 2), indicating substantial overlap between state and trait loneliness at the between-person level. Therefore, preregistered sensitivity analyses contrasting mean state and trait loneliness were not conducted. Additionally, we tested whether results differed depending on the item assessed in the evening (lonely, left out, isolated; Hypotheses Set 2, 3 and Exploratory Set B).
Tests of exploratory analyses
We examined contexts (locations, type of company) associated with the highest loneliness and tested whether social satisfaction mediates the relationship between social company and end-of-day loneliness. For Exploratory Set A, we examined three pathways (Level 1): being alone and end-of-day loneliness (sc), being alone and end-of-day social satisfaction (sa), and end-of-day social satisfaction and end-of-day loneliness (sb). For Exploratory Set B, we regressed maladaptive personality traits (Level 2) on paths sc, sa and sb and tested whether maladaptive personality traits moderated the potential mediation of Exploratory Set A. Figure 1 provides a schematic overview of the mediation analyses depicted in Exploratory Set A and B.
Schematic overview of the model specifications for exploratory analyses set A and B. Note. All models controlled for age and sex at the between-person level and for weekday at the within-person level. Filled dots represent random effects. Observed daily variables are decomposed into between-(Subscript i) and within-(Subscript t) variance. PID-5 domains = maladaptive personality traits assessed via PID-5BF+.

Figure 1 Long description
A diagram representing the model specifications for exploratory analyses in adolescence. The diagram is divided into two exploratory sets, A and B, and two levels, Within-Person Level 1 and Between-Person Level 2. Exploratory Set A and Exploratory Set B are separated by a vertical line. Within each set, the diagram shows the relationships between being alone, satisfaction with social contact, and loneliness. In both sets, being alone is connected to satisfaction with social contact, which in turn is connected to loneliness. In Exploratory Set B, maladaptive personality traits assessed via PID-5BF+ are shown to influence satisfaction with social contact and loneliness. Filled dots represent random effects. The diagram indicates that all models control for age and sex at the between-person level and for weekday at the within-person level.
The preregistered code and results for all analyses can be found on the OSF (https://osf.io/63vbm/).
Results
Set 1: social context and loneliness at multiple timescales
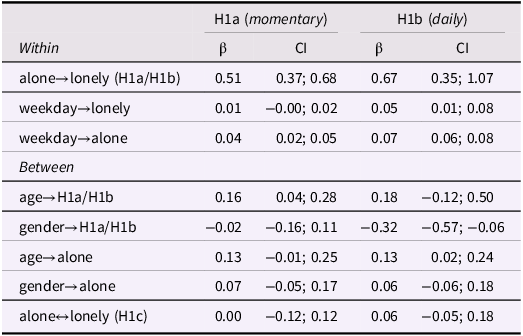
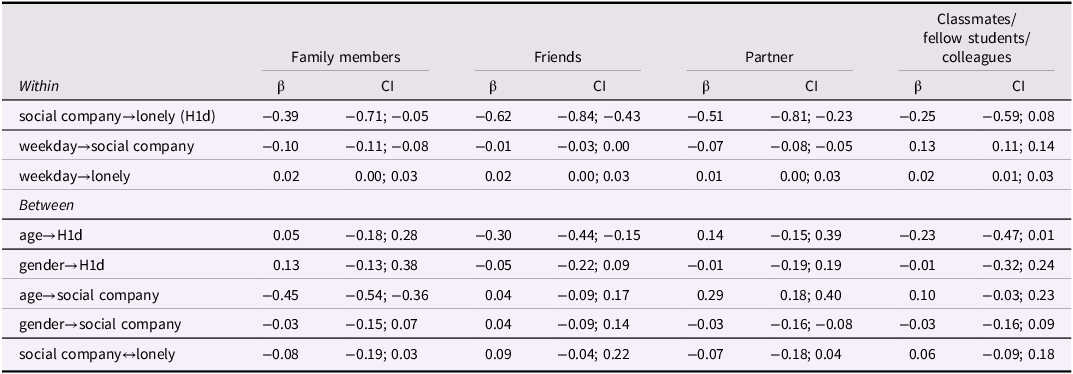
We found a significant link between being alone and loneliness, both at the momentary (H1a) and daily (H1b) level (see Table 3 for details). When participants were alone, they reported feeling lonelier momentary (β = 0.51) and daily (β = 0.67). Covariate weekday was positively associated with being alone, both momentary (β = 0.04) and daily (β = 0.07), with youth being more often alone on weekdays. Weekday was also linked to greater daily loneliness (β = 0.05). Age moderated the momentary association in H1a (β = 0.16), indicating that older participants felt lonelier when alone. Daily, age was positively associated with being alone (β = 0.13) and gender moderated H1a (β = −0.32), with males feeling less lonely when alone. We did not replicate the effects of H1a and H1b at the between-person level (H1c): individuals who were generally alone more often did not report higher overall loneliness (see Table 3). As expected in H1d, loneliness varied by type of social company (see Table 4). The strongest reduction was found for friends (β = −0.62), followed by romantic partners (β = −0.51), and family members (β = −0.39). Classmates/fellow students/colleagues were not linked to significant changes in loneliness. Thus, social company reduced loneliness primarily when the company was friends, partners and family members. Weekday was negatively associated with being with family (β = −0.10) or partners (β = −0.07), but positively with classmates/fellow students/colleagues (β = 0.13), such that youth were less likely to be with family or partners on weekdays and more likely to be with classmates. Weekday was also weakly but significantly linked to loneliness when with family (β = 0.02), partners (β = 0.01), or classmates/fellow students/colleagues (β = 0.02), with participants feeling lonelier on weekdays. Age was negatively associated with family (β = −0.45) and positively with partners (β = 0.29), with older participants having spent less time with family and more time with their partners. Age also moderated H1a for friends (β = −0.30), with older participants feeling less lonely in their presence.
Results of analyses of hypotheses set 1 (H1a, H1b and H1c)

Table 3 Long description
A table comparing the associations between being alone, loneliness, and various covariates at momentary and daily levels. The table has two main sections: Within and Between. The Within section includes rows for alone to lonely, weekday to lonely, and weekday to alone, with columns for H1a (momentary) and H1b (daily), each containing beta values and confidence intervals. The Between section includes rows for age, gender, and their associations with being alone and loneliness, also with columns for H1a (momentary) and H1b (daily), each containing beta values and confidence intervals. Notable trends include significant associations between being alone and loneliness at both momentary and daily levels, with higher beta values indicating stronger associations. Age and gender also moderate these associations differently at momentary and daily levels.
Note. N = 294 (between), N = 29,984 (within).
Results of analyses of H1d of hypotheses set 1

Table 4 Long description
The table presents the results of analyses of hypothesis H1d from hypotheses set 1, focusing on the impact of different types of social company on loneliness. It includes data for family members, friends, partners, and classmates/fellow students/colleagues. The table has 14 rows and 8 columns. Column headers are Family members, Friends, Partner, and Classmates/fellow students/colleagues, each with sub-columns for β and CI. Row labels include social company→lonely (H1d), weekday→social company, weekday→lonely, age→H1d, gender→H1d, age→social company, gender→social company, and social company→lonely. Each row provides β values and confidence intervals (CI) for the different groups. Notable trends include the strongest reduction in loneliness when with friends (β = -0.62), followed by romantic partners (β = -0.51), and family members (β = -0.39). Classmates/fellow students/colleagues were not significantly linked to changes in loneliness. Weekday was negatively associated with being with family (β = -0.10) or partners (β = -0.07), but positively with classmates/fellow students/colleagues (β = 0.13). Age was negatively associated with family (β = -0.45) and positively with partners (β = 0.29), with older participants spending less time with family and more time with their partners.
Note. N = 294 (between), N = 29,984 (within).
Set 2: maladaptive personality traits and loneliness
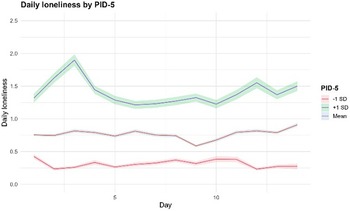
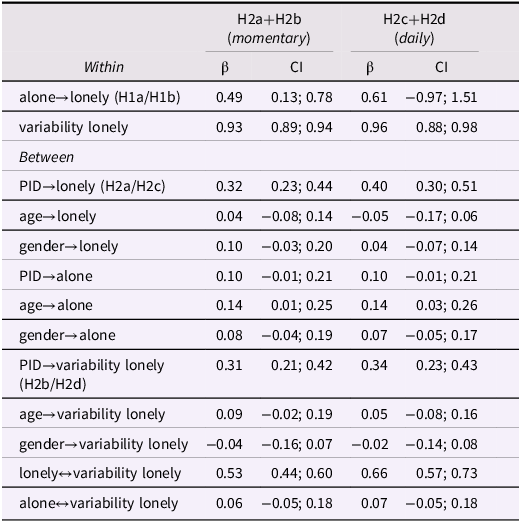
We found significant associations between higher levels of maladaptive personality traits and loneliness both momentarily (H2a) and daily (H2c). Youth reporting higher baseline maladaptive personality traits also reported greater momentary (β = 0.32) and end-of-day loneliness (β = 0.40), although they were not significantly more often alone during prompts. Likewise, higher levels of maladaptive personality traits were linked to greater variability, momentarily (H2b; β = 0.31) and daily (H2d; β = 0.34). Loneliness variability was strongly associated with loneliness, both momentary (β = 0.53) and daily (β = 0.66), but not with being alone more often (see Figures 2 and 3 for visualizations and Table 5). Age was, again, positively related to being alone both momentary (β = 0.14) and daily (β = 0.14).
Daily aggregated momentary loneliness by level of maladaptive personality traits. Note. PID-5 = maladaptive personality traits assessed via PID-5BF+; −1 SD = one standard deviation below mean value; +1 SD = one standard deviation above mean value. Error bands (i.e., shaded areas) indicate 95% credibility intervals.

Daily loneliness by level of maladaptive personality traits. Note. PID-5 = maladaptive personality traits assessed via PID-5BF+; −1 SD = one standard deviation below mean value; +1 SD = one standard deviation above mean value. Error bands (i.e., shaded areas) indicate 95% credibility intervals.

Results of analyses of hypotheses set 2 (H2a, H2b, H2c, H2d)

Table 5 Long description
A table showing the results of analyses of hypotheses set 2, focusing on the associations between maladaptive personality traits and loneliness. The table has 12 rows and 6 columns. Column headers are H2a+H2b (momentary), beta, CI, H2c+H2d (daily), beta, CI. Row labels are within, alone->lonely (H1a/H1b), variability lonely, between, PID->lonely (H2a/H2c), age->lonely, gender->lonely, PID->alone, age->alone, gender->alone, PID->variability lonely (H2b/H2d), age->variability lonely, gender->variability lonely, lonely<->variability lonely, alone<->variability lonely. Row 1: alone->lonely (H1a/H1b), 0.49, 0.13; 0.78, 0.61, -0.97; 1.51. Row 2: variability lonely, 0.93, 0.89; 0.94, 0.96, 0.88; 0.98. Row 3: PID->lonely (H2a/H2c), 0.32, 0.23; 0.44, 0.40, 0.30; 0.51. Row 4: age->lonely, 0.04, -0.08; 0.14, -0.05, -0.17; 0.06. Row 5: gender->lonely, 0.10, -0.03; 0.20, 0.04, -0.07; 0.14. Row 6: PID->alone, 0.10, -0.01; 0.21, 0.10, -0.01; 0.21. Row 7: age->alone, 0.14, 0.01; 0.25, 0.14, 0.03; 0.26. Row 8: gender->alone, 0.08, -0.04; 0.19, 0.07, -0.05; 0.17. Row 9: PID->variability lonely (H2b/H2d), 0.31, 0.21; 0.42, 0.34, 0.23; 0.43. Row 10: age->variability lonely, 0.09, -0.02; 0.19, 0.05, -0.08; 0.16. Row 11: gender->variability lonely, -0.04, -0.16; 0.07, -0.02, -0.14; 0.08. Row 12: lonely<->variability lonely, 0.53, 0.44; 0.60, 0.66, 0.57; 0.73. Row 13: alone<->variability lonely, 0.06, -0.05; 0.18, 0.07, -0.05; 0.18.
Note. N = 294 (between), N = 29,984 (within); PID = maladaptive personality traits assessed via PID−5BF+.
Set 3: moderation of social context and loneliness by maladaptive personality traits
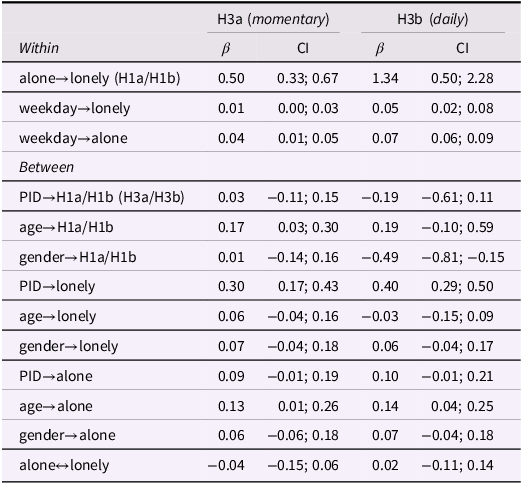
At the momentary level, being alone more often was positively associated with higher loneliness (H1a; β = 0.50), and higher levels of maladaptive personality traits were strongly related to higher loneliness (H2a; β = 0.30), but not with being alone more often. Maladaptive personality traits did not significantly moderate the link between absence of social company and momentary loneliness. At the daily level, being alone more often was, again, associated with higher loneliness (H1b; β = 1.34), and higher levels of maladaptive personality traits were linked to higher loneliness (H2c; β = 0.40) but did not moderate the association between being alone more often and daily loneliness (see Table 6). Weekday was positively associated with both loneliness – momentary (β = 0.01) and daily (β = 0.05) – and being alone – momentary (β = 0.04) and daily (β = 0.07). Thus, participants were lonelier and more often alone on weekdays. Age moderated H1a (β = 0.17), with older individuals showing a stronger link between being alone more often and feeling lonelier. At the daily level, gender moderated H1b (β = −0.49), with a weaker association for males. Age was also positively associated with being alone (β = 0.14). However, at the between-person level (H3c), the model was significant (F(3, 31 966) = 1340.00, p < .001, R2 = 0.112), with a significant interaction effect (β = –1.13, SE = 0.06, t = –20.45, p < .001): higher levels of maladaptive personality traits weakened the association between average number of moments being alone and average loneliness during the study period.
Results of analyses of hypotheses set 3 (H3a, H3b)

Table 6 Long description
A table with 12 rows and 6 columns comparing within and between factors for H3a (momentary) and H3b (daily). The columns are labeled alone->lonely (H1a/H1b), weekday->lonely, weekday->alone, PID->H1a/H1b (H3a/H3b), age->H1a/H1b, and gender->H1a/H1b. The table includes beta values and confidence intervals for each factor. Row 1: alone->lonely (H1a/H1b), beta 0.50, CI 0.33; 0.67, beta 1.34, CI 0.50; 2.28. Row 2: weekday->lonely, beta 0.01, CI 0.00; 0.03, beta 0.05, CI 0.02; 0.08. Row 3: weekday->alone, beta 0.04, CI 0.01; 0.05, beta 0.07, CI 0.06; 0.09. Row 4: PID->H1a/H1b (H3a/H3b), beta 0.03, CI -0.11; 0.15, beta -0.19, CI -0.61; 0.11. Row 5: age->H1a/H1b, beta 0.17, CI 0.03; 0.30, beta 0.19, CI -0.10; 0.59. Row 6: gender->H1a/H1b, beta 0.01, CI -0.14; 0.16, beta -0.49, CI -0.81; -0.15. Row 7: PID->lonely, beta 0.30, CI 0.17; 0.43, beta 0.40, CI 0.29; 0.50. Row 8: age->lonely, beta 0.06, CI -0.04; 0.16, beta -0.03, CI -0.15; 0.09. Row 9: gender->lonely, beta 0.07, CI -0.04; 0.18, beta 0.06, CI -0.04; 0.17. Row 10: PID->alone, beta 0.09, CI -0.01; 0.19, beta 0.10, CI -0.01; 0.21. Row 11: age->alone, beta 0.13, CI 0.01; 0.26, beta 0.14, CI 0.04; 0.25. Row 12: gender->alone, beta 0.06, CI -0.06; 0.18, beta 0.07, CI -0.04; 0.18. Row 13: alone<->lonely, beta -0.04, CI -0.15; 0.06, beta 0.02, CI -0.11; 0.14.
Note. N = 294 (between), N = 29,984 (within); PID = maladaptive personality traits assessed via PID−5BF+.
Exploratory analyses
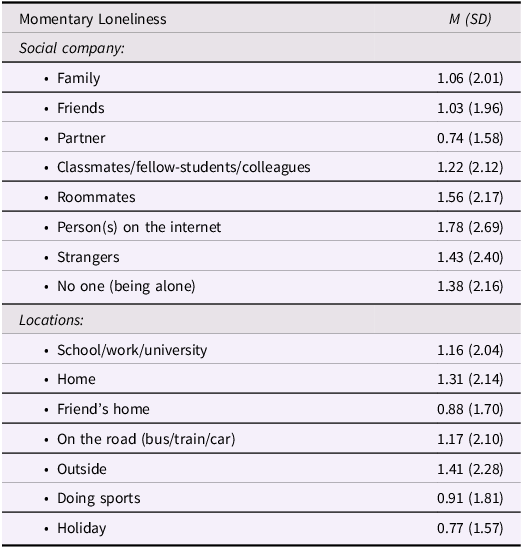
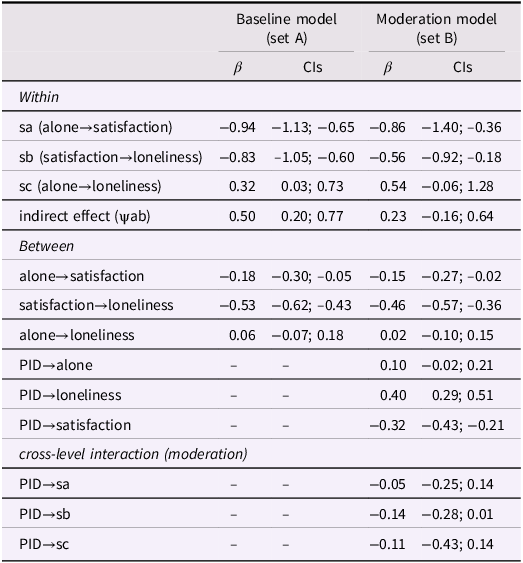
A detailed overview of the contexts (i.e., locations, type of company) in which youth reported the highest levels of loneliness is presented in Table 7. Loneliness peaked among 14-year-olds (see also Figure S1 in the supplement) when interacting with people online, followed by being with roommates, strangers, or being alone. Youth felt most lonely when being at home or in school. Exploratory analyses tested a potential explanatory process between loneliness and maladaptive personality traits (see Table 8 for details). In Set A, daily social satisfaction significantly mediated the link between being more alone and end-of-day loneliness (indirect effect: β = 0.50). However, the direct path between being more alone on one day and end-of-day loneliness persisted despite the mediation (β = 0.32), indicating a partial mediation. In Set B, adding maladaptive personality traits as a moderator eliminated the significant indirect effect. Being more often alone was significantly negatively associated with daily social satisfaction (β = −0.86), which in turn was negatively associated with end-of-day loneliness (β = −0.56). The direct association between being more alone and end-of-day loneliness was non-significant. Maladaptive personality traits were positively associated with daily loneliness (β = 0.40) and daily social satisfaction (β = −0.32), but not with being alone more often. Maladaptive personality traits did not significantly moderate any of the paths in this model (see Table 8).
Detailed descriptive overview of momentary loneliness levels by age, social company and location contexts

Table 7 Long description
A table comparing momentary loneliness levels among youth based on social company and locations. The table has two main categories: Social company and Locations, each with several subcategories. The table includes mean (M) and standard deviation (SD) values for each subcategory. Social company includes Family, Friends, Partner, Classmates/fellow-students/colleagues, Roommates, Person(s) on the internet, Strangers, and No one (being alone). Locations include School/work/university, Home, Friend's home, On the road (bus/train/car), Outside, Doing sports, and Holiday. Row 1: Family, 1.06 (2.01). Row 2: Friends, 1.03 (1.96). Row 3: Partner, 0.74 (1.58). Row 4: Classmates/fellow-students/colleagues, 1.22 (2.12). Row 5: Roommates, 1.56 (2.17). Row 6: Person(s) on the internet, 1.78 (2.69). Row 7: Strangers, 1.43 (2.40). Row 8: No one (being alone), 1.38 (2.16). Row 9: School/work/university, 1.16 (2.04). Row 10: Home, 1.31 (2.14). Row 11: Friend's home, 0.88 (1.70). Row 12: On the road (bus/train/car), 1.17 (2.10). Row 13: Outside, 1.41 (2.28). Row 14: Doing sports, 0.91 (1.81). Row 15: Holiday, 0.77 (1.57).
Note. N = 294 (between), N = 29,984 (within).
Results of analyses of exploratory set A and B

Table 8 Long description
A table comparing baseline and moderation models for different variables. The table has 15 rows and 6 columns. The columns are labeled as Baseline model (set A) Beta, Baseline model (set A) CIs, Moderation model (set B) Beta, and Moderation model (set B) CIs. The rows are labeled as Within, sa (alone to satisfaction), sb (satisfaction to loneliness), sc (alone to loneliness), indirect effect (yab), Between, alone to satisfaction, satisfaction to loneliness, alone to loneliness, PID to alone, PID to loneliness, PID to satisfaction, and cross-level interaction (moderation). Each row contains values for Beta and CIs under both models. Notable trends include the indirect effect (yab) being 0.50 in the baseline model and 0.23 in the moderation model. The direct path between being more alone and end-of-day loneliness is significant in the baseline model but non-significant in the moderation model.
Note. N = 294 (between), N = 29,984 (within); PID = maladaptive personality traits assessed via PID−5BF+.
Sensitivity analyses
Self-vs. Informant report. To examine differences between self-and external perception, we replaced self-reported maladaptive personality traits with those reported by informants in Hypotheses Set 2, 3, and Exploratory Set B. For Set 2 and 3, results mirrored the main analyses, with no changes in statistical significances. In Exploratory Set B, the indirect effect of daily social satisfaction became significant (β = 0.39), while the direct effect of being alone on loneliness remained non-significant, indicating a full mediation, in contrast to the partial mediation in the main analyses. None of the examined paths were moderated by levels of maladaptive personality traits. For details, see the uploaded outputs on the OSF.
PID−5 domains. To test whether effects varied by specific PID−5 domains, we replaced the total score with each of the six domains. For Hypotheses Set 2, H2a– H2d were supported all domains, except Anankastia (see Table S1 in the Supplement). Anankastia was unrelated to momentary loneliness (H2a), its variability (H2b) and daily variability (H2d), but was significantly associated with daily loneliness (H2c). Detachment showed a significant positive link with being alone (β = 0.12) and was also associated with higher loneliness (β = 0.26) and greater variability (β = 0.20) at both momentary and daily levels. This means that only individuals with higher levels of Detachment reported being more alone while also experiencing more frequent and fluctuating loneliness. For negative affect, H1a became non-significant while remaining significant for all other domains. We did not find this effect on a daily level (H1b) for any other domain. For Hypotheses Set 3, within-person patterns were largely similar across domains: Antagonism, Disinhibition, and Psychoticism (all both on momentary and daily levels), Negative Affect (daily), and Anankastia (daily) showed significant moderation effects (see supplementary Table S2). Uniquely Negative Affect significantly moderated H1a at the momentary level (H3a; β = 0.22), indicating greater loneliness when alone among those high in Negative Affect. We did not find this effect on a daily level. At the between-person level (H3c), significant negative moderating effects were found for all domains except Anankastia. Although the model was significant overall (F(3, 31 966) = 65.57, p < .001, R2 = 0.01), the interaction was non-significant. Across Sets 2 and 3, Detachment remained the only domain consistently associated with being alone – momentary (β = 0.12) and daily (β = 0.13) – and with higher loneliness – both momentary (H2a; β = 0.23) and daily (H2c). Anankastia was the only domain not significantly related to momentary loneliness (H2a). For Exploratory Set B, for Detachment (β = 0.20), Antagonism (β = 0.44) and Psychoticism (β = 0.68) the direct association between being alone and feeling lonely were significant, while for Detachment (β = 0.48) and Antagonism (β = 0.36) the indirect effect turned significant as well, indicating a partial mediation (see Table S3 in the Supplement). Negative Affect (β = −0.17) and Antagonism (β = −0.16) significantly weakened the association between social satisfaction and loneliness, while Psychoticism (β = −0.29) significantly weakened the association between being alone and loneliness. For details see outputs on the OSF.
Single items assessing daily loneliness. We tested whether results varied depending on the construct assessed in the evening (lonely, left out, isolated). Results for H1b and H2c were unchanged for all three items. For H3b, results remained unchanged for “lonely“ and “isolated“ but “left out“ turned H1b non-significant. In Exploratory Set A, results for “lonely” were unchanged, whereas for “isolated“ and “left out,“ the main path between being alone and feeling isolated became non-significant, indicating a full mediation. At the between-person level, the link between being alone and feeling isolated/left out became also non-significant, while social satisfaction turned significant. In Exploratory Set B, “isolated“ matched the main results, with “lonely,“ both the direct and indirect effects were significant (partial mediation). For “left out,“ levels of maladaptive personality traits significantly moderated the link between social satisfaction and feeling left out, other results were unchanged. For details see the uploaded outputs on the OSF.
Discussion
Using an intensive longitudinal design, this preregistered study examined how loneliness in youths’ daily lives fluctuates across timescales and social contexts in relation to maladaptive personality. As expected, loneliness was more pronounced in moments and on days when youth were more often alone but youth who tended to spend more time alone were not necessarily lonelier. Only close social company (friends, partners, family) reduced loneliness, while more distant company (e.g., classmates) had no effect. Maladaptive personality traits predicted more pronounced and more variable loneliness but amplified the effect of being alone on loneliness only on the between-person, not the within-person level. Exploratory analyses indicated partial mediation of being alone and loneliness by social satisfaction, with maladaptive personality traits linked to lower satisfaction and higher loneliness. Covariates weekday, age, and gender had a significant impact on loneliness, with more pronounced loneliness on weekdays, older adolescents and females. Sensitivity analyses confirmed findings across measures and domains, highlighting Detachment and Negative Affect as especially relevant.
Quantity and quality of social contacts and loneliness across timescales
Consistent with our hypotheses and in line with Van Roekel et al. (Reference Van Roekel, Scholte, Engels, Goossens and Verhagen2014), youth reported higher levels of loneliness during moments (H1a) and on days (H1b) where they were more often alone, confirming that – at the within-person level – being alone tends to increase loneliness. However, this association did not emerge at the between-person level (H1c), suggesting that individuals who are more often alone are not necessarily lonelier overall. This finding underscores, again, the importance of within-person perspectives in addition to between-person findings (Mund et al., Reference Mund, Maurer, Jeronimus and Buecker2025). Whether loneliness arises or not when a person is alone, seems to be highly individual and dependent on contextual factors, such as the preference of solitude and how this need may in turn, lead to social dissatisfaction if it is not met by the social context (either by too much or too little social contact; Coplan et al., Reference Coplan, Hipson, Archbell, Ooi, Baldwin and Bowker2019). Gender differences further nuance these findings. Males reported feeling less lonely when alone, aligning with evidence that males often report lower emotional expressivity and may perceive solitude as less threatening (Pollastri et al., Reference Pollastri, Raftery-Helmer, Cardemil and Addis2018). In contrast, females’ stronger social orientation may heighten the emotional salience of social disconnection (Qualter et al., Reference Qualter, Vanhalst, Harris, Van Roekel, Lodder, Bangee, Maes and Verhagen2015). As shown in H1d, the quality of social company mattered: Only close social company (friends, romantic partners, family members) was associated with reduced loneliness, while more distant social company (classmates, fellow students, colleagues) had no significant effect. Contextual data (see Table 7) reinforced this finding – mean loneliness was higher with strangers, online contacts, or roommates than when alone. These patterns mirror Van Roekel et al. (Reference Van Roekel, Scholte, Engels, Goossens and Verhagen2014) that found that the school context, with its potential for disliked peers and involuntary interactions, is less able to mitigate loneliness, than voluntary, close relationships. In line with recent research (Buecker et al., Reference Buecker, Horstmann, Krasko, Kritzler, Terwiel, Kaiser and Luhmann2020a), youth felt lonelier on weekdays, where they also reported that they spent more time with weaker social ties than with closer ones. Moreover, adolescents reported heightened feelings of loneliness during online interactions. Research shows that higher quality friendships predicted lower screen time, and higher screen time was associated with lower friendship quality. Social media might be used as a coping mechanism for feeling lonely, while this coping mechanism further affects social relationships (Hall, Reference Hall2025). However, empirical evidence suggests that the usage of social media and its effects on life satisfaction is highly dependent of age and gender in adolescence, with specific windows of developmental sensitivity to social media (Orben et al., Reference Orben, Przybylski, Blakemore and Kievit2022). A potential explanatory process for the interplay between quantity and quality of social company was found in the exploratory analyses. Findings suggested that daily social satisfaction partially mediated the association between being alone and loneliness, consistent with research showing social satisfaction is a stronger predictor of negative outcomes (e.g., illnesses, divorce, unemployment, poverty, or substance abuse) than sheer contact quantity (Junttila et al., Reference Junttila, Kainulainen and Saari2015). The partial mediation by social satisfaction suggests that loneliness in adolescence is not merely a function of social isolation but of perceived quality and fulfillment within existing relationships (Hawkley & Cacioppo, Reference Hawkley and Cacioppo2010). This highlights the importance of targeting relational satisfaction in preventive interventions.
Loneliness in the context of adolescent development
With increasing age, youth spent less time with family and more with partners, and age also weakened the link between being with friends and reduced loneliness – highlighting developmental shifts in relationship priorities (Dahl et al., Reference Dahl, Allen, Wilbrecht and Suleiman2018). Older adolescents spent more time alone and, at the same time, felt lonelier when they were alone, which aligns with developmental models emphasizing shifts and identity formation. According to the concept of emerging adulthood (Arnett, Reference Arnett2000) the increasing time spent alone is necessary, as emerging adults explore their identity on their own as part of increasing autonomy and individuation from the family. Conforming to the theory of psychosocial development (Erikson, Reference Erikson1994), identity versus role confusion represents a central developmental task. During this stage, adolescents strive to consolidate a coherent sense of self, a process that is closely linked to the quality of peer and romantic relationships that become more salient during this developmental stage (Dahl et al., Reference Dahl, Allen, Wilbrecht and Suleiman2018). Being alone, although developmentally normative, may therefore feel particularly threatening, leading to higher feelings of loneliness in adolescents. These necessary adaptations to changing social contexts are shaped by personality traits (Teppers et al., Reference Teppers, Klimstra, van Damme, Luyckx, Vanhalst and Goossens2013).
Maladaptive personality traits and loneliness in daily life
Maladaptive personality traits predicted both higher and more variable loneliness (H2a– H2d) across timescales but were unrelated to being alone more often on a within-person level, underscoring that personality traits and the subjective perception and processing of social experiences – rather than contact frequency – shape this association. Remarkably, individuals who were general lonelier during the study period also reported more fluctuations in loneliness. These results are consistent with findings by Shrestha et al. (Reference Shrestha, Sigdel, Pokharel and Columbus2025) and can be interpreted in light of the differential reactivity hypothesis. Chronically lonelier youth may exhibit heightened emotional sensitivity, which could manifest not only in higher average levels of loneliness but also in greater within-person variability across time. While variability alone does not directly index reactivity to specific social contexts, the observed pattern is compatible with the notion that loneliness-prone individuals experience stronger emotional fluctuations in response to changes in their social environment in daily life. However, maladaptive personality traits did not moderate the association between being alone and loneliness on a within-person level (H3a-H3b), suggesting that youth high in maladaptive personality traits feel lonelier overall but not especially lonely when alone in their daily lives compared to individuals low in maladaptive personality traits. On a between-person level, however, we found that higher maladaptive personality traits even weakened the association between being alone more often and feeling lonely overall, underlining, again, the need for a nuanced within-person assessment (Mund et al., Reference Mund, Maurer, Jeronimus and Buecker2025). This unexpected attenuation at the between-person level may suggest that adolescents with higher maladaptive personality traits experience loneliness less as a reaction to situational solitude and more as a chronic, trait-like state. For these individuals, loneliness may reflect enduring interpersonal difficulties and internalized feelings of social disconnection, rather than momentary fluctuations tied to being alone (Cacioppo et al., Reference Cacioppo, Cacioppo, Cole, Capitanio, Goossens and Boomsma2015; Reinhard et al., Reference Reinhard, Nenov-Matt and Padberg2022). At the same time, within-person fluctuations in loneliness may still occur, potentially reflecting interpersonal dysfunctions and instability in daily interactions among youth high in maladaptive personality traits (Wright et al., Reference Wright, Ringwald, Hopwood and Pincus2022). This interpretation is also supported by our exploratory analyses, where maladaptive personality traits were negatively associated with social satisfaction. Maladaptive personality traits are associated with interpersonal problems, emotion regulation difficulties, and insecure attachment styles in adults (Amiri & Navab, Reference Amiri and Navab2018; Fossati et al., Reference Fossati, Krueger, Markon, Borroni, Maffei and Somma2015; Najarian & Abdi, Reference Najarian and Abdi2020).
Maladaptive personality trait domains and differential patterns
Domain-level sensitivity analyses identified Detachment and Negative Affect as particularly relevant, which aligns with existing literature (Freilich et al., Reference Freilich, McGue, South, Roisman and Krueger2024; Roche et al., Reference Roche, Pincus and Cole2019; Romero & Alonso, Reference Romero and Alonso2019). Detachment uniquely predicted being alone more often, higher loneliness and greater variability, partially due to lower social satisfaction, pointing to a mismatch between the desire for connection and the ability to form satisfying relationships. Youth high in Detachment might have problems in initiating and maintaining satisfactory relationships, as this domain is characterized by withdrawal from social relationships, limited affective experience and expression (American Psychiatric Association, 2013) and related to insecure attachment (Fossati et al., Reference Fossati, Krueger, Markon, Borroni, Maffei and Somma2015). In recent literature, loneliness was found to be both, a predictor and a consequence of engagement in social interactions. Thus, the lonelier individuals with high Detachment feel, the more difficult it might be for them to create desired social contexts (Reissmann et al., Reference Reissmann, Stollberg, Hauser, Kaunzinger and Lange2021) and high-quality friendships (Lodder et al., Reference Lodder, Scholte, Goossens and Verhagen2017). Negative Affect was the only domain to strengthen the relationship between being alone and loneliness, possibly reflecting heightened emotional sensitivity to social disconnection. Negative affect is characterized by the frequent and intense experience of a broad range of negative emotions and emotion regulation difficulty (Amiri & Navab, Reference Amiri and Navab2018; Fossati et al., Reference Fossati, Krueger, Markon, Borroni, Maffei and Somma2015) and is strongly associated with core features of anxious/ambivalent attachment (Fossati et al., Reference Fossati, Krueger, Markon, Borroni, Maffei and Somma2015). This might explain why individuals high in negative affect experience higher levels of loneliness, especially when they are alone. Interestingly, negative affect and antagonism weakened the association between satisfaction and loneliness, suggesting that even positive social interactions might be less effective in reducing loneliness. Early identification of Detachment and Negative Affect in particular (e.g., in schools) could help prevent the development of chronic loneliness through targeted interventions that focus not only on increasing the frequency of social interactions but also on enhancing social interactions and fostering higher quality relationships, e.g., through social skills training. Anankastia was only weakly linked to daily loneliness and uniquely unrelated to momentary loneliness levels or its variability. Anankastia also showed no significant interaction with being alone, differentiating it from the other domains. Anankastia is characterized by a narrow focus on rigid standards of perfection, controlling situations, the own behavior and those of others to ensure compliance with these standards (World Health Organization, 2019). This might indicate that youth high in Anankastia are not especially sensitive to social disconnection, due to the more self-controlled and self-centered nature. These characteristics may reduce social needs of altogether or buffer from the emotional effects of solitude.
Measurement perspectives and robustness of findings
We used informant-reported maladaptive personality traits in our sensitivity analyses, as the addition of informant reports is suggested (Klonsky et al., Reference Klonsky, Oltmanns and Turkheimer2002; Soodla et al., Reference Soodla, Lehto, Kõiv, Vainik, Akkermann and Mõttus2025). Results were largely replicated, although in one exploratory model the mediation became full rather than partial, indicating possible differences between self-and external perceptions of maladaptive personality, which aligns with findings that individuals with PDs tend do show deficits in self-knowledge and emotional insights (Kramer & Pascual-Leone, Reference Kramer and Pascual-Leone2018), which is also mirrored in the significant but weak correlation (r_between = 0.22, see Kaurin et al., Reference Kaurin, Krakau, Wicher, Philippi and Shiner2025 and Table 2) between self-and informant report of maladaptive personality traits. Item-level sensitivity analyses showed overall consistency across “lonely,” “isolated,” and “left out,” although some deviations emerged (e.g., “left out” rendered H1b nonsignificant). This supports the view that loneliness is multidimensional (Wicher et al., Reference Wicher, Dombrovski, Hallquist, Buecker, Wright and Kaurin2025). Additionally, momentary and trait loneliness were significantly associated with each other as well as momentary and daily ratings, indicating that individuals who are lonelier in general also tend to feel lonelier in the daily life, aligning with results by Van Roekel et al. (Reference Van Roekel, Verhagen, Engels, Scholte, Cacioppo and Cacioppo2016). These findings, again, reinforce the differential reactivity hypothesis, according to which more lonely individuals respond differently to their social contexts than individuals with lower levels of loneliness. Moreover, this study shows that youth seem to be capable of reflecting their momentary experiences at the end of the day, underlining daily diaries as valid assessments of experiences within one day without excessive biases.
Limitations
The findings from our preregistered analysis (https://osf.io/xptuv/) extend prior research on loneliness in different social contexts and personality traits. Assessing loneliness and different social contexts in the daily life of youth, we provide ecologically valid insights into the dynamics between social environment and personality of adolescents and young adults. We employed multi-item and multi-informant assessments of maladaptive personality traits and loneliness in different timescales (momentary and daily) for a nuanced measurement of these multidimensional constructs.
Despite its strengths, the present study has several limitations that suggest directions for future research. First, although we employed multiple items for loneliness, this was only for the daily evening assessments. To keep participant burden low, we employed only a one-item measure to assess loneliness during the eight momentary, as it is common in other studies (e.g., Kleiman & Nock, Reference Kleiman and Nock2018; Mou et al., Reference Mou, Kleiman, Fedor, Beck, Huffman and Nock2018; Mournet et al., Reference Mournet, Kellerman, Yeager, Rosen, Kim and Kleiman2022). Although momentary and daily loneliness were highly correlated (β_within = 0.80), the single-item question might not cover the full facets of loneliness. Second, although compliance was comparably high (85.1% of all surveys), missing EMA entries (14.95% for momentary loneliness ratings) may lead to distortions of the results. Hereby, it is also important to notice that if the presence of another person was indicated, up to five follow-up questions were triggered. If participants were aware of this, they may have been less likely to report being with someone, potentially leading to an underrepresentation of social interactions. Additionally, although we included participants from in-and outpatient clinics and social psychiatric centers, the present study is not exclusively based on a clinical sample, which is mirrored in the relatively low levels of the PID−5 total score. Thus, generalizability may be limited, as the sample is likely heterogeneous in terms of clinical severity and levels of maladaptive personality traits. Similarly, mean values of loneliness were relatively low in this sample, which may have resulted in restricted variances and, in turn, underestimation of potential effects. Finally, the majority of our sample was born in Germany, identified as cisgender, attended high school, had a good to very good socioeconomic background. Thus, diversity was limited in this sample and results might not be generalizable for minority groups. Future studies should aim for more diverse samples, as studies with adult samples show that ethnic minorities are more likely to be consistently lonely than white respondents (Victor & Rippon, Reference Victor and Rippon2024).
Conclusion
This preregistered EMA study provides fine-grained evidence that loneliness in adolescence is context-dependent, fluctuating across moments and days and as a function of both quantity and quality of social company. Crucially, maladaptive personality traits were linked to higher and more variable loneliness experiences, underscoring that individual dispositions shape how youth perceive and evaluate their social world. Domain-specific analyses highlighted Detachment and Negative Affect as particularly relevant, pointing to interpersonal withdrawal, interpersonal difficulties, and heightened emotional sensitivity as key processes in the emergence of loneliness. These results suggest that maladaptive personality traits may act as baseline vulnerabilities that shape general emotional tone and relational expectations rather than amplifying momentary situational effects. Future research should examine how these dispositional tendencies interact with proximal processes such as emotion regulation or perceived social support. Taken together, the findings extend the differential reactivity hypothesis to adolescence by showing that maladaptive traits contribute to variability in loneliness above and beyond situational factors, with limited evidence for trait–context interactions. Understanding these dynamics may help identify adolescents at risk for chronic loneliness and inform targeted interventions that focus not only on increasing social contact but also on enhancing the quality and emotional meaning of adolescents’ relationships.
Supplementary material
The supplementary material for this article can be found at http://doi.org/10.1017/S0954579426101230.
Data availability statement
Availability of Data (required): Publicly available on the OSF (https://osf.io/63vbm).
Availability of Code (required): Publicly available on the OSF (https://osf.io/63vbm).
Availability of Methods/material (required): All methods and materials are fully described in the manuscript.
Funding statement
This research received no specific grant from any funding agency, commercial or not-for-profit sectors.
Competing interests
The author(s) declare none.
Pre-registration statement
Active link: https://osf.io/xptuv
Date stamped: March 12, 2025
Deviation: None.
AI statement
No AI tools were used in the creation of this work.


 Open access