

“Nobody likes taxes,” remarked Barack Obama during a presidential debate in 2008. “I would prefer that none of us had to pay taxes, including myself.” But why should we dislike taxes? Taxes fund society and help people, similar to donating to charity. Presumably, Obama would not say, “Nobody likes giving to charity.” One might think that poor citizens would especially like taxes because they pay the least and benefit the most from government spending. But many poor citizens still oppose taxes, and they want to cut government programs that help them (Acemoglu et al. Reference Acemoglu, Naidu, Restrepo and Robinson2015; Bartels Reference Bartels2005; Reference Bartels2016; Mettler Reference Mettler2011; Reference Mettler2018).
Scholars have proposed many answers for why poor citizens dislike taxes, including loyalty to parties and groups that oppose taxes (De La O and Rodden Reference De La O and Rodden2008; Roemer Reference Roemer1998; Shayo Reference Shayo2009), distrust in government (Barton and Piston Reference Barton and Piston2022; Kuziemko et al. Reference Kuziemko, Norton, Saez and Stantcheva2015), the belief that government aid discourages work (Banerjee, Kreindler, and Olken Reference Banerjee, Hanna, Kreindler and Olken2017), racial tensions over social programs (Kinder and Sanders Reference Kinder and Sanders1996), and confusing tax policies (Abeler and Jäger Reference Abeler and Jäger2015; McCaffery and Baron Reference McCaffery and Baron2006; Mettler Reference Mettler2011; Reference Mettler2018). These factors are correlated and intertwined in contemporary politics, making them difficult to disentangle. But if they are the main culprits, then poor citizens should support taxes if we could somehow remove them.
However, another theory implies that many citizens would continue to oppose taxes even without these factors. This theory holds that citizens do not understand the benefits of taxes: they focus on their own tax burden more than the benefits, possibly because they are too short-sighted (Bartels Reference Bartels2005) or they feel a sense of property over their income. If so, these citizens would oppose taxes even in the simplest forms and without complications such as partisanship and distrust.
Here, we use experimental economics to isolate people’s understanding of taxes from other influences. In a simple game with real money at stake, participants earn high or low income and then vote for high or low taxes. The game takes place in a fictional village remote from contemporary politics. We programmed it with animations that show the costs and benefits of taxes as clearly as possible. The other voters are computer players to minimize social motives like altruism and fairness. Across rounds, we manipulate the participants’ income so that they are rich or poor compared to other citizens. We also manipulate across groups whether the policies are called “taxes” or “sharing” to distinguish the political connotations of taxes from their economic effects.
In this simplified society, we examine whether poor citizens continue to oppose taxes once we have removed major sources of opposition such as partisanship, distrust, and confusion. If these factors are the primary causes, then poor citizens should consistently support high taxes when they are absent, consistent with classic models of taxation from political economy (Meltzer and Richard Reference Meltzer and Richard1981). Conversely, poor citizens may focus on their own tax burden more than the benefits and therefore continue to oppose taxes (Bartels Reference Bartels2005).
What can researchers gain by using voting games to isolate people’s understanding of taxes? In real politics, the role of understanding is mixed with social motives and other influences. Even so, it is a separable source of political behavior. To study people’s understanding of taxes, we gain by minimizing other strands in experiments, even if we expect multiple causes to combine in politics. More concretely, we expect voters’ understanding to become more consequential when other influences weaken. For example, in a primary election, candidates from the same party may propose different tax policies, and without partisanship as a factor, people’s understanding of taxes may play a stronger role.
As a corollary, the results of voting games do not directly generalize to real politics, where many influences are at work. Experimental economists often liken their methods to using a wind tunnel to study planes. A wind tunnel allows researchers to isolate aerodynamic forces in a controlled environment. The tunnel is useful for testing theories and designs. However, the results do not automatically generalize to real flights with rain, obstacles, and other challenges. Whether planes or voters, researchers can use controlled methods to isolate causes while using naturalistic methods to see how those influences come together.
More generally, our experiments help bridge the literatures from experimental political economy and American politics. Our experimental methods belong to the field of experimental political economy (Del Ponte, Kline, and Ryan Reference Del Ponte, Kline and Ryan2020; McDermott Reference McDermott2002; Ostrom Reference Ostrom1998; Palfrey Reference Palfrey, Kagel and Roth2016; Wilson Reference Wilson2011), which is a subfield of experimental economics (Camerer Reference Camerer2011; Davis and Holt Reference Davis and Holt2021; V. L. Smith Reference Smith1982; Reference Smith2008). They are most akin to previous experiments on taxes and redistribution, particularly games in which players earn different incomes, see everyone’s income, and then vote to determine the tax rate (e.g., Lefgren, Sims, and Stoddard Reference Lefgren, Sims and Stoddard2016; Tepe, Vanhuysse, and Lutz Reference Tepe, Vanhuysse and Lutz2021; Tyran and Sausgruber Reference Tyran and Sausgruber2006). Overall, this literature finds strong evidence that voters are self-interested: poor voters consistently support high taxes in controlled experiments. Yet this finding appears to conflict with the literature in American politics, which commonly finds the opposite and seeks to explain why poor citizens vote against their self-interest. Despite the discrepancy, these literatures have remained largely separate. We help bridge these fields by tailoring our economic experiments to address questions from American politics.
Why Do Poor Citizens Oppose High Taxes?
Poor citizens benefit the most from taxes because they pay the least and receive the most benefits from the government.Footnote 1 This idea animates the classic model of taxation from political economy in which poor citizens support higher taxes to redistribute wealth to themselves (Meltzer and Richard Reference Meltzer and Richard1981). However, in real politics and in surveys, poor citizens do not consistently say they want more taxes and social spending, and the reasons why have become a central problem in political economy (Anderson Reference Anderson2006; Feldman Reference Feldman1982; Kuziemko et al. Reference Kuziemko, Norton, Saez and Stantcheva2015; Lewis-Beck and Paldam Reference Lewis-Beck and Paldam2000; Margalit Reference Margalit2013; Roberts, Hite, and Bradley Reference Roberts, Hite and Bradley1994; Sears and Funk Reference Sears and Funk1990; reviewed in Acemoglu et al., Reference Acemoglu, Naidu, Restrepo and Robinson2015).
To underscore the puzzle, consider some recent estimates of how much the poor benefit from taxes and social spending. In a Senate hearing about fair taxes, one expert estimated how much wealth is redistributed by federal taxes and spending in the United States, using 2017 data from the Congressional Budget Office (Hodge Reference Hodge2021). Citizens with low income paid little in income taxes and received more in benefits than they paid, whereas citizens with high income paid more in taxes than they received in benefits. For every dollar they paid in taxes, citizens in the lowest quintile of income received $68 in direct benefits through programs like Social Security, SNAP, Medicare, and Medicaid. Citizens in the second quintile received $4.60, the third quintile received $1.60, the fourth quintile received $0.71, and the richest quintile received $0.15 in direct benefits for each dollar they paid in taxes. By these estimates, taxes are clearly a good deal for citizens at the bottom, and they become less beneficial as income rises (counting only direct benefits).
Why then do many poor citizens want lower taxes? One explanation is that citizens compromise with their political party about taxes because they care more about other issues. Poor voters may oppose high taxes if they prioritize issues like religion (De La O and Rodden Reference De La O and Rodden2008; Roemer Reference Roemer1998), nationalism (Shayo Reference Shayo2009), or immigration (Pew 2022). For instance, the Republican Party favors low taxes, but it also favors policies that appeal to Christians, like restricting abortion, so a poor citizen who cares more about religion than taxes may compromise on taxes to stay loyal to their party. Accordingly, in responses from the General Social Survey, Christians tended to oppose redistribution more than other citizens (Weeden and Kurzban Reference Weeden and Kurzban2014).
A second explanation for why poor citizens oppose high taxes is that they distrust the government. If citizens fear that politicians are dishonest, corrupt, or wasteful, then they may oppose taxes regardless of their income. In one experiment, the researchers manipulated distrust by asking American participants to answer questions meant to rouse their suspicions (e.g., “Do you agree that politicians in Washington work to enrich themselves?”) and to view a ranking of transparency with the American government in the bottom quartile (Kuziemko et al., Reference Kuziemko, Norton, Saez and Stantcheva2015). Compared to the control condition, these participants were more opposed to social programs such as government aid to the poor, food stamps, and public housing, compared to participants. Another experiment looked at citizens’ suspicion that politicians who raise taxes on the rich will later extend the increases to everyone (Barton and Piston Reference Barton and Piston2022). Participants read about a ballot initiative that would raise taxes on people with incomes over $200,000. In the distrust condition, participants also read that “opponents of this legislation say … future politicians will change it so that everyone has to pay more.” This prompt decreased participants’ support from 60% in the control condition to 49% after reading the accusation that politicians would later extend the tax.
A third explanation is that poor citizens believe government aid discourages people from work, causing more poverty in the long run. They believe that aid reduces the motive to work and that people may work and save less to qualify for aid, which hinders their economic progress. In one poll, for instance, 83% of Americans said that the welfare system is a cause of poverty (KFF 2001). In another survey, 44% of Americans agreed that “government aid to the poor does more harm than good, by making people too dependent on government assistance” (Pew 2015). Generally, the belief that government aid discourages work persists despite the fact that randomized experiments in multiple countries have found little evidence of declines in work (Banerjee, Kreindler, and Olken Reference Banerjee, Hanna, Kreindler and Olken2017).
A fourth explanation is that poor citizens in the United States believe that government aid primarily benefits racial minorities, decreasing support among poor White citizens (Gilens Reference Gilens1999; Harell, Soroka, and Iyengar Reference Harell, Soroka and Iyengar2016; Kinder and Sanders Reference Kinder and Sanders1996; Lee and Roemer Reference Lee and Roemer2006). For example, in 2018, there were 14 million White participants (35%) and 9.9 million Black participants (26%) in the Supplemental Nutrition Assistance Program (USDA 2018). Yet, in a survey conducted at the time, only 21% of Americans answered correctly that more White citizens receive food stamps than Black citizens, compared to 27% who thought there were more Black recipients and 36% who thought the numbers were about the same (Delaney and Edwards-Levy Reference Delaney and Edwards-Levy2018). In a prominent study in political economy, researchers analyzed social spending and racial diversity in more than 50 countries and found that more racial diversity correlated with less government redistribution, which the authors argued may explain why the United States redistributes less than European countries (Alesina, Glaeser, and Sacerdote Reference Alesina, Glaeser and Sacerdote2001).
A fifth explanation is that poor citizens are misled by confusing tax policies (e.g., Achen and Bartels Reference Achen and Bartels2017; Gimpelson and Treisman Reference Gimpelson and Treisman2018). For example, Hacker and Pierson (Reference Hacker and Pierson2005) argued that politicians designed the Bush tax cuts in 2001 to mislead citizens by gradually phasing in the benefits to the rich while phasing out the benefits to others. A survey experiment examined whether citizens are confused about who benefits the most from the tax deduction for mortgage interest (Mettler Reference Mettler2011). Participants rated their support for the deduction and then rated it again after reading that “a large majority of the benefits went to people who lived in households that made $100,000 or more.” Participants’ support dropped from 55% to 40% after they learned who benefits; poor citizens’ support changed the most, declining from 49% to 17%.
Do Citizens Understand the Benefits of Taxes?
Still another explanation is that citizens do not understand the benefits of higher taxes. Bartels (Reference Bartels2005) argued that poor citizens dislike taxes because they focus too much on their own tax burden. He examined why most Americans supported the Bush tax cuts of 2001, which especially benefited wealthy citizens. Bartels analyzed data from the American National Election Studies in 2002, which took place just after the cuts. In the key questions, participants answered whether they approve of the “big tax cuts last year” and whether they “pay more than you should in federal taxes, just the right amount, or less than you should,” which provides a measure of their perception of their own tax burden. In models controlling for a variety of factors, participants who felt their own tax burden was too high supported the tax cuts more than those who felt otherwise. According to Bartels, citizens viewed the tax cuts myopically: they weighed their immediate tax burden more than the long-term benefits that higher taxes could provide.
In addition, citizens might focus on their tax burden because being forced to pay taxes violates their sense of property. People have a strong sense of property that motivates them to defend their resources against intruders (DeScioli et al. Reference DeScioli, Karpoff and De Freitas2017; DeScioli and Karpoff Reference DeScioli and Karpoff2015; DeScioli and Wilson Reference DeScioli and Wilson2011). More generally, the sense of ownership is one of the main regulators of aggression in humans and other animals that defend food, shelter, and territory against rivals (Dawkins Reference Dawkins1976; Kokko, López-Sepulcre, and Morrell Reference Kokko, López-Sepulcre and Morrell2006; J. M. Smith Reference Smith1982). Moreover, people’s sense of ownership grows stronger when they work to earn the resources (Hoffman et al. Reference Hoffman, McCabe, Shachat and Smith1994; Kanngiesser and Warneken Reference Kanngiesser and Warneken2012; Oxoby and Spraggon Reference Oxoby and Spraggon2008). In addition, people have egalitarian motives that drive them to retaliate against dominant authorities who use force to impose on their freedom and property (Boehm Reference Boehm2009; Reference Boehm2012). Thus, they may feel angry and hostile toward a dominant authority like a government that takes money they worked for, and their feelings of defensive aggression could overshadow the benefits that taxes can provide. If so, then people’s sense of ownership would make both poor and rich citizens oppose taxes, reinforcing rich citizens’ self-interest while working against poor citizens’ interests when redistributive taxes are profitable.
People’s dislike for taxes can even extend to the word “taxes.” For instance, Lorenz, Paetzel, and Tepe (Reference Lorenz, Paetzel and Tepe2017) conducted an economic experiment with real payoffs where groups of participants received different incomes before voting on redistributive taxes. In two conditions, participants chose the amount of redistribution either by choosing a tax rate or a minimum income that would be satisfied by redistribution. In other words, the redistributive policies were identical but were framed as a tax or a minimum income. Voters chose higher ideal tax rates when they were framed as a minimum income (an 86% tax rate on average) compared to a tax (a 48% tax rate on average). Thus, the label “taxes” decreased support for the redistributive policy. In a subsequent experiment, Paetzel, Lorenz, and Tepe (Reference Paetzel, Lorenz and Tepe2018) replicated these results and added conditions in which participants could use a calculator to clarify the effects of the policies. With a calculator, participants were less affected by the frames, suggesting that misunderstanding contributed to the original framing effect.
Other studies found that people opposed “taxes” more than the same policy by another name. In one study, participants opposed a carbon “tax” more than an “offset”; this was especially true of Republicans (Hardisty, Johnson, and Weber Reference Hardisty, Johnson and Weber2010). In other experiments, when participants were “taxed” compared to paying a deduction without the tax label, they gave less money to charity voluntarily (Eckel, Grossman, and Johnston Reference Eckel, Grossman and Johnston2005), and they completed less work for pay (Kessler and Norton Reference Kessler and Norton2016). In another study, participants said they would seek tax exemptions more than equivalent discounts and benefits (Sussman and Olivola Reference Sussman and Olivola2011). Thus, these studies indicate that just the word “taxes” can provoke opposition by its association with the burden of paying taxes.
Economic Experiments on Taxes and Redistribution
Unlike surveys, in many controlled experiments, poor voters consistently vote for high taxes and redistribution. Experimenters report findings like these:
-
• “The poor vote overwhelmingly in favor of redistribution in all groups” (Cabrales, Nagel, and Rodríguez Mora Reference Cabrales, Nagel and Mora2012, 289).
-
• “Votes for a redistributive tax are almost entirely in accordance with self-interest: above-average earners vote for low tax rates and below-average earners vote for high tax rates.” (Esarey, Salmon, and Barrilleaux Reference Esarey, Salmon and Barrilleaux2012, 604).
-
• “Individuals understand the consequences of decisions on redistributive taxation and vote in line with their material interest” (Konrad and Morath Reference Konrad and Morath2010, 33).
-
• “Self-interest stands out as the dominant motive” (Durante, Putterman, and Van der Weele Reference Durante, Putterman and Van der Weele2014, 1084).
-
• “About two-thirds of the Mturk subjects consistently display complete self-interest in voting” (Lefgren, Sims, and Stoddard Reference Lefgren, Sims and Stoddard2016, 94).
-
• “The single most important predictor of subjects’ tax choice: self-interest” (Tepe, Vanhuysse, and Lutz Reference Tepe, Vanhuysse and Lutz2021, 1059).
In one experiment, for example, 93% of poor players voted for 100% redistribution, compared to 20% of rich players (Lefgren, Sims, and Stoddard Reference Lefgren, Sims and Stoddard2016). Yet, this is not to say that self-interest is the whole story. For instance, the same experiment found that when incomes were proportional to the players’ workloads, fewer poor players, 67%, voted for 100% redistribution, showing that a substantial fraction of poor voters deferred to the rich players who did more work. Similarly, another experiment found that 70% of players with middle income voted for a tax that cost them a small amount in order to redistribute a large amount from the rich players to the poor players (Tyran and Sausgruber Reference Tyran and Sausgruber2006). Thus, self-interest is not the only motive in voting experiments: others include altruism, equality, merit, efficiency, buffering risk, and reaching an agreement to pass a policy. But self-interest is certainly more prominent than expected from theories of American politics that view voters as incapable of rational choice.
Nonetheless, as with any strand of research, these experiments have limitations that raise questions, especially outside the subfield. Most of the experiments were designed for purposes other than testing people’s understanding of taxes, so they were not tailored for that goal. Many do not use the word “taxes” in the instructions, instead using abstract terms like “transfer,” “redistribution,” “distribution parameter,” and “reallocation task” (Cabrales, Nagel, and Rodríguez Mora Reference Cabrales, Nagel and Mora2012; Gee, Migueis, and Parsa Reference Gee, Migueis and Parsa2017; Großer and Reuben Reference Großer and Reuben2013; Kittel, Paetzel, and Traub Reference Kittel, Paetzel and Traub2015; Krawczyk Reference Krawczyk2010). Although the language may suit other purposes, experiments on people’s understanding of taxes should use the word “taxes,” particularly given the finding we mentioned earlier that the word itself provokes opposition (Lorenz, Paetzel, and Tepe Reference Lorenz, Paetzel and Tepe2017). In addition to abstract language, the instructions often contain mathematical notation, including equations, variables, fractions, and decimals (e.g., Agranov and Palfrey Reference Agranov and Palfrey2015; Kittel, Paetzel, and Traub Reference Kittel, Paetzel and Traub2015; Krawczyk Reference Krawczyk2010). Using this notation may be considered acceptable within the subfield, but survey researchers and psychologists advise experimenters to use simple, familiar, and concrete language with participants (e.g., see Converse and Presser Reference Converse and Presser1986, 10–16; Schwarz Reference Schwarz1999). For these and other reasons, we sought to simplify and adapt previous methods so we could look more closely at people’s understanding of taxes.
Our Experiments
We designed a voting game that reduces the problem of taxes to its most basic form. In the game, participants earn income and vote for high or low taxes in a virtual society with real money on the line. To create the game, we programmed a web application with JavaScript animations that illustrate the process of taxation, while deliberately removing references to national politics. This provides a controlled environment to test whether people understand the basic mechanism of redistribution: citizens pay taxes to fund the public benefits they receive.
Participants play the game with computer players to minimize social motives for redistribution such as altruism and fairness (e.g., Dawes, Loewen, and Fowler Reference Dawes, Loewen and Fowler2011; DeScioli et al. Reference DeScioli, Cho, Bokemper and Delton2020; Fowler Reference Fowler2006; Rogers and Tyszler Reference Rogers and Tyszler2018). Computer players have been used in previous research for similar purposes, and as one would expect, people are less altruistic and fair with computer players. For example, in the dictator game, participants gave about 40% of the pot on average to human players while they gave 13% to the computer player (Weiß et al. Reference Weiß, Rodrigues, Paelecke and Hewig2020). Another experiment found that with computer players, participants were less cooperative in a repeated public goods game and less generous in an ultimatum game, even though the computer played humanlike strategies such as tit-for-tat (Melo, Marsella, and Gratch Reference Melo, Marsella and Gratch2016). Konrad and Morath (Reference Konrad and Morath2010) used computer players in an economic experiment on tax rates that was more similar to our experiment. Each participant was grouped with two computer players to “eliminate the possible effects stemming from other-regarding preferences” (11). They found that participants’ choice of tax rate correlated with their income, as rationality predicts. Poor participants chose an average tax of 73% while rich participants chose an average tax of 5%. We follow this previous research by using computer players to minimize social motives in order to isolate participants’ understanding of the personal benefits of taxes.
In the game, each participant is a member of a village community with nine players. The participant knows that the other eight members are computer players. In each round, each player earns a high or low income and then sees everyone’s income. Next, the players vote for low or high taxes. The votes are tallied, and the result is announced. Finally, the participant watches the taxes being collected and redistributed equally among the nine players.
If poor players vote for high taxes, then this would support the rational hypothesis (Meltzer and Richard Reference Meltzer and Richard1981), suggesting that opposition outside of experiments is due to other political complexities. On the other hand, if poor players oppose high taxes in this basic game, then this evidence would support the burden hypothesis (Bartels Reference Bartels2005), which holds that people focus on the burden of paying taxes more than the benefits of redistribution.
Additionally, we manipulate whether the same policies are labeled as “sharing” or “taxes” to test whether just the word “taxes” provokes opposition through its association with tax burdens. As in other framing experiments about taxes (e.g., Lorenz, Paetzel, and Tepe Reference Lorenz, Paetzel and Tepe2017; Paetzel, Lorenz, and Tepe Reference Paetzel, Lorenz and Tepe2018), the policy labels do not affect the payoffs, so the rational hypothesis does not predict differences between these conditions. In contrast, the burden hypothesis predicts greater opposition when the policy is labeled “taxes” if the negative associations with “taxes” magnify their perceived burden, whereas “sharing” may lessen the perceived burden with its benevolent connotations.
Finally, we examine whether participants learn to vote more rationally over time after seeing the benefits of taxes as the rounds of the game progress (e.g., Paetzel, Lorenz, and Tepe Reference Paetzel, Lorenz and Tepe2018). The rational hypothesis generally predicts that players will vote in their best interest from the start. However, a weaker version of the hypothesis predicts that, if not at first, participants will vote more rationally over time as they learn the benefits of taxes from experience. They could initially lack understanding or foresight and then become more rational as they learn from experience, showing a kind of limited rationality. In contrast, players who focus more on the burden of taxes would vote against profitable taxes from the start and then continue to do so with experience, to the extent that they feel the burden. Thus, the amount and speed of learning provide a measure of the competing influences of rationality and burden.
Experiment 1
Methods
We recruited 160 participants from the United States using Amazon’s Mechanical Turk in April 2018 (48% female; age: M = 35, SD = 11 years; Berinsky, Huber, and Lenz Reference Berinsky, Huber and Lenz2012). Replication data are available via the Harvard Dataverse (Carter et al. Reference Carter, Del Ponte and DeScioli2026). In a between-subject design, we randomly assigned participants to one of two conditions in which the same policies were labeled either “taxes” or “sharing.” Participants read the instructions (see the appendix), played the voting game, and then answered general questions about their decisions and demographics. We followed Carter and Del Ponte (Reference Carter and Del Ponte2022) by embedding the game in a Qualtrics survey using an iframe. The study took about 10 minutes. Participants earned 50 cents for completing the task, plus their earnings from the voting game for a total of $1.44 (SD = $0.12) on average. All studies were approved by the Institutional Review Board (IRB) for research involving human subjects.
The Voting Game
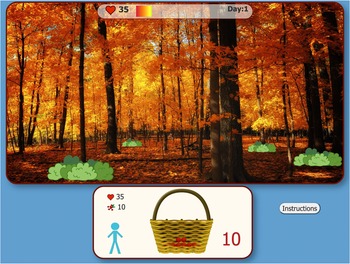
In the voting game, the player is a member of a village with nine people who gather food to survive. The player starts with 60 health points, which deplete due to metabolism by −35 points each round. To add to their health, the player searches for food in a woodland landscape containing five bushes. Figure 1 shows the web interface where the player gathers food. The player clicks a bush to search for berries, and the berries they find go into the player’s basket. In each round, the player receives high income (50 berries) or low income (25 berries), determined randomly without replacement, to yield five rounds with each income. Thus, we manipulate the player’s income across rounds as a within-subject treatment.
Web Interface in the Income Stage

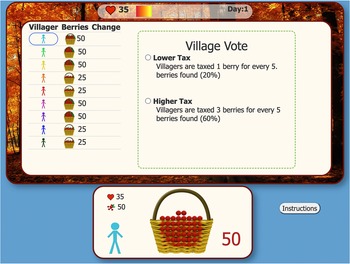
After searching for food, the player returns to the village to vote on how to tax their income. As we mentioned, the player knows the other members are computer players. Figure 2 shows the interface where the player votes. The player sees everyone’s income, which is 50 or 25 for each player, again determined randomly without replacement, so that four computer players earn 50 and four earn 25, dividing the group into rich and poor players.
Web Interface in the Voting Stage

Figure 2 Long description
The interface is set against a background of autumn trees. At the top center, a status bar displays a heart icon with the number 35 and a progress bar, with Day 1 noted on the right.
The main central panel is divided into two sections. On the left is a table with columns for Villager, Berries, and Change. It lists nine stick-figure villagers in different colors. The first three villagers each have a basket icon with 50 berries. The next two have 25 berries. The following two have 50 berries, and the final two have 25 berries.
On the right of the main panel is a dashed box titled Village Vote. It presents two radio button options. The first is Lower Tax, described as villagers being taxed 1 berry for every 5 berries found or 20 percent. The second is Higher Tax, described as villagers being taxed 3 berries for every 5 berries found or 60 percent.
Below the main panel is a smaller status box. It shows a heart icon with 35, a berry cluster icon with 50, a light blue stick figure, and a large basket filled with berries next to the number 50. To the right of this box is a button labeled Instructions.
The nine players vote for low taxes (20%) or high taxes (60%). The computer players are programmed to vote to maximize their wealth, so rich players vote for low taxes and poor players vote for high taxes. As a result, the computer players’ votes are evenly split, and the human player’s vote determines the winner. We make the votes close and pivotal to reinforce participants’ incentive to vote rationally. However, participants do not know precisely how the computer players vote. They read that the computer makes decisions “similar to how people make decisions in this game.” Nor do participants see how each player voted, like in real elections with secret ballots; thus, they could not be sure, even with experience, whether the computer players always voted in their interest. These features maintain a realistic voting scenario in which voters do not know for sure how others will vote.
After the players vote, the votes are tallied, and the community enacts the tax policy that received the most votes. The community taxes the villagers’ incomes and collects the revenue in a basket. Then, the revenue is redistributed evenly to everyone (figure 3). Each player eats their berries to gain 1 health point per berry. They can review a summary of their gains and losses from the taxes until they click to proceed to the next round.
Taxation and Redistribution

Figure 3 Long description
The interface is divided into three main sections against a background of autumn woods.
1. Top Status Bar: Displays a heart icon with the number 78, a color gradient bar from red to green, and the text Day 1.
2. Main Game Panel:
* Left Side: A table titled Villager, Berries, and Change. It lists nine stick-figure villagers in different colors. The first three and the seventh and eighth villagers show 43 berries and a change of minus 7. The fourth, fifth, ninth, and tenth villagers show 33 berries and a change of plus 8.
* Top Right: A box titled Vote Complete states that the results are 4 for lower Tax and 5 for Higher Tax, with the outcome being Higher Tax.
* Center: An empty brown wooden tub with text above stating 23 Berries are distributed to every villager.
* Bottom Right: A green dashed box titled Today summarizes the player's stats: You shared 30 berries, You received 23 berries, and Your net change after sharing was minus 7.
3. Bottom Player Panel: A separate white box shows a heart icon with 78, a berry icon with 0, a blue stick figure, and a large wicker basket with a red 0 next to it. An Instructions button is located to the right of this panel.
The player continues for 10 rounds, and they earn 1 cent per health point at the end of the game. To play a demo of the game, visit benjaminjcarter.com/TheVotingGame.html.
Finally, we randomly assigned participants to one of two versions of the game in which the same policies were labeled as “taxes” or “sharing.” The sharing label is meant to further distance the policies from politics, while the taxes label allows us to test whether just the word “taxes” reduces support for the same policy of redistribution.
Hypotheses
We use the voting game to test two opposing hypotheses: the rational hypothesis and the burden hypothesis. The rational hypothesis makes a point prediction that participants will consistently (100%) vote for high taxes when poor, and they will vote for low taxes when rich (Meltzer and Richard Reference Meltzer and Richard1981). This strong test compares to the benchmark, where participants vote rationally 100% of the time. The rational hypothesis also makes a weaker, directional prediction about our experimental manipulation of income: rational players will vote for high taxes more often when poor than when rich. Finally, the rational hypothesis predicts no effects of the policy label because it does not affect the payoffs.
In contrast to the rational benchmark, the burden hypothesis predicts that participants will vote for low taxes even when they are poor, because they will focus on the burden of paying taxes more than the benefits (Bartels Reference Bartels2005). Furthermore, if participants associate the word “taxes” with the burden of taxes, then poor players will oppose high taxes more often when they are called “taxes” than when the same policy is called “sharing.”
Results
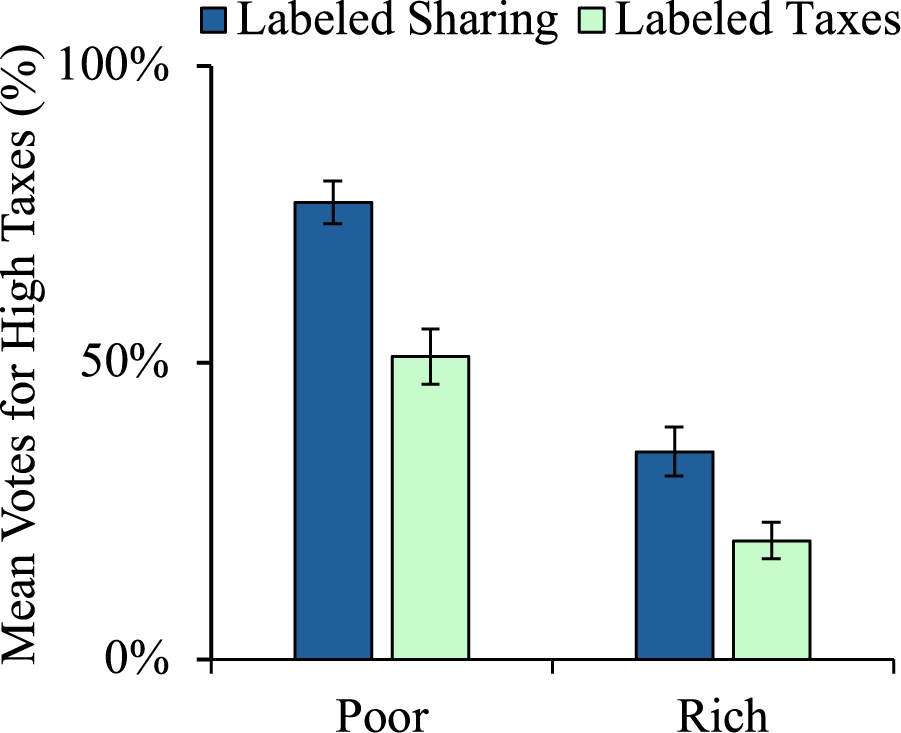
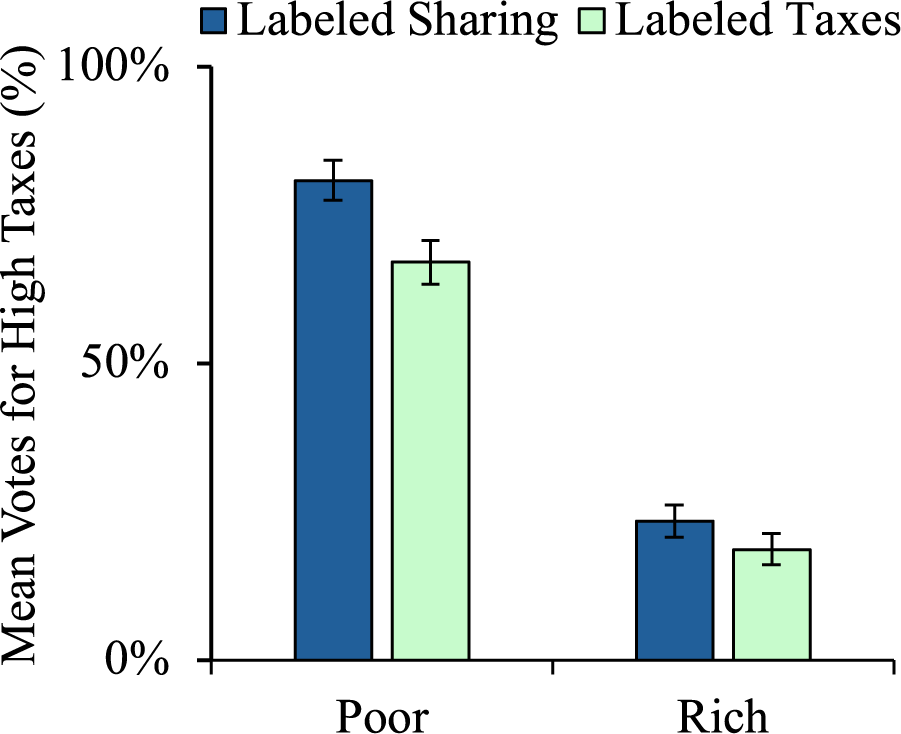
Figure 4 shows the mean percentage of rounds that participants voted for high taxes, depending on their income and the policy label. In general, participants were far from fully rational, which would mean supporting high taxes 100% when poor and 0% when rich. A substantial proportion of poor players opposed high taxes, roughly a quarter in the sharing condition and half in the taxes condition. This substantial opposition supports the burden hypothesis.
Mean Percentage of Rounds That Participants Voted for High Taxes by Income and Policy Label
Note: Bars are standard errors.

We also test the directional prediction for our experimental manipulation of income. Consistent with the rational hypothesis, participants were more likely to support high taxes when poor (M = 77%, SD = 32%) than when rich (M = 35%, SD = 37%); paired t(158) = 7.57, p < .001. Likewise, in the taxes condition, participants voted for high taxes more often when poor (M = 51%, SD = 41%) than when rich (M = 20%, SD = 27%); paired t(158) = 5.47, p < .001. Thus, participants did vote for high taxes more often when poor, providing some support for the rational hypothesis.
Turning to the policy label, poor players voted for high taxes less often when they were labeled as taxes compared to when they were labeled as sharing, t(158) = 4.44, p < .001. Additionally, rich players voted for high taxes less often when they were labeled as taxes compared to sharing, t(158) = 2.81, p < .01 (although this made the rich players more rational). The effect of the taxes label supports the burden hypothesis, because the label brings attention to the burden of taxes, while it should make no difference to rational voters (see the appendix for the results of each experiment broken down by party, sex, and age).
Thus, we find evidence of a mixture of dispositions: support for high taxes depended on income as rationality predicts, but a large fraction of poor voters opposed high taxes and more so when they were labeled “taxes,” consistent with the burden hypothesis.
Opportunistic Voting
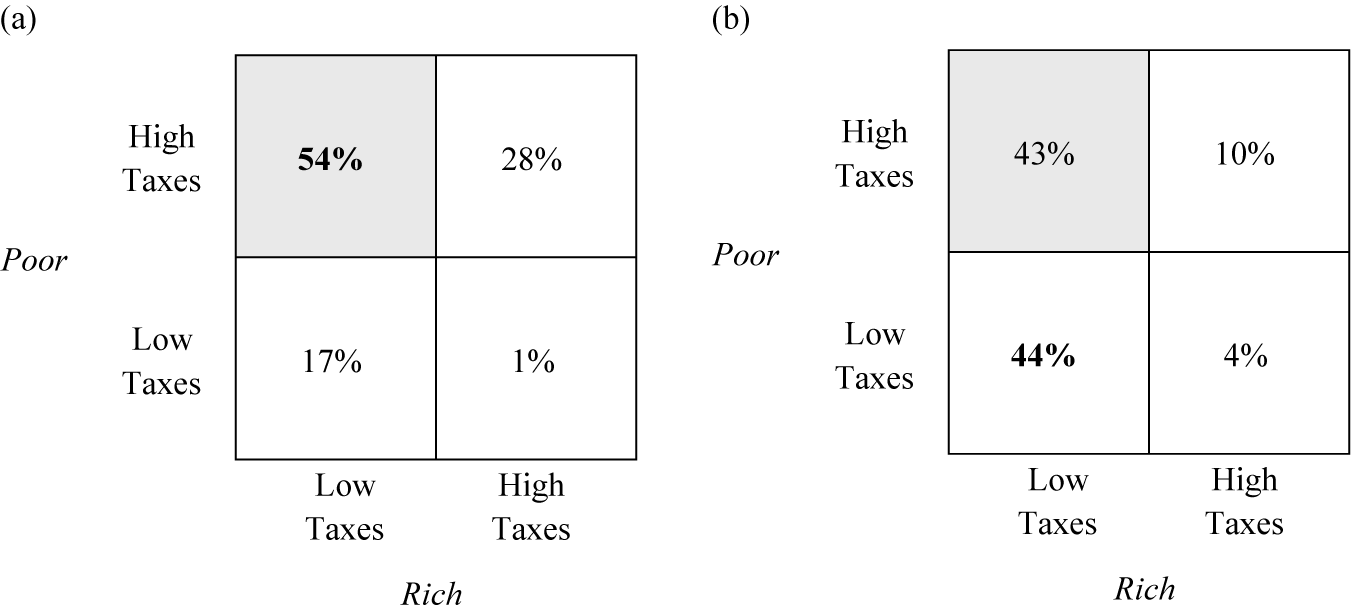
We look closer at rationality by considering participants’ combinations of choices when rich and poor. A rational player would vote opportunistically depending on their income: they vote for high taxes when poor and low taxes when rich. To examine opportunism, we categorize each participant by the majority of their votes (out of five) with each income, poor and rich. Figure 5 shows the percentage of participants who voted for high or low taxes most of the time when rich (x-axis) and when poor (y-axis). Opportunistic participants appear in the shaded quadrant (top left): they voted for high taxes when poor and low taxes when rich. The moderate percentages (54%, 43%) show that roughly half of the participants voted opportunistically.
Percentage of Participants Who Voted for High or Low Taxes in the Majority of Five Rounds When Poor and When Rich, and by the Policy Label
Note: The shaded quadrant (top left) is the percentage of participants who voted opportunistically.

When the policy was labeled as “sharing,” the modal strategy was to vote opportunistically. When the policy was labeled as “taxes,” participants were roughly split between voting opportunistically and voting for low taxes with both incomes (bottom left). Indeed, labeling the policy as taxes more than doubled the percentage of participants who voted for low taxes regardless of their income, thereby significantly reducing opportunistic voting, χ2 (3, N = 160) =17.60, p < .01. This evidence supports the hypothesis that the label “taxes” made participants associate the policy with a burden, causing more participants to oppose high taxes when both poor and rich. Without the “taxes” label, participants were more likely to change their votes according to their income to favor the policy that brought them more benefits.
Voting over Time
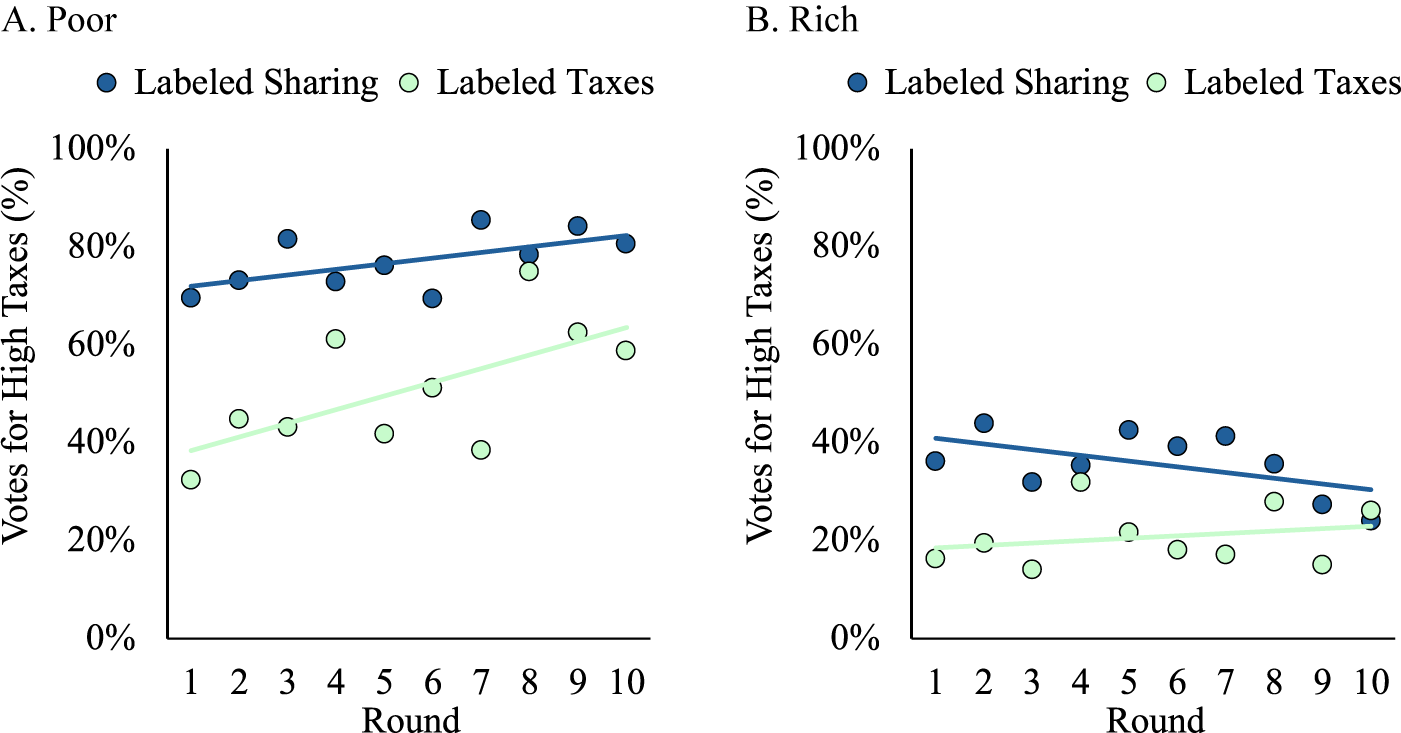
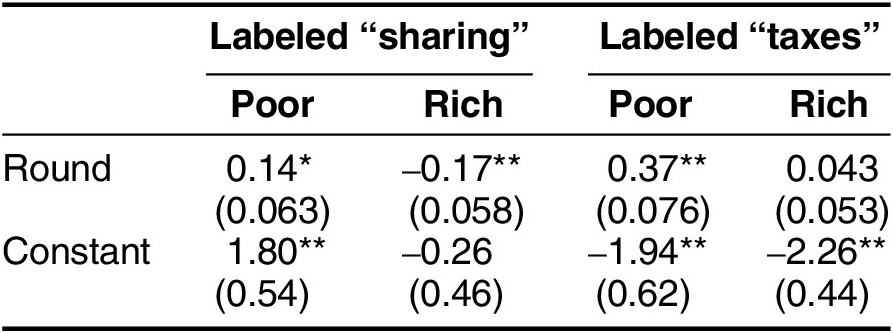
Next, we examine whether participants changed their choices over time. Figure 6 shows how participants’ votes changed over the 10 rounds, and table 1 reports logistic regressions for the effect of round within each condition.
Percentage Who Voted for High Taxes across Rounds by Income
Note: Lines show the best fit.

Figure 6 Long description
The figure consists of two panels, A and B. Both panels share the same axes: the x-axis represents Round from 1 to 10, and the y-axis represents Votes for High Taxes in percent from 0 to 100. Each panel contains two data series: Labeled Sharing represented by dark blue dots and a dark blue best-fit line, and Labeled Taxes represented by light green dots and a light green best-fit line.
Panel A, titled Poor:
* Labeled Sharing starts at approximately 70 percent in Round 1 and shows a linear increase to about 80 percent by Round 10.
* Labeled Taxes starts lower at approximately 35 percent in Round 1 and shows a steeper linear increase, reaching about 60 percent by Round 10.
Panel B, titled Rich:
* Labeled Sharing starts at approximately 40 percent in Round 1 and shows a linear decrease to about 30 percent by Round 10.
* Labeled Taxes starts at approximately 18 percent in Round 1 and shows a very slight linear increase, ending near 22 percent by Round 10.
Overall, the poor group shows much higher support for high taxes and an upward trend over time, while the rich group shows lower support with a declining trend in the sharing category.
Logistic Regression of Votes for High Taxes across Rounds

Table 1 Long description
The table is divided into two main labeling conditions: Labeled sharing and Labeled taxes. Each condition is further subdivided into Poor and Rich categories.
Row 1: Round.
- Labeled sharing: Poor is 0.14 with one asterisk; Rich is negative 0.17 with two asterisks.
- Labeled taxes: Poor is 0.37 with two asterisks; Rich is 0.043.
- Standard errors in the following row are 0.063, 0.058, 0.076, and 0.053 respectively.
Row 2: Constant.
- Labeled sharing: Poor is 1.80 with two asterisks; Rich is negative 0.26.
- Labeled taxes: Poor is negative 1.94 with two asterisks; Rich is negative 2.26 with two asterisks.
- Standard errors in the following row are 0.54, 0.46, 0.62, and 0.44 respectively.
Footnote indicates each condition has 80 participants and 400 observations. One asterisk denotes p less than .05 and two asterisks denote p less than .01.
Note. Each condition has 80 participants and 400 observations. The models include random effects for participants. Standard errors are in parentheses. * p < .05, ** p < .01.
In the sharing condition, participants were more likely to vote rationally as the rounds progressed, meaning poor players voted more often for high taxes and rich players voted less often for high taxes. This finding indicates that participants learned with experience to vote in their economic interest. In the taxes condition, poor players were also significantly more likely to vote for high taxes as the rounds progressed. Rich players showed no significant trend over time, perhaps because most of them opposed high taxes from the beginning.
Participants’ Comments
After the game, participants answered the question, “How did you make your decisions in the game?” with open-ended comments. We conducted an exploratory text analysis of their responses, hand-coding them into four categories relevant to the hypotheses: self-interest, minimize taxes, altruism, and other. Self-interest was the most common reason in both conditions. Participants were more likely to say that they minimized taxes when the policy was labeled taxes (26%) compared to sharing (4%), whereas they were more likely to say they voted altruistically when the policy was labeled sharing (23%) compared to taxes (4%). The complete analysis is presented in the appendix.
Discussion
In sum, poor players voted against high taxes about half the time when labeled taxes and a quarter of the time when labeled sharing. They were more likely to vote for high taxes when poor than when rich, showing some degree of rationality. They were also less likely to vote for high taxes labeled as taxes compared to sharing, consistent with an irrational avoidance of a tax burden.
We further see participants’ limited rationality when we assess their opportunistic voting as their income fluctuates between poor and rich across rounds. Roughly half the participants were opportunistic, voting for high taxes when poor and low taxes when rich. When the policy was labeled as taxes, opportunism decreased further, as more participants voted for low taxes, no matter their income. Finally, the fact that participants learned to vote more rationally as the rounds progressed also indicates an initial misunderstanding that some were able to correct with experience.
What stands out is participants’ opposition to high taxes, even in a simplified game where the benefits were as clear as possible. The mere mention of “taxes” is enough to make roughly half the poor players vote against the more profitable policy.
Experiment 2
We repeated the methods from Experiment 1 with a different sample: undergraduates from the National University of Singapore. We aimed to test whether opposition to profitable taxes is specific to the United States or is found in other cultures as well.
Singaporean students may be better prepared to understand the accounting of taxes in our voting game, given that they consistently perform at the top in international rankings of educational achievement (Deng and Gopinathan Reference Deng and Gopinathan2016). If so, they should vote more rationally, favoring high taxes when poor. Moreover, Singapore is dominated by a single party, and so taxes are not at the core of partisan conflict like in the United States, which might make these students less fixated on reducing their tax burden.
On the other hand, Singaporeans might dislike taxes as much as Americans. Singapore has some of the lowest taxes in the developed world (OECD 2020). Despite high income inequality (greater than in the United States), Singaporeans often oppose new taxes (Bei Yi Reference Bei Yi2017). For example, in a 2018 survey, 40% of Singaporeans opposed raising taxes to assist the elderly, 34% supported the policy, and 27% were neutral (Gee, Arivalagan, and Fengqing Reference Gee, Arivalagan and Fengqing2018).
More generally, the burden hypothesis holds that people’s opposition to beneficial taxes stems from basic elements of human cognition, including short-sightedness and a defensive sense of ownership. If so, then this opposition could occur across a variety of cultures and political systems.
Methods
We recruited 185 undergraduates at the National University of Singapore for an in-person study in February 2021 (55% female; age: M = 21, SD = 2 years). We paid participants in Singapore dollars: each earned $5 for participating, plus a bonus of 4 cents per health point in the game. Participants earned M = $8.32 (SD = $0.29). The study took about 10 minutes. The procedures, conditions, and game were the same as in Experiment 1, except participants played 6 rounds instead of 10 to save time.
Results
Figure 7 shows the mean percentage of rounds that participants voted for high taxes. Approximately one-fifth of poor players opposed high taxes labeled as sharing, and one-third of poor players voted against high taxes labeled as taxes.
Mean Percentage of Rounds That Participants Voted for High Taxes by Income and Policy Label
Note: Bars are standard errors.

Comparing across income groups, participants were more likely to support high taxes when poor (M = 81%, SD = 32%) than when rich (23%, SD = 26%), paired t(178) = 13.43, p < .001. When the policy was labeled taxes, participants voted for high taxes 67% of the time (SD = 36%) when poor, compared to 19% (SD = 26%) when rich, paired t(188) = 10.66, p < .001. Thus, participants voted for high taxes more often when they were poor than rich, supporting the rational hypothesis.
Turning to the policy label, poor players voted for high taxes less often when they were labeled taxes than when they were labeled sharing, t(183) = 2.73, p < .01. Rich players’ votes did not differ across the labels, t(183) = 1.26, p = .21.
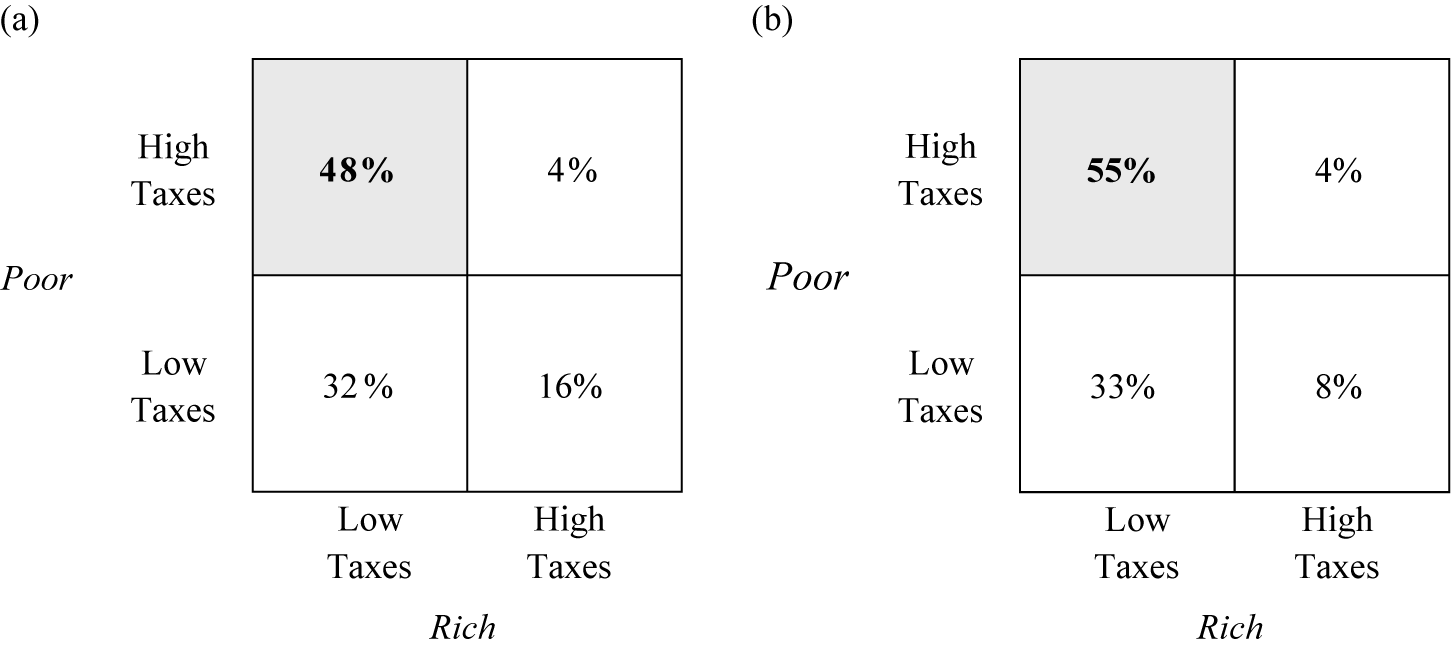
To look at opportunistic voting, we categorized participants by the majority of their votes (out of three rounds) with each income (figure 8). With the sharing label, 48% of participants were opportunistic: they voted for high taxes when poor and low taxes when rich. With the taxes label, 55% of participants were opportunistic. Opportunism did not significantly differ across the sharing and taxes labels, χ 2 (3, N = 185) = 4.87, p = .18.
Experiment 2: Participants’ Votes for High Taxes (%) by Income and Policy Label
Note: The shaded quadrant (top left) is the percentage of participants who voted rationally and opportunistically.

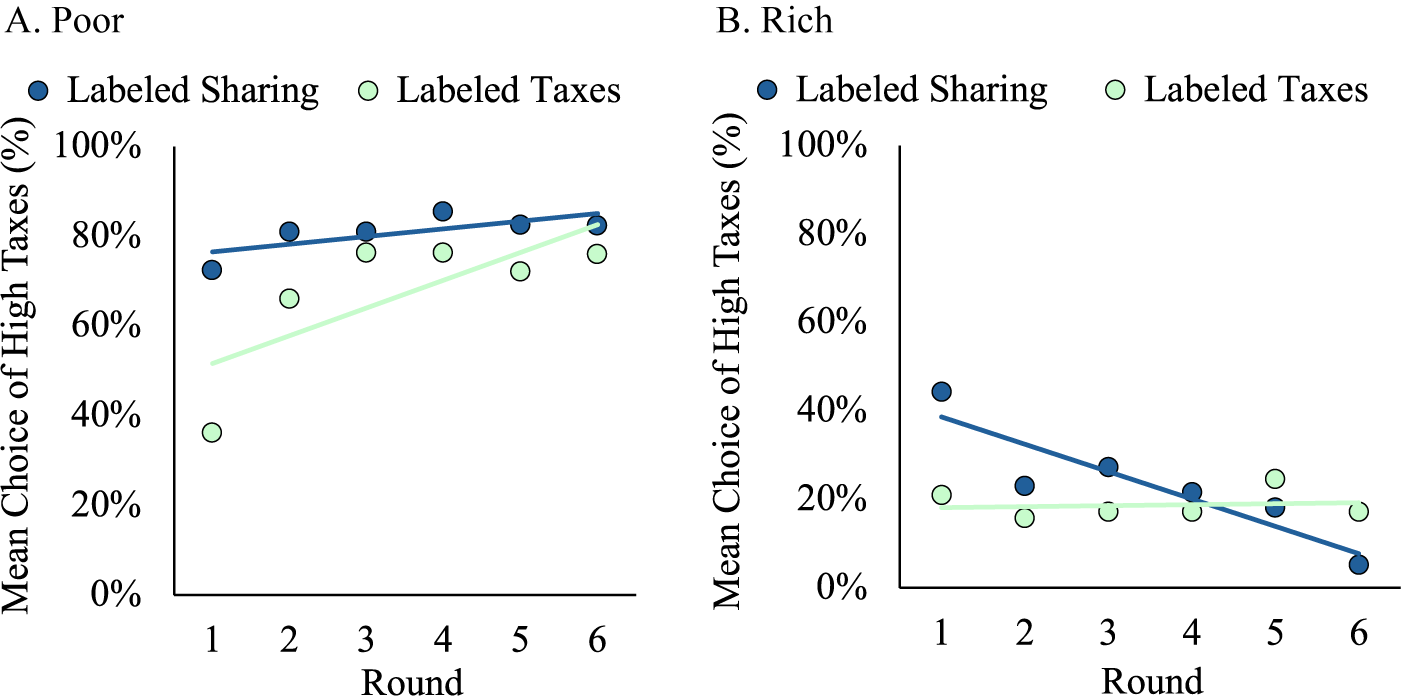
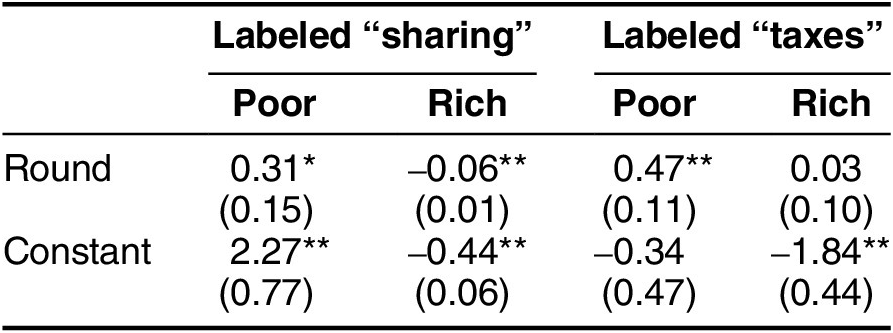
To examine voting over time, figure 9 shows average vote choices by round and condition, and table 2 presents logistic regressions for the effect of round within each condition. With both policy labels, poor players voted more often for high taxes as the rounds progressed, becoming more rational with experience. With the sharing label, rich players voted less often for high taxes over time, whereas with the taxes label, their votes did not change over rounds.
Percentage Who Voted for High Taxes across Rounds by Income
Note: Lines show the best fit.

Figure 9 Long description
The image contains two panels, A and B. Both panels share the same axes. The x-axis is labeled Round and ranges from 1 to 6. The y-axis is labeled Mean Choice of High Taxes percent and ranges from 0 percent to 100 percent. Each panel includes two data series: Labeled Sharing represented by dark blue dots and a dark blue best fit line, and Labeled Taxes represented by light green dots and a light green best fit line.
Panel A, titled Poor, shows high support for high taxes. The Labeled Sharing series starts at approximately 72 percent in Round 1 and shows a slight linear increase to about 82 percent by Round 6. The Labeled Taxes series starts lower at approximately 38 percent in Round 1 but shows a steep linear increase, reaching about 78 percent by Round 6.
Panel B, titled Rich, shows significantly lower support for high taxes. The Labeled Sharing series starts at approximately 45 percent in Round 1 and shows a sharp linear decrease, falling to nearly 5 percent by Round 6. The Labeled Taxes series remains relatively flat and stable, hovering around the 20 percent mark across all six rounds.
Logistic Regression of Votes for High Taxes across Rounds

Table 2 Long description
The table presents logistic regression coefficients and standard errors across two main experimental labels: Labeled sharing and Labeled taxes. Each label is further divided into Poor and Rich categories.
* Round Variable:
- Labeled sharing: Poor shows a coefficient of 0.31 with a p-value less than 0.05 and a standard error of 0.15. Rich shows a coefficient of negative 0.06 with a p-value less than 0.01 and a standard error of 0.01.
- Labeled taxes: Poor shows a coefficient of 0.47 with a p-value less than 0.01 and a standard error of 0.11. Rich shows a coefficient of 0.03 with a standard error of 0.10.
* Constant Variable:
- Labeled sharing: Poor shows a coefficient of 2.27 with a p-value less than 0.01 and a standard error of 0.77. Rich shows a coefficient of negative 0.44 with a p-value less than 0.01 and a standard error of 0.06.
- Labeled taxes: Poor shows a coefficient of negative 0.34 with a standard error of 0.47. Rich shows a coefficient of negative 1.84 with a p-value less than 0.01 and a standard error of 0.44.
The data includes 90 participants in the sharing condition and 95 in the taxes condition, with three observations per participant for each income level.
Note. Logistic regression with random effects for participants. There were 90 participants in the sharing condition and 95 participants in the taxes condition. For each participant, there are three observations for each income. Standard errors are in parentheses. * p < .05, ** p < .01.
In participants’ open-ended comments, self-interest was the most common reason they gave for their votes in both conditions (see appendix). Their reasons did not statistically differ across the taxes and sharing conditions.
Discussion
Overall, in the Singaporean sample, poor players voted somewhat rationally in that most voted for high taxes. However, about 20% to 30% of poor players opposed high taxes, indicating that they misunderstood the benefits of redistribution. Moreover, participants were more likely to oppose high taxes when the policy was labeled taxes compared to sharing, an irrationality consistent with the burden hypothesis.
When we looked at opportunistic voting, about half the participants voted rationally according to their income. Poor players voted more often for high taxes across rounds, indicating that some participants corrected their initial misunderstanding with experience.
Altogether, Singaporean participants were similar to the American participants in their opposition to high taxes. This suggests that the source of misunderstanding runs deeper than factors specific to the United States, such as American partisanship or education.
Experiment 3
Many participants in Experiments 1 and 2 voted against taxes that would benefit them, indicating a prevalent misunderstanding of taxes. It is possible, however, that part of their misunderstanding was due to an unusual aspect of our game: each player’s income fluctuated between high and low across rounds. This fluctuation served an important purpose: it allowed us to manipulate income within-subject and thus to directly test the effect of income on support for taxes, while eliminating numerous confounds that obscure this relationship in real voting.
Nonetheless, these fluctuations may have affected participants’ votes. For instance, a participant might have decided to oppose high taxes when rich, and then they assumed this policy was always best. Or a participant might have felt that they should be consistent, so they always voted the same way, rather than opportunistically.
In this experiment, we make the problem even simpler: the participant receives low income every round. Meanwhile, the other members of the group are split between rich and poor as before. Thus, the participant always earns the most money by voting for high taxes. In addition, participants now have more rounds with low income to learn the benefits of high taxes.
Methods
We recruited participants to complete a short study on Amazon’s Mechanical Turk in November 2019 (n = 160; 47% female; age: M = 36; SD = 10 years; <20 min). Participants earned 50 cents for completing the study plus their earnings from the game, M = $1.10; SD = $0.11. The study took about 10 minutes.
The procedures and game were the same as Experiment 1, except the participant received low income for all 10 rounds. As before, half of the other members of the group were rich and half were poor, and we manipulated between subjects whether the taxes were labeled as taxes or sharing.
Because the participant always receives the same income, we added randomness to the computer players’ decisions so that participants would see both policies enacted across rounds, giving them opportunities to learn which policy is most profitable. Specifically, the computer players voted in their own interest 90% of the time, which makes the participant’s vote decisive roughly half the time.
Results
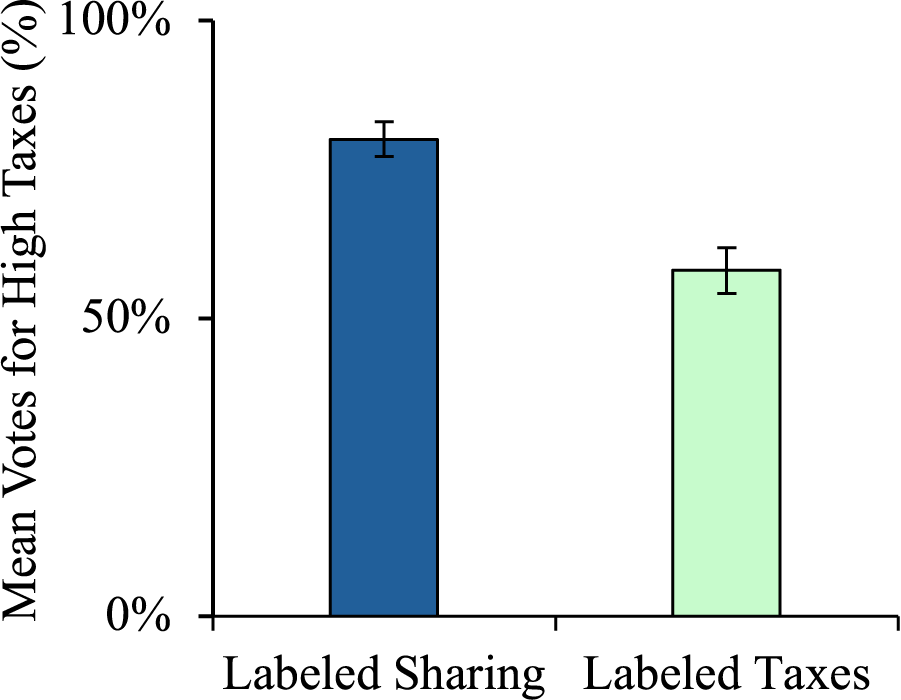
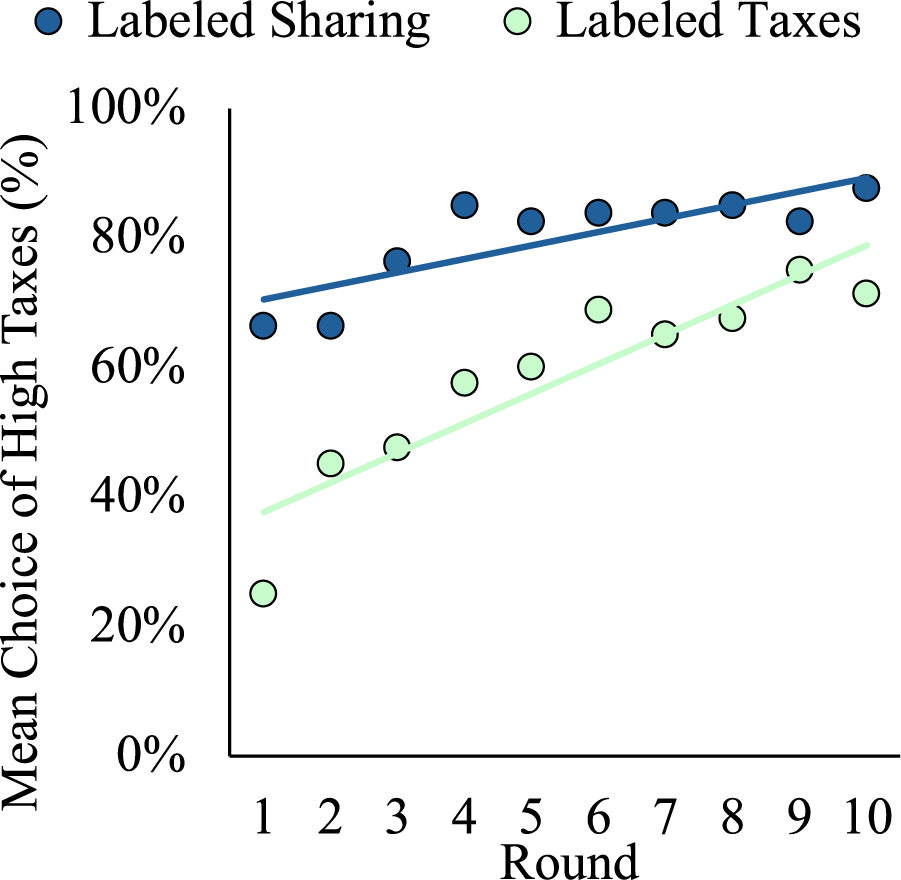
Figure 10 shows the mean percentage of the time that participants voted for high taxes across rounds. Recall that participants were always poor, so income did not vary as in the previous experiments, and high taxes were always the most profitable. When the policy was labeled sharing, participants voted for high taxes on average 80% (SD = 26.3%) of the time. When the policy was labeled taxes, participants voted for high taxes 58% (SD = 35%) of the time. Comparing across the policy labels, participants voted for high taxes less often when they were labeled taxes compared to sharing, t(158) = 4.46, p < .001.
Mean Percentage of Rounds That Participants Voted for High Taxes by Policy Label
Note: Participants were poor for all rounds, so high taxes were always the most profitable. Bars are standard errors.

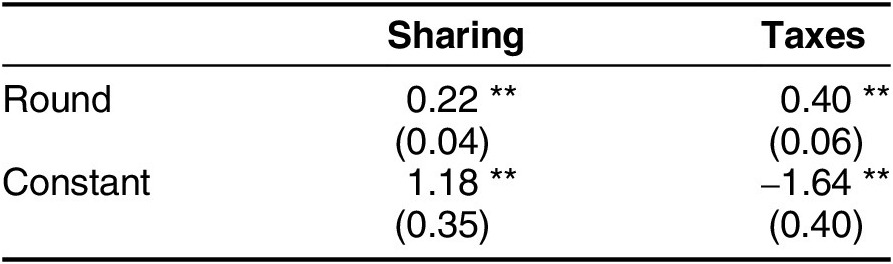
To examine voting over time, figure 11 presents average vote choices across rounds by condition, and table 3 presents logistic regressions for the effect of round within each condition. For both policy labels, participants voted for high taxes more often as the rounds progressed. However, participants in the taxes condition learned more over time than participants in the sharing condition, diminishing the differences between the conditions as rounds progressed.
Percentage Who Voted for High Taxes across Rounds by Condition
Note: The line shows the best fit.

Figure 11 Long description
The y-axis represents the Mean Choice of High Taxes in percent, ranging from 0 percent to 100 percent in increments of 20. The x-axis represents the Round, numbered 1 through 10. A legend at the top identifies two conditions: Labeled Sharing represented by dark blue circles and a dark blue line, and Labeled Taxes represented by light green circles and a light green line.
* Labeled Sharing: Data points begin at approximately 65 percent in Round 1, fluctuating upward to reach nearly 90 percent by Round 10. The best fit line shows a steady linear increase starting near 70 percent and ending near 90 percent.
* Labeled Taxes: Data points begin significantly lower at approximately 25 percent in Round 1, showing a steeper upward trend to reach approximately 70 percent by Round 10. The best fit line shows a strong linear increase starting near 38 percent and ending near 80 percent.
Overall, the Labeled Sharing condition maintains a higher percentage of high tax votes throughout all rounds, but the Labeled Taxes condition shows a faster rate of increase over time.
Logistic Regression of Votes for High Taxes across Rounds

Table 3 Long description
The table consists of three columns: Variable, Sharing, and Taxes.
Row 1: Round. Sharing column shows 0.22 with two asterisks and a standard error of 0.04. Taxes column shows 0.40 with two asterisks and a standard error of 0.06.
Row 2: Constant. Sharing column shows 1.18 with two asterisks and a standard error of 0.35. Taxes column shows negative 1.64 with two asterisks and a standard error of 0.40.
Footnote: In each condition, there were 80 participants and 400 observations. The models include random effects for participants. Standard errors are in parentheses. One asterisk indicates p is less than .05, and two asterisks indicate p is less than .01.
Note. In each condition, there were 80 participants and 400 observations. The models include random effects for participants. Standard errors are in parentheses. * p < .05, ** p < .01.
In participants’ open-ended comments, self-interest was the most common reason in both conditions. Participants were more likely to say that they minimized taxes when the policy was labeled taxes (19%) compared to sharing (3%); they were more likely to say they voted altruistically when the policy was labeled sharing (18%) compared to taxes (9%). See the appendix for the full analysis.
Discussion
Overall, a substantial fraction of participants continued to misunderstand taxes when they received low income for all 10 rounds. When the policy was labeled sharing, a strong majority of 80% voted for high taxes, showing considerable rational voting. When the policy was labeled taxes, participants’ support for high taxes declined 22 percentage points to 58%, meaning more than four in ten voted against their economic interest. This decline supports the burden hypothesis. Moreover, participants learned to vote for high taxes more often with experience, indicating that misunderstanding contributed to opposition in previous rounds.
General Discussion
Across three experiments, roughly half the poor players voted against high taxes that would benefit them. Specifically, when the policy was labeled taxes, poor players voted against high taxes 30% to 50% of the time across experiments. Additionally, they opposed high taxes more often when they were labeled “taxes” than when the same policy was labeled as “sharing," which decreased poor players’ opposition to about 20%. In Experiment 2, we found similar opposition among Singaporean participants, indicating that the sources of opposition extend beyond American culture. In Experiment 3, participants’ opposition continued at similar rates when they received low income every round, rather than fluctuating between rounds.
Thus, participants did not consistently vote rationally, as predicted by classical models in political economy (Meltzer and Richard Reference Meltzer and Richard1981). However, participants were not consistently irrational either. Although roughly half of poor players voted against their interest, the other half did vote for high taxes. Moreover, participants were far more likely to vote for high taxes when poor than when rich, and about half voted opportunistically, supporting high taxes when poor and low taxes when rich—as predicted by the rational hypothesis. Participants also learned to vote more rationally with experience as the rounds progressed.
Hence, these results show a mixture of opposing tendencies: irrational opposition and rational support for high taxes. This mixture falsifies both the simple theory that voters are rational and the opposite theory that rational voting is a myth. We suggest that realistic theories should capture the mixture of voters found in controlled experiments. This mixture may be related or analogous to the selfish and cooperative types found in experiments on social dilemmas (e.g., Fischbacher, Gachter, and Fehr Reference Fischbacher, Gachter and Fehr2001; Kurzban and DeScioli Reference Kurzban and DeScioli2008; Kurzban and Houser Reference Kurzban and Houser2005).
Moreover, the present experiments demonstrate this mixture not only in the percentages of voters but also in their responses to experimental manipulations. As predicted by the rational hypothesis, decreasing participants’ income greatly increased their support for high taxes. Yet, changing the label of the same policy from sharing to taxes decreased support for high taxes, as predicted by the burden hypothesis. Either hypothesis alone would make incorrect predictions about these manipulations: the burden hypothesis would miss the effect of income, whereas the rational hypothesis would miss the effect of the taxes label.
Further, recall the many factors that these experiments removed to isolate people’s understanding of taxes. In our voting game, there is no wasteful spending, no corruption, no racial tensions, and no decisions about whether to get a job. There are no political parties or confusing tax loopholes. Nor are there other human players to help or hurt. In essence, the participant simply votes for more money or less, and a large segment of poor players voted for less money. This finding shows another source of opposition to taxes, in addition to the usual suspects from previous research. These experiments support the burden hypothesis, which holds that people focus on the burden of paying taxes while missing the benefits (Bartels Reference Bartels2005). This source of opposition comes from basic elements of human cognition, including short-sightedness and a defensive sense of ownership.
Namely, two lines of evidence provide tentative support for the burden hypothesis. The first is the substantial percentage of poor players who opposed high taxes despite their economic interests. However, this departure from rational choice by itself could result from various sources. The second line of evidence supports the burden hypothesis more distinctly: participants became more opposed to high taxes when they were labeled as taxes compared to sharing. This experimental effect narrows down the causes to the word “taxes” and its psychological connotations.
Reflections on Taxes in Games and Politics
What do our results imply about citizens’ support for taxes? Crucially, many participants in these experiments focused on the burden, even though the voting game is much simpler than the tax policies studied in observational research. This suggests that people’s sense of tax burden may be stronger than previously supposed (Bartels Reference Bartels2005). It applies even when they receive public benefits immediately and in the same currency as the taxes they paid, which should make the profits more transparent. This deeper sense of tax burden could come from the psychology of property (DeScioli and Wilson Reference DeScioli and Wilson2011). People’s sense of property makes them especially value what they possess and motivates them to defend it (e.g., Hoffman et al. Reference Hoffman, McCabe, Shachat and Smith1994; Kahneman, Knetsch, and Thaler Reference Kahneman, Knetsch and Thaler1991). Therefore, they may perceive their tax burden as greater than the nominal value of the payment because it intrudes on their property.
As for other contributors, such as partisanship, distrust, and confusion, the present experiments suggest that these factors are not necessary to provoke opposition to taxes. We presume that they can certainly increase opposition, but even without them, people still oppose taxes that could benefit them. Future work could add these elements to the voting game to compare their relative influences within the same experimental environment.
Another element to consider is the type of economy in the game. We used a foraging economy with berries as the fictional currency for income and taxes, which corresponded to the real money at stake for participants. We chose this foraging theme to make the game easy to understand, but it differs from real taxes. As far as our hypotheses, the rational hypothesis predicts that the theme will not matter because rational players focus on the real money at stake, rather than on a fictional theme. The burden hypothesis predicts that the theme could affect participants’ decisions if it increases or decreases the perception of burden. We suggest that, if anything, the foraging theme might reduce the sense of burden by departing from standard taxes. Future work can look at a game with a monetary economy to consider this question.
The finding that poor voters often focused on tax burdens has potential implications for policy. In general, policy makers can examine whether any part of the tax system amplifies the sense of burden needlessly. For example, many citizens pay more taxes from their paychecks than they will ultimately owe. Consider that in the 2010s, an average of 33% of tax filers did not ultimately pay an income tax, receiving a full refund or even more in tax credits (Tax Policy Center 2022, table T22-0128; see also DeSilver Reference DeSilver2023; IRS 2024b). Yet some of these workers had hundreds of dollars withheld from their paychecks each month—approximately $200 per month for an income of $30,000 (IRS 2024a, 64). These overpayments are likely to mislead citizens to overestimate their tax burden, given our finding that people tend to overweigh the burden. This could contribute to resentment toward taxes and government spending. Accordingly, policy makers may be able to reduce the sense of burden by withholding only the correct amount of taxes. One idea is a program to encourage workers who earn less than the standard deduction (individual = $14,600 in 2024) to file for tax-exempt status so they will have no federal withholdings from their paychecks.
Future research can apply similar experimental methods to examine more sources of opposition to taxes. As we mentioned in the introduction, previous experiments have looked at factors such as wasteful spending, merit, effort, and risk (e.g., Durante, Putterman, and Van der Weele Reference Durante, Putterman and Van der Weele2014; Esarey Salmon, and Barrilleaux Reference Esarey, Salmon and Barrilleaux2012; Lefgren, Sims, and Stoddard Reference Lefgren, Sims and Stoddard2016; Tepe, Vanhuysse, and Lutz Reference Tepe, Vanhuysse and Lutz2021). Additionally, future research can add themes from politics such as political parties associated with the tax policies or add a threat that corrupt politicians could take from the tax revenues. By studying voting in virtual societies with real money at stake, researchers can uncover the psychological obstacles that prevent people from supporting policies that benefit them.
Data Replication
Data replication sets are available in Harvard Dataverse at: https://doi.org/10.7910/DVN/2GH0KJ.
Acknowledgments
We thank Jason Barabas, Andrew Delton, John Barry Ryan, and Alex Shaw for excellent feedback on earlier versions of this project. This research was supported by a grant from the International Foundation for Research in Experimental Economics (IFREE).
Author Contribution
Each author participated in the design, implementation, and analysis of the studies included in this manuscript.
Funding
This work was funded in part by the International Foundation for Research in Experimental Economics. This organization has since been retired and therefore cannot gain or lose anything from the publication of the manuscript.
Competing Interests
The authors declare no competing interests directly or indirectly related to the manuscript and work.
Ethics Approval
This study was approved and deemed ethical by the Stony Brook University Institutional Review Board.
Consent
The Authors secured informed consent from every participant.



 Open access

