

Fatty acids are essential components of membrane phospholipids. PUFA are classified into two series, n-6 and n-3 PUFA, based on their chemical structures. Animals and humans are unable to synthesise the essential n-3 fatty acids de novo, and so must obtain these fats from dietary sources. The conversion of linoleic acid (18 : 2n-6) or α-linolenic acid (18 : 3n-3) to long-chain PUFA shares a common enzymatic pathway (particularly for Δ6-desaturation), which is regarded as a rate-limiting step, hence there exists a competition between n-6 and n-3 fatty acids in vivo ( Reference Yamazaki, Fujikawa and Hamazaki 1 ). Thus, metabolism of both n-6 and n-3 PUFA must be taken into consideration. This concern is epidemiologically relevant because intakes of dietary n-6:n-3 PUFA ratio have been reported to exceed 10:1 over the past decades( Reference Astorg, Arnault and Czernichow 2 , Reference Blasbalg, Hibbeln and Ramsden 3 ). Normal body metabolism and functioning of the organs depends on maintaining a homeostatically balanced concentration of n-6 and n-3 PUFA( Reference Contreras and Rapoport 4 – Reference Igarashi, Ma and Chang 7 ), while excessive concentration of n-6 PUFA and an imbalance n-6:n-3 PUFA ratio have been associated with the development of cardiovascular, metabolic and neuropsychiatric disorders( Reference Simopoulos 8 , Reference Simopoulos 9 ). Further studies are, therefore, required to investigate the n-6:n-3 PUFA ratio in ration for livestock animals so as to maintain an appropriate balance of the n-6:n-3 PUFA ratio in animal products, and, consequently, supply high-quality animal-derived foods and provide new insight to improve the health of humans.
Previous studies have shown that dietary PUFA affects the fatty acid profile of the resultant muscle and fat tissues( Reference Huang, Zhan and Luo 10 ), and plays a vital role in the transport of fatty acids to many tissues via a protein-mediated mechanism( Reference Bonen, Chabowski and Luiken 11 ). A family of fatty acid transport proteins (FATP) is involved in the transport of fatty acids( Reference DiRusso, Li and Darwis 12 ). FATP are expressed in a tissue-specific pattern; for instance, FATP-1, -4 and -6 are co-expressed in muscle tissues( Reference Gimeno, Ortegon and Patel 13 , Reference Doege and Stahl 14 ), but FATP-1 and FATP-4 are predominantly expressed in white adipose tissue( Reference Lobo, Wiczer and Smith 15 ). Meanwhile, dietary PUFA composition promotes the hypertrophy of skeletal muscle( Reference Huang, Zhan and Luo 10 ), thus it enhances the amounts of total protein or amino acids of the tissues. Importantly, amino acids have the capacity to transduce signals to metabolic pathways (e.g. mammalian target of rapamycin complex 1) via transporters and to changes in the intracellular concentration of specific amino acids that regulate muscle or adipose protein synthesis( Reference Yin, Yao and Liu 16 – Reference Duan, Li and Liu 18 ). These transporters, also named ‘transceptors’, regulate the function of transporters and sensors, including system L amino acid transporter 1 (LAT1), proton-assisted amino acid transporter (PAT) and sodium-coupled neural amino acid transporter 2 (SNAT2; for a review, see Suryawan & Davis( Reference Suryawan and Davis 19 )). Therefore, in addition to the role as major substrates for energy production or protein synthesis, fatty acids and amino acids are involved in the modulation of structural and functional properties at the cellular level.
However, little is known about the effects of dietary n-6:n-3 PUFA ratio on the expression patterns of fatty acid and amino acid transporters. We previously reported that the n-6:n-3 PUFA ratio plays a key role in regulating lipid metabolism and inflammation in finishing pigs( Reference Duan, Li and Li 20 ). The purpose of the present study was to extend our previous studies, and investigate the effects of dietary n-6:n-3 PUFA ratio on fatty acid composition, free amino acid profile and gene expression patterns of fatty acid and amino acid transporters in the skeletal muscle and adipose tissues of finishing pigs. The present study seeks to provide consumers with high-quality animal food products containing an appropriate n-6:n-3 PUFA ratio, and ensure improved health status of humans.
Materials and methods
Animals and experimental diets
All procedures carried out in the present study were approved by the Animal Care Committee of the Institute of Subtropical Agriculture, the Chinese Academy of Sciences( Reference Deng, Yao and Chu 21 ). A total of ninety-six cross-bred (Large White × Landrace) male finishing pigs with a similar initial weight (73·8 (sem 1·6) kg) were selected and assigned into four treatment groups in a completely randomised design. Each treatment was replicated six times with four pigs each. A maize–soyabean meal-based diet containing 3·00 % linseed oil with no added soyabean oil was formulated to make a dietary n-6:n-3 PUFA ratio of 1:1 (diet 1). Also, three additional experimental diets were formulated such that 50, 75 and 90 % equivalent amounts of linseed oil contained in diet 1 was replaced with soyabean oil to make a dietary n-6:n-3 PUFA ratio of 2·5:1 (diet 2), 5:1 (diet 3) and 10:1 (diet 4), respectively. All the experimental diets were formulated to be isoenergetic and isonitrogenous and to meet the nutritional requirement of finishing pigs. Gross composition of the experimental diets is presented in online supplementary Table S1. Pigs were fed with the experimental diets ad libitum, and had unlimited access to clean drinking-water( Reference Wu, Yin and Li 22 ). The experiment lasted for 60 d.
Sample collection
Feed intake was recorded on a daily basis, while final body-weight gain was recorded on a weekly basis. The feed conversion ratio was computed as the feed consumed per unit weight gain( Reference Li, Xiong and Yang 23 ). From each replicate, a pig with a representative weight was selected, fasted overnight and killed at the end of the feeding trial. Pigs were electrically stunned (250 V, 0·5 A, for 5–6 s), exsanguinated and eviscerated. Subsequently, samples (about 5 g) of the longissimus dorsi muscle and subcutaneous adipose tissue were rapidly excised from the right side of the carcass. Visible inter-muscular adipose tissue between muscles was carefully removed. The samples were then placed in liquid N2 and stored at − 80°C until further analyses( Reference Tan, Yin and Liu 24 , Reference Tan, Li and Kong 25 ).
Fatty acid composition
Lipids were extracted from the longissimus dorsi muscle and subcutaneous adipose tissue samples by the chloroform–methanol (1:1, v/v) procedure. Fatty acid methyl esters were prepared for GC determination using KOH/methanol( Reference Demirel, Wachira and Sinclair 26 ).
Fatty acid methyl esters were analysed using an Agilent 6890N gas chromatographer, equipped with a flame ionisation detector (Agilent Technologies). A CP-Sil 88 fused silica open tubular capillary column (100 m × 0·25 nm; Chrompack) was used. The initial oven temperature was set at 45°C for 4 min, and then raised to 175°C at 13°C/min, held at 175°C for 27 min and then increased to 215°C at 4°C/min and then held at 215°C for 35 min. The injector and detector temperatures were set at 250°C. The carrier gas was hydrogen at a flow rate of 30 ml/min. Identification of individual fatty acid methyl esters was accomplished by the retention times of an authentic standard. The concentration of individual fatty acids was quantified according the peak area, and expressed as a percentage of total fatty acids( Reference Yin, McEvoy and Souffrant 27 ).
Free amino acid profile
Free amino acid profile was determined in the longissimus dorsi muscle. About 100 mg samples were dissolved in water with methanol (1:1) at 4°C for 30 min and centrifuged at 10 000 g for 10 min, then the supernatant was filtered through glass wool and stored at − 80°C until analyses( Reference Ren, Yin and Wu 28 ). After centrifugation to separate soluble from insoluble material, 40 μl of the supernatant were labelled with iTRAQ reagents (AA 45/32 kit; Applied Biosystems) as recommended by the manufacturer, and analysed on an Applied Biosystems 3200 Q TRAP LC/MS/MS system equipped with a RP-C18 column (length 150 mm, diameter 4·6 mm and particle size 5 mm)( Reference Sales, Pacheco and Blair 29 ).
Quantitative real-time PCR analysis
Total RNA was isolated from the muscle and adipose tissue using the RNeasy Mini Kit (Qiagen), according to the manufacturer's instructions. The quality and quantity of RNA were determined by ultraviolet spectroscopy using a NanoDrop® ND-1000 spectrophotometer (Thermo Fisher Scientific, Inc.). Thereafter, 1 μg of total RNA was used to produce complementary DNA using an RT-PCR system (Promega)( Reference Ren, Chen and Yin 30 ). Primer sequences for selected genes are listed in Table 1. The relative expression levels of the target genes were determined by real-time PCR performed using an ABI7900HT PCR system (Applied Systems). Real-time PCR was performed in duplicate for each complementary DNA sample, using SYBR Green I as PCR core reagents in a final volume of 20 μl. PCR conditions were as follows: incubation for 10 min at 95°C, followed by forty cycles of denaturation for 15 s at 95°C, annealing and extension for 60 s at 56–64°C. PCR amplification consisting of thirty-five cycles was conducted. mRNA expression levels of the target genes, expressed as arbitrary units, were acquired from the value of the threshold cycle (C t) of real-time PCR relative to that of β-actin using the comparative C t method, according to the following formula:
 $$\begin{eqnarray} 2^{ - \Delta \Delta C _{t}}(\Delta \Delta C _{t} = C _{t}\,_{gene\,of\,interest} - C _{t}\,_{\beta -actin})_{treated} - ( C _{t}\,_{gene\,of\,interest} - C _{t}\,_{\beta -actin})_{untreated} \end{eqnarray}$$
Primers used for real-time PCR

T A, annealing temperature; ACC, acetyl-CoA carboxylase; HSL, hormone-sensitive lipase; FATP, fatty acid transport proteins; LAT1, system L amino acid transporter 1; PAT, proton-assisted amino acid transporter; SNAT2, sodium-coupled neural amino acid transporter 2.
To normalise the expression levels of the target genes, the housekeeping gene β-actin was used as the internal control.
Statistical analysis
All analyses were performed in triplicate. Data obtained were analysed using one-way ANOVA using the SAS 8.2 software package (SAS Institute, Inc.). Results are presented as means with their standard errors. Differences between significant mean values were compared using Duncan's multiple range test. Differences were considered significant at P< 0·05.
Results
Effects of dietary n-6:n-3 PUFA ratios on the growth performance and carcass traits of pigs
The growth performance and carcass traits of pigs fed diets with varying n-6:n-3 PUFA ratios are presented in Table 2. Pigs fed the dietary n-6:n-3 PUFA ratio of 5:1 had the highest (P< 0·05) daily weight gain, while those fed the dietary n-6:n-3 PUFA ratios of 1:1, 2·5:1 and 10:1 exhibited low (P< 0·05) daily weight gain. The best (P< 0·01) feed conversion ratio was obtained with pigs fed the dietary n-6:n-3 PUFA ratio of 5:1. Furthermore, the loin muscle area of pigs fed the dietary n-6:n-3 PUFA ratio of 1:1 was higher (P< 0·05) than those of pigs fed the dietary n-6:n-3 PUFA ratio of 10:1. The highest (P< 0·01) intramuscular fat was observed in pigs fed the dietary n-6:n-3 PUFA ratio of 2·5:1. Pigs fed the dietary n-6:n-3 PUFA ratios of 5:1 and 10:1 had similar intramuscular fat with values higher (P< 0·01) than those obtained for pigs fed the dietary n-6:n-3 PUFA ratio of 1:1. However, the n-6:n-3 PUFA ratios had no effect (P>0·05) on backfat thickness.
Effects of dietary n-6:n-3 PUFA ratios on the growth performance and carcass trait of pigs (Mean values with their standard errors)
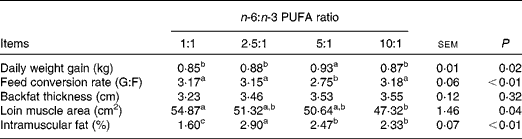
G:F, gain:feed intake.
a,b,cValues with unlike superscript letters within a row were significantly different (P< 0·05).
Effects of dietary n-6:n-3 PUFA ratios on tissue fatty acid profile
The fatty acid profile of the longissimus dorsi muscle of pigs fed with the different dietary n-6:n-3 PUFA ratios is presented in Table 3. MUFA including 16 : 1 and 18 : 1 were unaffected (P>0·05) by the different dietary n-6:n-3 PUFA ratios. SFA including 14 : 0, 16 : 0 and 18 : 0 were all enhanced (P< 0·05) in the longissimus dorsi muscles of pigs fed the dietary n-6:n-3 PUFA ratio of 2·5:1. The concentrations of most PUFA such as 18 : 3n-3, 20 : 3n-6, 20 : 4n-6, 20 : 5n-3, 22 : 5n-3 and 22 : 6n-3 were highest (P <0·01) in pigs fed the dietary n-6:n-3 PUFA ratio of 1:1. However, the highest (P< 0·05) value for 18 : 2n-6 was obtained in the tissue of pigs fed with the dietary n-6:n-3 PUFA ratios of 5:1 and 10:1. Generally, the n-6:n-3 PUFA ratio in the longissimus dorsi muscle of pigs decreased (P <0·01) with decreasing dietary n-6:n-3 PUFA ratios.
Effects of dietary n-6:n-3 PUFA ratios on the fatty acid profile of the longissimus dorsi muscle of pigs (% of total fatty acids) (Mean values with their standard errors)

a,b,c,d Mean values within a row with unlike superscript letters were significantly different (P< 0·05).
* SFA = 14 : 0+16 : 0+18 : 0.
† MUFA = 16 : 1+18 : 1.
‡ PUFA = 18 : 2+18 : 3+20 : 3+20 : 4+20 : 5+22 : 5+22 : 6.
§ ∑n-6:∑n-3 = (18 : 2+20 : 3+20 : 4):(18 : 3+20 : 5+22 : 5+22 : 6).
The fatty acid profile of the subcutaneous adipose of pigs fed with the different dietary n-6:n-3 PUFA ratios is presented in Table 4. The different dietary n-6:n-3 PUFA ratios had no effect (P>0·05) on the adipose tissue concentrations of SFA and MUFA. The subcutaneous adipose tissue concentration of 16 : 1 was enhanced (P< 0·01) in pigs fed the dietary n-6:n-3 PUFA ratios of 2·5:1, 5:1 and 10:1. The least concentration was recorded for 16 : 1, 18 : 1 and 18 : 2n-6 in the subcutaneous adipose tissue of pigs fed the dietary n-6:n-3 PUFA ratio of 1:1. The content of 18 : 2n-6 was greater in pigs fed the dietary n-6:n-3 PUFA ratios of 5:1 and 10:1 than in those fed the other two treatment diets. The content of 20 : 3n-6 was also boosted in the group fed with the dietary n-6:n-3 PUFA ratio of 10:1. The contents of 18 : 3n-3, 20 : 4n-6, 20 : 5n-3 and 22 : 5n-3 were highest (P< 0·05) in pigs fed the dietary n-6:n-3 PUFA ratio of 1:1. Consistent with the changes in the longissimus dorsi muscle, the ratio of n-6:n-3 PUFA in the adipose tissue also increased (P <0·01) with increasing dietary n-6:n-3 PUFA ratio.
Effects of dietary n-6:n-3 PUFA ratios on the fatty acid profile of the subcutaneous adipose tissue of pigs (% of total fatty acids) (Mean values with their standard errors)

a,b,c,dMean values within a row with unlike superscript letters were significantly different (P< 0·05).
* SFA = 14 : 0+16 : 0+18 : 0.
† MUFA = 16 : 1+18 : 1.
‡ PUFA = 18 : 2+18 : 3+20 : 3+20 : 4+20 : 5+22 : 5+22 : 6.
§ ∑n-6:∑n-3 = (18 : 2+20 : 3+20 : 4):(18 : 3+20 : 5+22 : 5+22 : 6).
Effects of dietary n-6:n-3 PUFA ratios on the free amino acid profile of longissimus dorsi muscle
Free amino acids were determined in the longissimus dorsi muscle tissue, as detailed in Table 5 and Fig. 1. Tasty amino acids included alanine, glycine, glutamate and aspartic acids. The dietary treatments did not change the amount of alanine and glycine (P>0·05). In addition, the concentration of glutamate in pigs fed the dietary n-6:n-3 PUFA ratio of 1:1 was enhanced compared with those fed the dietary n-6:n-3 PUFA ratio of 5:1. Aspartic acid concentration was also highest (P< 0·05) in pigs fed the dietary n-6:n-3 PUFA ratio of 2·5:1 (Fig. 1(A)). Branched-chain amino acids included leucine, isoleucine and valine. The dietary treatments did not affect the concentration of isoleucine (P>0·05). A significant trend was observed for leucine (P =0·06), with pigs fed the dietary n-6:n-3 PUFA ratio of 1:1 exhibiting the highest leucine concentration. Furthermore, reducing the dietary n-6:n-3 PUFA ratio (1:1) enhanced the content of α-amino-n-butyric acid and carnosine (P< 0·05; Fig. 1(B)). Ornithine concentration was highest in the tissue of pigs fed the dietary n-6:n-3 PUFA ratio of 2·5:1. A similar trend was observed for tryptophan (P =0·06).
Effects of dietary n-6:n-3 PUFA ratios on the free amino acid profile of the longissimus dorsi muscle of pigs (Mean values with their standard errors)

a,b,cMean values within a row with unlike superscript letters were significantly different (P< 0·05).
Effects of different dietary n-6:n-3 PUFA ratios on (A) tasty amino acids and (B) branched-chain amino acid concentrations in the longissimus dorsi muscle of pigs. The growing–finishing pigs were fed one of the four isoenergetic diets with the n-6:n-3 PUFA ratios of 1:1 (![]() ), 2·5:1 (
), 2·5:1 (![]() ), 5:1 (
), 5:1 (![]() ) and 10:1 (
) and 10:1 (![]() ). Values are means, with their standard errors represented by vertical bars (n 6). a,bMean values with unlike letters were significantly different (P< 0·05).
). Values are means, with their standard errors represented by vertical bars (n 6). a,bMean values with unlike letters were significantly different (P< 0·05).

Effects of dietary n-6:n-3 PUFA ratios on the gene expression levels of transporters
To gain further insight into the different impacts of varying n-6:n-3 PUFA ratios on fatty acid and amino acid profiles, we investigated the effects of the dietary treatments on the relative mRNA expression levels of transporters and other key genes. In the longissimus dorsi muscle, no significant difference was observed for the mRNA expression level of hormone-sensitive lipase (HSL; P>0·05; Fig. 2(B)). However, the relative expression level of acetyl-CoA carboxylase (ACC) was up-regulated in pigs fed the dietary n-6:n-3 PUFA ratios of 1:1 and 2·5:1 (P< 0·05; Fig. 2(A)), and the expression level of FATP-1 was lowest in pigs fed the dietary n-6:n-3 PUFA ratio of 1:1 (P< 0·05). However, no difference was observed for the expression level of FATP-4 (Fig. 3(A) and (B)). In the subcutaneous adipose, reducing the dietary n-6:n-3 PUFA ratio decreased the expression levels of ACC and FATP-1 (Figs. 2(C) and 3(C), respectively), the expression level of HSL was up-regulated in pigs fed the dietary n-6:n-3 PUFA ratios of 1:1 and 2·5:1 (P< 0·05), and the expression pattern of FATP-4 was similar to that of FATP-1 (Figs. 2(D) and 3(D), respectively).
Effects of different dietary n-6:n-3 PUFA ratios on the relative mRNA expression levels of acetyl-CoA carboxylase (ACC) and hormone-sensitive lipase (HSL) in (A, B) the longissimus dorsi muscle and (C, D) subcutaneous adipose tissue of pigs. The growing–finishing pigs were fed one of the four isoenergetic diets with the n-6:n-3 PUFA ratios of 1:1 (![]() ), 2·5:1 (
), 2·5:1 (![]() ), 5:1 (
), 5:1 (![]() ) and 10:1 (
) and 10:1 (![]() ). The real-time PCR method was employed, and β-actin was used as an internal control. Values are means, with their standard errors represented by vertical bars (n 6). a,bMean values with unlike letters were significantly different (P< 0·05).
). The real-time PCR method was employed, and β-actin was used as an internal control. Values are means, with their standard errors represented by vertical bars (n 6). a,bMean values with unlike letters were significantly different (P< 0·05).

Effects of different dietary n-6:n-3 PUFA ratios on the relative mRNA expression levels of fatty acid transport protein-1 (FATP-1) and FATP-4 in (A, B) the longissimus dorsi muscle and (C, D) subcutaneous adipose tissue of pigs. The growing–finishing pigs were fed one of the four isoenergetic diets with the n-6:n-3 PUFA ratios of 1:1 (![]() ), 2·5:1 (
), 2·5:1 (![]() ), 5:1 (
), 5:1 (![]() ) and 10:1 (
) and 10:1 (![]() ). The real-time PCR method was employed, and β-actin was used as an internal control. Values are means, with their standard errors represented by vertical bars (n 6). a,bMean values with unlike letters were significantly different (P< 0·05).
). The real-time PCR method was employed, and β-actin was used as an internal control. Values are means, with their standard errors represented by vertical bars (n 6). a,bMean values with unlike letters were significantly different (P< 0·05).

The dietary treatments did not change the relative mRNA expression levels of PAT1 and PAT2 in the longissimus dorsi muscle tissue of pigs (Fig. 4(B) and (C)). However, the expression level of LAT1 was higher in pigs fed the dietary n-6:n-3 PUFA ratio of 2·5:1 than in those fed the dietary n-6:n-3 PUFA ratio of 10:1. Reducing the dietary n-6:n-3 PUFA ratio also enhanced the expression level of SNAT2 (P< 0·05; Fig. 4(A) and (D)).
Effects of different dietary n-6:n-3 PUFA ratios on the relative mRNA expression levels of (A) system L amino acid transporter 1 (LAT1), (B) proton-assisted amino acid transporter 1 (PAT1), (C) PAT2 and (D) sodium-coupled neural amino acid transporter 2 (SNAT2) in the longissimus dorsi muscle of pigs. The growing–finishing pigs were fed one of the four isoenergetic diets with the n-6:n-3 PUFA ratios of 1:1 (![]() ), 2·5:1 (
), 2·5:1 (![]() ), 5:1 (
), 5:1 (![]() ) and 10:1 (
) and 10:1 (![]() ). The real-time PCR method was employed, and β-actin was used as an internal control. Values are means, with their standard errors represented by vertical bars (n 6). a,bMean values with unlike letters were significantly different (P< 0·05).
). The real-time PCR method was employed, and β-actin was used as an internal control. Values are means, with their standard errors represented by vertical bars (n 6). a,bMean values with unlike letters were significantly different (P< 0·05).

Discussion
There is an increasing awareness for the potential health benefits of the quantitative and qualitative characteristics of dietary fat, such as the ratio between n-6 and n-3 PUFA. The present study indicated that dietary n-6:n-3 PUFA ratios of 1:1–5:1 improved growth performance, loin muscle area and intramuscular fat percentage significantly, which is in agreement with previous reports( Reference Huang, Zhan and Luo 10 ).
n-3 and n-6 PUFA are obtained through diet. Linoleic acid (18 : 2n-6) is converted to γ-linolenic acid (18 : 3n-6) and dihomo-γ-linolenic acid (20 : 3n-6) to form the key intermediate arachidonic acid (20 : 4n-6) by various enzymes. The n-3 fatty acid α-linolenic acid (18 : 3n-3) is converted to stearidonic acid (18 : 4n-3) and eicosatetraenoic acid (20 : 4n-3), which further metabolised to DHA (22 : 6n-3). Various lines of evidence in the past literature favour the importance of the n-6:n-3 PUFA ratio and support the view that decreasing the ratio leads to increased protection against degenerative diseases( Reference Russo 31 ). Previous studies have confirmed that reducing dietary n-6 and elevating n-3 PUFA is highly successful in raising the quantities of 18 : 3n-3 and the long-chain n-3 PUFA in pork, thus supplying valuable n-3 PUFA to the human diet( Reference Huang, Zhan and Luo 10 , Reference Enser, Richardson and Wood 32 ). Additionally, increasing dietary n-3 PUFA significantly enhances the relative content of α-linolenic acid and long-chain n-3 fatty acids in the lipids of muscle and backfat at the expense of arachidonic acid( Reference Nuernberg, Fischer and Nuernberg 33 ). In the present study, we also observed that long-chain n-3 and n-6:n-3 PUFA concentrations were markedly improved in the longissimus dorsi muscle and subcutaneous adipose tissue of pigs fed the dietary n-6:n-3 PUFA ratios of 1:1 and 2·5:1, and long-chain n-6 PUFA concentrations were reduced accordingly.
Long-chain n-3 PUFA have been found to affect protein metabolism in the neonatal pig. This means long-chain n-3 PUFA are potential regulators of protein metabolism in pigs( Reference Bergeron, Julien and Davis 34 ). In addition, long-chain n-3 PUFA supplementation increased the muscle protein fractional synthesis rate, muscle protein concentration and the protein:DNA ratio via activating mammalian target of rapamycin signalling pathway in healthy older people( Reference Smith, Atherton and Reeds 35 ). Moreover, a diet enriched with n-3 PUFA has been shown to promote the hypertrophy of the longissimus dorsi muscle, quadriceps femoris muscle mass and semitendinosus muscle( Reference Huang, Zhan and Luo 10 ). All these findings confirm that n-3 PUFA have a direct impact on muscle protein anabolism. Further studies have also provided information on the impact of fatty acids on muscle function. PUFA are able to enhance the proliferation and induce the differentiation of skeletal muscle cells through the activation of the key signalling pathway( Reference Lee, Tachibana and Morinaga 36 ). n-3 PUFA significantly stimulate L6 skeletal muscle cell differentiation and membrane composition via activating mammalian target of rapamycin complex 1 signalling pathway( Reference Briolay, Jaafar and Nemoz 37 ). However, all these studies did not investigate the amino acid profile of the muscle tissue or cells. However, the present study indicated that concentrations of branched-chain amino acids including leucine and valine were highest in the longissimus dorsi muscle of pigs fed the dietary n-6:n-3 PUFA ratio of 1:1, and the concentrations of tasty amino acids including glutamate and aspartic acid were elevated in pigs fed the dietary n-6:n-3 PUFA ratios of 1:1 and 2·5:1. Branched-chain amino acids could act as signalling molecules in the regulation of cellular processes through the modulation of intracellular cell signalling pathways, facilitating skeletal muscle protein anabolism( Reference Rennie, Bohé and Smith 38 ). However, tasty amino acids have been reported to be positively associated with meat flavour( Reference Troy, Pearce and Byrne 39 ).
Long-chain fatty acids comprise the main energy sources of the human body, requiring the synthesis of structural lipids. Central to the balance of lipid metabolism is the rate of long-chain fatty acid influx, efflux and metabolism by adipocytes in adipose tissue and intramuscular fat. As with glucose, fatty acids are also cleared from the circulation after a meal or when the demand for this substrate is needed( Reference Bickerton, Roberts and Fielding 40 ); however, it is unknown whether an increased rate of fatty acid uptake requires an elevated FATP expression level. In the present study, we observed that FATP-1 expression level was raised in the longissimus dorsi muscle of pigs fed the dietary n-6:n-3 PUFA ratio of 10:1, and the expression levels of both FATP-1 and FATP-4 were increased in pigs fed the dietary n-6:n-3 PUFA ratios of 5:1 and 10:1. FATP are a family of membrane-bound proteins that catalyse the ATP-dependent esterification of long-chain fatty acids and very-long-chain fatty acids to their acyl-CoA derivatives, and they have been shown to stimulate fatty acid transport( Reference Hall, Smith and Bernlohr 41 ). The lipid carriers FATP-1 and FATP-4 are involved in the placental transfer of long-chain PUFA( Reference Larqué, Krauss-Etschmann and Campoy 42 ), and the overexpression of FATP-1 and FATP-4 elevates cellular fatty acid uptake and acyl-CoA synthetases in adipocytes( Reference Zhan, Poppelreuther and Ehehalt 43 ). In addition, increasing skeletal muscle FATP-1 enhances the rate of long-chain fatty acid transport and channels, but not intramuscular lipid accumulation( Reference Sebastián, Guitart and García-Martínez 44 ), and FATP-4 is apparently more important as a fatty acyl-CoA synthetase directing lipids for lipid metabolic pathways( Reference Jeppesen, Jordy and Sjøberg 45 ). Therefore, both FATP-1 and FATP-4 facilitate the fatty acid metabolism of tissues, especially for skeletal muscle or adipose tissue. Meanwhile, we found that lower dietary n-6:n-3 PUFA enhanced the expression level of ACC in the longissimus dorsi muscle, increased HSL expression level but reduced ACC expression level in subcutaneous adipose tissue. It is known that HSL and ACC are rate-limiting enzymes of lipid metabolism( Reference Numa, Nakanishi and Hashimoto 46 ). HSL is an intracellular enzyme that regulates the release of NEFA from lipid stores, and ACC is the key enzyme for the de novo biosynthesis of long-chain fatty acids. n-3 PUFA can enhance lipolysis through increasing the expression level of HSL and decreasing the expression of ACC ( Reference Wang, Kuo and Chen 47 ). Moreover, n-3 PUFA increases insulin sensitivity and then the activity of HSL( Reference Badin, Louche and Mairal 48 ).
At present, the impact of PUFA on amino acid transporters is poorly understood and very little information exists. It is interesting to find that the mechanisms regulating the abundance of amino acid transporters in the skeletal muscle in vivo. A previous study has reported that n-3 PUFA, especially DHA, modulate glutamate transporter subtypes via different mechanisms( Reference Berry, Hayes and Murphy 49 ), indicating that n-3 PUFA directly modulate various ion channels. The expression levels of amino acid transporters such as LAT1, PAT1 and SNAT2 are rapidly and transiently up-regulated following an increase in the availability of essential amino acids in the skeletal muscle, and the increased expression levels of amino acid transporters may contribute to enhanced amino acid sensitivity( Reference Drummond, Fry and Glynn 50 ). Our observations indicated that lower dietary n-6:n-3 PUFA up-regulated the expression levels of LAT1 and SNAT2; however, no significant difference was observed for PAT1 and PAT2. SNAT2 is a principal isoform of the system A amino acid transporter and also a classical amino acid transceptor that is expressed in most extraneural tissues including skeletal muscle. An important role of SNAT2 and LAT1 is observed in the intracellular accumulation of essential amino acids, such as the branched-chain amino acid leucine, and the elevated abundance of SNAT2 and LAT1 is regulated in the skeletal muscle of neonatal pigs( Reference Suryawan, Gazzaneo and Almonaci 51 ). Generally, PAT families facilitate the transport of simple amino acids such as alanine, glycine and proline, and have potent effects on growth( Reference Goberdhan, Meredith and Boyd 52 ). However, there are few studies of PAT in mammalian species. PAT1 has been reported to function as part of the ‘nutrisome’ and to physically interact with the Rag–Ragulator complex( Reference Ögmundsdóttir, Heublein and Kazi 53 ). The abundance of PAT2 is highly expressed in the skeletal muscle of neonatal pigs and developmentally regulated( Reference Suryawan and Davis 54 ). These observations suggest the importance of transporter function in the uptake and metabolism of muscle and adipose tissue fatty acids and amino acids.
In conclusion, optimal n-6:n-3 PUFA, i.e. 1:1–5:1, modulated the fatty acid and free amino acid profile, and altered the expression levels of FATP-1 and FATP-4 and amino acid transceptor proteins LAT1 and SANT2. It also facilitated the absorption and utilisation of fatty acids and free amino acids, leading to an improved muscle:adipose ratio of the body. This will lead to the production of improved pork quality from the pig industry and, consequently, improved the health status of humans. Future studies are needed to explore the impact of the n-6:n-3 PUFA ratio on the crosstalk between skeletal muscle cells and adipocytes.
Supplementary material
To view supplementary material for this article, please visit http://dx.doi.org/10.1017/S0007114514004346
Acknowledgements
The present study was jointly supported by the National Basic Research Program of China (2012CB124704 and 2013CB127305), the National Nature Science Foundation of China (31372325, 31110103909 and 31330075) and the Chinese Academy of Sciences Visiting Professorships for Senior International Scientists (2013T2S0012).
The authors' contributions are as follows: Y. Y. and F. L. were in charge of the whole trial; F. L. and Y. D. wrote the manuscript; Y. L., Y. T. and M. G. assisted with the animal trial and biochemical analyses; S. W. K. and O. A. O. revised the manuscript.
The authors have no conflicts of interest to declare.
The Chinese Academy of Science STS Project (KFJ-EW-STS-063)


