

Introduction
Forest fragmentation and loss are occurring at accelerating rates in tropical rainforests. The combined effects of these forest conversion processes are among the main drivers of biodiversity loss (Laurance, Reference Laurance1999; Brinck et al., Reference Brinck, Fischer, Groeneveld, Lehmann, De Paula and Pütz2017). Forest fragmentation also creates edge effects resulting from the interaction of abiotic and biotic variables between adjacent ecosystems (Murcia, Reference Murcia1995; Ries et al., Reference Ries, Fletcher, Battin and Sisk2004). Edge effects can cause major changes in the ecology and biogeography of many tropical species (Laurance et al., Reference Laurance, Nascimento, Laurance, Andrade, Ewers and Harms2007; Ewers & Didham, Reference Ewers and Didham2008; Crowley et al., Reference Crowley, McGoogan and Lehman2012).
Understanding how plants and animals respond to forest fragmentation and edge effects is crucial for conservation planning (Ries et al., Reference Ries, Murphy, Wimp and Fletcher2017). Although tropical dry forest is the most threatened ecosystem (Sagar & Singh, Reference Sagar and Singh2006), there are relatively few data on edge effects in tropical dry forests compared to humid, lowland forests (Malcolm et al., Reference Malcolm, Valenta and Lehman2017). Unlike humid forests, tropical dry forests are largely constrained by the availability of ground water, which affects plant biomass, stem density and species composition (Williams-Linera & Lorea, Reference Williams-Linera and Lorea2009). Little is known about how animals respond to edge effects in tropical dry forests (Maffei et al., Reference Maffei, Noss, Cuéllar and Rumiz2005). Changes in rainfall and ambient air temperature caused by global warming may create further challenges for plant and animal communities in edge habitats in tropical dry forests (Valenta & Lehman, Reference Valenta, Lehman, Lehman, Radespiel and Zimmermann2016). Thus, there is an urgent need to examine the impact of forest fragmentation and edge effects on plant and animal communities in these forests.
Studies of forest fragmentation should consider edge effects because fragment area (patch size) relates to edge effects in two ways: firstly, small forest patches tend to have small population sizes and high extinction probabilities (MacArthur & Wilson, Reference MacArthur and Wilson1967). Secondly, small patches also have a high ratio of fragment perimeter to area, resulting in a higher proportion of edge habitats in these patches (Gascon et al., Reference Gascon, Williamson and da Fonseca2000). This proportion increases with any further reduction in the size of a forest patch, resulting in small forest patches consisting largely of edge habitats with few or no interior or core area habitats. Animals unable to adapt to pervasive and increasing edge effects may be extirpated from small patches (Forman & Godron, Reference Forman and Godron1981) or may have to increase their movement between isolated patches. The combination of increasing edge effects in forest fragments and animal movements relating to these ecological changes may further increase the overall effects of forest fragmentation beyond forest loss (i.e. area effects), particularly at a landscape scale (Fahrig, Reference Fahrig2003).
Interactions between edge effects and animal dispersal patterns are a critical yet largely unexplored aspect of conservation genetics. Several empirical studies have examined cross-edge spillover of insect predators and spatial patterns of seed dispersal between active and fallow agricultural fields (Rand et al., Reference Rand, Tylianakis and Tscharntke2006; Gorchov et al., Reference Gorchov, Rondon, Cornejo, Schaefer, Janosko and Slutz2013). In all of these studies stronger edge effects were reported between natural and anthropogenic habitats; however, a lack of genetic research has led to an inability to extend these studies from basic biogeographical patterns to genetic variation of animals in fragmented landscapes. When residing in patches, animals in established ranges have a low probability of attempting dispersal to other fragments because they have the necessary resources and mating opportunities for survival nearby (Kareiva et al., Reference Kareiva, Mullen and Southwood1990). Individuals lacking established ranges are more likely to disperse further to acquire resources and mates (i.e. they are nomadic) (Johnson & Gaines, Reference Johnson and Gaines1990). The ability to model accurately how edge effects influence dispersal dynamics and genetic variation will benefit our understanding of the diverse processes affecting fragmented ecosystems.
Lemurs are an important group for studying edge effects because they are endemic to Madagascar, which contains some of the rarest and most fragmented forest ecosystems (Schwitzer et al., Reference Schwitzer, Mittermeier, Johnson, Donati, Irwin and Peacock2014). Studies of grey mouse lemurs Microcebus murinus and Endangered golden brown mouse lemurs Microcebus ravelobensis indicate both intra- and interspecific variations in their distribution, abundance and edge effects in north-western Madagascar (Rendigs et al., Reference Rendigs, Radespiel, Wrogemann and Zimmermann2003; Rakotondravony & Radespiel, Reference Rakotondravony and Radespiel2009; Burke & Lehman, Reference Burke and Lehman2014). These small (30–70 g) nocturnal lemurs are sympatric throughout much of their range, but they exhibit a negative relationship in abundance in continuous forests (Rakotondravony & Radespiel, Reference Rakotondravony and Radespiel2009; Burke & Lehman, Reference Burke and Lehman2014) and a positive relationship in abundance in fragmented forests (Steffens & Lehman, Reference Steffens, Lehman, Lehman, Radespiel and Zimmermann2016). Microcebus ravelobensis forms mixed-sex sleeping groups and has moderately male-biased dispersal (Radespiel et al., Reference Radespiel, Ehresmann and Zimmermann2003a, Reference Radespiel, Jurić and Zimmermann2009). Conversely, M. murinus usually sleeps alone or in female groups of related individuals, and males are generally the dispersing sex (Radespiel et al., Reference Radespiel, Cepok, Zietemann and Zimmermann1998, Reference Radespiel, Sarikaya, Zimmermann and Bruford2001a, Reference Radespiel, Lutermann, Schmelting, Bruford and Zimmermann2003b). Mouse lemurs have been found to disperse up to 1 km (Schliehe-Diecks et al., Reference Schliehe-Diecks, Eberle and Kappeler2012). Both species of mouse lemur respond differently to edge effects, as demonstrated (Burke & Lehman, Reference Burke and Lehman2014) by different capture rates for both species in interior vs edge habitats in the Ankarafantsika National Park: 82% of M. murinus were captured in interior habitats, whereas 72% of M. ravelobensis were captured in edge habitats. This indicates that M. ravelobensis is a suitable model taxon for more detailed studies of edge effects and raises the question as to whether or not this species also exhibits genetic variations between edge and interior habitats.
Here, we use population genetics tools to infer molecular edge effects in M. ravelobensis in a single forest in north-western Madagascar. To our knowledge, no previous study has tested how edge effects influence small-scale genetic variations in an animal species. In particular, we test three alternative scenarios to see which best fits the observed genetic patterns:
(1) Null model: in contrast to interior habitats, animals cannot immigrate from all directions into edge habitats because of the proximity of an inhospitable matrix. These spatial constraints lead to differences in dispersal opportunities and routes between edge and interior habitats. As a consequence, mouse lemur samples from edge habitats should have lower genetic diversity than mouse lemur samples from interior habitats. However, because of regular small-scale dispersal between adjacent forest areas, no genetic differentiation is expected between edge and interior habitats.
(2) Edge preference model: if the edge is the preferred habitat type (e.g. because of more abundant food resources), immigration into edge habitats can be expected to occur more frequently than emigration away from edge habitats. As a consequence of this net influx, genetic diversity should be equal or even higher in edge habitats compared to the interior.
(3) Local preference model: if individuals prefer their natal habitat type over a different habitat type, this should result in rare movements between edge and interior habitats. As a result, some genetic differentiation between both habitat types, low genetic exchange between habitat types and lower genetic diversity in edge than in interior habitats can be expected because of limited dispersal options for animals living in edge habitats.
Methods
Study site and sampling
The study was conducted in the 1,040 km2 Ankarafantsika National Park, which contains the largest remaining tract of dry deciduous forest in north-western Madagascar. Three sampling sites were selected, all located within the same forest (Fig. 1). The first site was a linear transect situated close to the edge (Edge), the second site was a transect located 320–600 m away from the edge (600m) and the third site was a partition of Jardin Botanique A (JBA), with a distance of 1,200–1,300 m from the forest edge. To replicate the linear capture regime along the edge as closely as possible, sampling at the two other sites was also conducted in a transect-like fashion along an approximately north–south axis (Fig. 1). Mean home range sizes of M. ravelobensis have been estimated by radiotelemetry at 0.44–2.1 ha (Ehresmann, Reference Ehresmann2000; Weidt et al., Reference Weidt, Hagenah, Randrianambinina, Radespiel and Zimmermann2004), depending on sex, season and site. Based on the maximum average value and assuming a circular home range, animals that are found > 164 m (estimated home range diameter) away from their maternal relatives were assumed to have dispersed. This means that a different transect can be reached only by dispersal, but not during the daily activities within the natal home range.
Map of the study area with the trap locations for Microcebus ravelobensis in three forest sites: Edge (along the forest edge), 600m (interior site 320–600 m away from the forest edge) and JBA (interior site 1,200–1,300 m away from the forest edge).
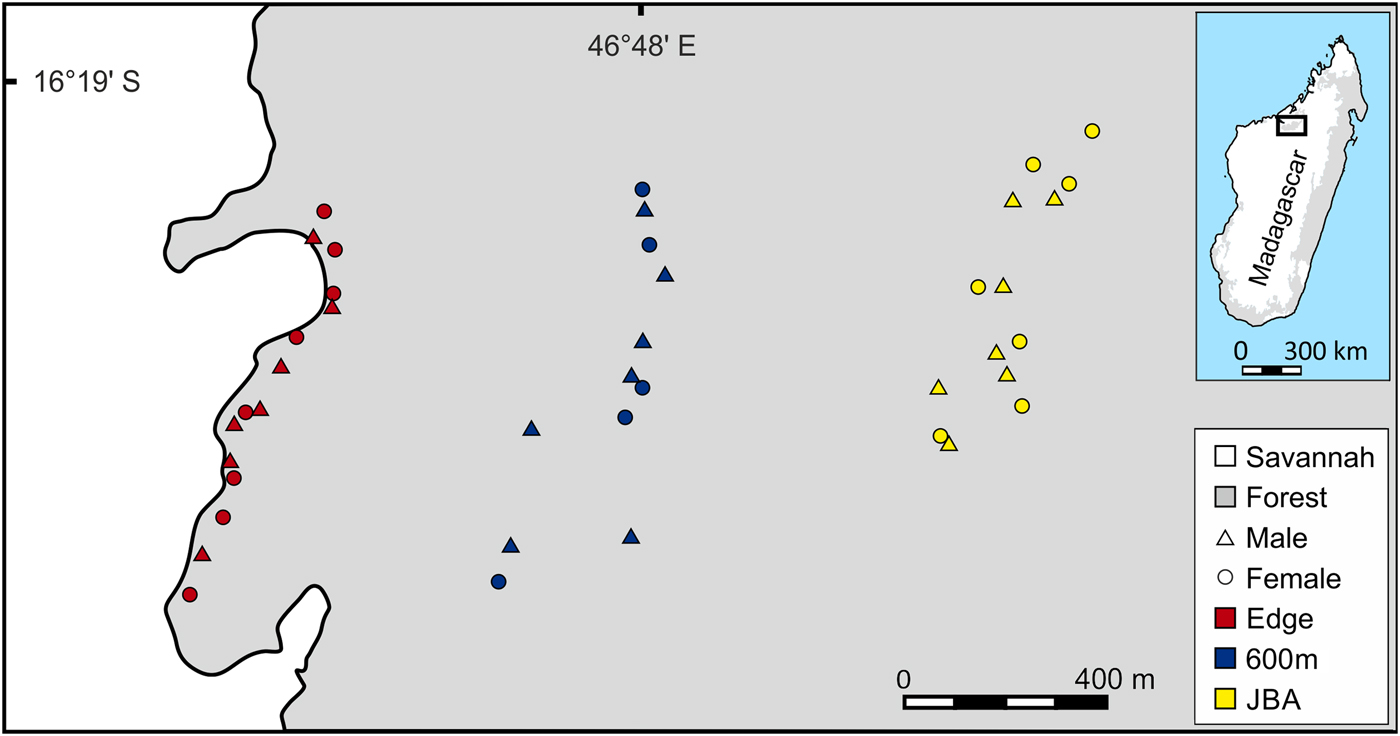
The relatively short distance between the sites ensures that inter-site dispersal of individual mouse lemurs is possible (individual golden-brown mouse lemurs have been trapped up to 2 km from their previous capture site in the Park; UR, E. Zimmermann, SML & RJB, unpubl. data). Mouse lemurs were trapped with Sherman Live Traps (23.5 × 8 × 9 cm3, HB Sherman Traps, Inc., Tallahassee, USA), baited with a piece of banana. Trapping at the Edge site took place 5–50 m from the forest edge during May–July 2012 (390 trap nights, RJB) and March–May 2014 (260 trap nights, JS) along a transect of c. 800 m length. Trapping at 600m also took place during May–July 2012 (195 trap nights, RJB) and March–May 2014 (260 trap nights, JS) along a transect of c. 800 m length. Trapping in JBA was conducted in August 2013 (300 trap nights, UR, E. Zimmermann and students) and during March–May 2014 (900 trap nights, JS). Unlike the two transect-based sites Edge and 600m, JBA is accessible via a grid-like network of trails (c. 500 × 600 m2). For the purpose of this study, a subset of animals trapped within this area was selected that had an approximately linear spatial distribution comparable to that from the other two sites (Fig. 1).
Trapping routines followed those described in Burke & Lehman (Reference Burke and Lehman2014) except in March–May 2014. During this time, traps were opened at 16.00–18.00 and checked at 22.00–0.00 in the same night, to minimize the amount of time that animals spent in the traps, in case lactating females were captured. Females captured during this period were immediately handled, marked, and sampled in the forest and then directly released at their point of capture, whereas males were taken back to the camp for handling and sampling (as during other times). Tissue samples (1–2 mm2 ear biopsies) were taken from all individuals according to established routines (Radespiel et al., Reference Radespiel, Sarikaya, Zimmermann and Bruford2001a) and stored in Queen's lysis buffer (Seutin et al., Reference Seutin, White and Boag1991) at ambient temperatures for up to 3 months in Madagascar and then in Germany at 4 °C until extraction in 2014.
Because M. ravelobensis forms kin-based stable sleeping groups (Radespiel et al., Reference Radespiel, Jurić and Zimmermann2009) and population genetics methods can be biased by social structure (Parreira & Chikhi, Reference Parreira and Chikhi2015), we limited the number of close kin in each sample and aimed to include equal numbers of males and females. To achieve this, only one sample from same-sex individuals was included if several were trapped at the same location. Same-sex sampling locations were typically ≥ 50 m apart (Fig. 1). Following this sampling rule, a total of 41 individuals (21 males, 20 females) were available: 15 individuals (7 males, 8 females) from Edge, 12 (7 males, 5 females) from 600m, and 14 (7 males, 7 females) from JBA.
Laboratory procedures
DNA was extracted with a standard proteinase K digestion followed by a phenol-chloroform protocol (Sambrook et al., Reference Sambrook, Fritsch and Maniatis1989) and stored at −20 °C. PCRs were performed with seven specific microsatellite primers (Table 1) that had been shown to be polymorphic in M. ravelobensis in a previous study (Radespiel et al., Reference Radespiel, Rakotondravony and Chikhi2008). The success of the PCRs was controlled by running aliquots on a 1.5% agarose gel. The fragment length of the amplified DNA was determined with an ABI 3500 capillary sequencer (Applied Biosystems, Foster City, USA) and raw data were analysed with GeneMapper v. 4.1 (Thermo Fisher Scientific, Waltham, USA) for each microsatellite locus. To minimize genotyping errors, each homozygous sample was re-amplified at least twice. The seven loci were all polymorphic but differed in the number of alleles (range: 7–19), their allelic richness (range: 4.5–12.4) and consequently in their observed (Ho) and expected heterozygosity (He, Table 1). Although Ho and He differed in some loci (Mm10, Mm30, Mm43B), none of them deviated significantly from Hardy–Weinberg equilibrium in all three sites, and therefore all of them were kept in the subsequent analyses.
Characteristics of the microsatellite loci used. Sample size for all loci is 41.
1 Size range of alleles (base pairs).
2 Observed heterozygosity.
3 Expected heterozygosity.
4 Test for Hardy–Weinberg equilibrium (sites with significant deviations are shown).
In addition to the microsatellite loci, a 529 bp fragment of the mitochondrial control region was amplified via PCR, using the mammalian control region primers L15997 and H16498 (Gerloff et al., Reference Gerloff, Hartung, Fruth, Hohmann and Tautz1999). Both strands were sequenced with an ABI 3500 capillary sequencer. The raw sequence data of the two strands of each individual were assembled with SeqMan v. 7.0 (DNASTAR, Inc., Madison, USA) and then aligned with all other sequences in MEGA 5.0 (Tamura et al., Reference Tamura, Peterson, Peterson, Stecher, Nei and Kumar2011). An internal region (354 bp), for which all but one of the samples could be sequenced clearly, was chosen and all aligned sequences were cut to that length.
Spatial analyses
To calculate inter-individual distances, a central trapping point was calculated for each individual by using the geographical coordinates (latitude and longitude in decimal degrees) of each capture location. If an individual was caught at more than one location, the coordinates of its central trapping point were calculated as a weighted average of all trapping points. Weighing was according to capture frequency; i.e. the coordinates of a site with a double capture were counted twice, whereas each singular capture event was counted only once. Using the coordinates of the individual central home points, inter-individual distances were calculated with the formula:
 $$\eqalign{& d = (1.609344{^\ast}(3963{^\ast}\arccos (\cos ({\rm radian}(90 - lat1)) \cr &{^\ast}(\cos ({\rm radian}(90 - lat2)) + (\sin ({\rm radian}(90 - lat1)) \cr &{^\ast}(\sin ({\rm radian}(90 - lat2)){^\ast}(\cos ({\rm radian}(lon1 - l{ on}2))))){^\ast}1000} $$
where d = distance (m), lat = latitude, lon = longitude, lat/lon 1 = of first individual, lat/lon 2 = of second individual. Intra-site distances (mean = 261.8 ± SD 158.7 m) were significantly shorter than inter-site distances (mean = 1003.1 ± SD 362.5 m, Mann-Whitney U Test, Z = −22.73, n1 = 262, n2 = 558, P < 0.00001), but because of the relative proximity of the sites, 15.7% (41 of 262) distances within sites were longer than the minimum distance (435 m) between sites.
Molecular analyses
Genetic diversity
Hardy–Weinberg equilibrium was tested for all loci and sites separately with Genetix 4.05 (Belkhir et al., Reference Belkhir, Borsa, Chikhi, Raufaste and Bonhomme1996) with 10,000 permutations. Genetix 4.05 and FSTAT 2.9.2.3 (Goudet, Reference Goudet1995) were used to calculate the observed heterozygosity (Ho), expected heterozygosity (He) and inbreeding coefficient (F is) for each locus across all sites and for each site and all loci separately. The standardized allelic richness was calculated with FSTAT 2.9.2.3 for each locus and these were averaged per site. All measures of genetic diversity were compared between sites by means of a non-parametric Wilcoxon signed-rank test with Statistica 6.0 (StatSoft Inc., Tulsa, USA) with one data point per locus and site. The number of mitochondrial haplotypes, haplotype diversity and nucleotide diversity were calculated with DnaSP 5.10.01 (Librado & Rozas, Reference Librado and Rozas2009) for each site.
Genetic exchange between sites
We performed spatial autocorrelation analyses, then applied an assignment test to the genotype dataset and finally analysed the sequence dataset in more detail using a haplotype network. The spatial autocorrelation was performed with SPAGeDi 1.4 (Hardy & Vekemans, Reference Hardy and Vekemans2002) to analyse how genetic relationships are related to geographical distance and whether there are indications for genetic structure in the dataset. This analysis was based on all multilocus genotypes and related inter-individual genetic relationships (Moran's I values; Hardy & Vekemans, Reference Hardy and Vekemans1999) to the geographical distance between individuals across five distance classes (100, 200, 500, 1,0000 and 2,000 m). The significance of the Moran's I values within each distance class was tested with 10,000 permutations of individual locations among all individuals. The observed mean Moran's I value is displayed together with the 5% and 95% confidence interval determined by permutation for each distance class to visualize significantly positive or negative deviations of the Moran's I, respectively. Because of the spatial setting of the study, the first two distance classes (100 and 200 m) contained only pairs of lemurs from the same transect, and only few (n = 5, 3.6%) values in the 500 m class resulted from inter-transect comparisons. In contrast, almost all values from the 1 km distance class (n = 315, 92.4%) and all values from the 2 km distance class resulted from inter-transect comparisons. Therefore, the comparison between distance classes also facilitates the comparison of Moran's I within and between transects. To detect any potential sex bias in dispersal, the analysis was also performed for both sexes separately.
The Bayesian assignment method of Rannala & Mountain (Reference Rannala and Mountain1997) was used to assign individuals to their most likely site of origin (Edge, 600m or JBA) using GeneClass2 v2.0 (Piry et al., Reference Piry, Alapetite, Cornuet, Paetkau, Baudouin and Estoup2004). The assignment probabilities were calculated according to Paetkau et al. (Reference Paetkau, Slade, Burden and Estoup2004). If gene flow between the sites is restricted and the allele distributions differ as a consequence of genetic drift or non-random mating, animals can be assigned to their geographical origin with some degree of certainty. To infer recent migration rates, a Markov chain Monte Carlo analysis was performed with BayesAss 3.0.4 (Wilson & Rannala, Reference Wilson and Rannala2003). The programme was run four times with 10 million iterations each, discarding the first 1 million iterations as burn-in and sampling every 100th of the remaining 9 million iterations to estimate parameters. Acceptance rates for changes in allele frequencies and in the inbreeding coefficient were adjusted to below 60% (as recommended in the manual) by changing the respective mixing parameters, i.e. by setting the proposed move step sizes to a = 0.5 (for changes to the allele frequency) and to f = 0.7 (for changes to the inbreeding coefficient). The trace files of the runs were checked for convergence with Tracer (Rambaut et al., Reference Rambaut, Suchard, Xie and Drummond2014). The programme provides inferred (posterior mean) migration rates and the standard deviation of their marginal posterior distribution. The resulting migration rates and standard deviations were averaged across all four runs.
We inferred maternal genetic exchange from the analysis of the mitochondrial haplotypes and from the haplotype network drawn with Network 4.6.1.0 (Bandelt et al., Reference Bandelt, Forster and Röhl1999) by means of the median joining method. Finally, we identified potential male immigrants by a haplotype that was not shared with females from that site. In contrast, males that shared a haplotype with females in a given site were categorized as potentially philopatric males. Given these categories, the percentage of potential migrants and the proportion of immigrant to philopatric males were calculated for each site. We acknowledge that this approach does not identify the exact geographical origin of all males and that the real dispersal rates cannot be accurately determined. However, because the analysis was performed in the same way for all three sites, the results nevertheless allow a site comparison with regard to relative differences in dispersal tendencies. To estimate the genetic differentiation among the three sites, pairwise fixation indices (F st; Weir & Cockerham, Reference Weir and Cockerham1984) were calculated and tested for significance using 10,000 permutations with Genetix 4.05.
Results
Genetic diversity in the edge vs forest interior
Among all three sites, JBA had the highest genetic diversity, which was expressed in the highest overall allelic richness, high values of Ho and He, and the highest number of haplotypes, haplotype diversity and nucleotide diversity (Table 2). The samples from 600m showed an intermediate diversity, as they had comparable values of Ho and He to JBA, but an intermediate value of allelic richness and low values of haplotype diversity and nucleotide diversity. The samples from the Edge were characterized by the lowest values of allelic richness, Ho, He, and nucleotide diversity, but a relatively high haplotype diversity. Although the allelic richness at the Edge was smaller than that of 600m and JBA in five of seven loci and in six of seven loci, respectively, this difference was not significant (Wilcoxon Test, Z < 1.521, n = 7, n.s.). Similarly, there was no significant difference between the Ho or Fis values of the Edge and 600m or JBA, respectively (Wilcoxon Test, Z < 1.183, n = 7, n.s.). However, the Edge had a significantly lower expected heterozygosity than 600m (Wilcoxon Test, Z = 2.366, n = 7, P < 0.05) but not lower than JBA (Wilcoxon Test, Z = 1.521, n = 7, n.s.).
Genetic diversity measures of the three study sites. The test for Hardy–Weinberg equilibrium was not significant in all cases.
1 Observed heterozygosity.
2 Expected heterozygosity.
3 Inbreeding coefficient.
Genetic exchange vs differentiation between the edge and forest interior
The spatial autocorrelation analysis revealed that Moran's I values were significantly higher than expected only within sites and within the two lowest distance classes (≤ 200 m for both sexes, Fig. 2) and significantly lower than expected within the 1000 m distance class (females) or above 1,000 m (males and both sexes, Fig. 2). Female average values ranged above male values only in the first distance class (≤ 100 m). Overall, the mean Moran's I fell below zero (random relatedness) beyond 200 m (both sexes and males) or beyond 500 m (females, Fig. 2b,c), i.e. still within each site.
Spatial autocorrelation of genetic relationships (Moran's I) and geographical distance between individuals, categorized into five distance classes for (a) both sexes, (b) females, and (c) males. The observed mean Moran's I value is displayed together with the 5% and 95% confidence interval determined by permutation for each distance class to visualize significantly positive or negative deviations of the Moran's I, respectively.
All but four individuals were correctly assigned to their capture sites by the assignment test. These four individuals were all males, three of which were trapped at the Edge and one at 600m. These males carried mitochondrial haplotypes that were either shared between sites (n = 3) or unique and shared with no other individual (n = 1). Pairwise genetic differentiation was calculated between the sites based on the multilocus genotypes and was significant in all three cases (FstEdge−600m = 0.0218, P < 0.05, FstEdge−JBA = 0.0331, P < 0.01, Fst600m−JBA = 0.0293, P < 0.05), with the highest value between the Edge and JBA. The fraction of immigrating individuals (determined with BayesAss) differed between sites. Whereas 88.5 ± 6.7% of the Edge sample were inferred as stemming from the Edge (no migration background), this proportion was only 75.2 ± 5.6% for 600m and 72.2 ± 5.1% for JBA. This suggests that the immigration rate was higher in the two core sites (c. 25 and 28%, respectively) than in Edge (c. 12%).
A total of 12 different mitochondrial haplotypes were identified (Table 3). Three of these (H1, H2, H3) were shared between sites, but all others were private haplotypes of one site only. If haplotypes were shared, they were typically shared by males and females of the sites (exception: one male in JBA sharing H2 with Edge and 600m).
Number of haplotypes in each sampling site (in parentheses: number of haplotypes in males and females, respectively).
1 Haplotypes shared between sites and also found in females.
2 Haplotypes exclusively found in males in a given site.
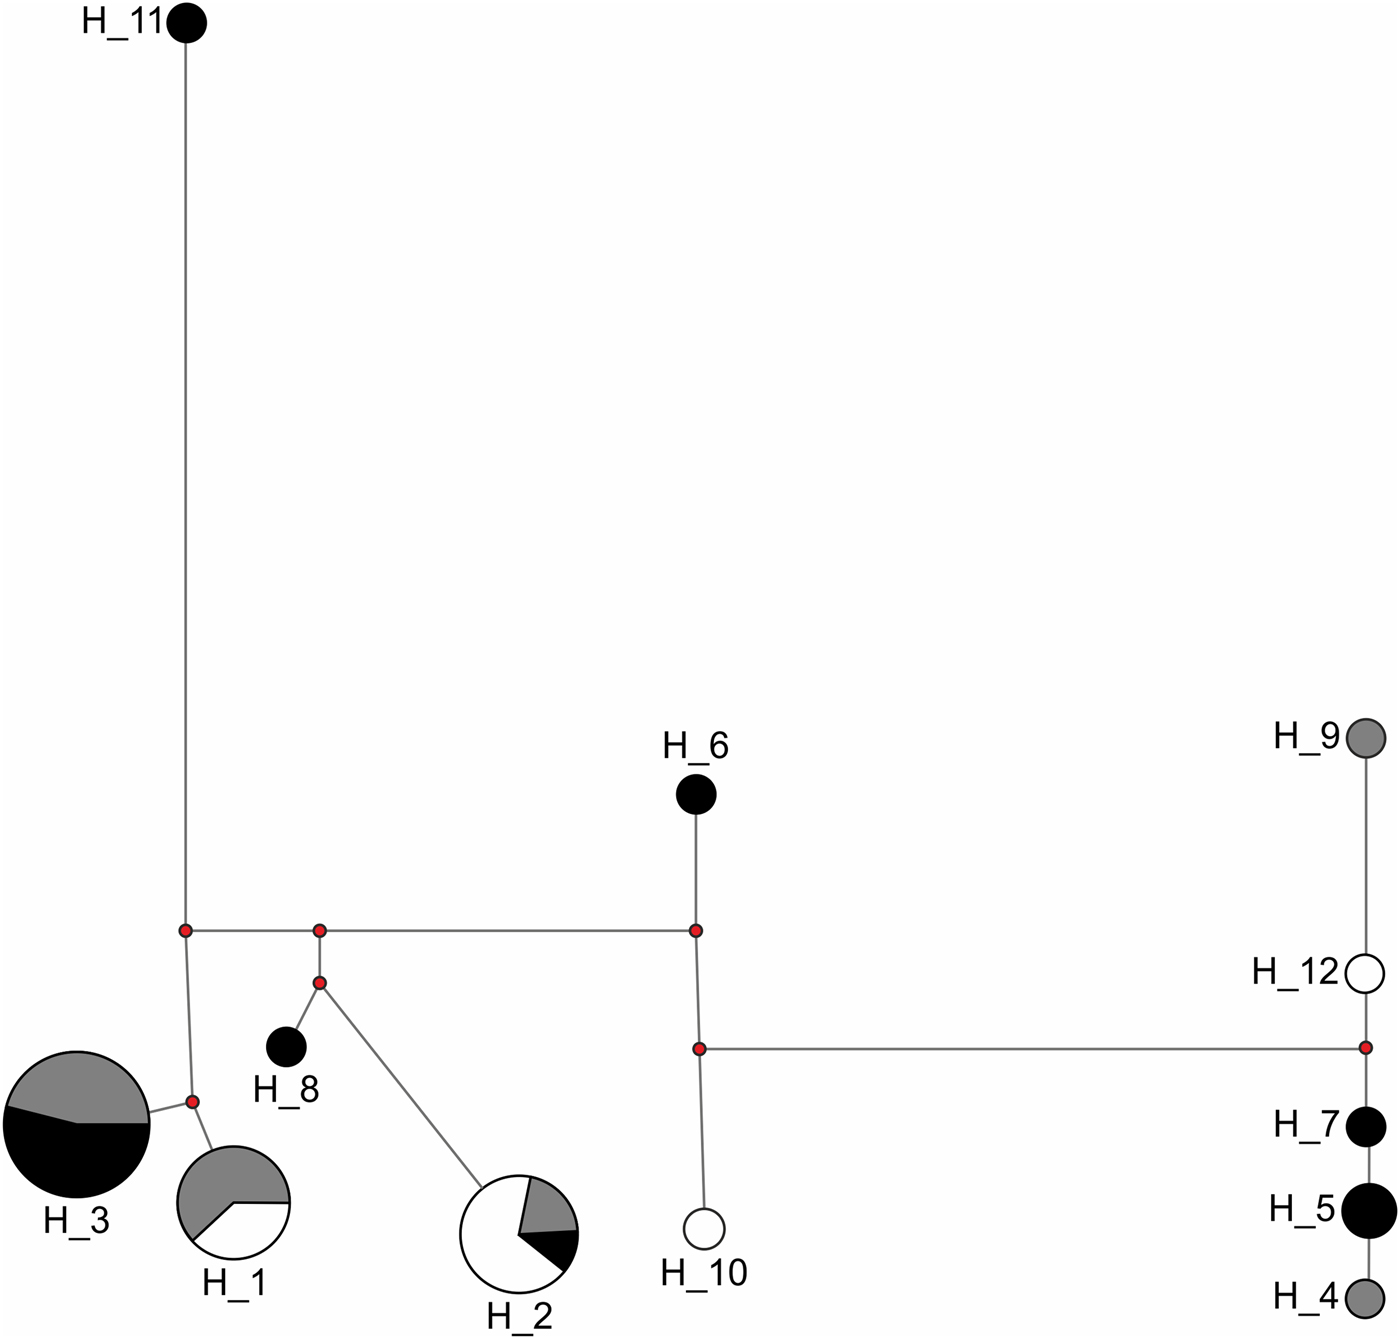
Congruent to this pattern of haplotype sharing, the haplotypes were not clustered by site in the haplotype network but were mixed, with one haplotype (H11) differing from the others by more than 20 mutation steps (Fig. 3). Seven of nine unique haplotypes were represented by males and only two by females (Table 3). These potential immigrant males were not evenly distributed between sites. The proportion of potential immigrant males among all samples of the sites was 6.7% for Edge, 18.2% for 600m, and 28.6% for JBA. The proportion of potential immigrants among all males was 13.4% for Edge, 28.6% for 600m, and 57.1% for JBA. Consequently, the proportion of potential immigrants to philopatric males was 1:6 for Edge, 2:5 for 600m, and 4:3 for JBA.
Haplotype network of 40 sequences from the Edge (n = 15, grey), 600m (n = 11, white), and JBA (n = 14, black). The numbers represent the haplotype IDs (see Table 4), the length of connecting lines corresponds to the number of mutation steps between two adjacent haplotypes and the size of the circle for each haplotype corresponds to the number of individuals carrying it.
Discussion
This study aimed to investigate signals of possible genetic edge effects in the Endangered golden-brown mouse lemur and found preliminary evidence for them. The overall summary statistics of the genetic diversity measures (allelic richness, observed and expected heterozygosity, number of haplotypes, haplotype and nucleotide richness) have generally lower values in the edge habitat compared to both interior habitats, supporting the prediction of the null model and the local preference model. However, the marker-specific statistical comparisons between sites were significantly different only in the case of expected heterozygosity, although these tests may have been constrained in power by the limited number of microsatellite markers (n = 7) that were available for this study.
The study revealed signals of limited genetic exchange between edge and interior habitats and of genetic differentiation between sites. This was evident in (1) negative values of Moran's I in the higher distance classes that represent the relationships to individuals captured in other sites, (2) high assignment rates of individuals to the site of capture (37 of 41 animals, 90.2%), despite the local scale of the analyses, (3) only three out of 12 haplotypes (25%) being shared between sites, and (4) significant F ST values despite the close proximity of the sites. The significant F ST values were unexpected because of the short geographical distance between individuals from different sites (435–1865 m). A previous study on golden-brown mouse lemurs employed eight microsatellite loci and spanned much longer distances of 4–99 km between a set of 12 sub-populations from the Ankarafantsika National Park (Radespiel et al., Reference Radespiel, Rakotondravony and Chikhi2008). F ST values from that study were −0.002–0.112 with 15 of 66 values (22.7%) being lower than those calculated in this study. Those 15 lower values stemmed from sites that were 5–81 km apart (Radespiel et al., Reference Radespiel, Rakotondravony and Chikhi2008). A study on the grey mouse lemur in the continuous Kirindy forest (western Madagascar) also revealed a fine-scale genetic structure, but the F ST values, despite being also significant, were all lower than those calculated here, although the sites were ≥ 1 km apart (Fredsted et al., Reference Fredsted, Pertoldi, Schierup and Kappeler2005). This indicates that the genetic differentiation between edge and interior observed in this study is substantial.
However, the lack of connectivity between the edge and interior of the forest cannot be explained with a general lack of migratory movements. Each site contained individuals with private haplotypes (potential immigrants), but they were not evenly distributed between sites and sexes. Very few potential immigrants could be identified in the Edge (n = 2) and in 600m (n = 2), but most of them were found in the interior site JBA (n = 5), and seven of nine potential immigrants were males. The high number of potential male immigrants in JBA is not surprising because males from other interior locations can enter this site from all directions, whereas migratory options in both other sites are constrained by the proximity to the forest edge or the ‘edge zone’, respectively. These results were supported by the relatively high immigration rate that was inferred for JBA (c. 28%) and 600m (c. 25%) compared to that inferred for the Edge (c. 12%) by means of Bayesian statistics. These numbers are similar to those derived from the haplotype distribution pattern. Males from the Edge seem to be less likely immigrants (13.5%) compared to males from the two interior sites (28.6% in 600m, 57.1% in JBA). Most of the Edge males (85.7%) shared haplotypes with 1–3 females, which may indicate that these males have a higher philopatric tendency and may stay close to their maternal lineage in their native habitat type. These findings also support previous indications of a male-biased dispersal system in this species (Radespiel et al., Reference Radespiel, Jurić and Zimmermann2009) and suggest that individuals (particularly males) do move, but are less likely to move between the edge and the interior. However, the total sample size in this study was limited, and rare haplotypes could easily have been missed. Future studies on molecular edge effects should therefore aim to include more animals and more markers to test for genetic isolation between edge and core habitats.
Taken together, these findings are in congruence with the local preference model and indicate that mouse lemurs do not move freely between sites and habitat types. This is unexpected because the three sites are connected by continuous forest and geographical distances between sites are short (500–1,400 m) and within the range of dispersal distances known for this and other mouse lemur species (Radespiel et al., Reference Radespiel, Lutermann, Schmelting, Bruford and Zimmermann2003b; Schliehe-Diecks et al., Reference Schliehe-Diecks, Eberle and Kappeler2012; authors unpubl. data). To our knowledge, this is the first preliminary evidence for a small-scale molecular edge effect in forest-dwelling animals.
Given the many biotic and abiotic differences that exist between the edge zones and the interior of forest habitats (Lehman, Reference Lehman, Lehman, Radespiel and Zimmermann2016), it is not surprising to see the movements of animals being constrained and influenced by these differences. In the case of the golden-brown mouse lemur, it is plausible that the different abiotic conditions in both forest parts may translate into differences in resource distribution (e.g. shelter, food and potential mates) or in different threat levels from predators. Under these circumstances, it is likely that the offspring of parents who reproduce successfully in the edge or the interior, respectively, may benefit from staying in their familiar zone. This phenomenon is known as habitat imprinting (Hildén, Reference Hildén1965) and has been used to explain dispersal patterns in fish (Arvedlund & Nielsen, Reference Arvedlund and Nielsen1996) and birds (Teuschl et al., Reference Teuschl, Taborsky and Taborsky1998). Familiarity with the surroundings is generally believed to be a selective benefit of philopatry (Clobert et al., Reference Clobert, Danchin, Dhondt and Nichols2001), and this may also explain a resistance to move between different habitat types (Stamps, Reference Stamps, Clobert, Danchin, Dhondt and Nichols2001). Whether the resistance of mouse lemurs to leave a familiar habitat type may also correspond to molecular adaptive changes leading to heritable local adaptation (Williams, Reference Williams1966; Savolainen et al., Reference Savolainen, Lascoux and Merila2013), cannot be answered in this study but merits further scientific attention.
We provide only preliminary evidence for a molecular edge effect because the sample size and the number of the molecular markers employed for this study were limited. Some recent modelling approaches have revealed that signals of genetic structure may be falsely inferred under a biased sampling scheme or if social structure and relatedness between individuals act as confounding factors (Schwartz & McKelvey, Reference Schwartz and McKelvey2009; Chikhi et al., Reference Chikhi, Sousa, Luisi, Goossens and Beaumont2010; Parreira & Chikhi, Reference Parreira and Chikhi2015). With our spatial setting, however, we have avoided collecting samples that would over-represent clusters of related individuals. The spatial design of our study was chosen to maximize the spatial spread of samples within each site, such that individuals from the opposite ends of each site were as far from each other as individuals from neighbouring sites. We therefore believe that the potentially confounding effects (biased sampling and relatedness) cannot explain our finding of a molecular edge effect and low genetic exchange between sites.
This study has important implications for the effective conservation of threatened species in a largely fragmented landscape. If animals living in an edge habitat do not typically interbreed with individuals inhabiting the interior of the forest, an already fragmented population may be subject to further subdivision. This can lead to a decrease in effective population size, increased inbreeding within each zone (edge or interior), and may in turn increase the vulnerability of each subpopulation to stochastic demographic changes and bottlenecks (Holmes et al., Reference Holmes, Baden, Brenneman, Engberg, Louis and Johnson2013; Frankham et al., Reference Frankham, Bradshaw and Brook2014). Future studies need to investigate to what extent this edge–interior subdivision of fragmented populations may contribute to the detrimental effects of forest fragmentation that have been described in other model systems.
Acknowledgements
We thank the Ministère de l'Environnement, de l'Ecologie et des Forêts and Madagascar National Parks for granting research permits. UR and JS are grateful to Romule Rakotondravony, Blanchard Randrianambinina, and Solofonirina Rasoloharijaona for their continuous support in Madagascar. UR and JS thank Elke Zimmermann, May Hokan, Sharon Kessler and the field course students Nary Andrianjaka, Imelda B. Fanjasoa, Jasper Götting, Sabrina Just and Jean A. Rakotomanantena for collaborating in trapping mouse lemurs in JBA in 2013, and Sandra Paule Ratsimbazafy for her assistance with fieldwork in 2014. For their support, advice and hospitality, SML and RB thank Benjamin Andriamahaja and the staff at ICTE/MICET, Fanja Raoelinirina, and the staff at La Maison du Pyla. SML and RB thank all those who have assisted us with their research in Madagascar, particularly Blanchard Randrianambinina, Tantely Rakotondriamanga, Jhonny, Radoniaina Rafaliarison, Mamy Razafitsalama, Jean de-la-Dieu and Paul Tsiveraza. We thank Sharon Kessler, Travis Steffens and Kim Valenta for their invaluable input on research design and field methods. UR and JS thank Claudia Ravens and Sabine Sippel for technical assistance and Sönke von den Berg and Tjard Bergmann for technical support. The comments of two anonymous reviewers improved the article. This work was supported financially by a Discovery grant to SML, a CGS-M to RB from the Natural Sciences and Engineering Research Council of Canada and by the Institute of Zoology, Tieräztliche Hochschule Hannover, to JS.
Author contributions
Conception of the study, planning of fieldwork and writing of the manuscript: UR and SML; contribution to field work: JS and RJB; molecular work: JS; contribution to data analyses: UR and JS. Revision of final version: all authors.
Conflicts of interest
None.
Ethical standards
All field procedures were approved by the Ministère de l'Environnement, de l'Ecologie et des Forêts and Madagascar National Parks (MNP) and necessary research permits were obtained from the respective Malagasy authorities (license N° 111/12/MEF/SG/DFG/DCB SAP/SCB obtained on 16 April 2012, N° 167/13/MEF/SG/DGF/DCB.SAP/SCB obtained on 16 July 2013, and licence N°060/14/MEF/SG/DGF/DCB/SAP/SCB obtained on 21 February 2014). Research by SML and RB was authorized by the University of Toronto, Office of Research Ethics (protocol No. 20009283). Trapping procedures and sample collection complied with the regulations of the government of Madagascar. The study adhered to the Code of Best Practices for Field Primatology of the International Primatological Society and the ethical guidelines of the Association for the Study of Animal Behaviour and the Animal Behaviour Society.


 Open access