

INTRODUCTION
With advances in sequencing technology, malaria parasites from various geographical locations were genotyped or sequenced, and genetic diversity was used to infer demographic history (Joy et al. Reference Joy, Feng, Mu, Furuya, Chotivanich, Krettli, Ho, Wang, White, Suh, Beerli and Su2003; Chang et al. Reference Chang, Park, Galinsky, Schaffner, Ndiaye, Ndir, Mboup, Wiegand, Volkman, Sabeti, Wirth, Neafsey and Hartl2012) and population structure (Anderson et al. Reference Anderson, Haubold, Williams, Estrada-Franco, Richardson, Mollinedo, Bockarie, Mokili, Mharakurwa, French, Whitworth, Velez, Brockman, Nosten, Ferreira and Day2000; Mu et al. Reference Mu, Awadalla, Duan, McGee, Joy, McVean and Su2005; Manske et al. Reference Manske, Miotto, Campino, Auburn, Almagro-Garcia, Maslen, O'Brien, Djimde, Doumbo, Zongo, Ouedraogo, Michon, Mueller, Siba, Nzila, Borrmann, Kiara, Marsh, Jiang, Su, Amaratunga, Fairhurst, Socheat, Nosten, Imwong, White, Sanders, Anastasi, Alcock, Drury, Oyola, Quail, Turner, Ruano-Rubio, Jyothi, Amenga-Etego, Hubbart, Jeffreys, Rowlands, Sutherland, Roper, Mangano, Modiano, Tan, Ferdig, Amambua-Ngwa, Conway, Takala-Harrison, Plowe, Rayner, Rockett, Clark, Newbold, Berriman, MacInnis and Kwiatkowski2012). These same data were examined to reveal genes or nucleotide sites putatively under selection (Volkman et al. Reference Volkman, Sabeti, DeCaprio, Neafsey, Schaffner, Milner, Daily, Sarr, Ndiaye, Ndir, Mboup, Duraisingh, Lukens, Derr, Stange-Thomann, Waggoner, Onofrio, Ziaugra, Mauceli, Gnerre, Jaffe, Zainoun, Wiegand, Birren, Hartl, Galagan, Lander and Wirth2007; Mu et al. Reference Mu, Myers, Jiang, Liu, Ricklefs, Waisberg, Chotivanich, Wilairatana, Krudsood, White, Udomsangpetch, Cui, Ho, Ou, Li, Song, Li, Wang, Seila, Sokunthea, Socheat, Sturdevant, Porcella, Fairhurst, Wellems, Awadalla and Su2010; Amambua-Ngwa et al. Reference Amambua-Ngwa, Tetteh, Manske, Gomez-Escobar, Stewart, Deerhake, Cheeseman, Newbold, Holder, Knuepfer, Janha, Jallow, Campino, Macinnis, Kwiatkowski and Conway2012). An important component of these analyses is the site-frequency spectrum, which is a histogram depicting the proportion of alleles in different frequency classes. Because the site-frequency spectrum can be influenced by changes in population size and natural selection, the site-frequency spectrum of single-nucleotide polymorphisms (SNPs) can be used to infer changes in population size and identify selective events. For example, the site-frequency spectrum was used by Chang et al. (Reference Chang, Park, Galinsky, Schaffner, Ndiaye, Ndir, Mboup, Wiegand, Volkman, Sabeti, Wirth, Neafsey and Hartl2012) to estimate a recent population expansion of 60-fold in Senegal, and Tajima's D (one of the summary statistics of the site-frequency spectrum) was used by Amambua-Ngwa et al. (Reference Amambua-Ngwa, Tetteh, Manske, Gomez-Escobar, Stewart, Deerhake, Cheeseman, Newbold, Holder, Knuepfer, Janha, Jallow, Campino, Macinnis, Kwiatkowski and Conway2012) to identify genes under balancing selection in an endemic population in The Gambia.
One alternative to analysing the site-frequency spectrum is to examine temporal changes in allele frequency. Because allele-frequency fluctuations are largely determined by population size whereas temporal trends depend on selection, population size and selective effects can be estimated based on temporal changes in allele frequency and fluctuations around the trend values. These methods have been developed and implemented in humans, horses and other species (Waples, Reference Waples1989; Anderson, Reference Anderson2005; Bollback et al. Reference Bollback, York and Nielsen2008; Malaspinas et al. Reference Malaspinas, Malaspinas, Evans and Slatkin2012). Temporal samples of malaria parasites are also available and have been used to infer recent parasite dynamics. For instance, Nkhoma et al. (Reference Nkhoma, Nair, Al-Saai, Ashley, McGready, Phyo, Nosten and Anderson2012) used allele frequency fluctuations across 10 years to estimate the effective population size (N e ) on the Thai–Burma border (Nkhoma et al. Reference Nkhoma, Nair, Al-Saai, Ashley, McGready, Phyo, Nosten and Anderson2012), and Daniels et al. (Reference Daniels, Chang, Sene, Park, Neafsey, Schaffner, Hamilton, Lukens, Van Tyne, Mboup, Sabeti, Ndiaye, Wirth, Hartl and Volkman2013) estimated a small N e of less than 100 following enhanced intervention in Senegal by analysis of molecular barcode genotypes of samples from 2006–2011 (Daniels et al. Reference Daniels, Chang, Sene, Park, Neafsey, Schaffner, Hamilton, Lukens, Van Tyne, Mboup, Sabeti, Ndiaye, Wirth, Hartl and Volkman2013). Moreover, temporal changes in microsatellite allele frequencies were used to estimate N e of lizard malaria parasites, and a decrease of N e associated with reduction in prevalence was reported (Schall and St Denis, Reference Schall and St Denis2013).
These genetic studies were mostly based on the population genetic tools that assume the Wright–Fisher (WF) population model, which is widely used in organisms including Drosophila and humans. A WF population is constant in size, generations are non-overlapping, and each offspring generation is formed from a sample of gametes of the parental generation. We wondered whether the unique and complicated life cycle of malaria could yield allele-frequency dynamics, including the allele-frequency spectrum, allele-frequency changes through time, and variation in allele-frequency changes, when mutations are neutral or under selection, that are qualitatively different from those in the WF model. If so, this would affect inferences from analyses based on such summary statistics as Tajima's D (Tajima, Reference Tajima1989), Fu and Li's F* and D* (Fu and Li, Reference Fu and Li1993), and Fay and Wu's H (Fay and Wu, Reference Fay and Wu2000). Our initial study (Chang et al. Reference Chang, Moss, Park, Ndiaye, Mboup, Volkman, Sabeti, Wirth, Neafsey and Hartl2013) has shown that, in comparison with the WF model, both genetic drift and the efficiency of purifying selection are higher under the malaria life cycle, and that the null distribution of the site-frequency spectrum is skewed toward lower-frequency alleles. These findings suggest that the malaria life cycle leads to biases in estimating demographic history and identifying signals of selection. However, it is as yet unclear how these intrinsic differences between the WF model and the malaria life cycle affect the power to detect sites under selection using typical statistics based on temporal changes in allele frequency or on the site-frequency spectrum.
Here, we examined how the malaria life cycle affects signals of selection identified by temporal changes in allele frequency or by the site-frequency spectrum. We first simulated the changes in frequency of beneficial alleles through time, estimated selection coefficients from temporal changes in allele frequency, and determined the conditions in which sites under positive selection could be detected. We also simulated the site-frequency spectrum for beneficial alleles and compared the power to identify sites under selection when analysed either the typical null distribution with the WF-model assumption or the adjusted null distribution under the malaria life cycle. Finally, we discuss potential future directions and the importance of considering the life cycle when studying malaria parasites or other species with unconventional life histories.
MATERIALS AND METHODS
Simulations of allele frequency changes and the site-frequency spectrum
Simulations for allele frequency changes and the site-frequency spectrum were performed as described in Chang et al. (Reference Chang, Moss, Park, Ndiaye, Mboup, Volkman, Sabeti, Wirth, Neafsey and Hartl2013). Three kinds of models were examined. In one, selection is assumed to take place only in the host organism (the host selection model); in another, the selection is effected through transmission from host to vector (the transmission selection model); and in the third, selection takes place both in the host as well as through transmission (the host/transmission selection model). Drug resistance genes and genes that function in haemoglobin breakdown and metabolism are examples of host selection; genes for sporozoite development and migration to the salivary glands and genes related to the development of the sexual forms of malaria parasites are examples of transmission selection. The quantity h is the selection coefficient measuring the advantage or disadvantage of a mutant allele within the human host per asexual cycle, and t is the selection coefficient measuring the advantage or disadvantage of a mutant allele in host-to-vector transmission. In the host selection model h≠0 but t = 0, and in the transmission selection model h = 0 but t≠0. The host/transmission selection model with h = t≠0 assumes equality of the selection coefficients for the sake of simplicity and to compare the relative importance of h and t. In what follows, the usual symbol of the selection coefficient (s) in the WF model, when used in reference to malaria, refers to h in the host selection model, t in the transmission selection model, and h = t in the host/transmission selection model. The default values of parameters from Chang et al. (Reference Chang, Moss, Park, Ndiaye, Mboup, Volkman, Sabeti, Wirth, Neafsey and Hartl2013) were used in the simulations unless stated otherwise. We assume that population sizes of human host and mosquito vector are both 1000, and the number of parasites transmitted between the vector and the human host is 10. If population sizes of human host and mosquito vector are different, there is another level of bottleneck, and it is likely that variation in allele-frequency changes is higher and the estimated selection coefficient less accurate than shown here. The site-frequency spectrum was obtained by sampling one allele within each of n randomly chosen (without replacement) human hosts, with n = 50. The simulation model does not allow for mixed infections, hence it assumes complete inbreeding. The level of mixed infection affects the rate of recombination in the population, and a model that allows mixed infection would be of great interest (see Chang et al. Reference Chang, Moss, Park, Ndiaye, Mboup, Volkman, Sabeti, Wirth, Neafsey and Hartl2013).
Estimating the selection coefficient (s)
Selection coefficients were estimated using allele frequency changes through time by the program sel2ns (Bollback et al. Reference Bollback, York and Nielsen2008). Allele frequencies at three time points separated by intervals of five generations were used for estimation. Sample allele frequencies were obtained by sampling one allele from each of 1000 human hosts. One generation under the malaria model is defined as one complete life cycle that includes a vector-host transmission bottleneck, population expansion within the host, a host-vector bottleneck, and population expansion within the vector. When estimating the selection coefficient (s) from allele frequency changes in the initial stage of the host selection model, exponential grid spacing was used (spacing ratio = 100 and λ = 0·5) because allele frequency is close to 0; equal grid spacing was used for all other estimations. The number of grid points was set to 500. Only mutations that eventually become fixed in the population were used for estimating s under the malaria model (condfix = 1). The number of replicates for each selection coefficient of each model was 10. Effective population size under the malaria model was estimated from simulated frequency changes of neutral alleles using the program CoNe (Anderson, Reference Anderson2005). The effective population size, 1000, was used when estimating s in the malaria model because the estimate of effective population size from neutral alleles is in the order of 1000. The significance of a selection coefficient is determined by a likelihood ratio test. The estimated s is significantly different from 0 if the difference in log-likelihoods of the estimated s and 0 is greater than 1·92, which is half of the 95th quantile of a chi-square distribution with 1 degree of freedom.
Site-frequency spectrum
Tajima's D statistic was used to summarize site-frequency spectrum (Tajima, Reference Tajima1989). The null distributions of Tajima's D under the WF model and the malaria model were generated by randomly sampling n alleles from the site-frequency spectra 10 000 times, with n = 50. The probability that Tajima's D of selected alleles is significant was obtained by comparing 100 simulated Tajima's D values of selected alleles with standard (WF) or adjusted (malaria) null distributions and calculating the proportion of Tajima's D values greater than the 95th quantile of the null distribution (one-sided test). When comparing two Tajima's D distributions, a one-sided Mann–Whitney test was used (with the alternative hypothesis that Tajima's D of beneficial alleles is larger than Tajima's D of neutral alleles).
RESULTS
Allele frequency changes through time
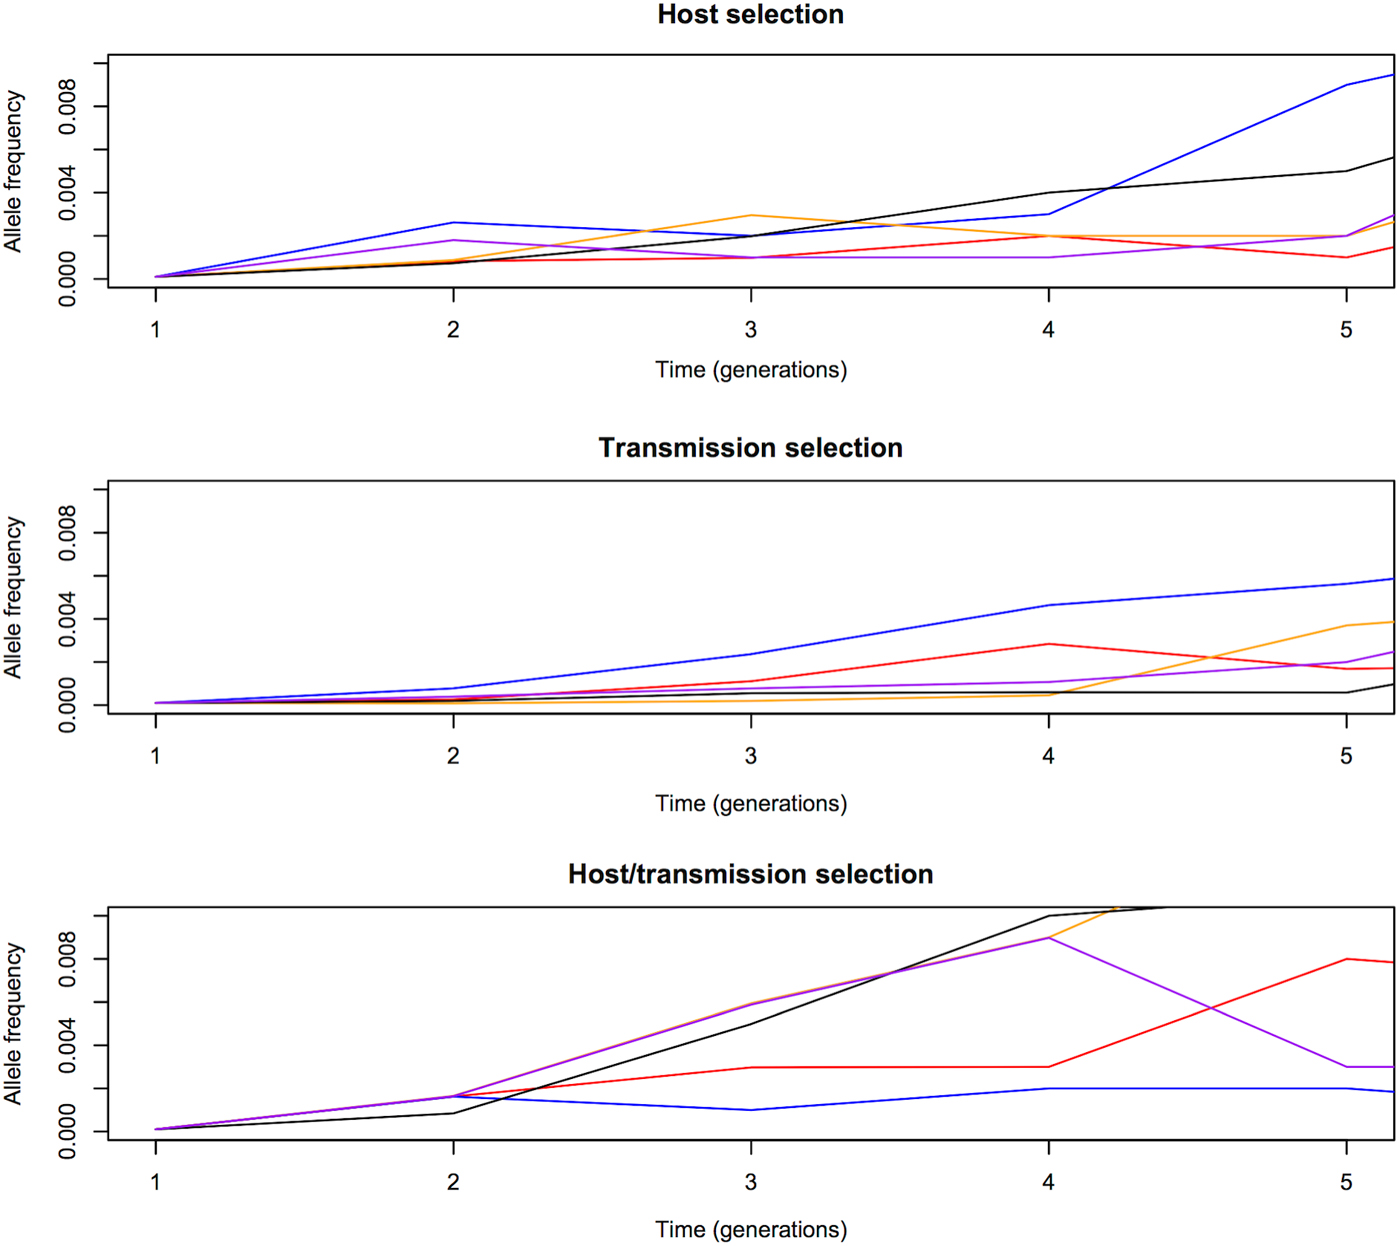
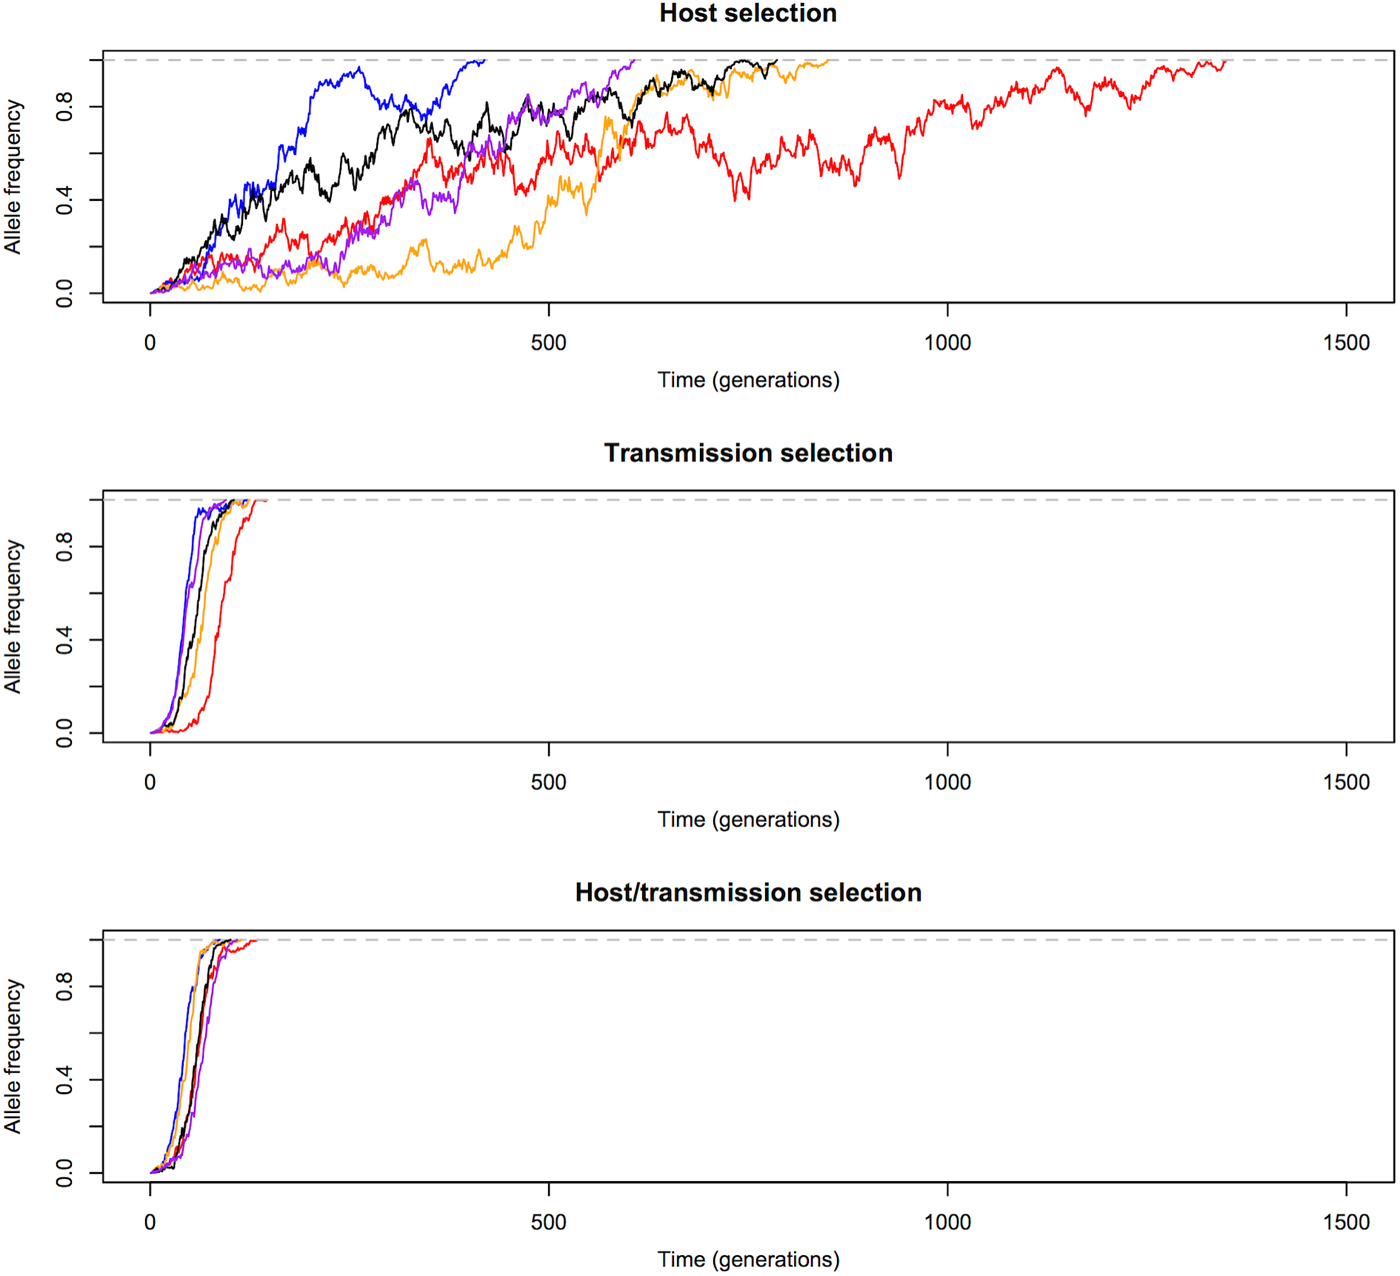
We first compared the changes in frequency of beneficial alleles with s = 0·1 in three malaria models: host selection model (selection only in red-cell stages), transmission selection model (selection only via transmission), and host/transmission selection model (selection in both red-cell stages and transmission). The results are summarized in Figs 1 and 2. Note that these are cases when beneficial alleles are eventually fixed in the population. Figure 1 shows that frequency of beneficial alleles increases faster in the initial generation if there is a selective advantage within the human host (that is, in the host selection and host/transmission selection models). Afterwards, the transmission advantage gradually overtakes, and the allele frequency in the transmission selection and host/transmission selection models increases more rapidly (Fig. 2). Figure 2 also shows that the fixation time is more sensitive to selection affecting transmission. The fixation time under the host/transmission selection and transmission selection models is much shorter than the host selection model. Without a transmission advantage, the frequency of the beneficial allele in the host selection model fluctuates stochastically before becoming fixed in the population. The reason that the fixation time in the host/transmission selection model is shorter than that in the transmission selection model is because the mutant allele has both a within-host selective advantage and a between-host transmission advantage.
Allele frequency changes in the first five generations. One generation is defined as one complete life cycle. The trajectories of beneficial mutations with s = 0·1 in three models showing that the frequency of beneficial alleles increases faster from generation 1 to generation 2 if there is a selective advantage in the red-blood-cell stages in the human host (i.e. the host selection and host/transmission selection models). The five differently coloured lines represent independent replicates with the same initial frequency.
Allele frequency changes until fixation. Transmission advantage influences the trajectories of beneficial alleles (s = 0·1) more than selective advantage in red-cell stages. Allele frequency in the transmission selection and host/transmission selection models increases much faster than in the host selection model. The five differently coloured lines represent independent replicates with the same initial frequency.
Estimation of selection coefficients
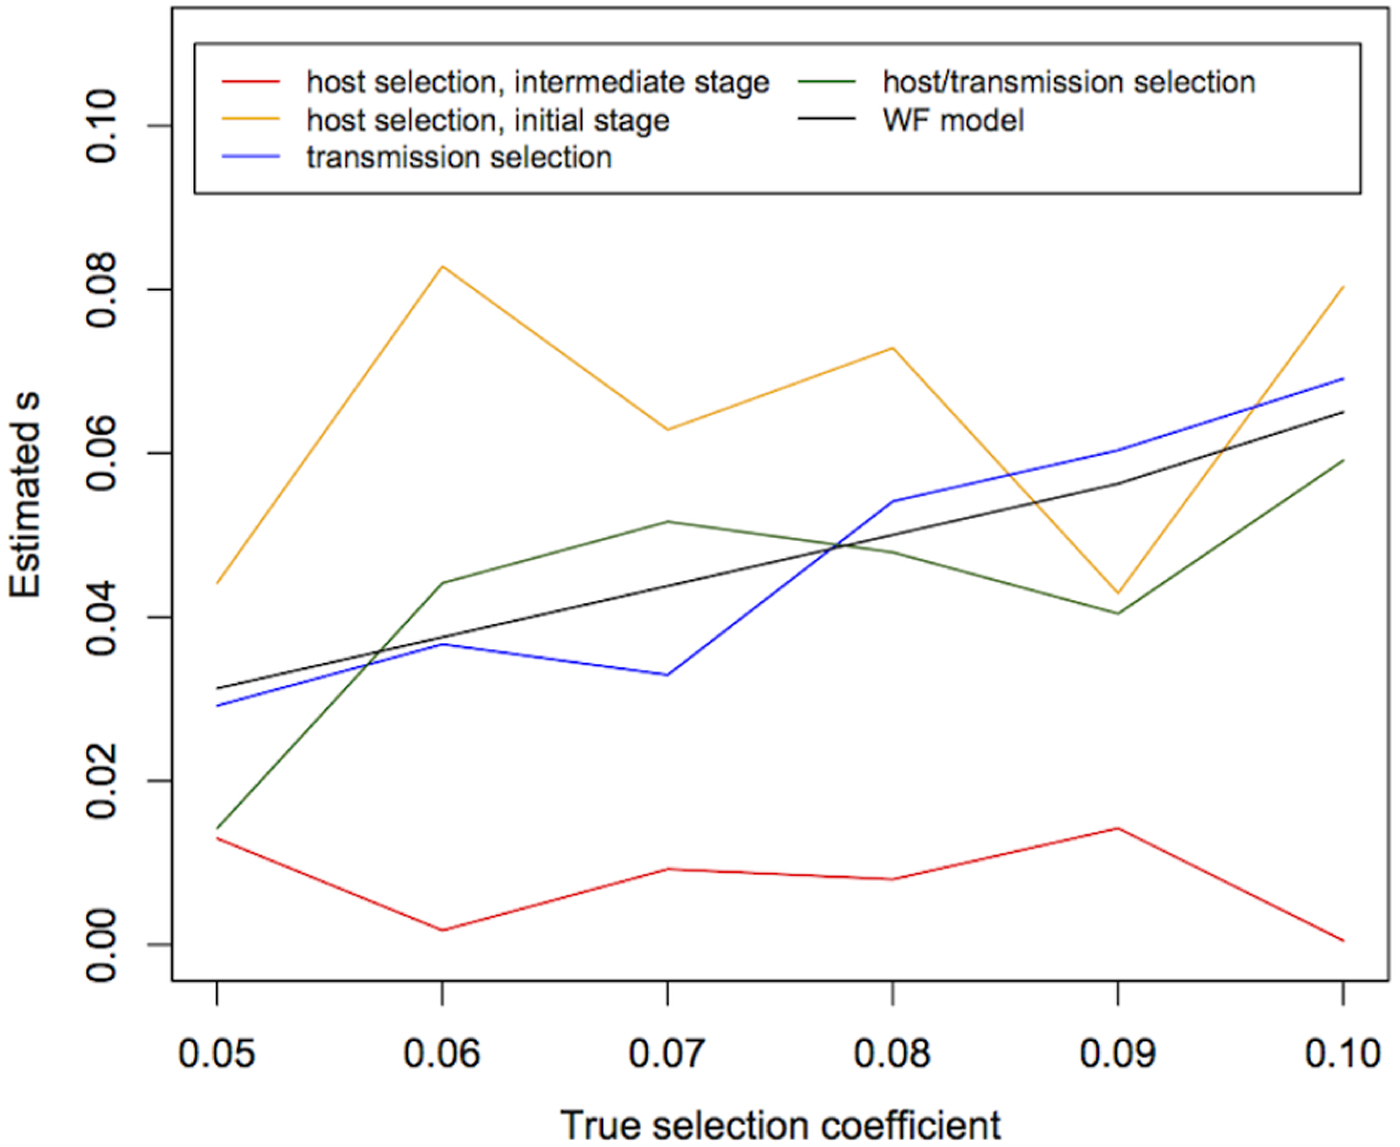
We then estimated s using temporal allele-frequency changes (Fig. 3) and tested whether estimated values are significantly different from 0 (Table 1). We found that, under the WF model with population size 10 000 and sample size 1000, the median of the estimated s is highly correlated with the true s (P value = 5×10⁻⁶), although the absolute values of the estimates are not exactly correct (Fig. 3). Moreover, under the WF model, the estimated values of s within the simulated range of selection coefficients (s = 0·05~0·1) are all significantly different from 0. Under the malaria life cycle, on the other hand, the allele-frequency trajectories and the estimates of s are highly dependent on the model (host selection, transmission selection or host/transmission selection).
The estimates of the selection coefficient (s) under the WF and malaria models. The medians of estimates of the selection coefficients under the WF and transmission selection models are correlated with the true values, while the median of estimates in the host selection and host/transmission selection models are not. The medians of 10 replicates are shown here.
Proportion of estimated selection coefficients significantly different from 0

a The number preceding the virgule (‘/’) represents the number of cases with the estimated selection coefficient significantly different from 0; the number following it is the sample size.
In the host selection model, we estimated s using allele-frequency changes in both the initial stage when the allele frequency is still low and at an intermediate stage when the allele frequency is greater than 20%. The selective advantage appears almost immediately in the host selection model, but once the beneficial allele becomes fixed within a human host, allele-frequency changes are dominated by the neutral process and any selective advantage is unlikely to be detected because there is no transmission advantage between hosts. This is the rationale for the estimates of s using both the initial and intermediate stages of allele-frequency change. The results show that the medians of estimates from both stages are not correlated with the true s [P values = 0·68 (initial) and 0·64 (intermediate), Fig. 3] and are unlikely to be significantly different from 0 [15% (initial) and 8% (intermediate)] (Table 1). Although the estimates of s from the initial frequency changes are slightly more likely to be significantly different from 0 than those from the intermediate stages, only 15% of the estimates are significantly different from 0, demonstrating that the selective advantage within the human host is difficult to detect. In fact, Fig. 1 shows that selective advantage is only obvious during the first two generations when h is 0·1. Moreover, it is unlikely that a random sample includes alleles of low frequency.
In the transmission selection model, the median of estimates of the selection coefficient is significantly correlated with the true value (P value =0·003) and the median of estimates from the WF model (P value =0·003) (Fig. 3), and the estimates are likely to be significantly different from 0 (69%, Table 1). In the host/transmission selection model, while the estimated coefficients are likely to be significantly different from 0 (69%, Table 1), the median of the estimates is not significantly correlated with the true value (P value =0·1) or the median of estimates from the WF model (P value =0·1). These results suggest that a transmission advantage is more likely to be detected as statistically significant than a selective advantage within the human host.
Site-frequency spectrum of selected alleles
Tests based on the site-frequency spectrum are commonly used for detecting signals of selection. Here, we investigated the power to detect signals of selection by Tajima's D, a test based on the site-frequency spectrum, under the malaria life cycle. The site-frequency spectra of selected alleles under three malaria models were simulated and are shown in Fig. 4, along with the malaria neutral site-frequency spectrum and the WF neutral site-frequency spectrum. Under the host selection model, the spectra of alleles with s = 0·1 and 0·01 are more skewed toward high frequency alleles than the malaria neutral site-frequency spectrum, but less skewed than the WF neutral site-frequency spectrum. This comparison indicates that uncritical use of the WF neutral site-frequency spectrum can sometimes lead one to interpret a statistical signal of selection as having the wrong sign. Under the transmission selection and host/transmission selection models, the spectra of alleles with s = 0·1 and 0·01 are more skewed toward high frequency alleles than either neutral frequency spectra, while the spectra of alleles with s = 0·001 are more skewed than the malaria neutral frequency spectrum but not that of WF.
Allele frequency spectra of selected alleles under three malaria models. Under the host selection model, the spectra of alleles with s = 0·1 and 0·01 are more skewed toward high frequency alleles than the malaria neutral site-frequency spectrum, but less skewed than the WF neutral site-frequency spectrum. Under the transmission selection and host/transmission selection models, the spectra of alleles with s = 0·1 and 0·01 are more skewed toward high frequency alleles than both neutral frequency spectra, while the spectra of alleles with s = 0·001 are only more skewed than the malaria neutral frequency spectrum.

We then compared Tajima's D values of selected alleles to the null Tajima's D distributions generated from both the WF model (standard null) and the malaria model (adjusted null) (Table 2). Under the host selection model, Tajima's D values of selected alleles are significantly higher than Tajima's D under the neutral malaria model, but not significantly different from Tajima's D of the neutral WF model (Table 2, left column). In the transmission selection and host/transmission selection model, Tajima's D values of selected alleles are significantly higher than Tajima's D from both neutral models if the number of segregating sites (S) is larger and/or s = 0·01 (Table 2, left column). Tajima's D values are more likely to be significantly greater than 0 when using the null distribution of the malaria model, and the improvement is more obvious under the transmission selection and host/transmission selection models when the number of segregating sites is larger and s = 0·1 or 0·01 (Table 2, right column). Note that Tajima's D is less likely to be significantly positive when s = 0·1 than when s = 0·01 because there are more high-frequency derived alleles when s = 0·1 and the higher proportion of alleles with frequency close to 1 decreases Tajima's D value. In this situation, Fay and Wu's test (Fay and Wu, Reference Fay and Wu2000) might be more powerful to detect positive selection because it is sensitive to the excess of high-frequency derived alleles.
Comparing Tajima's D of selected alleles with null distributions

a s is selection coefficient, referring to h in the host selection model, t in the transmission selection model, and h = t in the host/transmission selection model.
b S is the number of segregating sites that are sampled from the site-frequency spectrum to calculate Tajima's D.
DISCUSSION
Malaria is one of the leading causes of morbidity and mortality worldwide, and efforts have been made to detect signals of selection in the genome of malaria parasites in order to identify targets for intervention. In this study, we investigated the power to detect signals of selection under the malaria life cycle.
We showed that allele-frequency changes through time are more sensitive to transmission advantage than to selective advantage within the human host. Similarly, transmission advantage also affects the site-frequency spectrum to a greater extent. Transmission advantage predominates because within-host selection is important only when mutations are still segregating within a host. After a beneficial mutation becomes fixed within a host, it is transmission selection that determines the changes of allele frequency in the overall parasite population. Because of multiple asexual generations within a host, a mutation under positive selection within the human host reaches high frequency or becomes fixed within a host quickly and therefore, with single infections, transmission selection usually predominates over host selection. However, even though allele-frequency changes are more sensitive to transmission advantage, the power to detect selection by following temporal changes in allele frequency is smaller under the malaria life cycle than under the WF model (Table 1). The reduced power occurs because the changes in allele frequency depend on serial passages of alleles within and between hosts, and during these passages genetic drift is enhanced by the bottlenecks and the selective and transmission effects of a mutation may differ. For example, the genes related to the development of the sexual forms of the malaria parasite are expected to be under transmission selection but not host selection. These serial passages enhance the variance in allele-frequency changes and the difficulty to detect selection. The power to detect selection could be potentially increased when the number of hosts is large because signals of selection are expected to be clearer with decreased level of genetic drift.
The power of tests based on the site-frequency spectrum is also decreased by the malaria life cycle unless one adjusts the null distribution in accordance with the malaria life cycle. When using the standard WF null distribution of Tajima's D, the highest rate of detecting positive selection in our simulation is only 21% (Table 2). When the null distribution is adjusted for the malaria life cycle, the power of detecting positive selection is greatly improved (the highest rate is 78%, Table 2). Because the true demographic parameters (such as the numbers of human hosts and mosquito vectors) of a real population are unknown, they need to be estimated when attempting to obtain an adjusted null distribution by simulations. However, demographic parameters are unlikely to be estimated accurately because, even if we only consider neutral sites, both the demographic history and the malaria life cycle act on patterns of polymorphism, and no current method is known that can separate them. An alternative approach to obtaining an adjusted null distribution of Tajima's D is by randomly sampling alleles from empirical site-frequency spectrum of a group of SNPs that are thought to be neutral or nearly neutral, such as synonymous sites. In this way, the adjusted null distribution of Tajima's D is influenced by both demographic history and the malaria life cycle and could be used to improve the power of detecting positive selection or balancing selection in the genome of malaria parasites. This is similar to the analysis in Chang et al. (Reference Chang, Park, Galinsky, Schaffner, Ndiaye, Ndir, Mboup, Wiegand, Volkman, Sabeti, Wirth, Neafsey and Hartl2012), in which demographic parameters were estimated by fitting a demographic model to the synonymous site-frequency spectrum (Gutenkunst et al. Reference Gutenkunst, Hernandez, Williamson and Bustamante2009), and Tajima's D null distribution was generated by the estimated demographic model. This approach reduces the extent to which the malaria life cycle reduces the power to identify genes under positive or balancing selection using positive Tajima's D. In contrast, Amambua-Ngwa et al. (Reference Amambua-Ngwa, Tetteh, Manske, Gomez-Escobar, Stewart, Deerhake, Cheeseman, Newbold, Holder, Knuepfer, Janha, Jallow, Campino, Macinnis, Kwiatkowski and Conway2012) only examined genes with positive Tajima's D, whereas even negative Tajima's D could be ‘effectively positive’ if demographic history and the malaria life cycle were taken into account.
The importance of considering life history in studying population dynamics and evolution has been discussed and reviewed (Barrett et al. Reference Barrett, Thrall, Burdon and Linde2008). The factors such as epidemiological dynamics and host life history or behaviour could potentially affect transmission of parasites between hosts, effective population size, and patterns of genetic diversity. For example, it was shown that Microbotryum violaceum from plant host species with different life histories have different patterns of genetic diversity (Bucheli et al. Reference Bucheli, Gautschi and Shykoff2001). Unless life history is taken into proper consideration, inferences with regard to parasite evolution and effectiveness of intervention could possibly be misleading.
Future work
This study underlines the importance of developing modelling and methods that take life histories into account when studying malaria parasites or other species with unconventional life histories. Ignoring life histories could potentially lead to misinterpretation of selection signals and mislead our understanding of how selection has shaped the Plasmodium falciparum genome. Questions including which features of life history are important for studying parasite dynamics and/or parasite evolution, how they are important, and methods to incorporate them into analytical tools, remain to be studied. More specifically, among the population genetic tools that need to be investigated and re-examined under the malaria life cycle are tests comparing both within-species diversity and between-species divergence (the McDonald–Kreitman or MK test) (McDonald and Kreitman, Reference McDonald and Kreitman1991), approaches based on the relationship between phenotype (such as drug resistance) and genotype (genome-wide association study, GWAS), linkage disequilibrium-based tests (EHH test and iHS test) (Sabeti et al. Reference Sabeti, Reich, Higgins, Levine, Richter, Schaffner, Gabriel, Platko, Patterson, McDonald, Ackerman, Campbell, Altshuler, Cooper, Kwiatkowski, Ward and Lander2002; Voight et al. Reference Voight, Kudaravalli, Wen and Pritchard2006) and tools based on between-population differentiation (F st -based test).
In population genetics, the MK test is thought to be robust to demographic changes because synonymous and non-synonymous mutations are both affected by the same demography (Nielsen, Reference Nielsen2001). However, the malaria life cycle might influence fixation and polymorphism in different ways than in the WF model, and so the robustness of the MK test could be compromised. Even more importantly, different species that are used to calculate divergence (such as P. falciparum and Plasmodium reichenowi) may have different hosts and life histories, and this adds another complexity and potential bias in tests in which between-species divergence is required. Genome-wide association tests and linkage disequilibrium-based tests have been used in malaria parasites to identify loci related to drug resistance (Van Tyne et al. Reference Van Tyne, Park, Schaffner, Neafsey, Angelino, Cortese, Barnes, Rosen, Lukens, Daniels, Milner, Johnson, Shlyakhter, Grossman, Becker, Yamins, Karlsson, Ndiaye, Sarr, Mboup, Happi, Furlotte, Eskin, Kang, Hartl, Birren, Wiegand, Lander, Wirth, Volkman and Sabeti2011; Chang et al. Reference Chang, Park, Galinsky, Schaffner, Ndiaye, Ndir, Mboup, Wiegand, Volkman, Sabeti, Wirth, Neafsey and Hartl2012; Park et al. Reference Park, Lukens, Neafsey, Schaffner, Chang, Valim, Ribacke, Van Tyne, Galinsky, Galligan, Becker, Ndiaye, Mboup, Wiegand, Hartl, Sabeti, Wirth and Volkman2012), yet the power of these tools under the malaria life cycle and their relationship with effective recombination rate and transmission intensity have not been investigated. It remains to be determined how recombination and enhanced genetic drift under the malaria life cycle interact to affect the decay of linkage disequilibrium through time. With genomic sequences of samples from different geographical locations available, F st -based tests could be useful to detect local adaptation, but again the interaction of migration between populations, drift and selection under the malaria life cycle need to be studied. In the meantime, researchers should be cautious and are encouraged to consider potential biases introduced by life history when interpreting patterns of genetic diversity and/or drawing inferences from genetic analysis of malaria parasites.
ACKNOWLEDGEMENTS
The authors thank Daniel Park for helpful discussion on the method of estimating selection coefficients.
FINANCIAL SUPPORT
This study is supported by NIH grant AI099105. H.H.C. is supported by the National Institute of General Medical Sciences of the National Institutes of Health under award number U54GM088558. The content is solely the responsibility of the authors and does not necessarily represent the official views of the National Institute of General Medical Sciences or the National Institutes of Health. The funders had no role in study design, data collection and analysis, decision to publish, or preparation of the manuscript.


 Open access