


What we say can sometimes … be challenging for the sake of eliciting a response, sometimes it can be genuine doubt about what the position of a person might be, sometimes we’re talking to each other and we’re raising points through the questions that we want our colleagues to consider with us … there’s lots of reasons for what we’re doing, but none of them are ever perfectly understood … among the people who are listening.
—Sotomayor ( Reference Sotomayor 2019 )Introduction
Speech and dialogue are at the heart of politics. Candidates appeal to voters through rhetoric, legislators contest policy during floor debates, courts probe legal argumentation with questioning, and voters discuss all of these with friends and family. Indeed, nearly every political institution in the world, from small-town councils to the United Nations General Assembly, involves verbal communication. Yet quantitative political science has only just begun to analyze political speech—and when it does, analysts have done so with the tools of text analysis. While fruitful, these methods entirely ignore the way in which words are spoken.
This channel of communication, vocal tone, carries a wealth of unexploited information. In the next section, we explain how tone is used by listeners to assess speakers’ types and mental states. When politicians express themselves skeptically, compassionately, or fervently, their speech conveys more than the mere words that are spoken. Among other information, tone conveys beliefs, preferences, and the intensity with which they are held—or at least, the impressions of these characteristics that the speaker hopes to leave on their audience. The role of voice in persuading others—be they colleagues, adversaries, or electorates—to do what they would not otherwise do has been known at least since Aristotle’s On Rhetoric. Perhaps surprisingly, audio recordings are already widely available and have been used in literatures spanning political debates, campaign advertisements, campaign speech, legislative speech, television news, talk radio, and judicial deliberation. But almost universally, researchers have studied this data by extracting mere textual transcripts, then discarding the vast amount of untapped data that remains. In this paper, we introduce a new method that allows researchers to not only measure vocal tone in high-dimensional audio data but also study how it is used in political interactions.
Given the ubiquity of verbal communication in politics, why are models of speech only now being introduced? In this paper, we identify and resolve three challenges to the widespread analysis of speech audio. First, speech audio recordings do not naturally arrive in a format that is easy to analyze statistically. In “Audio as Data,” we demonstrate how audio recordings of speech can be represented numerically, drawing on insights from signal processing and linguistics. Second, the theoretically interesting quantities signaled by human speech—which may range from basic emotions (e.g., anger) to abstract concepts (e.g., decisiveness), depending on substantive domain—are latent variables that are not directly observed in audio data but must be inferred. In “A Model of Conversation Dynamics,” we address this by developing a semisupervised model for human speech, which infers latent tones of voice and provides a principled measure of uncertainty for the estimated patterns in their use. Third, speech is inherently context-dependent—theories suggest that candidates’ vocal tone may vary depending on their position in the polls or the topic at hand—and dynamic, with back-and-forth interaction between speakers. In dialogues like political debates or media interviews, an interruption by one person may be met with a polite but firm response, whereas a different interjection could produce an angry retort. We refer to these and other temporal patterns in the choice of tone as the flow of speech. Interdependence is often treated as a nuisance or ignored entirely, but we show that speech flow is a valuable source of information about human interaction. By directly modeling this phenomenon, new substantive questions about dynamic interactions are opened to principled statistical inquiry.
In “Testing Theories of Supreme Court Deliberation,” we demonstrate that speech tone and flow are substantively important by resolving an ongoing debate in the study of the Supreme Court. Judicial scholars have long disagreed over models of justice behavior in deliberation; some argue that justices are shrewd political actors who maneuver to influence the decisions of their peers, while others hold that justices cast sincere votes and engage in genuine expression according to their respective legal philosophies. We measure and extensively validate a key auditory quantity of interest that is unmeasurable with only the text of speech: skepticism, an individual’s vocal expression of their judgment about an assertion or argument. Existing theories suggest diverging observable implications for the expected flow of questioning—when one justice should express skepticism and how other subsequent justices should respond in their own speech—which we use to construct previously infeasible empirical tests of judicial behavior. We find that estimated flow is highly consistent with a theory of genuine fact-finding, and it undermines the competing account of strategic manipulation. We then conclude by noting several open areas of research highlighted by this manuscript.
The Importance of Audio
It is well-known that vocal tone plays an important role in human communication, beyond a speaker’s choice of words. In this section, we review evidence that listeners extract considerable information from vocal tone, drawing on numerous studies in linguistics and psychology. We then identify a wide range of literatures in political science that currently study rich speech recordings using textual methods alone, ignoring the auditory component. Taken together, these points suggest that political science is currently missing a great deal by discarding the raw source audio. We briefly note a handful of the many possible applications in which our speech model can help test existing and new theories about political deliberation.
Audio Contains Exclusive Information
Tens of thousands of studies have decisively established the importance of nontextual cues in human speech.Footnote 1 Among other well-replicated results, they have shown that respondents’ perceptions—including dehumanization of those with opposing political views (Schroeder and Epley Reference Schroeder and Epley2016)—differ dramatically when exposed to audio recordings of speech, as opposed to transcripts alone. Countless experiments in linguistics and psychology have explored specific auditory mechanisms through which a speaker’s voice shapes the information gleaned by listeners on numerous dimensions. Speech audio has been shown to convey information about speakers’ static type (e.g., power), as well as their time-varying characteristics (e.g., emotional state). We briefly review this literature.
Signals of a Speaker’s Type
Much is inferred about a speaker simply from the general sound of their voice. Humans use vocal tone to draw conclusions about competence, education, and trustworthiness, among many other attributes (Anderson et al. Reference Anderson, Klofstad, Mayew and Venkatachalam2014; Zuckerman and Driver Reference Zuckerman and Driver1989). In the political domain, both observational and experimental research has shown that voters’ preferences are affected by the sound of a candidate’s voice (Gregory and Gallagher Reference Gregory and Gallagher2002; Klofstad Reference Klofstad2016; Klofstad, Anderson, and Peters Reference Klofstad, Anderson and Peters2012; Podesva et al. Reference Podesva, Reynolds, Callier and Baptiste2015; Surawski and Ossoff Reference Surawski and Ossoff2006; Tigue et al. Reference Tigue, Borak, O’Connor, Schandl and Feinberg2012). This effect is mediated, at least in part, by the belief that certain speaking styles are associated with strong, dominant leaders who are more likely to prevail in conflict (Klofstad, Anderson, and Nowicki Reference Klofstad, Anderson and Nowicki2015; Laustsen, Petersen, and Klofstad Reference Laustsen, Petersen and Klofstad2015). These patterns appear to generalize well across a range of political roles (Anderson and Klofstad Reference Anderson and Klofstad2012), building on well-established findings in psychology that nontextual elements of human conversation shift perceptions of speakers’ social power (Carney, Hall, and LeBeau Reference Carney, Hall and LeBeau2005; Hodges-Simeon, Gaulin, and Puts Reference Hodges-Simeon, Gaulin and Puts2010; Scherer, London, and Wolf Reference Scherer, London and Wolf1973), credibility, persuasiveness (Apple, Streeter, and Krauss Reference Apple, Streeter and Krauss1979; Burgoon, Birk, and Pfau Reference Burgoon, Birk and Pfau1990; Hamilton and Stewart Reference Hamilton and Stewart1993), and intelligence (Brown, Strong, and Rencher Reference Brown, Strong and Rencher1974; Schroeder and Epley Reference Schroeder and Epley2015; Smith et al. Reference Smith, Brown, Strong and Rencher1975). These results suggest that the way in which individuals speak reveals, at a minimum, how they wish to be perceived by their audiences. For example, Touati (Reference Touati1993) found that a politician’s pitch contour was more variable before an election and monotonic after, suggesting a pre-election desire to signal attributes like competence that are associated with this vocal tone.
In political science, research on debates has shown that the way politicians express themselves matters. Hinck and Hinck (Reference Hinck and Hinck2002, 236) argue that audiences scrutinize rhetoric for “politeness strategies” that are used to “measure a candidate’s good will and judgment regarding his image, his opponent’s, and the values he aspires to represent for the community.” Evidence from real-time voter reactions suggests that overly aggressive attacks can lead to immediate drops in ratings (McKinney, Kaid, and Robertson Reference McKinney, Kaid and Robertson2001). The instantaneous effect of utterances depends on factors like audience composition (Boydstun et al. Reference Boydstun, Glazier, Pietryka and Resnik2014), implying politicians may benefit by presenting themselves differently depending on context. In this vein, scholars such as Benoit, Blaney, and Pier (Reference Benoit, Blaney and Pier1998) have advanced contextualized theories of rhetoric indicating when candidates should attack, defend, or self-acclaim across a campaign—not only in debates but also in speeches and advertisements; Brader (Reference Brader2006) provides evidence that politicians selectively target emotional appeals based on context-specific expected benefits. Still others have posited that conversational flow plays a particularly important role in voter evaluations. Discussing debates, town halls, and talk show appearances, Beck (Reference Beck1996) asserts that to be perceived as presidential, “candidates must project themselves as able to cope and excel in spite of conflict over issues and despite their opponents’ attempts to define them,” and that success “hinges on their interactional skills, not just their ability to look a certain way or say particular things.” Nor does the role of rhetoric diminish after election: a broad literature on “going public” (Kernell, Reference Kernell2006) explores how presidents increasingly make televised appeals directly to the public. However, work on political rhetoric has largely relied on qualitative methods or labor-intensive human coding due to the difficulty of empirical analysis—a gap that our method directly addresses.
Signals of a Speaker’s Current State
Speech signals much more than “presidentialness” or other time-invariant characteristics. Temporal variation in vocal tone can also indicate the mental state—such as emotions or impressions (Banse and Scherer Reference Banse and Scherer1996; Johnstone and Scherer Reference Johnstone and Scherer2000; Kappas, Hess, and Scherer Reference Kappas, Hess, Scherer, Feldman and Rimé1991; Scherer Reference Scherer1995; Scherer, Koivumaki, and Rosenthal Reference Scherer, Koivumaki and Rosenthal1972)—that a speaker currently wishes to convey. Some of this variation has subconscious biological origins. Certain emotional states produce physiological effects such as mouth dryness, accelerated breathing, muscular tension, or tremors (Ohala Reference Ohala, Masek, Hendrick and Miller1981), which have audible effects on speech, though practiced speakers like actors and politicians can consciously emulate these unconscious effects.Footnote 2 Vocal mannerisms also convey a speaker’s current impressions of a conversation, such as their level of certainty, understanding, agreement, and belief (Manusov and Trees Reference Manusov and Trees2002). These vocal cues form an important part of the dynamic interplay between speakers in a conversation (Leathers Reference Leathers1979).
In “Testing Theories of Supreme Court Deliberation,” we build on this work by studying one particular time-varying speech tone justices’ expressed skepticism. Skepticism is an important signal—perhaps genuine—of disagreement with or incredulity about assertions and legal arguments in the context of oral arguments. Patterns in the flow of conversation shed light on how justices deliberate, just as patterns of matter-of-fact questioning or righteous indignation in campaign debates and impeachment hearings can help reveal the nature of interactions in these political arenas. We show that different theoretical accounts of deliberation imply diverging temporal patterns in speech flow, allowing us to construct an empirical test for competing models of Supreme Court behavior.
Relatedly, speech audio can affect a listener’s trust in the speaker (Schirmer et al. Reference Schirmer, Feng, Sen and Penney2019; Zuckerman et al. Reference Zuckerman, DeFrank, Hall, Larrance and Rosenthal1979); specifically, the listener’s suspicion that the speaker is lying (Manstead, Wagner, and MacDonald Reference Manstead, Wagner and MacDonald1984; Zuckerman, DePaulo, and Rosenthal Reference Zuckerman, DePaulo, Rosenthal and Berkowitz1981). To our knowledge, no work has directly tested the effect of vocal tone on perceived deception by politicians. Given the importance of credibility in conflict (Fearon Reference Fearon1994; Guisinger and Smith Reference Guisinger and Smith2002) and trust in elections (Hetherington Reference Hetherington1999; Levi and Stoker Reference Levi and Stoker2000), this relationship warrants future investigation. However, research has firmly established that these time-varying signals play an important role elsewhere in politics. For example, Dietrich, Enos, and Sen (Reference Dietrich, Enos and Sen2019) demonstrated that the average pitch of Supreme Court justice questions is predictive of their subsequent votes, even after controlling for text, important legal covariates, and justice ideology (Martin and Quinn Reference Martin and Quinn2002). Similarly, the average pitch of a legislator’s floor speech has also been used to proxy for issue commitment (Dietrich, Hayes, and O’Brien Reference Dietrich, Hayes and O’Brien2019) and can predict coverage on cable news (Dietrich, Schultz, and Jaquith Reference Dietrich, Schultz and Jaquith2018).
Political Science Already Studies Audio
Audio recordings of speech are thus indisputably a rich source of data. But how often are these recordings available in contexts of interest to political scientists? We now demonstrate that the answer is “quite often.” In fact, a wide range of research has already studied audio recordings of political speech—but in virtually every domain, researchers have done so by extracting transcripts, then discarding the remainder of their data.
In “A New Quantity of Interest in Judicial Behavior,” we consider one such domain. Here, published research has focused almost exclusively on the text of oral arguments (Black, Sorenson, and Johnson Reference Black, Sorenson and Johnson2013; Kaufman, Kraft, and Sen Reference Kaufman, Kraft and Sen2018; Ringsmuth, Bryan, and Johnson Reference Ringsmuth, Bryan and Johnson2013).Footnote 3 For example, Black et al. (Reference Black, Treul, Johnson and Goldman2011) examine how justices question parties in oral arguments, showing that text-based measures of affective questioning can signal voting decisions. In a direct comparison, we demonstrate that a comparable audio-based measure outperforms this prior work by three times, using its own evaluation task.
However, the Supreme Court is hardly the only context in which political scientists are already studying speech. Countless other studies have examined political debates (Bayley Reference Bayley2004; Benoit Reference Benoit2013; Conway et al. Reference Conway, Gornick, Burfeind, Mandella, Kuenzli, Houck and Fullerton2012; Fridkin et al. Reference Fridkin, Kenney, Gershon, Shafer and Woodall2007; Hart and Jarvis Reference Hart and Jarvis1997; Thomas, Pang, and Lee Reference Thomas, Pang and Lee2006), campaign advertisements (Carlson and Montgomery Reference Carlson and Montgomery2017; Fridkin and Kenney Reference Fridkin and Kenney2011; Spiliotes and Vavreck Reference Spiliotes and Vavreck2002), campaign speech (Bligh et al. Reference Bligh, Merolla, Schroedel and Gonzalez2010; Degani Reference Degani2015; Laver, Benoit, and Garry Reference Laver, Benoit and Garry2003; Olson et al. Reference Olson, Yu, Poe, Trantham and Waterman2012; Schroedel et al. Reference Schroedel, Bligh, Merolla and Gonzalez2013), legislative speech (Herzog and Benoit Reference Herzog and Benoit2015; Lauderdale and Herzog Reference Lauderdale and Herzog2016; Proksch and Slapin Reference Proksch and Slapin2012; Reference Proksch and Slapin2015; Quinn et al. Reference Quinn, Monroe, Colaresi, Crespin and Radev2010; Schwarz, Traber, and Benoit Reference Schwarz, Traber and Benoit2017; Slapin and Proksch Reference Slapin and Proksch2008), television news (Behr and Iyengar Reference Behr and Iyengar1985; Mermin Reference Mermin1997; Oegema and Kleinnijenhuis Reference Oegema and Kleinnijenhuis2000; Rozenas and Stukal Reference Rozenas and Stukal2019; Sanders and Gavin Reference Sanders and Gavin2004; Semetko and Valkenburg Reference Semetko and Valkenburg2000; Young and Soroka Reference Young and Soroka2012), talk radio (Conroy-Krutz and Moehler Reference Conroy-Krutz and Moehler2015; Hofstetter et al. Reference Hofstetter, Barker, Smith, Zari and Ingrassia1999; Ross Reference Ross2016; Sobieraj and Berry Reference Sobieraj and Berry2011), and political addresses (Cohen Reference Cohen1995; Ritter and Howell Reference Ritter and Howell2001; Rule, Cointet, and Bearman Reference Rule, Cointet and Bearman2015; Young and Perkins Reference Young and Perkins2005).
Each of these studies used text analysis to study a political context in which communication was not written and read as text, but rather was spoken and heard as audio. Given the relative youth of text analysis methods, it is perhaps surprising how often recorded speech is analyzed in this way. The mismatch between data and methods results in the inevitable loss of nontextual information, suggesting that richer models have the potential to contribute to research in each of these domains.
Audio as Data
The number of papers developing and applying methods for text analysis has increased rapidly in recent years (Wilkerson and Casas Reference Wilkerson and Casas2017), and workflows for preprocessing raw text are well developed (Benoit et al. Reference Benoit, Watanabe, Wang, Nulty, Obeng, Müller and Matsuo2018; Grimmer and Stewart Reference Grimmer and Stewart2013; Lucas et al. Reference Lucas, Nielsen, Roberts, Stewart, Storer and Tingley2015). However, little effort has been devoted to the analysis of other components of communication—like audio—“as data.” In this section, we explain how unstructured audio recordings of human speech can similarly be preprocessed into structured data in preparation for statistical analysis.
The primary unit of analysis in speech is the utterance: a continuous, single-speaker segment, typically concluding with a clear pause. The length of utterances are unequal but on the order of 10 seconds. Within each utterance, we split the recording into successive moments, or extremely short windows of time.Footnote 4 In each moment, the raw audio is then summarized with auditory features that are known to convey emotion and tone of voice, drawing on established literatures in psychology, phonetics, signal processing, and computer science (El Ayadi, Kamel, and Karray Reference Ayadi, Moataz and Karray2011; Ververidis and Kotropoulos Reference Ververidis and Kotropoulos2006). Researchers can easily calculate these features with a single function in our accompanying R package, communication, which also implements other useful preprocessing steps.Footnote 5 We briefly describe audio featurization to provide intuition.Footnote 6
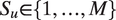
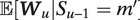
Within each moment, the raw audio recording consists of a waveform, or univariate high-frequency time series of pressure measurements. We characterize this short recording with auditory features describing the sound perceived by listeners. Selected features are illustrated in Figure 1 by describing an audio source for which a feature is high or low. For example, some features are simple functions of the raw waveform. One feature is the “zero crossing rate” (ZCR), or simply how often the waveform crosses zero (neutral pressure). Sibilants (e.g., /s/, /z/) have a particularly high ZCR, whereas vowels have a low ZCR. Other auditory features, like “energy” (loudness), help distinguished /z/ (which is “voiced,” i.e., involving vocal cord vibrations) from voiceless /s/.
Illustration of Selected Audio Features
Note: The left column identifies a class of audio summaries that are used to represent the raw audio data. Subsequent columns contain textual descriptions and graphical depictions of audio sources for which the relevant feature has relatively low and high values. For example, ZCR (zero-crossing rate) has a low value for the vowel /a/ and a high value for the consonant /s/. The ZCR and energy graphs depict pressure waveforms from machine-synthesized speech recordings; louder sounds are larger in amplitude and hissing sounds are higher in ZCR. Spectral graphs represent the Fourier transformation of the synthesized recordings; female voices are concentrated in higher frequency ranges. Pitch is an example of a feature that can be derived from the spectral peaks.

Other features are based on the audio spectrum, computed via a Fourier transformation of the waveform. This captures (among other things) the contribution of the baritone or soprano ranges to overall loudness. Other undepicted features that can be computed from this representation include pitch (dominant frequency, or spectral peak) and Mel-frequency cepstral coefficients (MFCCs, describing overall shape). Because English words may be emphasized with higher sustained pitch or with sharp falling pitch, these features provide additional emotional information. For example, compare “We’re citing that case?” to “We’re citing that case!” Pitch is also higher when speakers are vocally tense, including when speakers are emotionally aroused. Online Appendix Section 2 documents all features used in analysis. In general, no single auditory feature distinguishes all sounds or vocal tones; to address this challenge, we develop a method that can exploit dozens or even hundreds of features in analyzing speech.
Advances over Existing Approaches
Outside of political science, a large and interdisciplinary body of research has sought to model or classify human speech. A common approach is to collapse each utterance into a vector of descriptive statistics (e.g., mean and standard deviation of pitch), which can be used in standard machine-learning classifiers (Dellaert, Polzin, and Waibel Reference Dellaert, Polzin and Waibel1996; McGilloway et al. Reference McGilloway, Cowie, Douglas-Cowie, Gielen, Westerdijk and Stroeve2000). However, these reduced representations discard enormous amounts of auditory data. To avoid this loss of information, hidden Markov models are often used to model time-series speech. The discrete latent states in this model map well to actual human speech, which is often represented in terms of discrete phonemes, or minimal units of sound.Footnote 7
The model of audio and speech structure (MASS) builds on these existing approaches in statistics and computer science in two main ways. First, computational constraints mean that typical analyses based on hidden Markov models (HMMs) are able to incorporate only a fraction of the features we incorporate. Nogueiras et al. (Reference Nogueiras, Moreno, Bonafonte and Mariño2001), for example, use just two features to represent a moment in time, while Kwon et al. (Reference Kwon, Chan, Hao and Lee2003) use 13 features and Mower et al. (Reference Mower, Metallinou, Lee, Kazemzadeh, Busso, Lee and Narayanan2009) use only the MFCC coefficients. Second, and more importantly, MASS is the first to directly model the flow of speech—that is, contextual and temporal patterns in vocal tone—in terms of the meaningful structural features encoded in conversation metadata.
The Substantive Importance of Speech Flow
Modeling the flow of speech permits principled empirical inquiry into a large and varied set of substantive questions about interaction between speakers. This enables the study of new questions and quantities of interest. For example, by modeling the dynamics of speech (i.e., change of flow in response to prior events), MASS allows researchers to ask and answer questions about how a line of argumentation affects downstream discourse. While these sorts of questions are common in theoretical models of sequential games (Dancey and Goren Reference Dancey and Goren2010; Ramirez Reference Ramirez2009), they are rarely tested empirically. We suggest that this is due to the absence of a suitable empirical model, and “Testing Theories of Supreme Court Deliberation” demonstrates how MASS can answer questions of this sort.
A Model of Conversation Dynamics
We now develop a generative statistical model for the audio data that represents political speech. Below, we formally define the assumed generative model. After outlining the model, we next turn to estimation and inference, then discuss practical considerations in the modeling of speech.
The Model
Suppose we have a conversation with
 $ U $
sequential utterances, each of which arises from one of
$ U $
sequential utterances, each of which arises from one of
 $ M $
modes of speech. (To keep the exposition clear, here we consider the simplified setting in which a single conversation is analyzed. Online Appendix Section 1 presents the general multiconversation model, which is essentially identical.) Let
$ M $
modes of speech. (To keep the exposition clear, here we consider the simplified setting in which a single conversation is analyzed. Online Appendix Section 1 presents the general multiconversation model, which is essentially identical.) Let
 $ {S}_u\in \left\{1,\dots, M\right\} $
denote the speech mode, or tone, of utterance
$ {S}_u\in \left\{1,\dots, M\right\} $
denote the speech mode, or tone, of utterance
 $ u\in \left\{1,\dots, U\right\} $
. Broadly, the model contains two levels. The “upper” level, defined in Equations 1–2, characterizes the flow of speech, or the choice of
$ u\in \left\{1,\dots, U\right\} $
. Broadly, the model contains two levels. The “upper” level, defined in Equations 1–2, characterizes the flow of speech, or the choice of
 $ {S}_u $
. We assume that the conversation unfolds as a time-varying stochastic process in which
$ {S}_u $
. We assume that the conversation unfolds as a time-varying stochastic process in which
 $ {S}_u $
is chosen based on the conversational context at that moment, encoded in the vector
$ {S}_u $
is chosen based on the conversational context at that moment, encoded in the vector
 $ {\boldsymbol{W}}_u $
. In the “lower” level, we then outline a generative model for utterance
$ {\boldsymbol{W}}_u $
. In the “lower” level, we then outline a generative model for utterance
 $ u $
’s auditory characteristics,
$ u $
’s auditory characteristics,
 $ {\boldsymbol{X}}_u $
. Importantly, this generative model will differ depending on the tone of voice selected in the upper model,
$ {\boldsymbol{X}}_u $
. Importantly, this generative model will differ depending on the tone of voice selected in the upper model,
 $ {S}_u $
. Equations 3–4 present the lower level more formally. The model is summarized graphically in Figure 2, and we refer readers there for a holistic view of how the various model components fit together.
$ {S}_u $
. Equations 3–4 present the lower level more formally. The model is summarized graphically in Figure 2, and we refer readers there for a holistic view of how the various model components fit together.
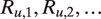
Illustration of Generative Model
Note: The directed acyclic graph represents the relationships encoded in Equations 1–4. In utterance
 $ u $
, the speaker selects tone
$ u $
, the speaker selects tone
 $ {S}_u $
based on “static” (i.e., externally given) time-varying covariates
$ {S}_u $
based on “static” (i.e., externally given) time-varying covariates
 $ {\boldsymbol{W}}_u^{\mathrm{stat}.} $
as well as “dynamic” conversational history covariates
$ {\boldsymbol{W}}_u^{\mathrm{stat}.} $
as well as “dynamic” conversational history covariates
 $ {\boldsymbol{W}}_u^{\mathrm{dyn}.} $
. (In the illustration,
$ {\boldsymbol{W}}_u^{\mathrm{dyn}.} $
. (In the illustration,
 $ {\boldsymbol{W}}_u^{\mathrm{dyn}.} $
depends only on the prior mode of speech, but more complex dynamic covariates can be constructed.) Based on the selected tone, the speaker composes an utterance by cycling through a sequence of sounds in successive moments,
$ {\boldsymbol{W}}_u^{\mathrm{dyn}.} $
depends only on the prior mode of speech, but more complex dynamic covariates can be constructed.) Based on the selected tone, the speaker composes an utterance by cycling through a sequence of sounds in successive moments,
 $ {R}_{u,1},{R}_{u,2},\dots $
, to form the word “mass.” Each sound generates the audio perceived by a listener according to its unique profile;
$ {R}_{u,1},{R}_{u,2},\dots $
, to form the word “mass.” Each sound generates the audio perceived by a listener according to its unique profile;
 $ {\boldsymbol{X}}_{u,t} $
is extracted from this audio.
$ {\boldsymbol{X}}_{u,t} $
is extracted from this audio.

We begin by modeling speech mode probabilities in each utterance as a multinomial logistic function of conversational context,
 $ {\boldsymbol{W}}_u $
. Note that
$ {\boldsymbol{W}}_u $
. Note that
 $ {\boldsymbol{W}}_u $
may include functions of conversational history, such as aggregate anger expressed by previous speakers over the course of an argument—that is,
$ {\boldsymbol{W}}_u $
may include functions of conversational history, such as aggregate anger expressed by previous speakers over the course of an argument—that is,
 $ {\sum}_{u^{\prime }<u}1\left({\boldsymbol{S}}_{u^{\prime }}=\mathrm{anger}\right) $
—which might induce a sharp retort in utterance
$ {\sum}_{u^{\prime }<u}1\left({\boldsymbol{S}}_{u^{\prime }}=\mathrm{anger}\right) $
—which might induce a sharp retort in utterance
 $ u $
. These follow
$ u $
. These follow
 $$ {\Delta}_{u,m}=\exp \left({\boldsymbol{W}}_u^{\mathrm{\top}}{\zeta}_m\right)/\sum \limits_{m^{\prime }=1}^M\exp \left({\boldsymbol{W}}_u^{\mathrm{\top}}{\zeta}_{m^{\prime }}\right)\hskip1em \mathrm{and} $$
 $$ {S}_u\sim \mathrm{Cat}\left({\boldsymbol{\Delta}}_u\right), $$
where
 $ {\boldsymbol{\Delta}}_u=\left[{\Delta}_{u,1},\dots, {\Delta}_{u,M}\right] $
and
$ {\boldsymbol{\Delta}}_u=\left[{\Delta}_{u,1},\dots, {\Delta}_{u,M}\right] $
and
 $ {\zeta}_m $
is a mode-specific coefficient vector through which
$ {\zeta}_m $
is a mode-specific coefficient vector through which
 $ {\boldsymbol{W}}_u $
affects the relative prevalence of mode
$ {\boldsymbol{W}}_u $
affects the relative prevalence of mode
 $ m $
. The tone of utterance
$ m $
. The tone of utterance
 $ u $
,
$ u $
,
 $ {S}_u $
, is one of the primary quantities of interest, along with the coefficients
$ {S}_u $
, is one of the primary quantities of interest, along with the coefficients
 $ {\zeta}_m $
that explain why certain tones are used more in particular contexts. However, generally speaking, tone is not directly observable to the analyst; the utterance’s auditory characteristics,
$ {\zeta}_m $
that explain why certain tones are used more in particular contexts. However, generally speaking, tone is not directly observable to the analyst; the utterance’s auditory characteristics,
 $ {\boldsymbol{X}}_u $
, are the only available information. (As we discuss in the following section, the analyst will begin estimation by obtaining a sample of utterances with human-labeled tone.)
$ {\boldsymbol{X}}_u $
, are the only available information. (As we discuss in the following section, the analyst will begin estimation by obtaining a sample of utterances with human-labeled tone.)
Each
 $ {\boldsymbol{X}}_u $
is a matrix describing the auditory characteristics of utterance
$ {\boldsymbol{X}}_u $
is a matrix describing the auditory characteristics of utterance
 $ u $
. In this matrix, the
$ u $
. In this matrix, the
 $ t $
-th row describes the audio at moment
$ t $
-th row describes the audio at moment
 $ t $
in terms of
$ t $
in terms of
 $ D $
auditory features. Thus, the utterance audio is represented by a
$ D $
auditory features. Thus, the utterance audio is represented by a
 $ {T}_u\times D $
feature matrix, where
$ {T}_u\times D $
feature matrix, where
 $ {T}_u $
is the length of the utterance; because utterances may be of differing lengths,
$ {T}_u $
is the length of the utterance; because utterances may be of differing lengths,
 $ {\boldsymbol{X}}_u $
and
$ {\boldsymbol{X}}_u $
and
 $ {\boldsymbol{X}}_{u^{\prime }} $
may have differing numbers of rows.
$ {\boldsymbol{X}}_{u^{\prime }} $
may have differing numbers of rows.
To model the audio, we then assume that the
 $ m $
-th mode of speech is associated with its own Gaussian HMM that produces the auditory features as follows. At moment
$ m $
-th mode of speech is associated with its own Gaussian HMM that produces the auditory features as follows. At moment
 $ t $
in utterance
$ t $
in utterance
 $ u $
, the speaker enunciates the sound
$ u $
, the speaker enunciates the sound
 $ {R}_{u,t} $
—that is, the latent state, which may represent phonemes or phoneme groups such as plosives or fricatives. In successive moments, the speaker alternates through these latent sounds according to
$ {R}_{u,t} $
—that is, the latent state, which may represent phonemes or phoneme groups such as plosives or fricatives. In successive moments, the speaker alternates through these latent sounds according to
 $$ \left({R}_{u,t}|{S}_u=m\right)\sim \mathrm{Cat}\left({\Gamma}_{R_{u,t-1},\ast}^m\right), $$
with
 $ {\Gamma}_{k,\ast}^m $
denoting rows of the transition matrix,
$ {\Gamma}_{k,\ast}^m $
denoting rows of the transition matrix,
 $ \left[\Pr \left({R}_{u,t}=1|{R}_{u,t-1}=k\right),\dots, \Pr \Big({R}_{u,t}=K|{R}_{u,t-1}=k\Big)\right] $
. By modeling the usage patterns of different sounds in this way, we approximately capture the temporal structure that plays an important role in speech. (For example, most latent sounds are sustained for at least a few moments, and certain phonemes typically occur before the silence at the end of a word.) In turn, latent sound
$ \left[\Pr \left({R}_{u,t}=1|{R}_{u,t-1}=k\right),\dots, \Pr \Big({R}_{u,t}=K|{R}_{u,t-1}=k\Big)\right] $
. By modeling the usage patterns of different sounds in this way, we approximately capture the temporal structure that plays an important role in speech. (For example, most latent sounds are sustained for at least a few moments, and certain phonemes typically occur before the silence at the end of a word.) In turn, latent sound
 $ k $
is associated with its own auditory profile, which we operationalize as a multivariate Gaussian distribution with parameters
$ k $
is associated with its own auditory profile, which we operationalize as a multivariate Gaussian distribution with parameters
 $ {\boldsymbol{\mu}}^{m,k} $
and
$ {\boldsymbol{\mu}}^{m,k} $
and
 $ {\Sigma}^{m,k} $
. Finally, the raw audio heard at moment
$ {\Sigma}^{m,k} $
. Finally, the raw audio heard at moment
 $ t $
of utterance
$ t $
of utterance
 $ u $
—the signal perceived by a listener—is drawn as
$ u $
—the signal perceived by a listener—is drawn as
 $$ {\boldsymbol{X}}_{u,t}\sim \mathcal{N}\left({\boldsymbol{\mu}}^{S_u,{R}_{u,t}},{\Sigma}^{S_u,{R}_{u,t}}\right), $$
which completes the model. Thus, each mode of speech is represented with a rich and flexible HMM that nevertheless reflects much of the known structure of human speech. It is the differences in usage patterns and sound profiles—the Gaussian HMM parameters—that enable human listeners to distinguish one tone or speaker from another.
Estimation
We describe a procedure for estimating the model defined above, incorporating elements of both unsupervised and supervised learning. The researcher begins by determining the speech modes of interest, then identifying and labeling example utterances from each class. Within this training set—which might not be a subset of the primary corpus of interest—we consider each mode of speech in turn, using a fully unsupervised approach to learn the auditory profile and cadence of that speech mode. The results are applied to the full corpus to obtain “naïve” estimates of each utterance’s tone, based only on the audio features and ignoring conversational context. We then fit a model for the flow of conversation, use this to refine the “contextualized” tone estimates, and repeat in an iterative procedure. The specifics of each step are discussed below and in Online Appendix Section 1, and the workflow is outlined more formally in Algorithm 1.
Table 1 summarizes the data available for the primary corpus and training set, respectively indicated with
 $ \mathcal{C} $
and
$ \mathcal{C} $
and
 $ \mathcal{T} $
. The audio characteristics of each utterance,
$ \mathcal{T} $
. The audio characteristics of each utterance,
 $ \boldsymbol{X} $
, are observed for both the primary corpus and the training set. However, human-labeled tone of speech,
$ \boldsymbol{X} $
, are observed for both the primary corpus and the training set. However, human-labeled tone of speech,
 $ \boldsymbol{S} $
, is only known for the training set. We divide the conversational context into externally given but potentially time-varying “static metadata,”
$ \boldsymbol{S} $
, is only known for the training set. We divide the conversational context into externally given but potentially time-varying “static metadata,”
 $ {\boldsymbol{W}}^{\mathrm{stat}.} $
, and deterministic functions of conversational history that dynamically capture the prior tones of speech,
$ {\boldsymbol{W}}^{\mathrm{stat}.} $
, and deterministic functions of conversational history that dynamically capture the prior tones of speech,
 $ {\boldsymbol{W}}^{\mathrm{dyn}.} $
. The former is known for the primary corpus but may be unavailable for the training set, depending on how it is constructed; the latter is not directly observed for either.
$ {\boldsymbol{W}}^{\mathrm{dyn}.} $
. The former is known for the primary corpus but may be unavailable for the training set, depending on how it is constructed; the latter is not directly observed for either.
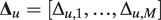
Observed and Unobserved Quantities

Note: Data that are (un)available to the analyst are (un)boxed. Attributes of the primary corpus (training set) are indicated with
 $ \mathcal{C}(\mathcal{T}) $
superscripts. Raw audio features,
$ \mathcal{C}(\mathcal{T}) $
superscripts. Raw audio features,
 $ \boldsymbol{X} $
, are observed for all utterances. The portion of the conversational context that relates to static metadata (
$ \boldsymbol{X} $
, are observed for all utterances. The portion of the conversational context that relates to static metadata (
 $ {\boldsymbol{W}}^{\mathrm{stat}.} $
) is available for at least the primary corpus, but dynamic contextual variables that depend on the tone of prior utterances (
$ {\boldsymbol{W}}^{\mathrm{stat}.} $
) is available for at least the primary corpus, but dynamic contextual variables that depend on the tone of prior utterances (
 $ {\boldsymbol{W}}^{\mathrm{dyn}.} $
) can only be estimated. In general, the tone of each utterance (
$ {\boldsymbol{W}}^{\mathrm{dyn}.} $
) can only be estimated. In general, the tone of each utterance (
 $ \boldsymbol{S} $
) is also unobserved, but the analyst possesses a small training set with human-labeled utterances.
$ \boldsymbol{S} $
) is also unobserved, but the analyst possesses a small training set with human-labeled utterances.
Our ultimate goal is to estimate the conversational flow parameters,
 $ \zeta $
, and the auditory parameters of each tone, which we gather in
$ \zeta $
, and the auditory parameters of each tone, which we gather in
 $ {\Theta}^m=\left({\mu}^m,{\Sigma}^m,{\Gamma}^m\right) $
for compactness. In what follows, we also refer to the collection of all tone parameters as
$ {\Theta}^m=\left({\mu}^m,{\Sigma}^m,{\Gamma}^m\right) $
for compactness. In what follows, we also refer to the collection of all tone parameters as
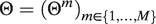 $ \Theta ={\left({\Theta}^m\right)}_{m\in \left\{1,\dots, M\right\}} $
. Under the model described in Equations 1–2, the likelihood can be expressed as
$ \Theta ={\left({\Theta}^m\right)}_{m\in \left\{1,\dots, M\right\}} $
. Under the model described in Equations 1–2, the likelihood can be expressed as
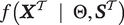
 $$ \mathrm{\mathcal{L}}\left(\zeta, \Theta \hskip0.5em |\hskip0.5em {\boldsymbol{X}}^{\mathcal{T}},{\boldsymbol{S}}^{\mathcal{T}},{\boldsymbol{X}}^{\mathcal{C}},{\boldsymbol{W}}^{\mathrm{stat}.,\mathcal{C}}\right)\hskip0.5em =\hskip0.5em f\left({\boldsymbol{X}}^{\mathcal{C}}\hskip0.5em |\hskip0.5em \zeta, \Theta, {\boldsymbol{W}}^{\mathrm{stat}.,\mathcal{C}}\right)\hskip0.5em f\left({\boldsymbol{X}}^{\mathcal{T}}\hskip0.5em |\Theta, {\boldsymbol{S}}^{\mathcal{T}}\right), $$
with one factor depending only on the primary corpus and another containing only the training set.
As a concession to computational constraints, we estimate the parameters in a stagewise fashion. The auditory parameters,
 $ \Theta $
, are calculated by maximizing the partial likelihood,
$ \Theta $
, are calculated by maximizing the partial likelihood,
 $ f\left({\boldsymbol{X}}^{\mathcal{T}}\hskip0.5em |\hskip0.5em \Theta, {\boldsymbol{S}}^{\mathcal{T}}\right) $
, corresponding to the training factor, rather than the full likelihood in Equation 5 (Wong Reference Wong1986). The full likelihood is then maximized with respect to the conversational flow parameters
$ f\left({\boldsymbol{X}}^{\mathcal{T}}\hskip0.5em |\hskip0.5em \Theta, {\boldsymbol{S}}^{\mathcal{T}}\right) $
, corresponding to the training factor, rather than the full likelihood in Equation 5 (Wong Reference Wong1986). The full likelihood is then maximized with respect to the conversational flow parameters
 $ \zeta $
, conditional on
$ \zeta $
, conditional on
 $ \Theta $
. The factorization and a detailed discussion of stagewise estimation are presented in Online Appendix Section 1.1.
$ \Theta $
. The factorization and a detailed discussion of stagewise estimation are presented in Online Appendix Section 1.1.
In Online Appendix Section 1.2, we detail our procedure for estimating the auditory profile and cadence for each speech mode. First, training utterances are divided according to their tone labels. Because the partial likelihood can be neatly factorized further as
 $ f\left({\mathbf{X}}^{\mathcal{T}}\hskip0.5em |\hskip0.5em \Theta, {\boldsymbol{S}}^{\mathcal{T}}\right)={\prod}_{m=1}^M{\prod}_{u\in \mathcal{T}}f{\left({\boldsymbol{X}}_u|{\Theta}^m\right)}^{\mathbf{1}\left({S}_u=m\right)} $
,
$ f\left({\mathbf{X}}^{\mathcal{T}}\hskip0.5em |\hskip0.5em \Theta, {\boldsymbol{S}}^{\mathcal{T}}\right)={\prod}_{m=1}^M{\prod}_{u\in \mathcal{T}}f{\left({\boldsymbol{X}}_u|{\Theta}^m\right)}^{\mathbf{1}\left({S}_u=m\right)} $
,
 $ {\hat{\Theta}}^m $
can be independently estimated for each speech mode with no further loss of information. For all training utterances of speech mode
$ {\hat{\Theta}}^m $
can be independently estimated for each speech mode with no further loss of information. For all training utterances of speech mode
 $ m $
, a regularized variant of the Baum–Welch algorithm, a standard estimation procedure for hidden Markov models, is used to obtain
$ m $
, a regularized variant of the Baum–Welch algorithm, a standard estimation procedure for hidden Markov models, is used to obtain
 $ {\hat{\Theta}}^m $
for the corresponding mode. Each of the resulting
$ {\hat{\Theta}}^m $
for the corresponding mode. Each of the resulting
 $ M $
tone-specific models are then applied to each utterance
$ M $
tone-specific models are then applied to each utterance
 $ u $
in the primary corpus to obtain the corrected emission probabilities
$ u $
in the primary corpus to obtain the corrected emission probabilities
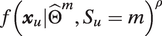 $ f{\left({\boldsymbol{x}}_u|{\hat{\Theta}}^m,{S}_u=m\right)}^{\rho } $
, which represents the probability that the utterance’s audio was generated by speech mode
$ f{\left({\boldsymbol{x}}_u|{\hat{\Theta}}^m,{S}_u=m\right)}^{\rho } $
, which represents the probability that the utterance’s audio was generated by speech mode
 $ m $
; this captures the extent to which the audio “sounds like” the relevant training examples. Naïve tone estimates can then be computed by combining these with the overall prevalence of each tone via Bayes’ rule. The corrective factor,
$ m $
; this captures the extent to which the audio “sounds like” the relevant training examples. Naïve tone estimates can then be computed by combining these with the overall prevalence of each tone via Bayes’ rule. The corrective factor,
 $ \rho $
, approximately accounts for unmodeled autocorrelation in the audio features and ensures that the naïve estimates are well calibrated (for details, see Online Appendix Section 1.3). This shared correction, along with the number of latent sounds and strength of regularization, are determined by likelihood-based cross validation (van der Laan, Dudoit, and Keles Reference van der Laan, Dudoit and Keles2004) in the training set.
$ \rho $
, approximately accounts for unmodeled autocorrelation in the audio features and ensures that the naïve estimates are well calibrated (for details, see Online Appendix Section 1.3). This shared correction, along with the number of latent sounds and strength of regularization, are determined by likelihood-based cross validation (van der Laan, Dudoit, and Keles Reference van der Laan, Dudoit and Keles2004) in the training set.
We now briefly describe an expectation-maximization algorithm for the conversation-flow parameters,
 $ \zeta $
, reserving derivations and other details for Online Appendix Section 1.4.Footnote
8
An inspection of Equation 5 shows that this procedure will depend only on
$ \zeta $
, reserving derivations and other details for Online Appendix Section 1.4.Footnote
8
An inspection of Equation 5 shows that this procedure will depend only on
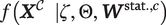 $ f\left({\boldsymbol{X}}^{\mathcal{C}}\hskip0.5em |\zeta, \Theta, {\boldsymbol{W}}^{\mathrm{stat}.,c}\right) $
, since the remaining term does not involve
$ f\left({\boldsymbol{X}}^{\mathcal{C}}\hskip0.5em |\zeta, \Theta, {\boldsymbol{W}}^{\mathrm{stat}.,c}\right) $
, since the remaining term does not involve
 $ \zeta $
. We proceed by augmenting the observed data with the latent tones,
$ \zeta $
. We proceed by augmenting the observed data with the latent tones,
 $ {\boldsymbol{S}}^{\mathcal{C}} $
, and the conversation-history variables that depend on them,
$ {\boldsymbol{S}}^{\mathcal{C}} $
, and the conversation-history variables that depend on them,
 $ {\boldsymbol{W}}^{\mathrm{dyn}.,\mathcal{C}} $
. The augmented likelihood,
$ {\boldsymbol{W}}^{\mathrm{dyn}.,\mathcal{C}} $
. The augmented likelihood,
 $ f\left({\boldsymbol{X}}^{\mathcal{C}},{\boldsymbol{S}}^{\mathcal{C}},{\boldsymbol{W}}^{\mathrm{dyn}.,\mathcal{C}}\hskip0.5em |\hskip0.5em \zeta, \Theta, {\boldsymbol{W}}^{\mathrm{stat}.,\mathcal{C}}\right) $
, is then iteratively optimized. However, the closed-form expectation of the augmented likelihood is intractable. We therefore replace the full E-step with a blockwise procedure that sweeps through the unobserved E-step variables sequentially.Footnote
9
Finally, the maximization step for
$ f\left({\boldsymbol{X}}^{\mathcal{C}},{\boldsymbol{S}}^{\mathcal{C}},{\boldsymbol{W}}^{\mathrm{dyn}.,\mathcal{C}}\hskip0.5em |\hskip0.5em \zeta, \Theta, {\boldsymbol{W}}^{\mathrm{stat}.,\mathcal{C}}\right) $
, is then iteratively optimized. However, the closed-form expectation of the augmented likelihood is intractable. We therefore replace the full E-step with a blockwise procedure that sweeps through the unobserved E-step variables sequentially.Footnote
9
Finally, the maximization step for
 $ \zeta $
reduces to a weighted multinomial logistic regression in which
$ \zeta $
reduces to a weighted multinomial logistic regression in which
 $ \mathbf{1}\left({S}_u=m\right) $
is fit on
$ \mathbf{1}\left({S}_u=m\right) $
is fit on
 $ \unicode{x1D53C}\left[{\boldsymbol{W}}_u|{S}_{u-1}={m}^{\prime}\right] $
for every possible
$ \unicode{x1D53C}\left[{\boldsymbol{W}}_u|{S}_{u-1}={m}^{\prime}\right] $
for every possible
 $ m $
and
$ m $
and
 $ {m}^{\prime } $
, with weights corresponding to the probability of that transition.
$ {m}^{\prime } $
, with weights corresponding to the probability of that transition.
Finally, we observe that the unmodeled autocorrelation discussed above renders model-based inference invalid. To address this issue, we estimate the variance of parameter estimates by bootstrapping utterances in the training set, ensuring that dependence between successive moments in an utterance do not undermine our results (Online Appendix Section 1.5 discusses potential issues in bootstrapping). The full estimation procedure is outlined in Algorithm 1. Other quantities of interest, such as those discussed in “Testing Theories of Supreme Court Deliberation,” follow directly from the conversation-flow parameters,
 $ \zeta $
, or the auditory parameters,
$ \zeta $
, or the auditory parameters,
 $ \Theta $
; inference on these quantities follows a similar bootstrap approach.
$ \Theta $
; inference on these quantities follows a similar bootstrap approach.
Data: Audio features (
 $ {\boldsymbol{X}}^{\mathcal{C}},{\boldsymbol{X}}^{\mathcal{T}} $
), static metadata for primary corpus (
$ {\boldsymbol{X}}^{\mathcal{C}},{\boldsymbol{X}}^{\mathcal{T}} $
), static metadata for primary corpus (
 $ {\boldsymbol{W}}^{\mathrm{stat}.,\mathcal{C}} $
)
$ {\boldsymbol{W}}^{\mathrm{stat}.,\mathcal{C}} $
)
Result: Auditory parameters
 $ \Theta $
, conversational flow parameters
$ \Theta $
, conversational flow parameters
 $ \zeta $
Procedure:
1. Define problem.
Analyst determines tones of interest and rubric for human coding. Human-coded tone labels are obtained for training set (
 $ {\boldsymbol{S}}^{\mathcal{T}} $
).
$ {\boldsymbol{S}}^{\mathcal{T}} $
).
2. Fit auditory parameters (
 $ \Theta $
) by maximizing partial likelihood on training set (
$ \Theta $
) by maximizing partial likelihood on training set (
 $ \mathcal{T} $
).
$ \mathcal{T} $
).

3. Fit conversational flow parameters (ζ) using primary corpus (
 $ \mathcal{C} $
), conditional on
$ \mathcal{C} $
), conditional on
 $ \Theta $
.
$ \Theta $
.

Algorithm 1: Stagewise Estimation Procedure. After defining the tones of interest and obtaining a labeled training set, the analyst conducts cross validation to set ancillary parameters such as the number of assumed sounds in each mode of speech (not depicted). After fixing the ancillary parameters, the cadence and auditory characteristics of each speech mode are estimated from the training set by an iterative expectation-maximization procedure. These speech parameters are then fixed, and the relationship between conversational context and flow of speech is estimated from the primary corpus. In the multiple-conversation case, the utterance loop in step 3 is nested within an outer loop over conversations. Statistical inference is conducted by resampling
 $ \mathcal{T} $
and repeating steps 2–3 within the bootstrapped training set (not depicted) to obtain bootstrap-aggregated point estimates and bootstrap variance estimates for flow-of-speech parameters and other quantities of interest.
$ \mathcal{T} $
and repeating steps 2–3 within the bootstrapped training set (not depicted) to obtain bootstrap-aggregated point estimates and bootstrap variance estimates for flow-of-speech parameters and other quantities of interest.
A New Quantity of Interest in Judicial Behavior
In this section, we introduce an original corpus of Supreme Court oral argument audio recordings scraped from the Oyez Project (Cornell 2015)Footnote 10 and develop a new quantity of theoretical interest: judicial skepticism. We first describe the data, then illustrate the concept of skepticism with a detailed case study. Finally, we extensively validate the model and compare it with related work analyzing the text of oral arguments alone. Importantly, we demonstrate that this substantive quantity is not measurable with existing methods. Text-based classifiers are on par with random guessing (or worse, depending on the evaluation metric), whereas MASS performs nearly as well as human coders. A full analysis of deliberation in oral arguments—a theoretical analysis that is possible only with a model for speech flow—is reserved for “Testing Theories of Supreme Court Deliberation.”
Audio Data from Supreme Court Oral Arguments
We limit our analysis to the natural court that begins with the appointment of Justice Kagan and concludes with the passing of Justice Scalia, so that the composition of the Court remains constant for the entirety of the period we analyze. The Oyez data contains an accompanying textual transcript, speaker names for each utterance, and timestamps for utterance start and stop times. In addition, we inferred the target side (i.e., petitioner or respondent) of each justice’s question based on the side of the most recently speaking lawyer. Additional case data were merged from the Supreme Court Database (Spaeth et al. Reference Spaeth, Lee, Ruger, Whittington, Segal and Martin2014).
Using Oyez timestamps, we segmented the full-argument audio into a series of single-speaker utterances.Footnote 11 As an additional preprocessing step, we drop utterances spoken by lawyers (each of whom usually appears in only a handful of cases) and Clarence Thomas (who spoke only twice in our corpus), focusing on the behavior of the eight recurrent speakers. We also drop procedural statements, along with utterances shorter than 2.5 seconds.Footnote 12 After trimming and dropping cases in which the ideological direction is unclear, the resulting audio corpus contains 266 arguments and 95 hours of audio, comprising nearly 42,000 utterances and over 27 million frames.
The Quantity of Interest: Judicial Skepticism
In this section and the next, we introduce and employ a new measure of substantive importance to the study of courts: judicial skepticism, an individual’s vocal expression of their judgment about the argument at hand. Judicial skepticism is an important signal of disagreement with or incredulity about assertions and legal arguments, especially in the context of oral arguments.
To identify judicial skepticism in speech, we first randomly selected a training set of 200 utterances per justice to hand-classify as “skeptical” or “neutral” speech, allowing our assessments to reflect not only the vocal tone but also the textual content of the utterance. Thus, we define 16 modes of speech—two tones for each of the eight speaking justices.Footnote 13 During classification, we dropped the handful of utterances (roughly 5%) in which crosstalk or other audio anomalies occurred or in rare instances where the speaker’s identity was incorrectly recorded. The model is then estimated following Algorithm 1.
A Case Study of Judicial Skepticism
To illustrate the use of skepticism during the flow of oral arguments, we conducted a case study of Alabama Legislative Black Caucus v. Alabama, a racial gerrymandering case heard by the Supreme Court in 2014 that considered the legality of Alabama’s 2012 redistricting efforts. The study is described in depth in Online Appendix Section 3; we briefly summarize it here and demonstrate the application of MASS to this case in Figure 3.
An Illustrative Example
Note: Panel A contains excerpts from Alabama Legislative Black Caucus v. Alabama, where Justices Scalia, Kennedy, and Breyer utilize neutral and skeptical tones in questioning. Call-outs highlight successive utterance pairs in which the speaker shifted from one mode to another (B.3), and continued in the same tone of voice (B.1 and B.2). Panels C.1 and C.2 illustrate the use of loudness (text size) and pitch (contours) within utterances: in the neutral mode of speech (C.1), speech varies less in pitch and loudness when compared with skeptical speech (C.2). Based on these and other features, MASS learns to categorize sounds into vowels (dark squares), consonants (light), and pauses (white). Call-outs D.1 and D.2 respectively identify sequential moments in which a “neutral” vowel is sustained (transition from the dark blue sound back to itself, indicating repeat) and the dark red “skeptical” vowel transitions to the light red consonant. Panel E shows the differing auditory characteristics of the “skeptical” vowel and consonant, which are perceived by the listener.

As background, the case arose when the Republican-led legislature redrew electoral districts in the face of declining urban population. In doing so, the legislature sought to pack Black voters into a small number of already heavily Democratic districts. The liberal Alabama Legislative Black Caucus argued that this practice violated the Voting Rights Act (VRA), a position ultimately supported by the Court’s decision, whereas conservative defenders of the new map argued that Section 5 of the VRA in fact forced the legislature to draw Black-dominated districts.
Figure 3 depicts two exchanges in which justices spar over this legal claim about Section 5—that a state must hold or increase the numerical percentage of Black voters in a district to maintain minorities’ “ability to elect their preferred candidates.” In the first exchange, beginning with Justice Scalia’s question, “Well, I thought the Section 5 obligation …,” Justice Scalia advocates the conservative view when questioning the liberal advocate. Median Justice Kennedy, perhaps influenced by this line of questioning, pursues it further and transitions into skepticism on the technical point of whether the liberal reading of the VRA constitutes an indefensible “one-way ratchet” on minority percentages. Justice Breyer then comes to the defense of the liberal side, asking the friendly rhetorical question—ostensibly to the advocate—of whether Justice Kennedy’s question was addressed by precedent. Later in the oral argument, these roles reverse. The figure depicts a subsequent exchange in which Justice Kennedy initiates a line of questioning, Justice Breyer attacks by skeptically saying to the conservative advocate, “I don’t know what the defense is possibly going to be,” and Justice Scalia comes to the rescue with a “softball” question.
These exchanges illustrate the sort of political interactions modeled by MASS. Panel 3.A depicts how skeptical and neutral speech are deployed throughout the discussion, and Panels 3.B.1–3 each highlight a justice’s choice of tone (e.g., the decision to switch from neutrality to skepticism, which we model using covariates such as conversational history or the ideology of the side currently being questioned). Panels 3.C.1–2 examine two utterances in depth, showing a subset of the auditory features that MASS relies on to infer speech tone. Each tone is modeled as a sequence of discrete sounds, like “vowel” or “silence”; their usage is shown in Panels 3.D.1–2, and their auditory content is in Panel 3.E.
Validating the Model
We conduct extensive validation of our model-based measure of judicial skepticism, confirming that MASS does in fact successfully estimate the quantity of interest. Due to space constraints, we summarize these efforts here; results are described in detail in Online Appendix Section 4.
First, we demonstrate that MASS recovers a measure that has high face validity. Online Appendix 4.1 presents randomly sampled utterances from the highest and lowest deciles of model-predicted skepticism. Those characterized by the model as skeptical include gentle mockery and doubtful questions, whereas model-predicted neutral utterances are factual statements and straightforward legal analysis.
Second, we examine content validity in Online Appendices 4.2–4.3. Our model detects skepticism based on linguistically and physiologically meaningful auditory features. In a model of Justice Kennedy’s expressed skepticism, compared with neutral questioning, we find that his speech is louder, contains more pitch variation, and is characterized by higher vocal tension. We caution that MASS does not take textual signals of skepticism into account, an important limitation on content validity. (Joint models of audio and text remain an important direction for future work.) However, we demonstrate that in the case of judicial speech, there are extremely few textual signals that distinguish skepticism from typical questioning.
Third, in Online Appendix 4.4, we estimate a lower bound on the out-of-sample performance of MASS, using cross-validation results from the lower stage of the model, corresponding to Equations 3–4 and excluding Equations 1–2. We find that out-of-sample accuracy of the lower-level auditory classifier is 68%, versus the 52% that would be obtained by randomly permuting labels; numerous additional performance metrics are reported in the appendix.Footnote 14
Fourth, we compare the performance of MASS with (1) human coders and (2) text-based classifiers. For the human comparison, we recruited native English speakers on a crowdworking site and evaluated their ability to recover ground-truth labels in legal argumentation. We found that when combining responses by majority vote, nonexpert listeners were able to detect 70% of judicial skepticism, outperforming MASS by a small margin. The performance of individual coders was lower, at 65%, suggesting that with a relatively small amount of domain-specific data, our model performs approximately as well as humans with a lifetime of experience in parsing non-domain-specific speech. For the textual comparison, we applied an elastic net to utterance word counts. The resulting trained text models were entirely degenerate, predicting the more common label in virtually every case.
Finally, we probe the predictive validity of our measure with a comparison to Black et al. (Reference Black, Treul, Johnson and Goldman2011), described in the next section.
Comparison with an Existing Measure
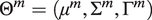
We conduct yet another validity test by contrasting our model with the approach of Black et al. (Reference Black, Treul, Johnson and Goldman2011), who use a measure based on directed pleasant and unpleasant words—operationalized with the Dictionary of Affect in Language (DAL; Whissell Reference Whissell2009)—to predict justice voting. We replicate and contrast results with those from a comparable measure of directed skepticism.Footnote 15 Specifics are discussed in Online Appendix 4.5. We find that a one-standard-deviation increase in directed unpleasant (pleasant) words is associated with a 2.8-percentage-point decrease (no difference) in the probability that a justice votes against a side. In comparison, a one-standard-deviation increase in directed skepticism, as estimated from auditory characteristics, is associated with a 7.9-percentage-point decrease in vote probability—nearly three times as large. Moreover, Figure 4 shows that unlike text-based results, these patterns are robust to the inclusion of both justice and case fixed effects.
Predicting Justice Votes with Directed Skepticism and Directed Affective Language
Note: Horizontal error bars represent point estimates and 95% confidence intervals from regressions of justice votes on directed pleasant words, directed unpleasant words, and our audio-based directed skepticism. Red circles correspond to a specification with no additional controls; blue triangles report results with speaker fixed effects only, black squares with speaker and case fixed effects.

Why is speech tone so much more predictive of voting patterns than the use of affective words? One reason may be that DAL uses a cross-domain measure of word pleasantness, ignoring the fact that words often take on different meanings in legal contexts. For example, the the 10 most common “unpleasant” words in our corpus include “argument” and “trial,” whereas the five most common “pleasant” words include “read” and “justice.” However, as we show in other text-audio comparisons, a more likely explanation is that word choice is a noisy, high-dimensional, and difficult-to-measure signal of expressed emotion, whereas auditory tone is relatively structured and consistent.
However, we note that MASS exploits only the auditory channel of speech. While we show in Online Appendix 4.4 that this provides a clearer signal of skepticism than text in general, there are nonetheless cases when expressions of disbelief are spoken flatly. In one example, Justice Ginsburg states matter-of-factly, “Well, that would be fine if the statute said what you claim it said.” The utterance is clearly skeptical, yet our model predicts that it is 89% likely to be neutral speech due to its deadpan delivery. This counterexample highlights limitations in the use of any communication channel in isolation, suggesting that joint models of text and tone are a necessary direction for future work.
Next, we demonstrate the model with an application to speech in Supreme Court oral arguments, then conclude.
Testing Theories of Supreme Court Deliberation
While some scholars believe that oral arguments are inconsequential in Supreme Court decision-making (Rohde and Spaeth Reference Rohde and Spaeth1976; Segal and Spaeth Reference Segal and Spaeth1993), others argue that they play a crucial role in shaping the Court’s ultimate position on a case (Black, Sorenson, and Johnson Reference Black, Sorenson and Johnson2013; Epstein, Landes, and Posner Reference Epstein, Landes and Posner2010; Johnson Reference Johnson2001; Johnson, Wahlbeck, and Spriggs Reference Johnson, Wahlbeck and Spriggs2006; McGuire Reference McGuire1995; Shapiro Reference Shapiro1984; Wasby, D’Amato, and Metrailer Reference Wasby, D’Amato and Metrailer1976). The justices themselves, however, are virtually unanimous on this point. Justice Powell stated, “The fact is, as every judge knows … the oral argument … does contribute significantly to the development of precedents” (Stern, Gressman, and Shapiro Reference Stern, Gressman and Shapiro1993, 571). Johnson and Goldman (Reference Johnson, Goldman, Johnson and Goldman2009) document numerous other direct quotes about the importance of oral arguments, including Justices Harlan, Hughes, Jackson, Brennan, White, Rehnquist, and others.
But there is little empirical evidence about how arguments matter. Courts scholars have advanced various accounts of the deliberative process, which can be roughly grouped into two broad theories. For concreteness, we discuss these theories and their associated mechanisms in the context of Rapanos v. United States, a narrowly decided environmental case about the Army Corps of Engineers’ right to regulate pollution in wetlands, drawing extensively on legal analysis by Savage (Reference Savage, Johnson and Goldman2009).Footnote 16
The first theory holds that justices are shrewd political actors who maneuver to influence the decisions of their peers in pursuit of a desired case outcome (Epstein, Landes, and Posner Reference Epstein, Landes and Posner2010, Reference Epstein, Landes and Posner2013; Iaryczower and Shum Reference Iaryczower and Shum2012; Iaryczower, Shi, and Shum Reference Iaryczower, Shi and Shum2018; Shullman Reference Shullman2004). In this account, oral arguments represent an opportunity for justices to strategically signal to their colleagues, with lawyers and their legal arguments serving merely as convenient foils. Justice Breyer (Reference Breyer1998, 56) says as much, noting, “We’re always trying to persuade each other. But persuading each other is complicated … [one way] is to identify what you think of as the difficult problem in a case, and then pose a question that will reveal the difficulty in some way.” Justice Sotomayor (Reference Sotomayor2019) concurs, saying “sometimes we’re talking to each other, and we’re raising points through the questions that we want our colleagues to consider with us.” These attempts at persuasion appear to be on display in Rapanos v. United States. From the very start of arguments, battle lines were drawn over the precise definition of a “watershed,” which determined the Corps’ jurisdiction. Justice Roberts, a well-known opponent of what he views as the agency’s regulatory overreach, sought to undermine its position: “To me it … it suggests that even the Corps recognized that at some point you’ve got to say stop, because logically any drop of water anywhere is going to have some sort of connection through drainage.”
Conversely, the liberal wing of the court attacked the Pacific Legal Foundation’s (PLF, a conservative property-rights advocacy group) position that the federal government should not have jurisdiction over local pollution unless it can prove that a polluter’s waste reached a navigable waterway. Justice Souter—whose support for greater environmental protection was previously made clear in SWANCC v. United States—ridicules this position, asking, “You mean… in every case, then … a scientist would have to analyze the molecules and … trace it to a specific discharge?”
On its face, it seems plausible that these justices sought to sway Justice Kennedy on this pivotal issue. The point was of critical importance to Justice Kennedy, more so than any other justice.Footnote 17
But were those questions intentionally deployed to shape the subsequent flow of conversation—and ultimately, voting? Or would Justices Roberts and Souter have taken the same stance even if the outcome of the case were not in question? A second, largely incompatible conception of the decision-making process considers justices as neutral arbiters, each casting a sincere vote according to rules determined by their respective legal philosophies (Black et al. Reference Black, Treul, Johnson and Goldman2011; Black, Schutte, and Johnson Reference Black, Schutte and Johnson2013; Johnson Reference Johnson2001). In this latter account, oral arguments primarily operate as opportunities for fact-finding, rather than persuasion. Justice Douglas summarized this position best, stating, “The purpose of a hearing is that the Court may learn what it does not know” (Galloway Reference Galloway1989). Justice Thomas (Reference Thomas2013) famously goes a step further, saying, “I think it’s unnecessary to deciding cases to ask that many questions, and I don’t think it’s helpful.” And while justices may reveal their predispositions with a display of doubt, this theory suggests that it is merely an honest response to compelling or uncompelling legal reasoning, rather than an effort to manipulate. For example, Justice Scalia was unable to contain his skepticism after Justice Souter’s attack, exclaiming, “Well, I … couldn’t you simply assume that anything that is discharged into a tributary, ultimately, goes where the tributary goes? … You really think it has to trace the molecules?” His outburst, which undermined the position of the PLF (his preferred side), suggested a genuine response to a difficult-to-believe position rather than an attempt at persuasion.
These competing accounts are challenging to disentangle even under the best of circumstances. This difficulty has been compounded by widespread reliance on a narrowly limited representation of judicial speech: textual transcripts alone. Here, we demonstrate that the discarded audio channel contains information of enormous value to social scientists—and that by modeling the tone it conveys, MASS not only opens the door to new research questions but can also shed new light on existing puzzles. Specifically, we use MASS to analyze the structural determinants of expressed skepticism in oral arguments. Using justices’ ideological leanings, their ultimate vote, and a measure of case contentiousness, we test the observable implications of two commonly espoused but conflicting narratives of the Supreme Court decision-making process: that justices are highly strategic actors jockeying for influence, on one hand (Black, Schutte, and Johnson Reference Black, Schutte and Johnson2013), or alternatively that they are neutral arbiters who respond genuinely to compelling legal arguments (Johnson, Wahlbeck, and Spriggs Reference Johnson, Wahlbeck and Spriggs2006).
Differing theoretical accounts of deliberation suggest very different patterns in the usage of this tone. A model of genuine voting implies that when justices communicate their skepticism (to the extent that they make it known at all), it is largely as a natural reaction to poor argumentation. In other words, we should observe generically higher rates of skepticism when justices question lawyers for the side that they find less persuasive. This leads to an observable implication of the genuine-voting theoretical account: when a justice votes against a side, we should observe that this behavior is associated with increased skeptical questioning of the corresponding lawyers (Black et al. Reference Black, Treul, Johnson and Goldman2011; Black, Sorenson, and Johnson Reference Black, Sorenson and Johnson2013).
A strategic-signaling model of deliberation, on the other hand, must account for the fact that many—indeed, nearly half—of all cases are decided unanimously. When all justices agree, no strategy is necessary. There is little to gain from posturing, including acted skepticism. To the extent that experienced justices are able to identify uncontroversial cases from preargument legal briefs and lower court decisions, this suggests a key observable implication of the strategic-signaling account: justices should exhibit greater skepticism toward their non-preferred side, especially in contentious cases. That is, in cases that are ultimately decided by a 5–4 margin, we should see justices use markedly more skepticism toward the side they vote against. Forward-looking justices should similarly reduce skepticism toward their own side to avoid damaging its chances in close calls.Footnote 18 To further adjudicate between these competing explanations, we turn to a dynamic test of oral arguments, in which the implications of each theory are even cleaner.
In general, justices who are ideologically close will exhibit greater similarity in preferences and judicial perspectives relative to those who are far apart. When justice
 $ i $
finds a line of legal reasoning to be objectionable (as manifested in an expression of skepticism), it is likely that their ideological neighbor
$ i $
finds a line of legal reasoning to be objectionable (as manifested in an expression of skepticism), it is likely that their ideological neighbor
 $ j $
will find it objectionable as well. The two narratives then diverge in their predictions for
$ j $
will find it objectionable as well. The two narratives then diverge in their predictions for
 $ j $
’s response. A genuine reaction would be to acknowledge the flaw in reasoning, perhaps following up with further skeptical probing regardless of
$ j $
’s response. A genuine reaction would be to acknowledge the flaw in reasoning, perhaps following up with further skeptical probing regardless of
 $ j $
’s affinity for the lawyer under attack. In contrast, if
$ j $
’s affinity for the lawyer under attack. In contrast, if
 $ i $
is ideologically distant from
$ i $
is ideologically distant from
 $ j $
, then
$ j $
, then
 $ i $
’s skepticism should not provoke much of a response from
$ i $
’s skepticism should not provoke much of a response from
 $ j $
due to the relative lack of shared views on hot-button issues. The strategic account, on the other hand, implies a very different flow of questioning. Suppose that
$ j $
due to the relative lack of shared views on hot-button issues. The strategic account, on the other hand, implies a very different flow of questioning. Suppose that
 $ j $
opposes the current lawyer. If
$ j $
opposes the current lawyer. If
 $ j $
were a savvy justice, they should be on the lookout for weaknesses in the opposing side’s arguments, seizing the chance to dogpile when an opportunity presents itself. Ideological distance from
$ j $
were a savvy justice, they should be on the lookout for weaknesses in the opposing side’s arguments, seizing the chance to dogpile when an opportunity presents itself. Ideological distance from
 $ i $
—the preceding critic—should not restrain the shrewd operator much, if at all. (Indeed, a left-right combination may be a particularly effective blow against the current lawyer.)
$ i $
—the preceding critic—should not restrain the shrewd operator much, if at all. (Indeed, a left-right combination may be a particularly effective blow against the current lawyer.)
The strategic narrative suggests a very different sequence of events when
 $ j $
’s preferred side comes under attack, however. When ideological neighbor
$ j $
’s preferred side comes under attack, however. When ideological neighbor
 $ i $
expresses skepticism,
$ i $
expresses skepticism,
 $ j $
has an incentive to smooth things over—despite
$ j $
has an incentive to smooth things over—despite
 $ j $
’s ideological inclination to agree with
$ j $
’s ideological inclination to agree with
 $ i $
’s points. Thus, the extent to which ideological proximity colors
$ i $
’s points. Thus, the extent to which ideological proximity colors
 $ j $
’s response to prior skepticism is a useful point of differentiation. Specifically, we discretize ideology into “left” (Justices Breyer, Ginsburg, Kagan, and Sotomayor) and “right” (Justices Alito, Roberts, and Scalia), setting Kennedy aside, given his unique position at the median. We then test whether a justice agrees with their usual allies—that is, expresses skepticism together—even when that skepticism is directed against their preferred side. If so, this suggests a genuine response; if not, it suggests that justices may be strategically pulling their punches to protect case-specific interests.
$ j $
’s response to prior skepticism is a useful point of differentiation. Specifically, we discretize ideology into “left” (Justices Breyer, Ginsburg, Kagan, and Sotomayor) and “right” (Justices Alito, Roberts, and Scalia), setting Kennedy aside, given his unique position at the median. We then test whether a justice agrees with their usual allies—that is, expresses skepticism together—even when that skepticism is directed against their preferred side. If so, this suggests a genuine response; if not, it suggests that justices may be strategically pulling their punches to protect case-specific interests.
The observable implications described above utilize post-argument proxies for justice preferences (vote) and case divisiveness (margin of victory). A natural concern is that a justice’s ultimate vote may be influenced by the course of questioning as well. In this case, persuasion may offer an alternative explanation for patterns in observed skepticism. If strategic justices are always successful in persuading their colleagues, the genuine-voting and strategic-signaling accounts become observationally similar in many cases. While we find this level of persuasiveness to be implausible in light of extensive qualitative work on the courts (Ringsmuth, Bryan, and Johnson Reference Ringsmuth, Bryan and Johnson2013; Wolfson Reference Wolfson2001), there is considerable room for future work to improve on our analysis. These improvements may include more rigorous formal modeling of strategic interaction in the deliberative process, collection of better pre-argument proxies for justice predisposition and case controversiality (e.g., circuit court votes; see also Online Appendix Section 4.6, which suggests that ideologically directed skepticism may reveal intensity of preferences by issue area), or analysis of natural experiments (e.g., exploiting justice retirements).
Finally, note that in interpreting model parameters and testing theories, we formulate all hypotheses in the following manner: Conditional on justice
 $ i $
speaking, is it more likely that they do so skeptically in one conversational context, as opposed to another?Footnote
19
The competing narratives described above suggest several observable implications for the structural determinants of justice tone—for example, how the side currently being questioned or the tone of the previous questioner translates into expressed skepticism.
$ i $
speaking, is it more likely that they do so skeptically in one conversational context, as opposed to another?Footnote
19
The competing narratives described above suggest several observable implications for the structural determinants of justice tone—for example, how the side currently being questioned or the tone of the previous questioner translates into expressed skepticism.
Figure 5 presents results from two MASS specifications. First, we model transition probabilities (i.e., the probability that the next utterance is of justice-tone
 $ m $
) as
$ m $
) as
 $ \exp \left({\boldsymbol{W}}_u^T{\zeta}_m\right)/{\sum}_{m^{\prime }=1}^M\exp \left({\boldsymbol{W}}_u^T{\zeta}_{m^{\prime }}\right) $
, where the conversational context
$ \exp \left({\boldsymbol{W}}_u^T{\zeta}_m\right)/{\sum}_{m^{\prime }=1}^M\exp \left({\boldsymbol{W}}_u^T{\zeta}_{m^{\prime }}\right) $
, where the conversational context
 $ \boldsymbol{W} $
includes the eventual case margin, the ultimate vote of the justice in question, an interaction, and a justice-tone intercept. We then average across justices according to their speech frequency to obtain an average effect. The results show that justices use skepticism against their nonpreferred side—either the petitioner or respondent, depending on whom they go on to vote against—at a significantly higher rate, as expected.
$ \boldsymbol{W} $
includes the eventual case margin, the ultimate vote of the justice in question, an interaction, and a justice-tone intercept. We then average across justices according to their speech frequency to obtain an average effect. The results show that justices use skepticism against their nonpreferred side—either the petitioner or respondent, depending on whom they go on to vote against—at a significantly higher rate, as expected.
Simulated Quantities of Interest
Note: Each panel manipulates a single variable from a control value (second element of panel title) to a treatment value (first). Points (error bars) represent changes (95% bootstrap confidence intervals) in predicted skepticism. We average over all other nuisance covariates (e.g., the identity of the next speaker) of the scenario-specific change in outcome, weighting by the empirical frequencies of these covariates. The top panel shows that justices deploy skepticism more often toward their nonpreferred side. The second panel compares close votes with unanimous decisions, demonstrating that justices express more skepticism across the board in the former. However, justices do not attempt to target a particular side in close votes; rather, they simply ask more skeptical questions across the board. Finally, the bottom panel shows that justices mirror the tones of their ideological neighbors, who share similar legal philosophies, even when those neighbors are opposed to the justice’s case-specific voting interests.

Contrary to theoretical predictions under strategic signaling, however, we find no indication that the gap between petitioner- and respondent-targeted skepticism depends on the margin of the case decision. That is, the difference in differences is far from significant. We do find that skepticism is generically higher across the board in close cases. These results are consistent with the account that Supreme Court justices are engaged in genuine fact finding, not a strategic attempt to manipulate their colleagues, and that they particularly seek to get answers right when the stakes are high.Footnote 20
To probe further, we now turn to the dynamics of argumentation. In an expanded specification, we now incorporate additional binary indicators for whether the preceding speaker belonged to the liberal or conservative wing of the Court, as well as interactions between skepticism in the preceding utterance, ideology of the previous speaker, and vote. As described above, the strategic model of judicial signaling implies that after a peer—any peer—criticizes a justice’s preferred side, the justice should withhold comment or defuse tensions with neutral commentary. By the same token, the savvy justice should follow up with a coup de grâce after a colleague finds fault in the disfavored side’s reasoning. We find no evidence that this is true. Rather, our results are highly consistent with a model of genuine expression in which justices concede to the criticisms of ideologically proximate peers, regardless of their case-specific interests. That is, after a liberal (conservative) justice casts doubt on a lawyer’s argument, other liberals (conservatives) on the Court are likely to follow suit even if that criticism undermines their favored side.
Concluding Remarks
In the last decade, computational social science made tremendous advances in the automated analysis of what speakers say. However, analysis of how those words were spoken has largely eluded principled inquiry. MASS addresses this limitation by providing a framework for statistical analysis of the nontextual components of speech. And by directly modeling patterns in communication, MASS allows analysts to address a host of elusive questions about its structure and temporal dynamics.
Our analysis demonstrates the importance of these patterns—speech flow—not only in audio data but also in the analysis of speech more broadly. While structural models of text that incorporate metadata are now in widespread use (Roberts et al. Reference Roberts, Stewart, Tingley, Lucas, Leder-Luis, Gadarian, Albertson and Rand2014), temporal dynamics have received far less attention. Yet speech—and especially conversation—is obviously temporally dependent. We consider MASS not as the final word on speech analysis but rather as a step toward statistical models that more fully capture the complex data-generating process that gives rise to all elements of human speech.
This effort to respect the data-generating process underlies many of the design decisions in our model. For example, in representing speech with many time-varying features, MASS makes an enormous improvement over existing approaches that collapse communication down to simplistic summary statistics, such as average pitch. However, this extension is not without trade-offs, particularly in computational complexity and the need for human expertise. The distinction may be analogous to that between sophisticated context- and semantics-aware text classifiers and straightforward dictionary-based methods that count word occurrences. The advantages of each are worth explicit consideration in future research.
Supplementary Materials
To view supplementary material for this article, please visit http://dx.doi.org/10.1017/S000305542000101X.
Replication materials can be found on Dataverse at: https://doi.org/10.7910/DVN/8BTOHQ.
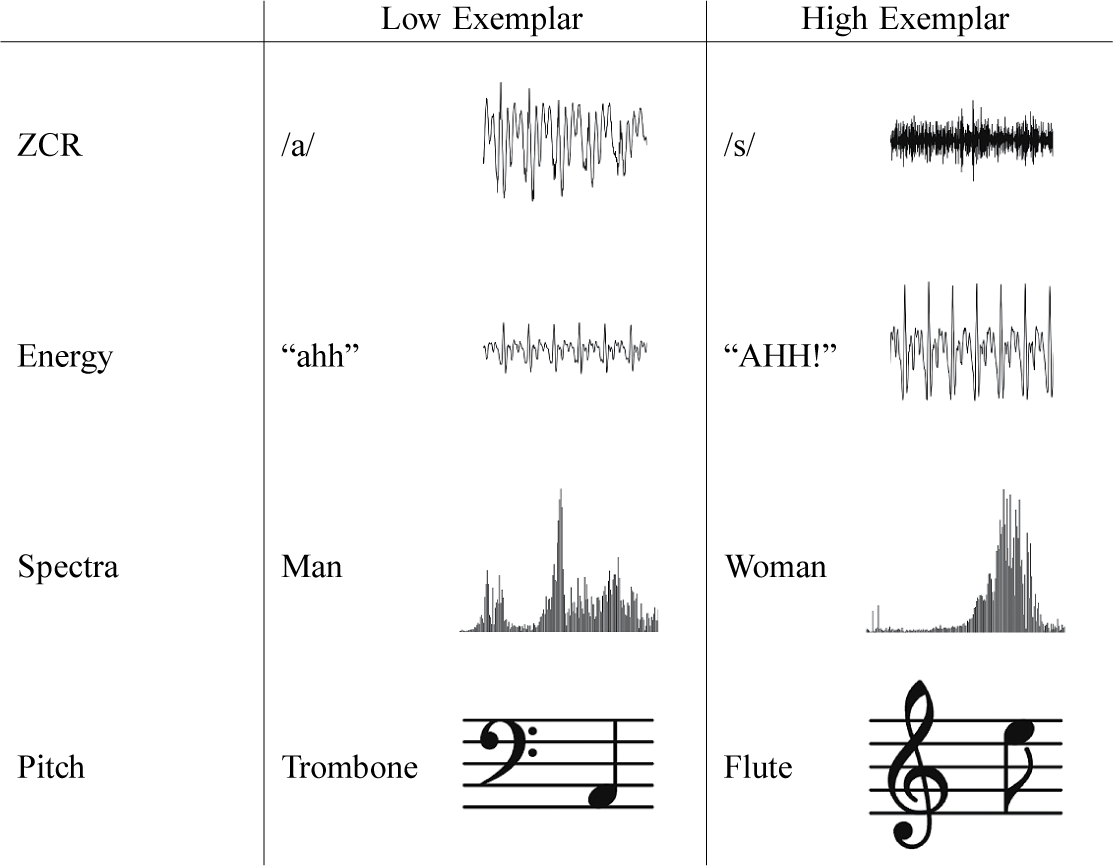
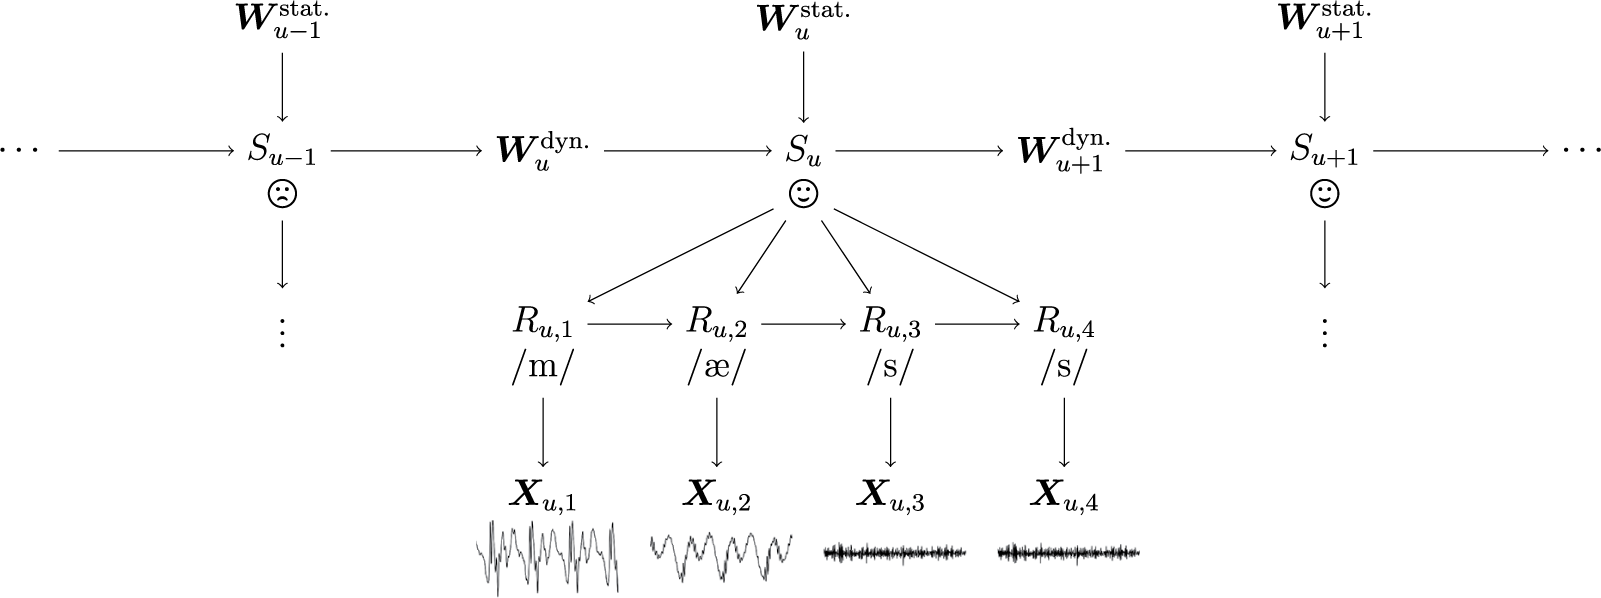


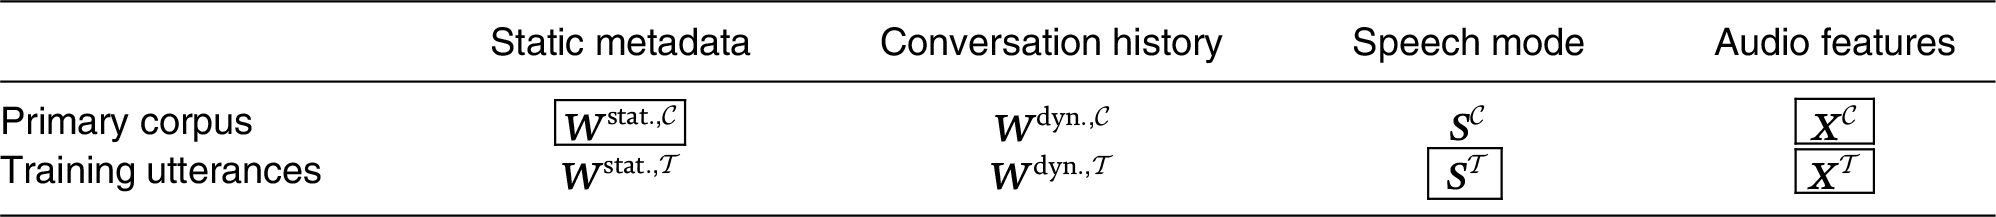

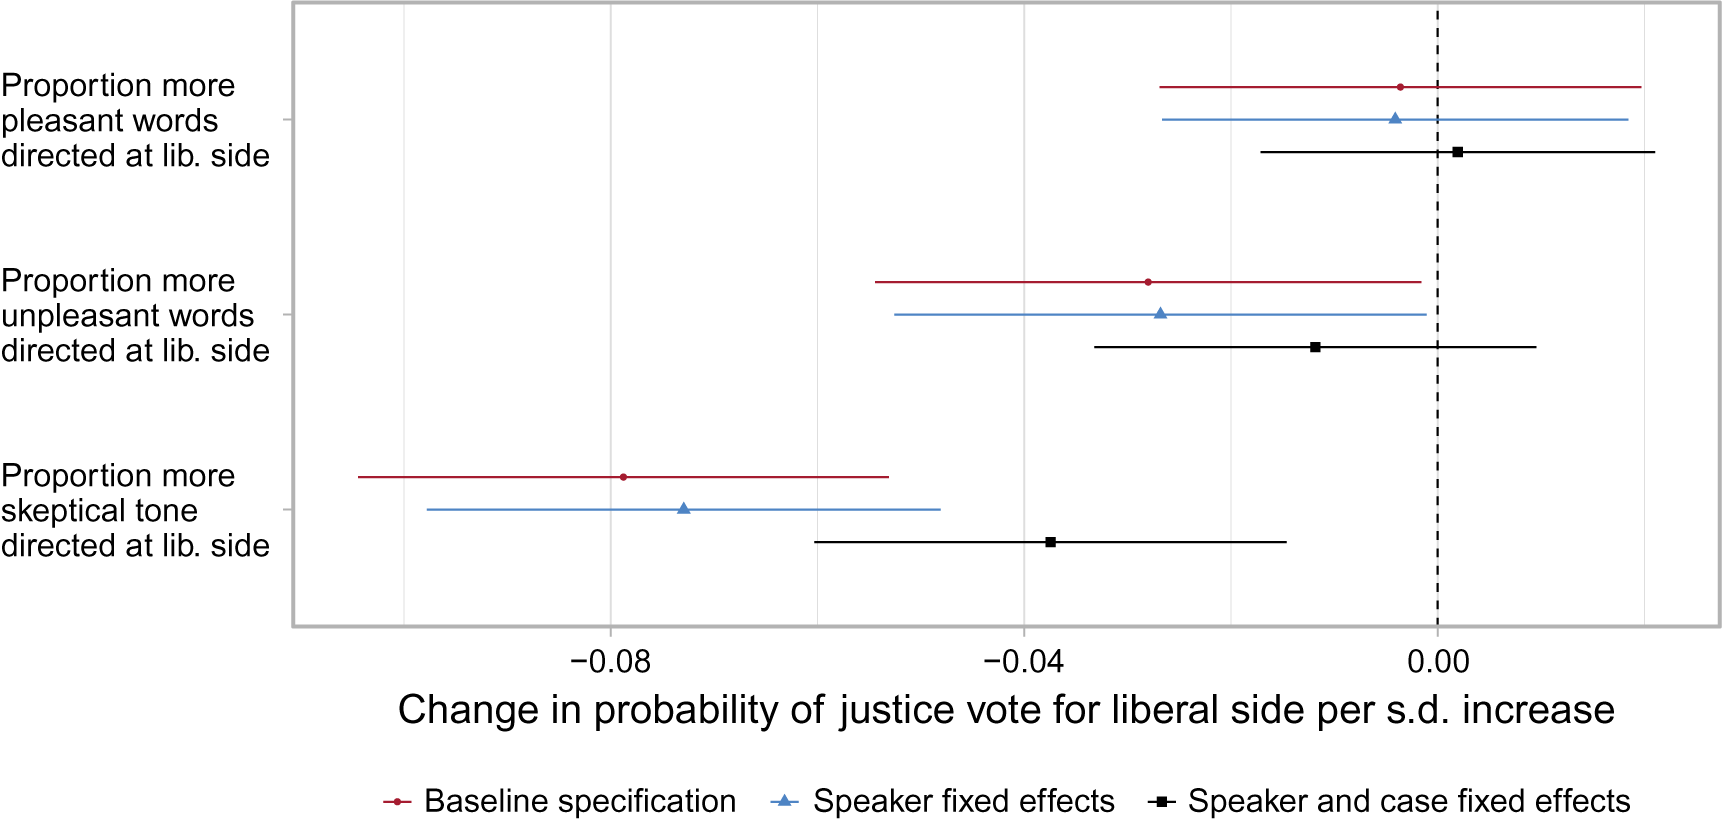
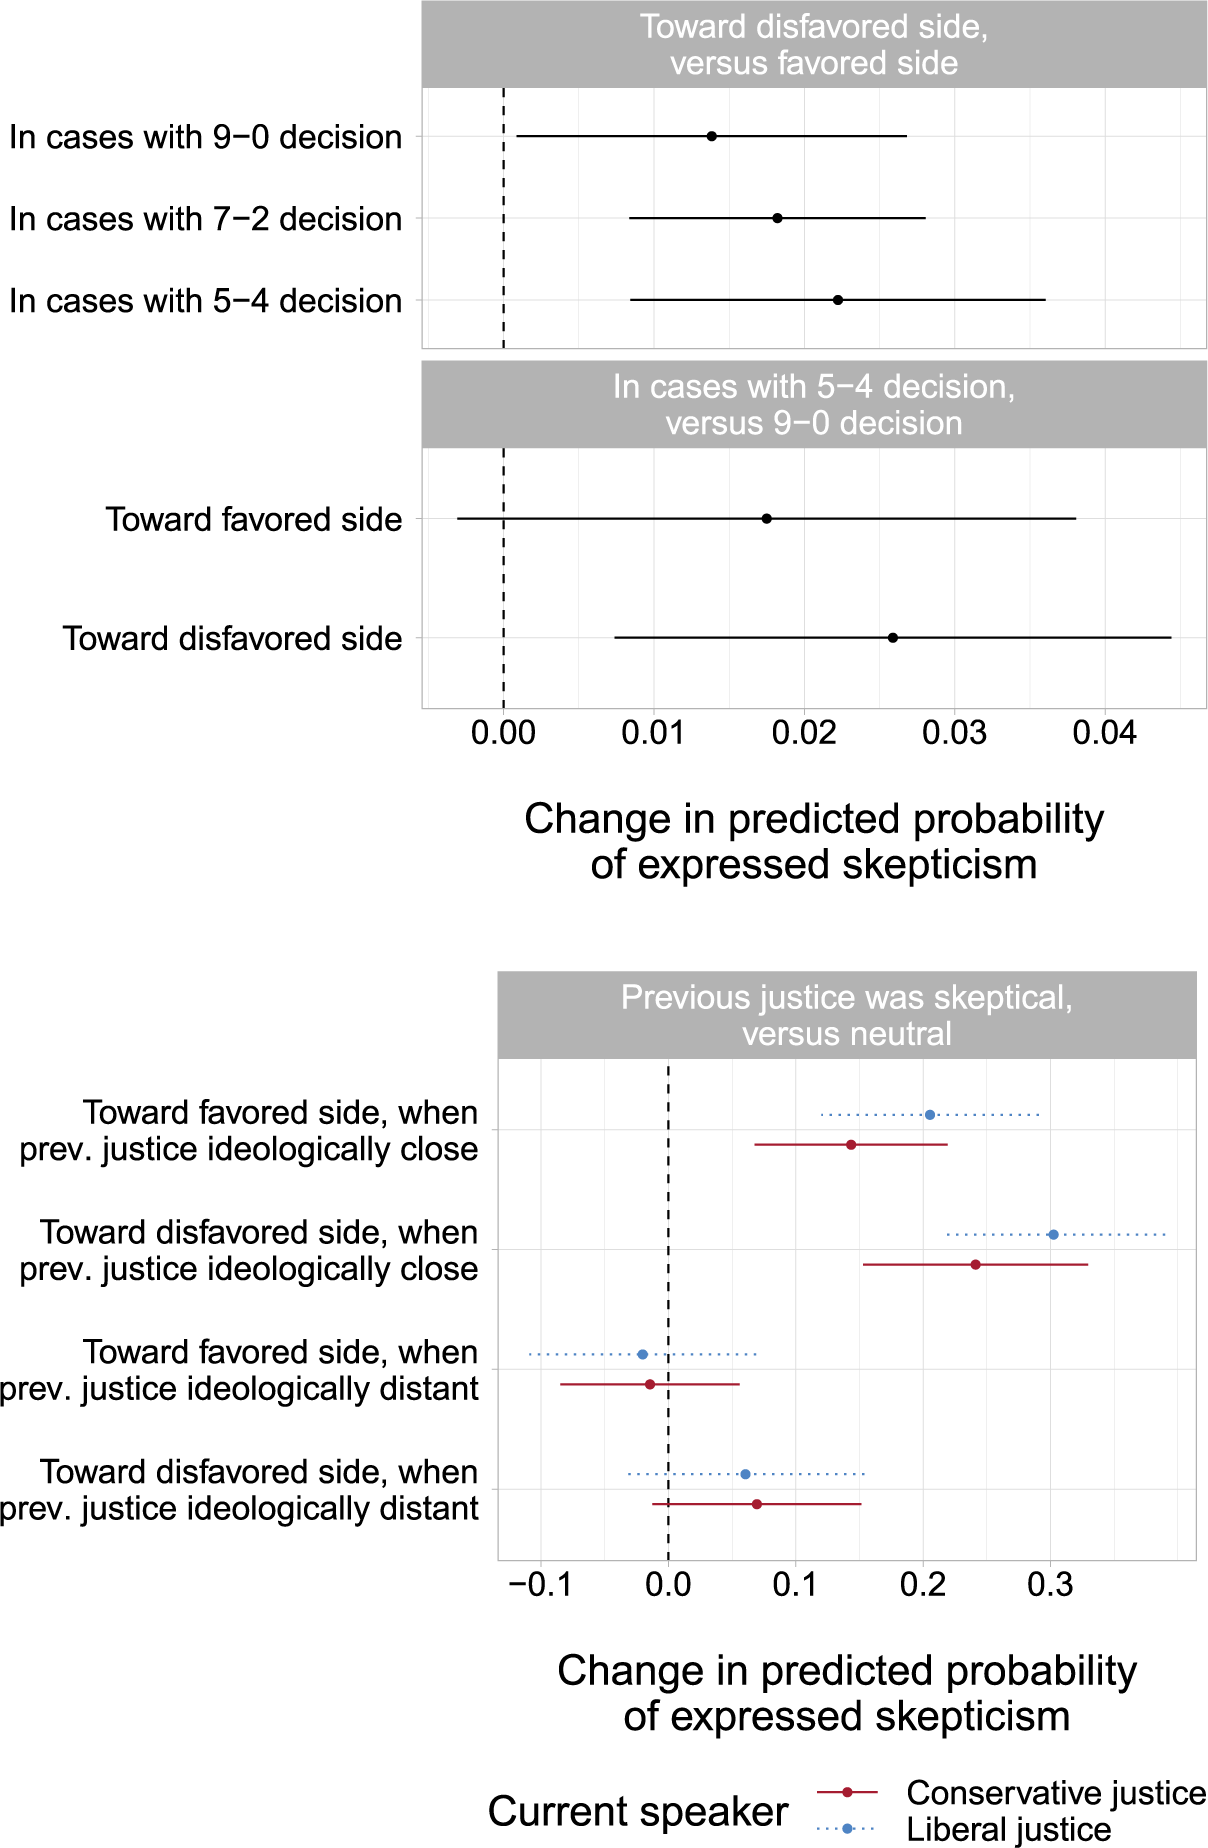


 Open access
Comments
No Comments have been published for this article.