


Introduction
Bureaucratic corruption remains a key government failure in developing countries. Its high prevalence is a consequence of weak institutions that distort public and private resource allocation (Fisman and Golden, Reference Fisman and Golden2017; Svensson, Reference Svensson2005; Tanzi, Reference Tanzi1998). From a citizen’s perspective, however, bureaucratic corruption is often seen as a second-best strategy to “grease the wheels” of the bureaucracy and overcome constraints on the provision of government services. While bureaucratic intermediation services are not inherently corrupt (Graf Lambsdorff, Reference Graf Lambsdorff2013), intermediaries seem to play a relevant part in magnifying bureaucratic corruption in the developing world (Wiehen, Reference Wiehen1999; Bertrand et al., Reference Bertrand, Djankov, Hanna and Mullainathan2007). Beyond their potential role as “market makers” that match citizens to bureaucrats, intermediaries can also reduce the “moral costs” of ultimately corrupt acts by allowing citizens to remain detached from – and potentially unaware of – bribes (Hasker and Okten, Reference Hasker and Okten2008; Hamman et al., Reference Hamman, Loewenstein and Weber2010; Bartling and Fischbacher, Reference Bartling and Fischbacher2012; Coffman, Reference Coffman2011). These two theories yield opposing predictions whenever intermediaries are transparent about their illicit connections to the bureaucracy: While their role as “market makers” requires these connections, transparency over their existence should increase perceived risks and “moral costs”.
This article investigates the effect of priming the existence of corrupt connections to the bureaucracy on the demand for intermediary services and on its price elasticity. Moreover, we assess whether the effects of corruption suggestions are contingent on trusted references to the intermediary and whether such references attenuate price elasticities. We focus on the case of “gestores” (intermediaries) for the apostille of professional degrees in Venezuela. This setting is appropriate to tackle this question, due to the high demand from young professionals choosing to migrate out of the country and low state capacity for the timely certification of degrees by Venezuela’s Foreign Ministry. We propose an experimental survey on Venezuelan undergraduate students. In a hypothetical scenario in which the students need to have their degrees certified in a narrow window of time, and they consider hiring a gestor, we randomly reveal the presence of an illicit bureaucratic connection, the intermediary service fee and whether the gestor was referred by a trusted individual.Footnote 1
Anecdotal evidence from Venezuela suggests that intermediaries often reveal that their work operates through an illicit connection to the bureaucracy in an attempt to market the “quality” of their services to potential clients. We believe gestores follow this “market maker” logic because it dominates “moral” considerations in the Venezuelan institutional environment. For this reason, we preregistered three hypotheses consistent with the “market maker” perspective. First, we hypothesized that gestores that reveal their illicit connections to the bureaucracy should observe a higher demand for their services. Second, we conjectured that the demand for intermediary services should be relatively price inelastic when gestores reveal an illicit connection to the bureaucracy, as we believe such connections represent a marker for the “quality” of the service. Finally, we posited that the effect of revealing an illicit connection to the bureaucracy on intermediary demand should be strongest (or contingent on) when the gestor is referred to the client by a trusted individual, as such references may resolve the credibility concerns raised by unknown intermediaries offering an inherently illicit service. Our results regarding these three preregistered hypotheses are inconclusive.Footnote 2 However, in a non-preregistered analysis, we find that trusted references to the gestor erode the price elasticity of the demand for their services. This important result is consistent with the view that trust plays a crucial role in the demand for opaque and illegal services.Footnote 3
Our study contributes to the experimental literature on corruption by assessing critical determinants in the demand for intermediary services in the developing world.Footnote 4 Given the ubiquity of intermediaries in the developing world and their apparent role in the mechanics of petty corruption (Bertrand et al., Reference Bertrand, Djankov, Hanna and Mullainathan2007), the empirical literature on the topic is scant. Setting an important precedent, Drugov et al. (Reference Drugov, Hamman and Serra2014) found that intermediaries induce higher levels of corruption by “normalizing” or “institutionalizing” corruption.Footnote 5 We contribute to this literature by studying the determinants of the demand for intermediary services in institutionally underdeveloped environments. We compare the take-up of gestor services for groups receiving different information about the service. In particular, we evaluate whether the demand for gestores is affected by suggestions of corruption and by the presence of a trusted reference and find that the latter is an important determinant of the demand for intermediaries and its price elasticity. Focusing on college students in the Venezuelan context is essential, as this segment of the population has a high demand for migration-related documents and certifications from a government with limited capacities to process that demand. Moreover, while our experiment is hypothetical, gestores do play a key role in participants’ actual institutional environment. This makes our results prescient for settings in which intermediaries are seen as ubiquitous and necessary to gain access to services from the bureaucracy.
Context
Venezuela currently stands as the country with the fourth highest perception of corruption worldwide (Transparency International, 2022). We focus on the study of petty corruption in bureaucratic services on the case of intermediaries or gestores in the apostille process for professional degrees. Given infrastructure and resource limitations, Venezuelans face multiple obstacles that prevent them from gaining access to government services, including those that are part of their fundamental rights as citizens. According to Bolivar and Rodríguez (Reference Bolivar and Rodríguez2021):
The exercise of many rights depends on obtaining certain documents, such as the identity card or birth certificate for identification; the passport for free international transit; […] among others. The restrictions on the enjoyment of rights begin for many Venezuelans in their own country, to the extent that the State does not produce the documents that it is obliged to issue or does so extremely slowly, which generates access barriers that only seem to be surmountable through acts of corruption. (p. 4)
Due to the economic, political, and humanitarian crises that intensified in the country between 2016 and 2017, many Venezuelans have chosen to emigrate in search of better opportunities (Transparencia Venezuela, 2021). For citizens whose emigration is oriented toward achieving their academic or professional career, the apostille of documents is an essential requirement. According to Bolivar and Rodríguez (Reference Bolivar and Rodríguez2021):
For most documents to be valid outside the country, their veracity must be certified by means of an apostille. In Venezuela, this procedure is carried out through the Ministry of Foreign Affairs. As in the case of identification documents, the apostille process lost transparency […] during the last decade, due to excessive delays that led to the use of agents and acts of corruption. Consequently, the apostille became a difficult procedure to carry out. (p. 9)
Regardless of the efforts made to automate the apostille process in Venezuela to avoid corruption and the use of gestores, obstacles to carrying out the procedures continue to be a significant constraint for citizens, creating a market for intermediaries.Footnote 6 In addition, access to virtual platforms remains limited and unstable, as Venezuela has the worst quality of internet services in the region.Footnote 7
While gestores’ services are legal in principle – as long as they limit their actions to carrying out the process of requesting appointments or withdrawing client documents – the use of contacts within the bureaucracy to “speed up” a process implies corrupt and illegal behavior.Footnote 8 Given the secretive nature of such corrupt behavior, the links between private clients and gestores are often established through direct recommendations from an individual’s social circle. Therefore, the market for intermediation in Venezuela usually spreads through direct references, helping gestores and their associated bureaucrats keep a low profile.
Research design
Survey characteristics
We performed an experimental survey around a hypothetical situation between a client and an intermediary. The survey was distributed through Qualtrics to students at Universidad Católica Andrés Bello (UCAB) in Caracas, Venezuela. Importantly, faculty authorities were contacted to request their support in disseminating the survey through institutional e-mails and official communication channels to all undergraduate students. Additionally, kiosks were placed in different areas of the university, where willing participants were provided the participation link for them to respond to the survey.Footnote 9
Survey protocol
In the initial step of the data collection process, undergraduate students from each faculty received an invitation and were encouraged to submit their answers remotely. The participant who started the survey was presented with an informational consent form in which all the implications and disclosable information of the study were displayed.Footnote 10 Participants were told that the project was about the demand for intermediation services in the procurement of bureaucratic services without explicitly referencing corruption.Footnote 11 Upon acceptance, participants filled out three main survey sections.
-
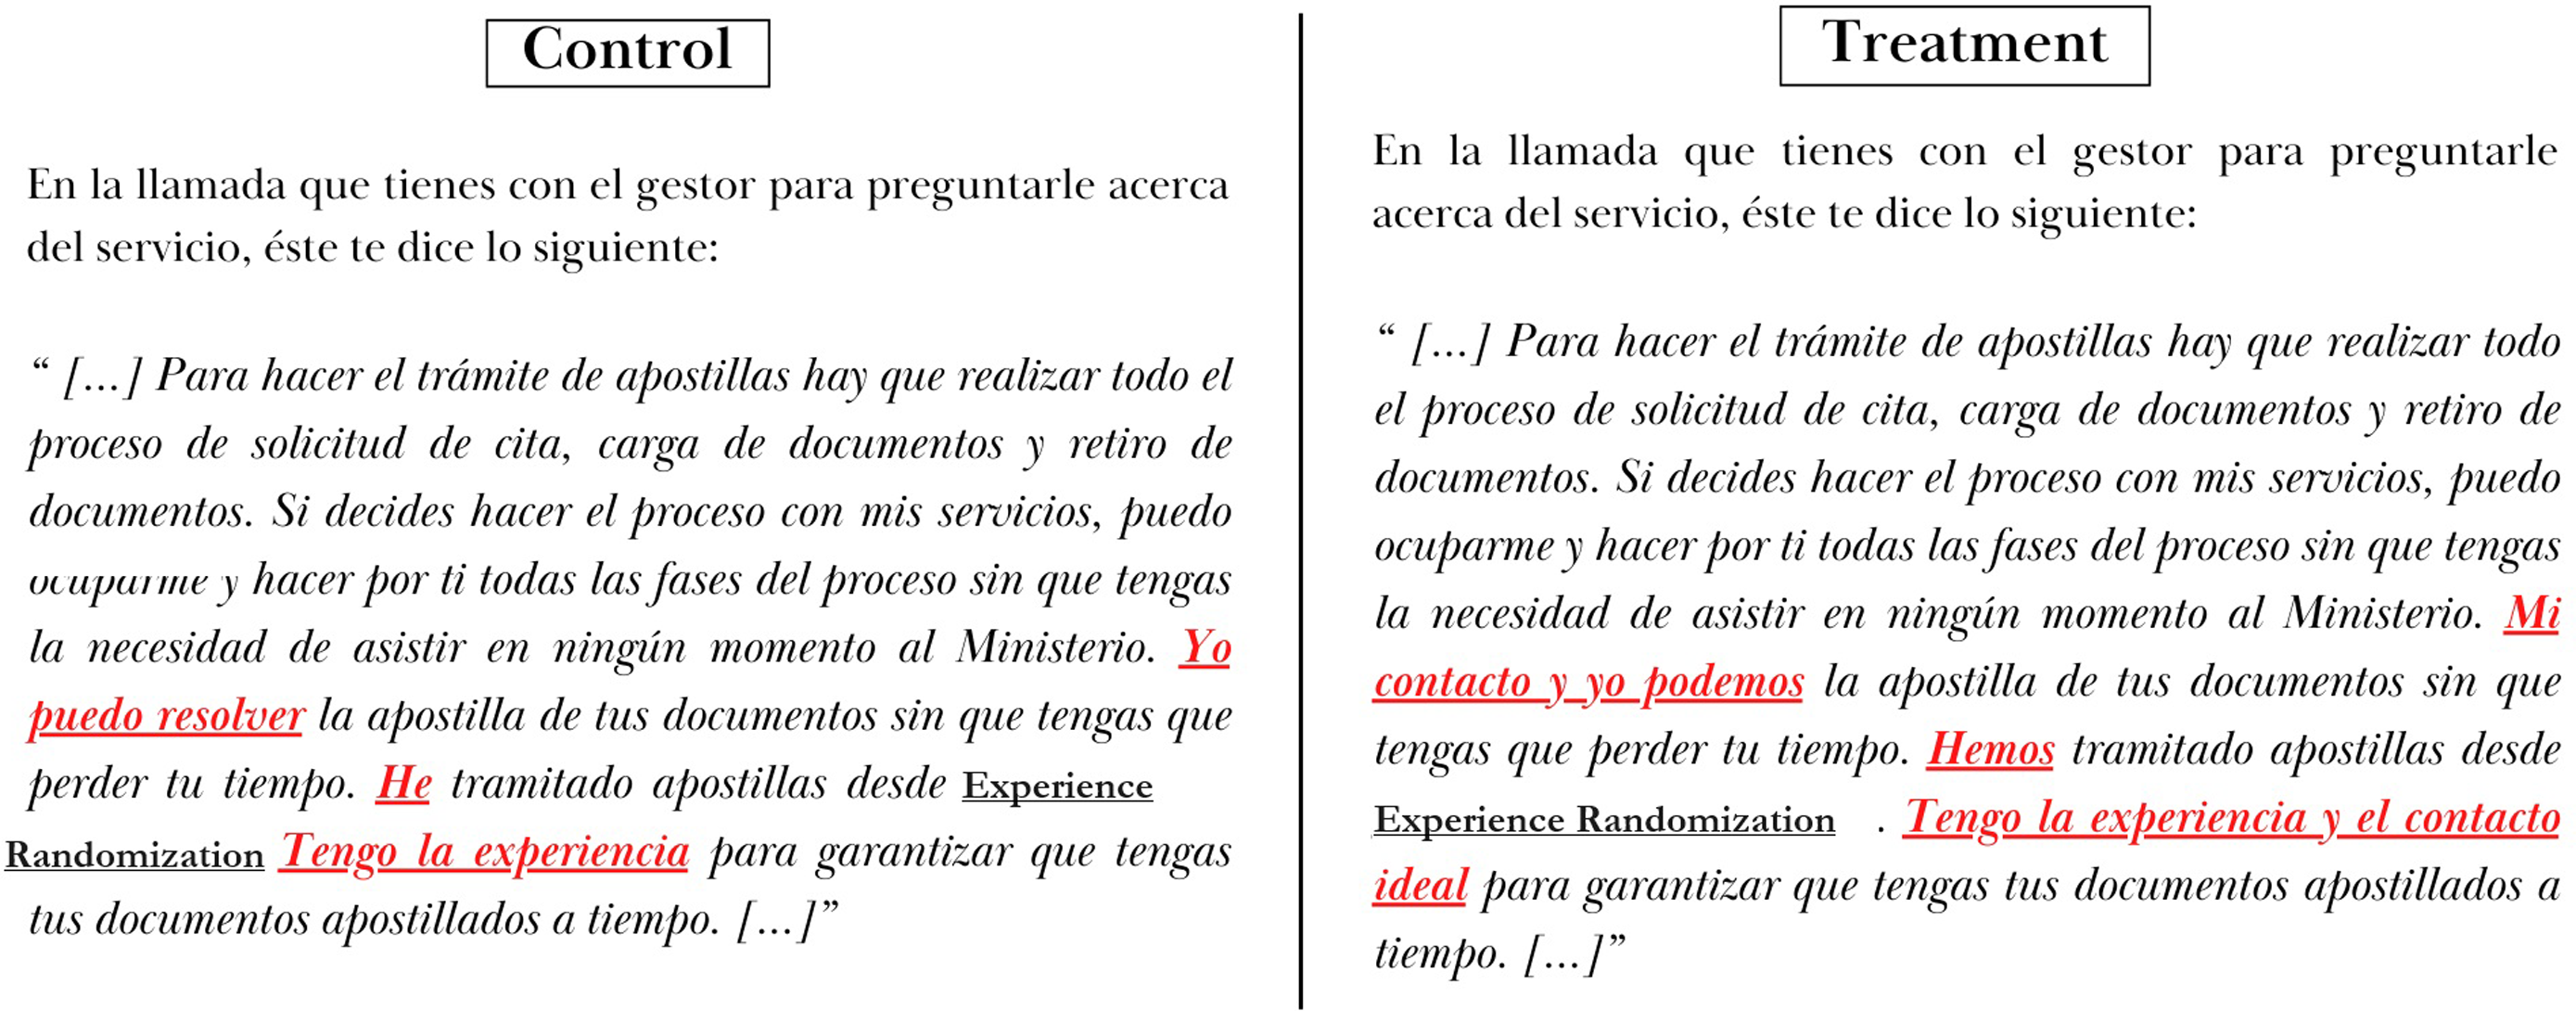
1. In the first part, the participant was presented with a hypothetical situation. In this situation, the participant was accepted for a job abroad and needed to apostille her academic documents, but due to time and information constraints, she is considering using intermediary services. Participants are shown a random script of her conversation with a possible gestor, in which they are presented with information about the intermediary’s fee, the suggestion of an illicit connection within the bureaucracy, whether an acquaintance introduced the intermediary, the speed of the process and the intermediary’s experience. These treatments were independently randomized across surveyees (see Table A1 for a description of each treatment). After being presented with the situation, the participant was asked if she would pay for the intermediary’s service in a “take-it-or-leave-it” scenario. Additionally, the participant was asked if she would have bargained and the highest price she would have been willing to pay for the service.
-
2. The second part consisted of three questions regarding the participant’s desire to emigrate, previous experience with intermediaries, and whether she would characterize the prior experience as good, neutral, or bad.
-
3. The third part consisted of questions regarding the demographic and academic characteristics of the participant.
Participants filled out their responses over a two-week period between September 21 and October 5, 2022. Survey information was collected in a fully anonymous manner. Fig. A1 outlines the intervention procedure for the control and treatment groups.
Power calculations and sample size
We conducted power calculations to assess the sample sizes necessary to achieve 80% statistical power under sensible assumptions for the minimum detectable effects (MDE) in our estimations. Our initial test evaluates the effect of random, balanced binary treatments on a binary take-up outcome. Our calculations suggest that in order to detect a 10 percentage point effect of such a treatment under a baseline take-up of 70%, we required a sample size of at least 146 observations. In our subsequent tests, we consider two-way interactions between random, balanced, and binary treatments on a binary take-up outcome. We leverage the methodology outlined in Sommet (Reference Sommet2022) to perform power calculations in this context. In order to be sufficiently powered to detect the effect of an interaction term, we require a sample of 502 observations. Our main sample of 567 observations captures information from all participants who finished the survey.Footnote 12 In order to gain further precision in our causal estimates, we also incorporate surveyees’ demographic and academic covariates into our estimation methodology.
Results and analysis
Each survey participant was randomly assigned to either a treatment group or a control group in each of the treatment branches.Footnote 13 In this section, we outline our three main hypotheses and the results of our analyses.Footnote 14 Table A2 provides summary statistics for variables connected to the first two sections of the survey. Table A3 provides balance tests over sociodemographic variables, confirming that our procedures effectively randomize all five treatment branches. Finally, Table A4 shows that participants who did not finish the survey after being assigned a script were balanced across treatment and control groups for all treatment branches, suggesting that differential attrition is not a concern in our study.
Effects of corruption suggestions on take-up
Since the outcome of interest is whether the participant decides to pay for the intermediary’s service, we assessed the average effect of corruption suggestions on take-up by performing the following linear probability model (LPMs):Footnote 15
 $${Y_i} = {\beta _0} + {\beta _1}Corruptio{n_i} + {\varepsilon _i}$$ ${Y_i}$
is a binary marker for whether participant
${Y_i}$
is a binary marker for whether participant $i$
decides to take the service, and
$i$
decides to take the service, and $Corruptio{n_i}$
is a binary marker for the corruption suggestion treatment.
$Corruptio{n_i}$
is a binary marker for the corruption suggestion treatment. ${\beta _1}$
captures the average effect of a suggestion of corruption on the probability of agency service take-up. We assess the statistical significance of our estimates using robust standard errors.
${\beta _1}$
captures the average effect of a suggestion of corruption on the probability of agency service take-up. We assess the statistical significance of our estimates using robust standard errors.
Consistent with the “market maker” view of intermediaries, we hypothesize that estimates for ${\beta _1}$
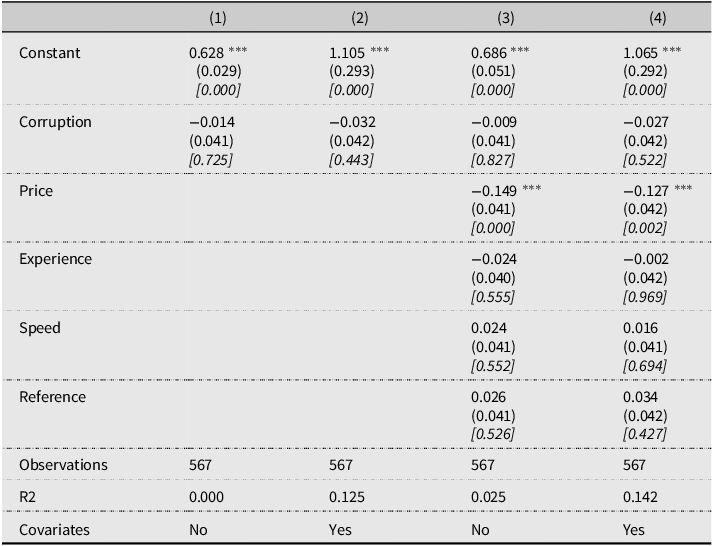
should be positive and significant. Table 1 provides four estimates for
${\beta _1}$
should be positive and significant. Table 1 provides four estimates for ${\beta _1}$
. Column (1) provides the simplest specification described in Equation (1). Column (2) adds sociodemographic covariates. Column (3) controls for other treatment branches. Finally, Column (4) controls both for covariates and other treatment branches. Our estimates for
${\beta _1}$
. Column (1) provides the simplest specification described in Equation (1). Column (2) adds sociodemographic covariates. Column (3) controls for other treatment branches. Finally, Column (4) controls both for covariates and other treatment branches. Our estimates for ${\beta _1}$
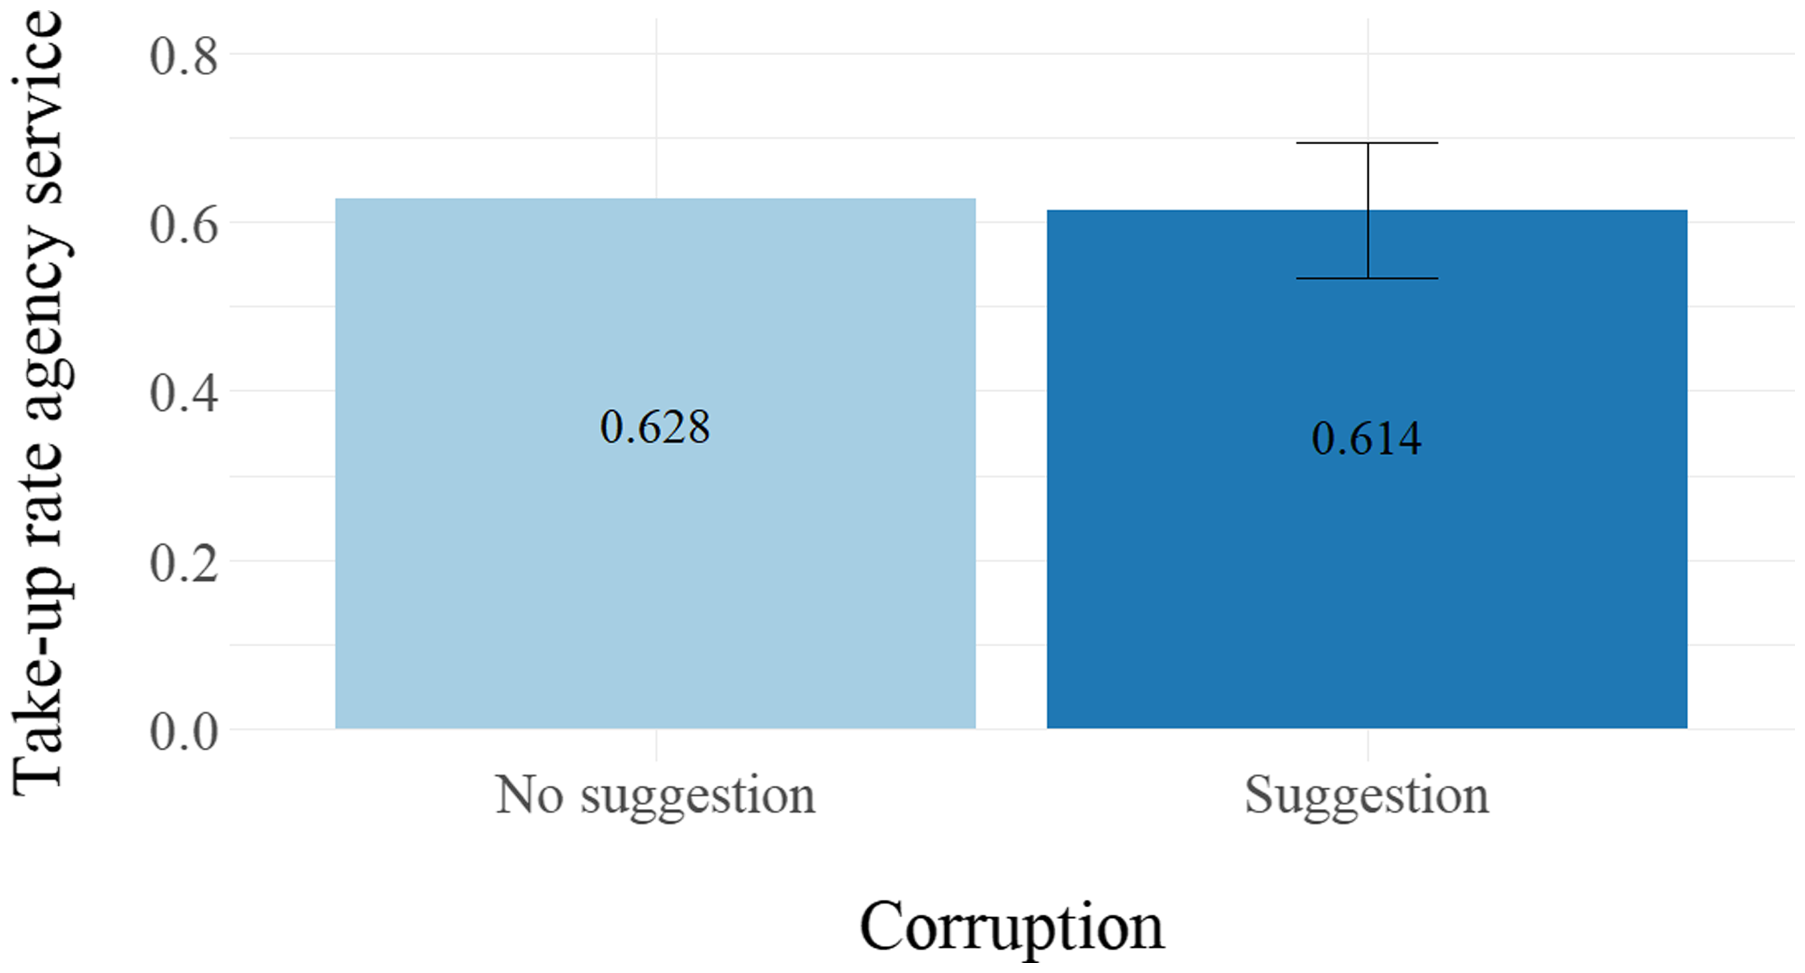
are all negative and statistically insignificant, suggesting that they are inconsistent with the “market maker” hypothesis, but also not conclusively consistent with the “moral cost” perspective. Fig. 1 confirms the statistically indistinguishable take-up rates across treatment branches.
${\beta _1}$
are all negative and statistically insignificant, suggesting that they are inconsistent with the “market maker” hypothesis, but also not conclusively consistent with the “moral cost” perspective. Fig. 1 confirms the statistically indistinguishable take-up rates across treatment branches.
Effect of corruption suggestions on take-up
Notes: Table shows estimates for ${\beta _1}$
in Equation (1). Column (1) provides the simplest specification described in Equation (1). Column (2) adds sociodemographic covariates. Column (3) controls for other treatment branches. Finally, Column (4) controls for both covariates and other treatments. Heteroskedasticity robust standard errors provided. Standard errors are specified in parentheses, and exact p-values are reported between brackets.
${\beta _1}$
in Equation (1). Column (1) provides the simplest specification described in Equation (1). Column (2) adds sociodemographic covariates. Column (3) controls for other treatment branches. Finally, Column (4) controls for both covariates and other treatments. Heteroskedasticity robust standard errors provided. Standard errors are specified in parentheses, and exact p-values are reported between brackets. ${{\rm{\;}}^{\rm{*}}}p \lt 0.1$
;
${{\rm{\;}}^{\rm{*}}}p \lt 0.1$
; ${{\rm{\;}}^{{\rm{**}}}}p \lt 0.05$
;
${{\rm{\;}}^{{\rm{**}}}}p \lt 0.05$
; ${{\rm{\;}}^{{\rm{***}}}}p \lt 0.01$
.
${{\rm{\;}}^{{\rm{***}}}}p \lt 0.01$
.
Take-up rate by corruption suggestion category.
Notes: Figure shows the intermediary service take-up rate for individuals in each of the corruption treatment branches, corresponding to the model specified in Equation (1) consistent with estimates from Column (1) in Table 1. Dark line captures the confidence interval for the take-up rate under a corruption suggestion.
Effects of corruption on demand price elasticity
We also hypothesize that, given the uncertainty and time constraints in the hypothetical situation presented to participants, corruption priming should erode the sensibility of demand for higher service fees. To test this hypothesis, we estimated the following LPM:Footnote 16
 $${Y_i} = {\beta _0} + {\beta _1}Corruptio{n_i} + {\beta _2}Pric{e_i} + {\beta _3}Corruptio{n_i}{\rm\;{*}\;}Pric{e_i} + {\varepsilon _i}$$
where $Pric{e_i}$
is a binary marker for whether or not the participant was assigned to a high price,
$Pric{e_i}$
is a binary marker for whether or not the participant was assigned to a high price, ${\beta _1}$
captures the effect of a suggestion of corruption under a low price,
${\beta _1}$
captures the effect of a suggestion of corruption under a low price, ${\beta _2}$
captures the effect of a high price on demand under no suggestion of corruption, and
${\beta _2}$
captures the effect of a high price on demand under no suggestion of corruption, and ${\beta _3}$
captures how that effect changes with the suggestion of corruption. We hypothesize that
${\beta _3}$
captures how that effect changes with the suggestion of corruption. We hypothesize that ${\beta _1}$
should be positive and significant,
${\beta _1}$
should be positive and significant, ${\beta _2}$
should be negative and significant, and
${\beta _2}$
should be negative and significant, and ${\beta _3}$
should be positive and of a similar absolute magnitude than
${\beta _3}$
should be positive and of a similar absolute magnitude than ${\beta _2}$
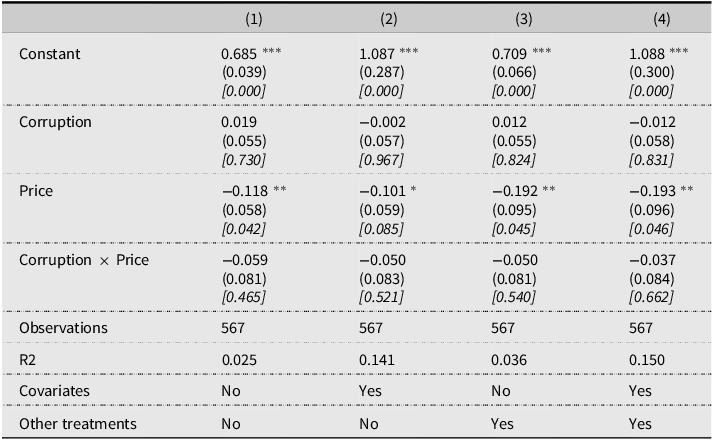
. This combination of results would suggest that a suggestion of corruption makes the demand for intermediary services to become inelastic. However, Table 2 suggests that estimates of
${\beta _2}$
. This combination of results would suggest that a suggestion of corruption makes the demand for intermediary services to become inelastic. However, Table 2 suggests that estimates of ${\beta _1}$
and
${\beta _1}$
and ${\beta _3}$
are indistinguishable from 0, while
${\beta _3}$
are indistinguishable from 0, while ${\beta _2}$
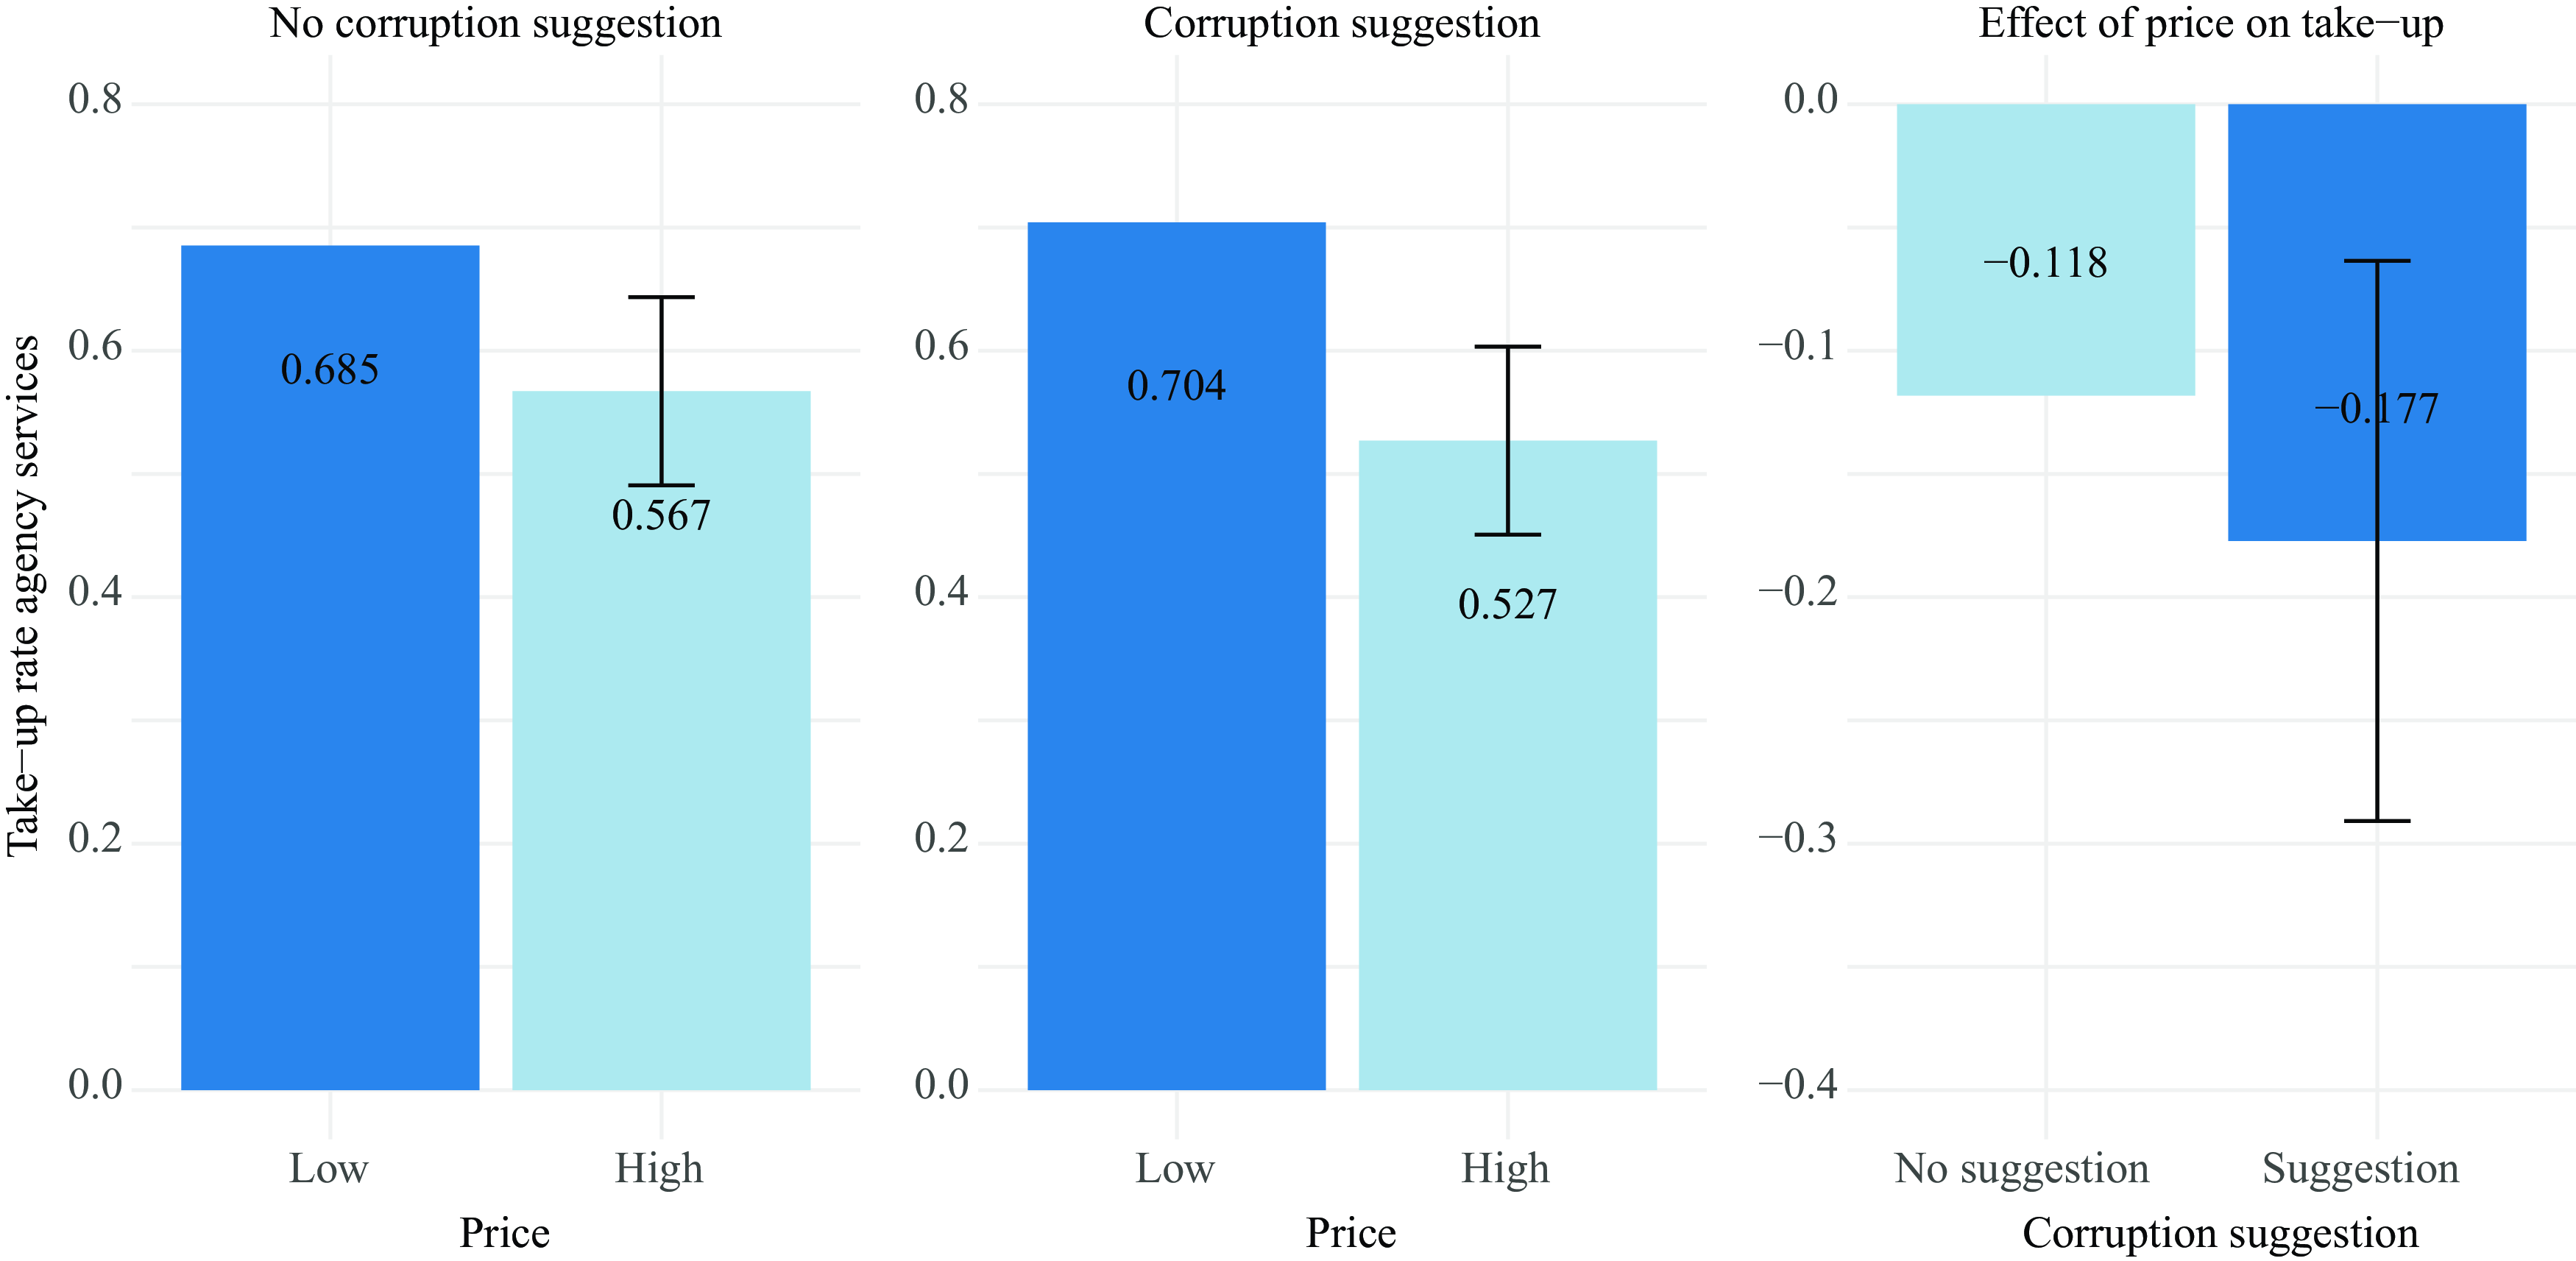
is negative and statistically significant. These results suggest that while the demand for gestores is elastic to higher prices, we cannot reject the null hypothesis that corruption suggestions do not affect the demand for intermediary services or its price elasticity. Fig. 2 confirms the higher (but not statistically significant) price elasticity for individuals under the corruption suggestion treatment.
${\beta _2}$
is negative and statistically significant. These results suggest that while the demand for gestores is elastic to higher prices, we cannot reject the null hypothesis that corruption suggestions do not affect the demand for intermediary services or its price elasticity. Fig. 2 confirms the higher (but not statistically significant) price elasticity for individuals under the corruption suggestion treatment.
Effect of corruption suggestions on price elasticity
Notes: Table shows estimates for $_1$
,
$_1$
, ${\beta _2}$
and
${\beta _2}$
and ${\beta _3}$
in Equation (2). Column (1) provides the simplest specification described in Equation (2). Column (2) adds sociodemographic covariates. Column (3) controls for other treatment branches. Finally, Column (4) controls for both covariates and other treatments. Heteroskedasticity robust standard errors provided. Standard errors are specified in parentheses and exact p-values are reported between brackets.
${\beta _3}$
in Equation (2). Column (1) provides the simplest specification described in Equation (2). Column (2) adds sociodemographic covariates. Column (3) controls for other treatment branches. Finally, Column (4) controls for both covariates and other treatments. Heteroskedasticity robust standard errors provided. Standard errors are specified in parentheses and exact p-values are reported between brackets. ${{\rm{\;}}^{\rm{*}}}p \lt 0.1$
;
${{\rm{\;}}^{\rm{*}}}p \lt 0.1$
; ${{\rm{\;}}^{{\rm{**}}}}p \lt 0.05$
;
${{\rm{\;}}^{{\rm{**}}}}p \lt 0.05$
; ${{\rm{\;}}^{{\rm{***}}}}p \lt 0.01$
.
${{\rm{\;}}^{{\rm{***}}}}p \lt 0.01$
.
Take-up rates by price levels and corruption suggestions.
Notes: Figure shows the intermediary service take-up rate for individuals in each of the corruption and price treatment branches, corresponding to the model specified in Equation (2) consistent with estimates from Column (1) in Table 2. Dark lines capture the confidence interval for the take-up rate under high prices in the sample of no corruption suggestion (Panel A), on the sample of corruption suggestion (Panel B), and of the effect of facing a high price on service take-up under a corruption suggestion (Panel C).
Does the effect of corruption travel through trusted references?
To further assess how corruption suggestions may make intermediary services more appealing to survey participants, we now evaluate whether the effects of corruption suggestions are contingent on instances in which gestores are referred by participants’ trusted networks. Anecdotally, this is a relevant margin in dealing with the inherent uncertainties associated with intermediary services in Venezuela. To assess whether suggestions of illicit contacts with the bureaucracy are contingent to gestores referred by trusted individuals, we perform the following LPM:Footnote 17
 $${Y_i} = {\beta _0} + {\beta _1}Corruptio{n_i} + {\beta _2}Referenc{e_i} + {\beta _3}Corruptio{n_i}\;{\rm{*}}\;Referenc{e_i} + {\varepsilon _i}$$
where $Referenc{e_i}$
stands for a binary marker of whether the script says that the link to the gestor came from a trusted individual.
$Referenc{e_i}$
stands for a binary marker of whether the script says that the link to the gestor came from a trusted individual. ${\beta _1}$
captures the effect of a suggestion of corruption from an agent found online,
${\beta _1}$
captures the effect of a suggestion of corruption from an agent found online, ${\beta _2}$
captures the effect of a trusted reference on demand under no suggestion of corruption, and
${\beta _2}$
captures the effect of a trusted reference on demand under no suggestion of corruption, and ${\beta _3}$
captures how the effect of suggestions of corruption changes with a trusted reference. We hypothesize that
${\beta _3}$
captures how the effect of suggestions of corruption changes with a trusted reference. We hypothesize that ${\beta _1}$
should be either zero or negative, and both
${\beta _1}$
should be either zero or negative, and both ${\beta _2}$
and
${\beta _2}$
and ${\beta _3}$
to be positive and statistically significant. Importantly, we expected
${\beta _3}$
to be positive and statistically significant. Importantly, we expected ${\beta _3}$
to be larger in absolute magnitude than
${\beta _3}$
to be larger in absolute magnitude than ${\beta _1}$
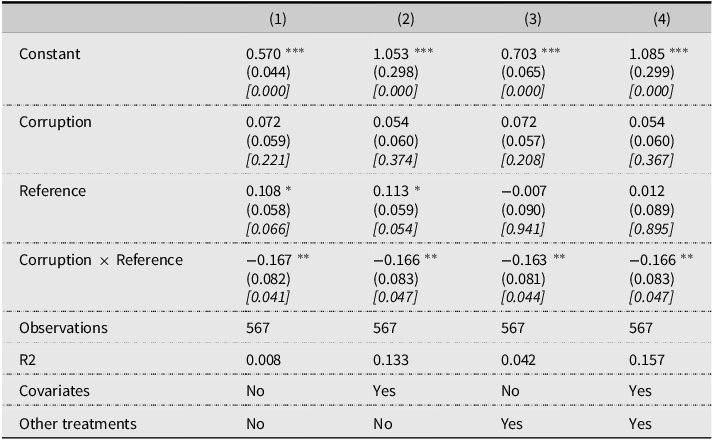
. These results would suggest that intermediaries’ “market maker” role activates whenever gestores can leverage clients’ social networks for credibility in an inherently uncertain and opaque transaction. Table 3 provides estimates for
${\beta _1}$
. These results would suggest that intermediaries’ “market maker” role activates whenever gestores can leverage clients’ social networks for credibility in an inherently uncertain and opaque transaction. Table 3 provides estimates for ${\beta _1}$
,
${\beta _1}$
, ${\beta _2}$
, and
${\beta _2}$
, and ${\beta _3}$
as described in Equation (3). While estimates for
${\beta _3}$
as described in Equation (3). While estimates for ${\beta _2}$
in Columns 1 and 2 suggest that trusted references may enable the demand for gestores in the absence of a corruption suggestion, estimates for
${\beta _2}$
in Columns 1 and 2 suggest that trusted references may enable the demand for gestores in the absence of a corruption suggestion, estimates for ${\beta _1}$
are positive but insignificant, and estimates for
${\beta _1}$
are positive but insignificant, and estimates for ${\beta _3}$
are negative and statistically significant.Footnote
18
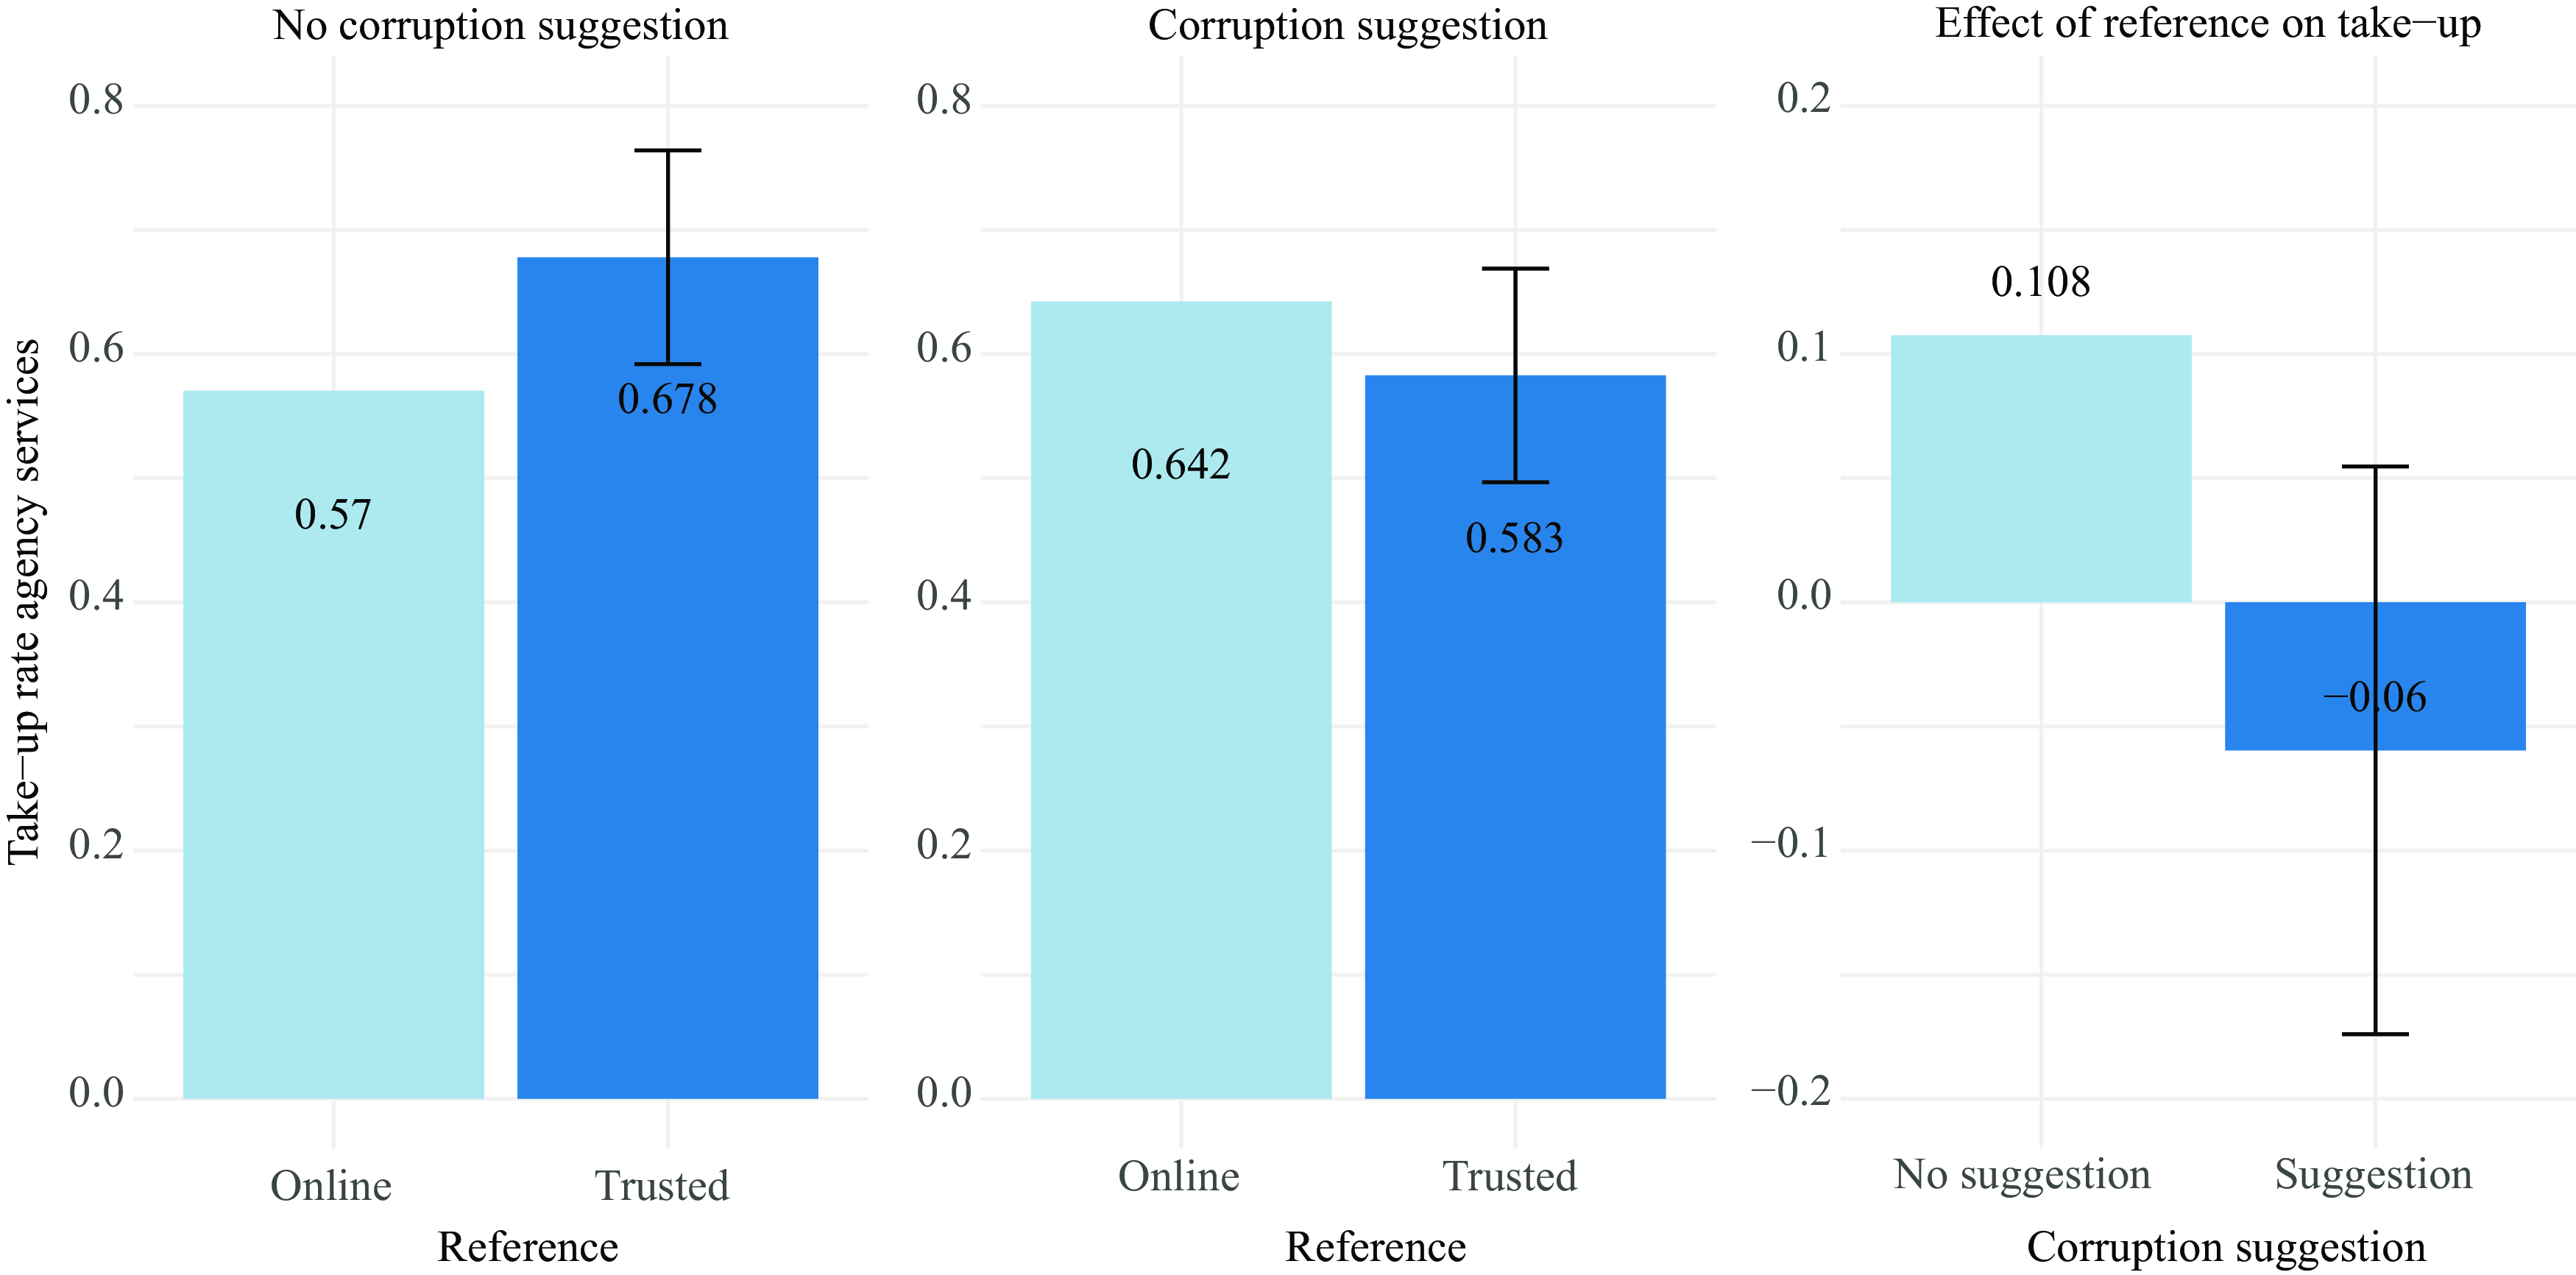
As in previous specifications, these results are broadly inconsistent with our hypotheses. Fig. 3 shows the positive effect of a trusted reference on service take-up under no suggestion of corruption and the absence of such effect under corruption suggestions.
${\beta _3}$
are negative and statistically significant.Footnote
18
As in previous specifications, these results are broadly inconsistent with our hypotheses. Fig. 3 shows the positive effect of a trusted reference on service take-up under no suggestion of corruption and the absence of such effect under corruption suggestions.
Effect of corruption suggestions and trusted reference to intermediaries
Notes: Table shows estimates for ${\beta _1}$
,
${\beta _1}$
, ${\beta _2}$
and
${\beta _2}$
and ${\beta _3}$
in Equation (3). Column (1) provides the simplest specification described in Equation (3). Column (2) adds sociodemographic covariates. Column (3) controls for other treatment branches. Finally, Column (4) controls for both covariates and other treatments. Heteroskedasticity robust standard errors provided. Standard errors are specified in parentheses, and exact p-values are reported between brackets.
${\beta _3}$
in Equation (3). Column (1) provides the simplest specification described in Equation (3). Column (2) adds sociodemographic covariates. Column (3) controls for other treatment branches. Finally, Column (4) controls for both covariates and other treatments. Heteroskedasticity robust standard errors provided. Standard errors are specified in parentheses, and exact p-values are reported between brackets. ${{\rm{\;}}^{\rm{*}}}p \lt 0.1$
;
${{\rm{\;}}^{\rm{*}}}p \lt 0.1$
; ${{\rm{\;}}^{{\rm{**}}}}p \lt 0.05$
;
${{\rm{\;}}^{{\rm{**}}}}p \lt 0.05$
; ${{\rm{\;}}^{{\rm{***}}}}p \lt 0.01.$
Take-up rates by reference type and corruption suggestion.
Notes: Figure shows the intermediary service take-up rate for individuals in each of the corruption and reference treatment branches, corresponding to the model specified in Equation (3) consistent with estimates from Column (1) in Table 3. Dark lines capture the confidence interval for the take-up rate under a trusted reference in the sample of no corruption suggestion (Panel A), on the sample of corruption suggestion (Panel B), and of the effect of having a trusted reference on service take-up under a corruption suggestion (Panel C).
Heterogeneities over sociodemographic covariates
The “market maker” role for intermediaries may be contingent on specific client characteristics, making them more likely to engage in transactions that involve an illicit contact with the bureaucracy. Studies have empirically found that women tend to be less likely to engage in corrupt activities (Agerberg, Reference Agerberg2014; Alatas et al., Reference Alatas, Cameron, Chaudhuri, Erkal and Gangadharan2009; Barnes and Beaulieu, Reference Barnes and Beaulieu2014) and that people with higher income levels are more likely to engage in bribery to preserve their privilege and status (Jong-Sung and Khagram, Reference Jong-Sung and Khagram2005). Moreover, this role may be most relevant for individuals who find the hypothetical case prescient for their current situation. For instance, in the context of this study, we presume that participants close to finishing their undergraduate studies should easily relate to the hypothetical situation presented in our experimental survey.
To assess whether the effects of corruption suggestions are contingent on these margins, we evaluate heterogeneities over specific participant sociodemographic characteristics. We perform the following LPM:Footnote 19
 $${Y_i} = {\beta _0} + {\beta _1}Corruptio{n_i} + {\beta _2}{X_i} + {\beta _3}Corruptio{n_i}\;{\rm{*}}\;{X_i} + {\varepsilon _i}$$
where ${X_i}$
is a sociodemographic covariate hypothesized to activate the “market maker” role of intermediaries according to the references and the discussion above (Males, High income, or Late stage of their undergraduate studies). We hypothesize that
${X_i}$
is a sociodemographic covariate hypothesized to activate the “market maker” role of intermediaries according to the references and the discussion above (Males, High income, or Late stage of their undergraduate studies). We hypothesize that ${\beta _1}$
is zero or negative, and
${\beta _1}$
is zero or negative, and ${\beta _3}$
should be positive and larger in absolute magnitude than
${\beta _3}$
should be positive and larger in absolute magnitude than ${\beta _1}$
.Footnote
20
This combination of results would suggest that the effect of a corruption suggestion is stronger and positive for individuals co-variate characteristics hypothesized to activate the “market maker” role of intermediaries.
${\beta _1}$
.Footnote
20
This combination of results would suggest that the effect of a corruption suggestion is stronger and positive for individuals co-variate characteristics hypothesized to activate the “market maker” role of intermediaries.
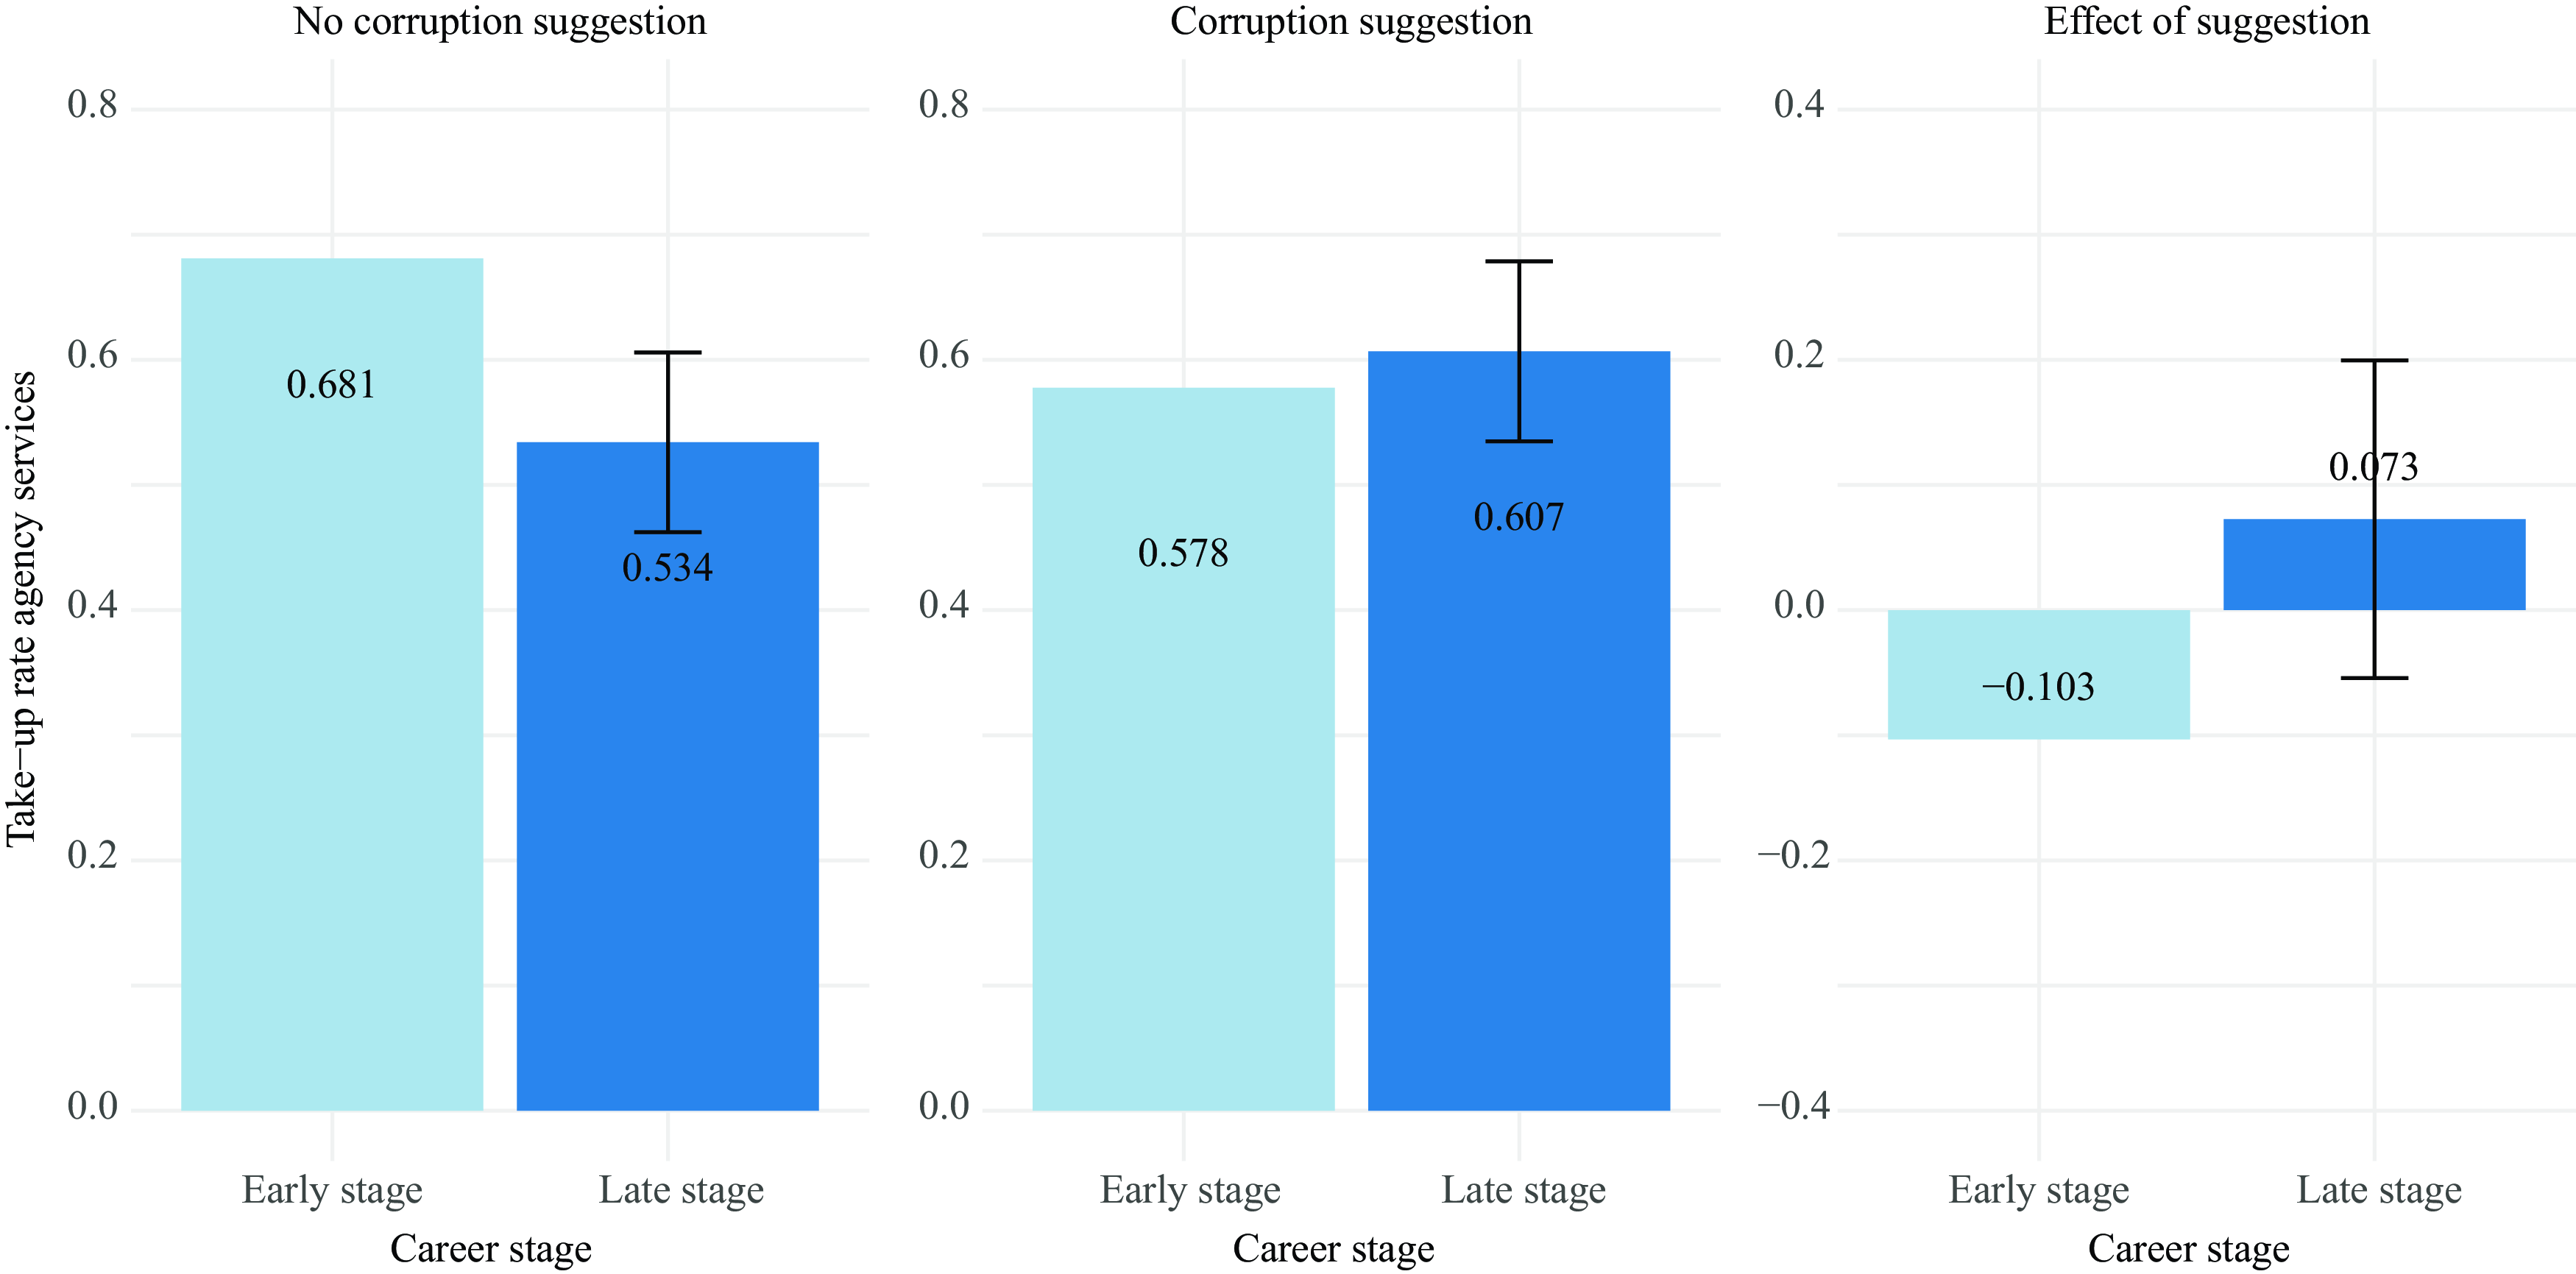
In unreported results, we find that estimates of the effect of corruption are not heterogeneous along the gender and income margins. Table A8 assesses the heterogeneity in the effects of corruption along the stage of participants’ undergraduate studies on a restricted sample of responses that comply with Qualtrics’ automatic quality filters. Our estimates of ${\beta _1}$
indicate that the effect of a corruption suggestion is negative for students at the early stages of their undergraduate studies. Estimates for
${\beta _1}$
indicate that the effect of a corruption suggestion is negative for students at the early stages of their undergraduate studies. Estimates for ${\beta _2}$
suggest that late-stage students are less likely to take the intermediary services in the absence of corruption suggestions. Finally, estimates for
${\beta _2}$
suggest that late-stage students are less likely to take the intermediary services in the absence of corruption suggestions. Finally, estimates for ${\beta _3}$
suggest that the effect of corruption suggestions grows for students in the later stages of their careers. Interestingly, estimates of
${\beta _3}$
suggest that the effect of corruption suggestions grows for students in the later stages of their careers. Interestingly, estimates of ${\beta _3}$
across specifications are larger in absolute magnitude than those observed for
${\beta _3}$
across specifications are larger in absolute magnitude than those observed for ${\beta _1}$
. These results suggest that “moral cost” considerations may dominate decisions for younger students, but that such considerations are eroded for respondents at later stages of their undergraduate studies.Footnote
21
Students in later career stages may find the hypothesized case to be prescient to their current situation, as they are closer to graduating and may be considering migrating as young professionals in the near future. Similarly, students at later career stages are more likely to have experience procuring bureaucratic services for different motives, potentially through the services of gestores.
${\beta _1}$
. These results suggest that “moral cost” considerations may dominate decisions for younger students, but that such considerations are eroded for respondents at later stages of their undergraduate studies.Footnote
21
Students in later career stages may find the hypothesized case to be prescient to their current situation, as they are closer to graduating and may be considering migrating as young professionals in the near future. Similarly, students at later career stages are more likely to have experience procuring bureaucratic services for different motives, potentially through the services of gestores.
Trusted references and the price elasticity of demand for gestores
Results shown in Table 3 hinted at the possibility that trusted references to gestores may have an independent positive effect on the demand for their services. This is consistent with the view that references solve the inherent uncertainty associated with intermediary services in which illicit connections to the bureaucracy are implied, and with anecdotal evidence about the spread of information about intermediaries in Venezuela. We test the effect of references on price elasticity through the following LPM:Footnote 22
 $${Y_i} = {\beta _0} + {\beta _1}Pric{e_i} + {\beta _2}Referenc{e_i} + {\beta _3}Pric{e_i}\;{\rm{*}}\;Referenc{e_i} + {\varepsilon _i}$$
We hypothesize that ${\beta _1}$
is negative,
${\beta _1}$
is negative, ${\beta _2}$
is zero or positive, and
${\beta _2}$
is zero or positive, and ${\beta _3}$
is positive and of a similar absolute magnitude as
${\beta _3}$
is positive and of a similar absolute magnitude as ${\beta _1}$
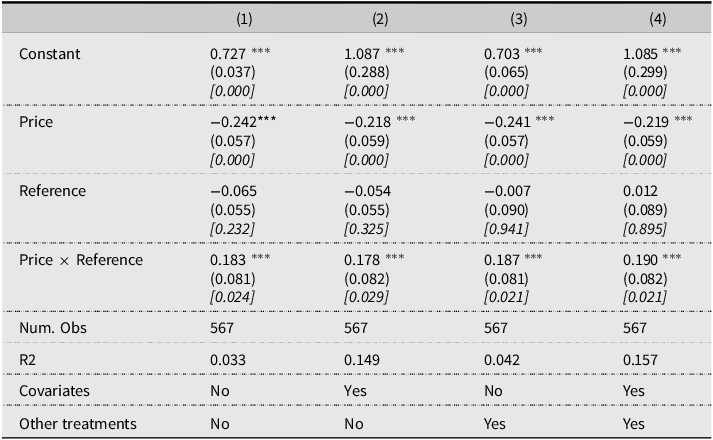
, which would suggest that the demand for intermediary services becomes inelastic for gestores whose information came from trusted individuals. Table 4 shows estimates for each of these coefficients. Negative and significant estimates for
${\beta _1}$
, which would suggest that the demand for intermediary services becomes inelastic for gestores whose information came from trusted individuals. Table 4 shows estimates for each of these coefficients. Negative and significant estimates for ${\beta _1}$
suggest a precise price elasticity of demand in the absence of a trusted reference. Estimates of
${\beta _1}$
suggest a precise price elasticity of demand in the absence of a trusted reference. Estimates of ${\beta _2}$
suggest that trusted references do not magnify the demand for gestores at low prices. Finally, estimates for
${\beta _2}$
suggest that trusted references do not magnify the demand for gestores at low prices. Finally, estimates for ${\beta _3}$
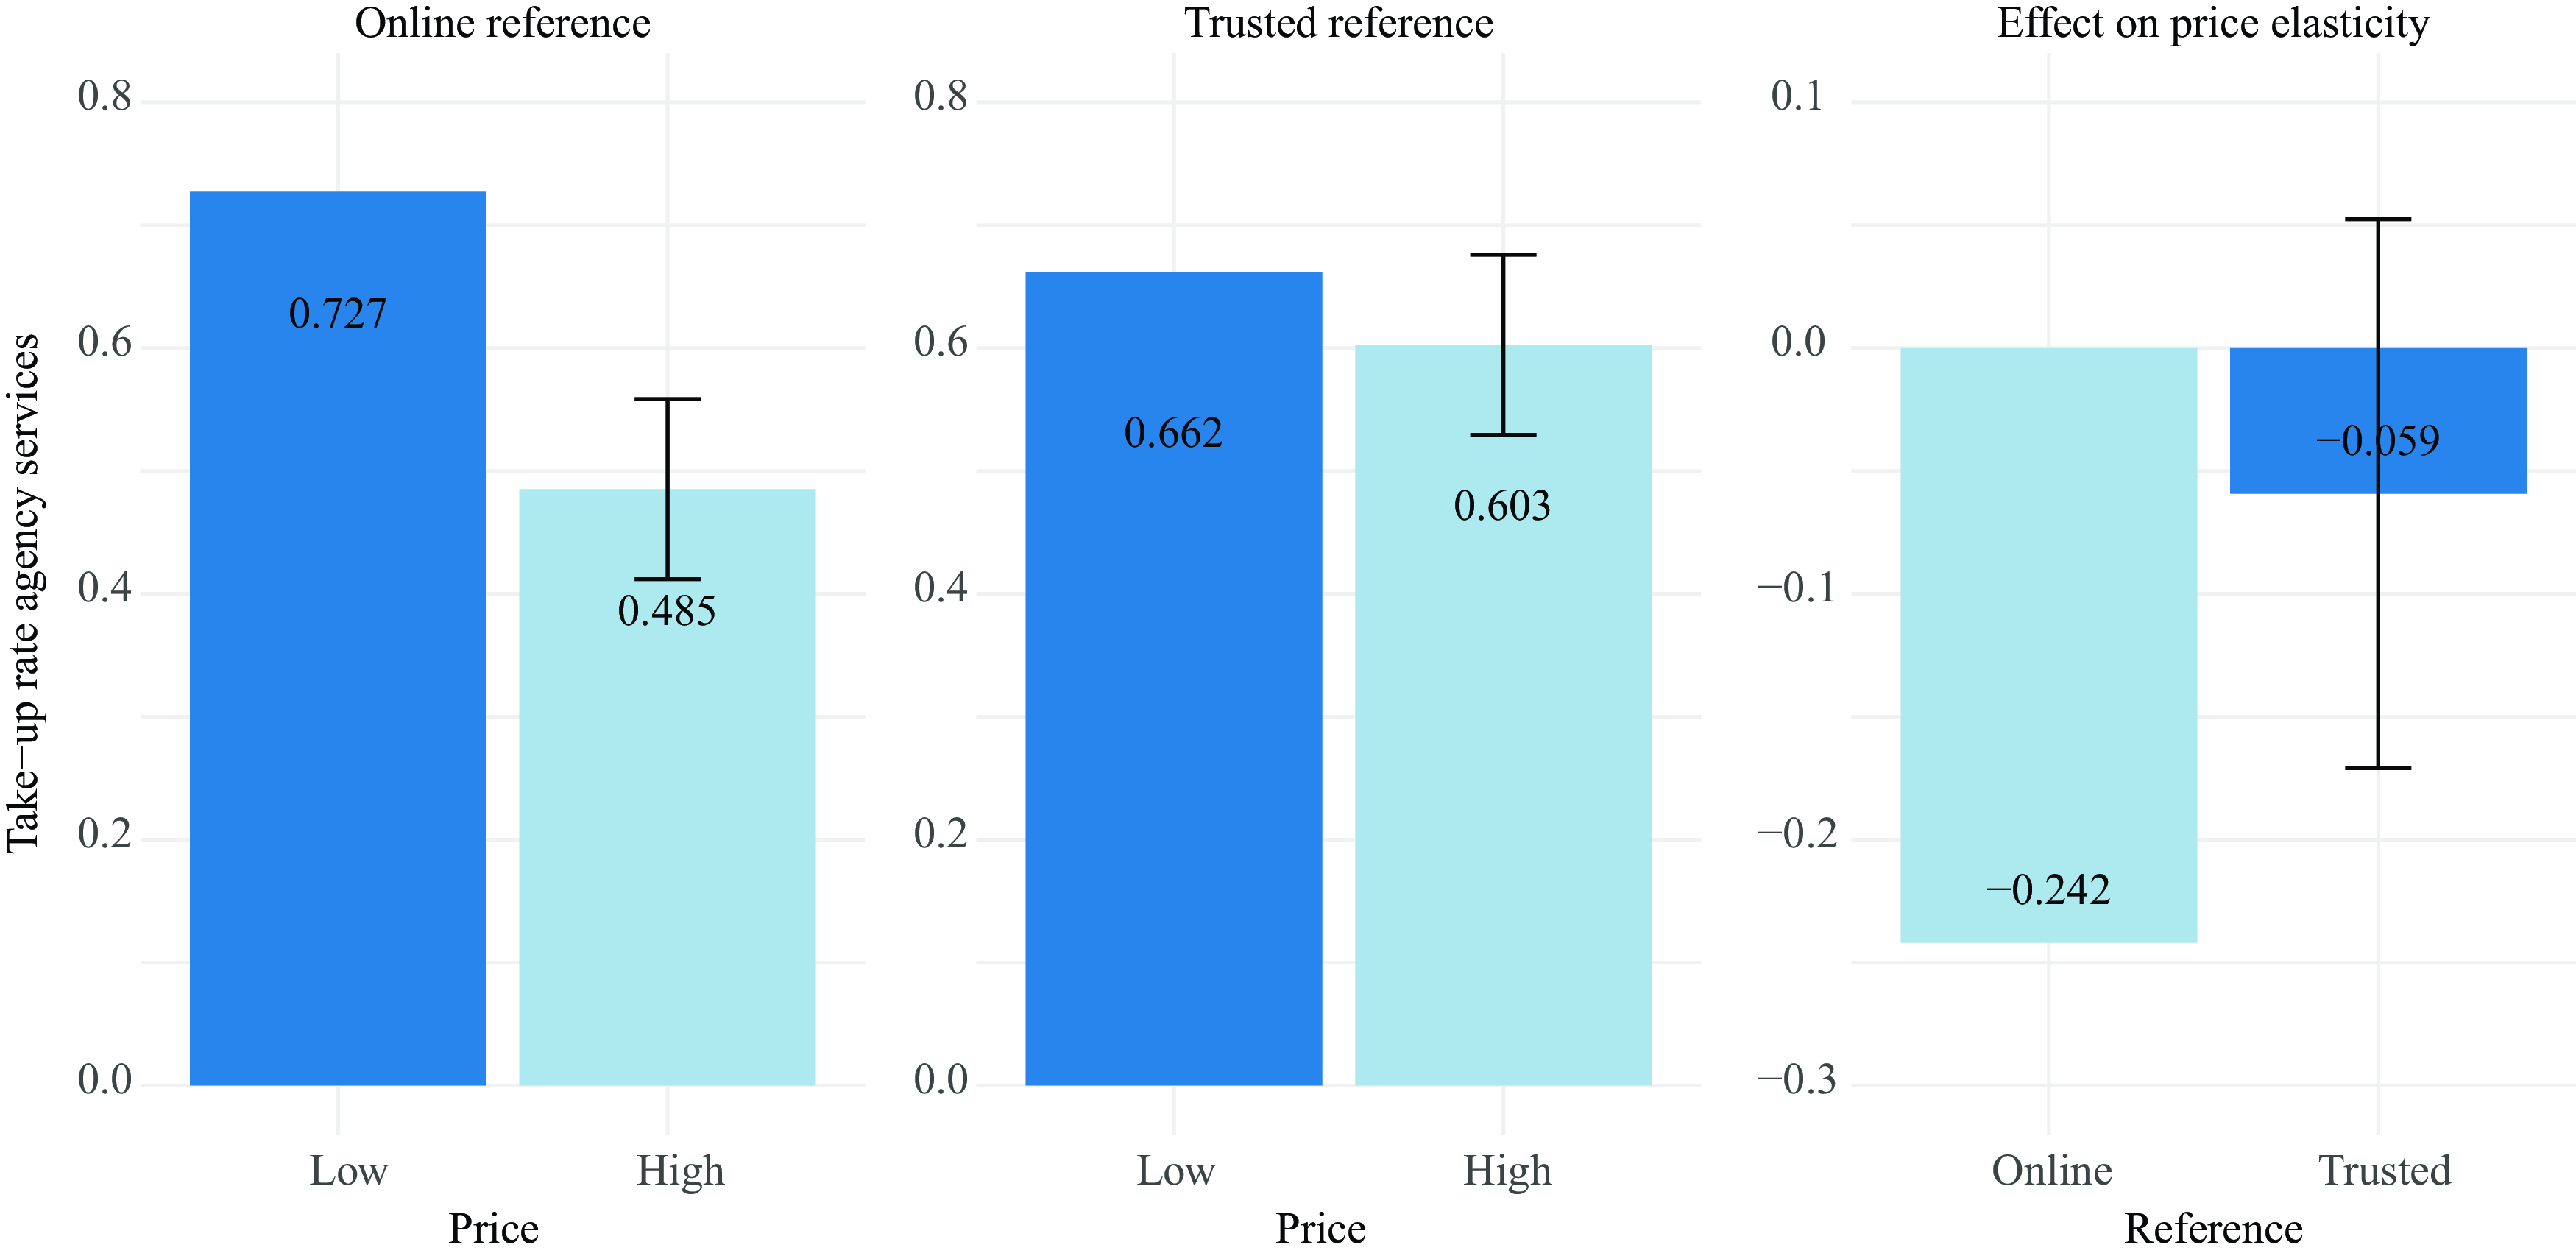
suggest that the negative effects of prices on take-up are almost fully eroded whenever a gestor was introduced to the participant by a trusted reference – that is, the demand for such intermediaries is price-inelastic. Fig. 4 shows the reversion in the price elasticity of demand between intermediaries with and without a trusted reference to the client.
${\beta _3}$
suggest that the negative effects of prices on take-up are almost fully eroded whenever a gestor was introduced to the participant by a trusted reference – that is, the demand for such intermediaries is price-inelastic. Fig. 4 shows the reversion in the price elasticity of demand between intermediaries with and without a trusted reference to the client.
Demand price elasticity and intermediaries referred by trusted individuals
Notes: Table shows estimates for ${\beta _1}$
,
${\beta _1}$
, ${\beta _2}$
and
${\beta _2}$
and ${\beta _3}$
in Equation (5). Column (1) provides the simplest specification described in Equation (5). Column (2) adds sociodemographic covariates. Column (3) controls for other treatment branches. Finally, Column (4) controls for both covariates and other treatments. Heteroskedasticity robust standard errors provided. Standard errors are specified in parentheses, and exact p-values are reported between brackets.
${\beta _3}$
in Equation (5). Column (1) provides the simplest specification described in Equation (5). Column (2) adds sociodemographic covariates. Column (3) controls for other treatment branches. Finally, Column (4) controls for both covariates and other treatments. Heteroskedasticity robust standard errors provided. Standard errors are specified in parentheses, and exact p-values are reported between brackets. ${{\rm{\;}}^{\rm{*}}}p \lt 0.1$
;
${{\rm{\;}}^{\rm{*}}}p \lt 0.1$
; ${{\rm{\;}}^{{\rm{**}}}}p \lt 0.05$
;
${{\rm{\;}}^{{\rm{**}}}}p \lt 0.05$
; ${{\rm{\;}}^{{\rm{***}}}}p \lt 0.01$
.
${{\rm{\;}}^{{\rm{***}}}}p \lt 0.01$
.
Take-up rate by price levels reference type.
Notes: Figure shows the intermediary service take-up rate for individuals in each of the price and reference treatment branches, corresponding to the model specified in Equation (5) consistent with estimates from Column (1) in Table 4. Dark lines capture the confidence interval for the take-up rate under a high price in the sample of online references (Panel A), on the sample of trusted references (Panel B) and of the effect of facing a high price on service take-up under a trusted reference (Panel C).
Discussion
While the estimates in Table A8 suggest that “market maker” considerations might be relatively prescient for late-stage undergraduate students, the overall findings from our work are not consistent with that perspective. While mostly insignificant, the majority of our estimates on the effects of corruption suggestions on the demand and the price elasticity of demand for intermediary services are negative. Most importantly, Table 3 shows a positive estimate of the effect of a trusted reference on demand for intermediary services in the absence of corruption suggestions, which is absent whenever intermediaries signal an illicit connection to the bureaucracy. These results are consistent with the view that advertising illicit connections undermines intermediaries’ trustworthiness in the eyes of clients to the point of reversing the credibility gains that come from being referred by a trusted individual. This interpretation would indeed make sense if clients perceived that revealing such connections meant a higher chance of either scam or entrapment. This may be the case for younger students for whom the hypothesized situation is not as prescient to their current situation and might prioritize safety.
However, if this were the case, we would expect that gestores would not reveal the existence of connections to the bureaucracy when advertising their services privately to the clients – something we believe to be the norm in the Venezuelan market for intermediaries. While it is entirely possible that inconclusive findings are driven by the absence of “market maker” considerations – or by them being conflated with “moral costs” considerations – they may also be driven by specific aspects of our empirical setting and our research design.
A key concern about experimental surveys leveraging hypothetical scenarios is that results may be driven by the inattention of participants. However, we believe that this is not the main driver of our results, as we find strong evidence that higher prices reduce the demand for gestores.Footnote 23 An alternative experimental design would consider mechanisms to elicit actual interest in procuring intermediary services as an outcome once participants have been exposed to their respective treatment branches.
Similarly, the experimental design may not have adequately conveyed the difference in the presence of corruption between the treatment and control groups. Chiefly, if most participants assume that intermediaries operate through illicit connections to the bureaucracy, then affirming such connections in the treatment scripts may not add information with respect to control scripts without any such explicit statements.Footnote 24 An alternative experimental design would explicitly mention the absence of illicit connections to the bureaucracy in the script for participants in the control group.
Finally, we chose the case of apostille certifications of professional degrees because it should have been salient for higher education students considering the possibility of migrating, which is a relevant consideration for young Venezuelans. Nevertheless, participants (especially at earlier stages of their studies) may have not been aware of the importance of such certifications at the time of the survey, leaving room for ambiguities in the interpretation of the treatment. An alternative experimental design would set up the hypothetical situation around the need to obtain a passport, which faces similar supply constraints and is equally necessary in order to migrate.
Conclusions
The purpose of this study was to determine how intermediaries’ transparency regarding the existence of illicit connections to the bureaucracy, and referral from a trusted reference, affected clients’ demand for their services. This question is important for understanding how intermediaries may affect corruption. If citizens value their services because they provide these connections, transparency should increase demand. On the contrary, if citizens value intermediation services because they allow them to remain detached from (and potentially unaware of) illicit connections to bureaucracy, then transparency should decrease the demand for intermediaries. Similarly, detecting the effects of trusted references on demand can provide experimental evidence about the diffusion and growth of corruption-enabling technologies.
We addressed this question by building on an experimental survey that studied the demand for gestores in the procurement of apostille certifications of professional degrees. We surveyed undergraduate students in Caracas, Venezuela – an ideal setting to tackle questions about the demand for intermediary services. While our findings are inconclusive on whether “market maker” or “moral cost” considerations regarding information about illicit connections to the bureaucracy dominate participants’ procurement decisions, we find that trusted references to intermediaries make the demand for their services become price inelastic. Finally, we highlight a number of potential revisions to our experimental design for future research on this topic.
This study contributes to the literature by providing experimental evidence on the determinants of demand for intermediaries – a consequential mechanism for bureaucratic corruption in the developing world. We observe citizens in a highly corrupt environment conditioning their choices about how to engage with the bureaucracy based on intermediary market characteristics. To the degree that such reactions are determined by inefficiencies in accessing bureaucratic services directly, our approach offers a window to citizens’ assessments of those inadequacies.
Replication materials
The data, code, and any additional materials required to replicate all analyses in this article are available in the Journal of Experimental Political Science Dataverse within the Harvard Dataverse Network, at doi:https://doi.org/10.7910/DVN/HQ67I9 (Ibarra Luces and Morales-Arilla, Reference Ibarra Luces and Morales-Arilla2024).
Acknowledgements
We are grateful to Omar Zambrano, Horacio Larreguy, Danila Serra, Ricardo Hausmann, and Douglas Barrios, Participants from Harvard’s Growth Lab Seminar and Texas A&M’s Bush School’s Quant Bag Seminar for valuable comments and suggestions. All errors are our own.
Competing interests
The authors report no relevant conflicts of interest with regard to this manuscript.
Ethics statement
This research project was qualified as exempt from additional IRB review by Harvard’s Human Research Protection Program (Protocol IRB22-0940). Moreover, this project adheres to APSA’s Principles and Guidance for Human Subjects Research. The experimental design does not use deception or potential harm, and participants were provided with a consent form at the beginning of the survey. Participants were not debriefed after completing the survey to minimize the possibility that the purpose of the experimental survey became known to later participants. Participants did not receive compensation for their participation.
Appendix
Diagram of treatment protocol.
Notes: Diagram shows the timing of the release of the survey and period of data collection, along with the protocol of information gathering for groups assigned to different treatment branches along the corruption suggestion dimension.

Script of conversation with gestor and treatment randomization.
Notes: Table shows each variable of interest in the experiment with their corresponding randomization alternatives. The first column corresponds to each treatment variable included in the script of the conversation with the gestor; the second column displays the possible randomization alternatives, with the first option for each variable being the treatment and the second option being the control; and the third column corresponds to the percentage of participants assigned to treatment for each of the variables of interest.
Heterogeneity in the effect of corruption suggestions in career stage – Qualtrics’ Quality Filter Sample.
Notes: Figure shows the intermediary service take-up rate for individuals in each of the corruption treatment branch and the career stage of the participants, following the model specified in Equation (4) consistent with estimates from Column (1) in Table A8. Dark lines capture the confidence interval for the take-up rate late-career participants in the sample of no corruption suggestion (Panel A), on the sample of corruption suggestion (Panel B) and of the effect of a corruption suggestion in the sample late-stage participants (Panel C).
Randomized treatment branches
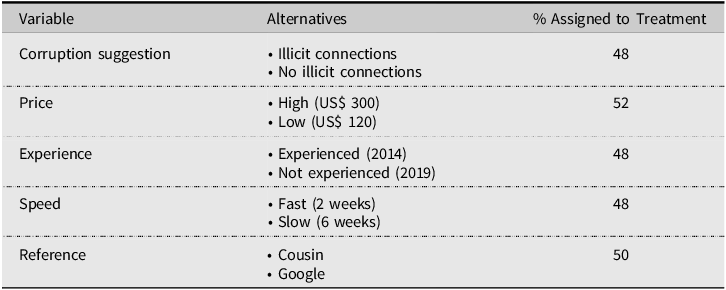
Notes: Table shows the specifics of each independent random treatment assigned in each participant’s script.
Summary statistics
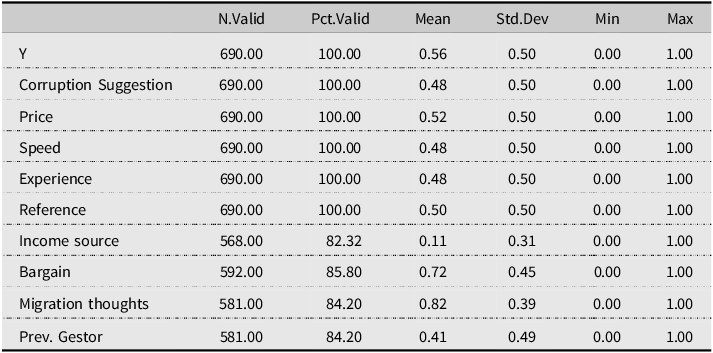
Notes: Table shows summary statistics for variables associated with the first two survey sections (treatment branches, take-up decision, answers to additional questions). $Y$
stands for the binary decision to either take the gestor services or not.
$Y$
stands for the binary decision to either take the gestor services or not.
Balance tests
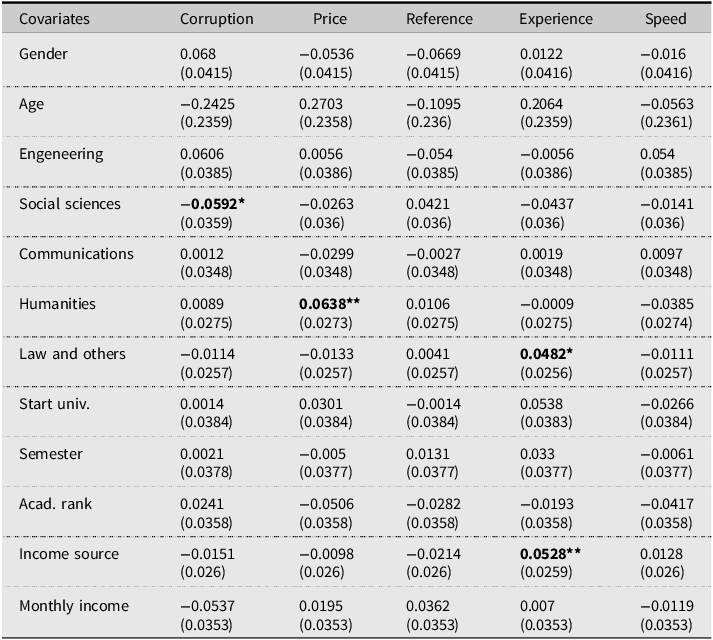
Notes: Table shows the estimates of ${\beta _1}$
in performing the regression specification
${\beta _1}$
in performing the regression specification ${X_i} = {\beta _0} + {\beta _1}Treatmen{t_i} + {\varepsilon _i}$
for all treatment branches as independent variables and each of the sociodemographic co-variates of the study, measures of inattention and Qualtrics’ data quality measurement as dependent variables. Heteroskedasticity robust standard errors provided.
${X_i} = {\beta _0} + {\beta _1}Treatmen{t_i} + {\varepsilon _i}$
for all treatment branches as independent variables and each of the sociodemographic co-variates of the study, measures of inattention and Qualtrics’ data quality measurement as dependent variables. Heteroskedasticity robust standard errors provided. ${{\rm{\;}}^{\rm{*}}}p \lt 0.1$
;
${{\rm{\;}}^{\rm{*}}}p \lt 0.1$
; ${{\rm{\;}}^{{\rm{**}}}}p \lt 0.05$
;
${{\rm{\;}}^{{\rm{**}}}}p \lt 0.05$
; ${{\rm{\;}}^{{\rm{***}}}}p \lt 0.01$
.
${{\rm{\;}}^{{\rm{***}}}}p \lt 0.01$
.
Attrition analysis
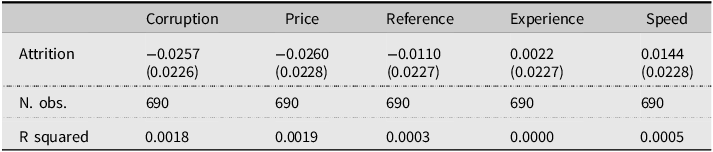
Notes: Table shows the estimates of ${\beta _1}$
in performing the regression specification
${\beta _1}$
in performing the regression specification ${A_i} = {\beta _0} + {\beta _1}Treatmen{t_i} + {\varepsilon _i}$
for all treatment branches as independent variables, where
${A_i} = {\beta _0} + {\beta _1}Treatmen{t_i} + {\varepsilon _i}$
for all treatment branches as independent variables, where ${A_i}$
is a binary marker for whether the survey was not completed after being assigned to a treatment branch. Heteroskedasticity robust standard errors provided.
${A_i}$
is a binary marker for whether the survey was not completed after being assigned to a treatment branch. Heteroskedasticity robust standard errors provided. ${{\rm{\;}}^{\rm{*}}}p \lt 0.1$
;
${{\rm{\;}}^{\rm{*}}}p \lt 0.1$
; ${{\rm{\;}}^{{\rm{**}}}}p \lt 0.05$
;
${{\rm{\;}}^{{\rm{**}}}}p \lt 0.05$
; ${{\rm{\;}}^{{\rm{***}}}}p \lt 0.01$
.
${{\rm{\;}}^{{\rm{***}}}}p \lt 0.01$
.
Effect of corruption suggestions on take-up – Qualtrics’ Quality Filter Sample
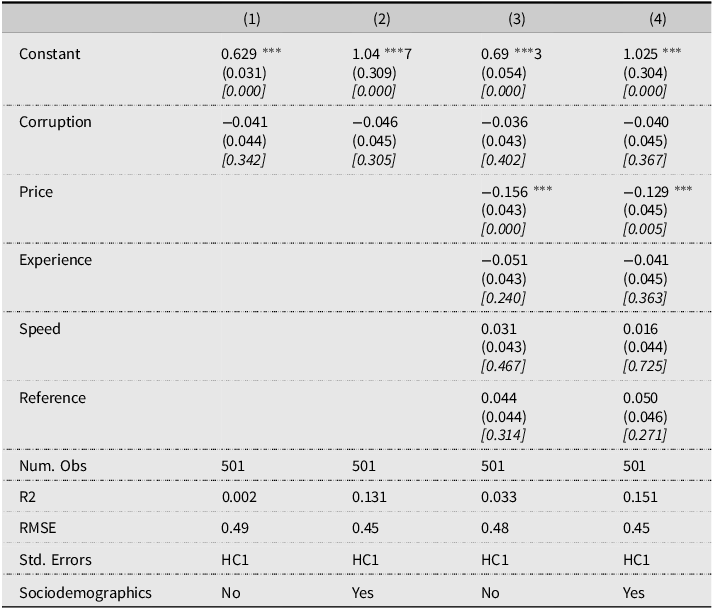
Notes: Table shows estimates for ${\beta _1}$
in Equation (1). Column (1) provides the simplest specification described in Equation (1). Column (2) adds sociodemographic covariates. Column (3) controls for other treatment branches. Finally, Column (4) controls for both covariates and other treatments. Heteroskedasticity robust standard errors provided. For the estimation of all regressions, we used the data that met the Qualtrics quality standards. Standard errors are specified in parentheses and exact p-values are reported between brackets.
${\beta _1}$
in Equation (1). Column (1) provides the simplest specification described in Equation (1). Column (2) adds sociodemographic covariates. Column (3) controls for other treatment branches. Finally, Column (4) controls for both covariates and other treatments. Heteroskedasticity robust standard errors provided. For the estimation of all regressions, we used the data that met the Qualtrics quality standards. Standard errors are specified in parentheses and exact p-values are reported between brackets. ${{\rm{\;}}^{\rm{*}}}p \lt 0.1$
;
${{\rm{\;}}^{\rm{*}}}p \lt 0.1$
; ${{\rm{\;}}^{{\rm{**}}}}p \lt 0.05$
;
${{\rm{\;}}^{{\rm{**}}}}p \lt 0.05$
; ${{\rm{\;}}^{{\rm{***}}}}p \lt 0.01$
.
${{\rm{\;}}^{{\rm{***}}}}p \lt 0.01$
.
Effect of corruption suggestions on price elasticity – Qualtrics’ Quality Filter Sample
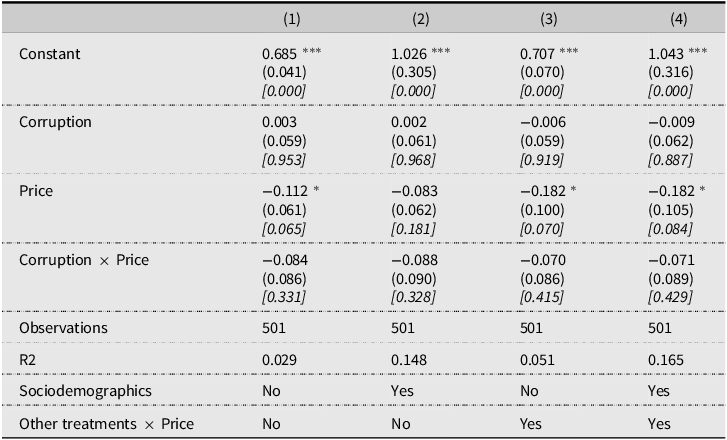
Notes: Table shows estimates for ${\beta _1}$
,
${\beta _1}$
, ${\beta _2},$
and
${\beta _2},$
and ${\beta _3}$
in Equation (2). Column (1) provides the simplest specification described in Equation (2). Column (2) adds sociodemographic covariates. Column (3) controls for other treatment branches. Finally, Column (4) controls for both covariates and other treatments. Heteroskedasticity robust standard errors provided. For the estimation of all regressions, we used the data that met the Qualtrics quality standards. Standard errors are specified in parentheses and exact p-values are reported between brackets.
${\beta _3}$
in Equation (2). Column (1) provides the simplest specification described in Equation (2). Column (2) adds sociodemographic covariates. Column (3) controls for other treatment branches. Finally, Column (4) controls for both covariates and other treatments. Heteroskedasticity robust standard errors provided. For the estimation of all regressions, we used the data that met the Qualtrics quality standards. Standard errors are specified in parentheses and exact p-values are reported between brackets. ${{\rm{\;}}^{\rm{*}}}p \lt 0.1$
;
${{\rm{\;}}^{\rm{*}}}p \lt 0.1$
; ${{\rm{\;}}^{{\rm{**}}}}p \lt 0.05$
;
${{\rm{\;}}^{{\rm{**}}}}p \lt 0.05$
; ${{\rm{\;}}^{{\rm{***}}}}p \lt 0.01$
.
${{\rm{\;}}^{{\rm{***}}}}p \lt 0.01$
.
Effect of corruption suggestions and trusted references - Qualtrics’ Quality Filter Sample
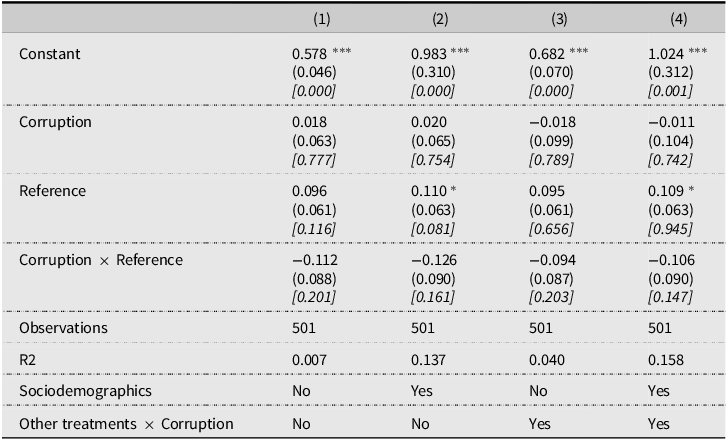
Notes: Table shows estimates for ${\beta _1}$
,
${\beta _1}$
, ${\beta _2},$
and
${\beta _2},$
and ${\beta _3}$
in Equation (3). Column (1) provides the simplest specification described in Equation (3). Column (2) adds sociodemographic covariates. Column (3) controls for other treatment branches. Finally, Column (4) controls for both covariates and other treatments. Heteroskedasticity robust standard errors provided. For the estimation of all regressions, we used the data that met the Qualtrics quality standards. Standard errors are specified in parentheses and exact p-values are reported between brackets.
${\beta _3}$
in Equation (3). Column (1) provides the simplest specification described in Equation (3). Column (2) adds sociodemographic covariates. Column (3) controls for other treatment branches. Finally, Column (4) controls for both covariates and other treatments. Heteroskedasticity robust standard errors provided. For the estimation of all regressions, we used the data that met the Qualtrics quality standards. Standard errors are specified in parentheses and exact p-values are reported between brackets. ${{\rm{\;}}^{\rm{*}}}p \lt 0.1$
;
${{\rm{\;}}^{\rm{*}}}p \lt 0.1$
; ${{\rm{\;}}^{{\rm{**}}}}p \lt 0.05$
;
${{\rm{\;}}^{{\rm{**}}}}p \lt 0.05$
; ${{\rm{\;}}^{{\rm{***}}}}p \lt 0.01.$
Heterogeneity in the effect of corruption suggestions in career stage - Qualtrics’ Quality Filter Sample
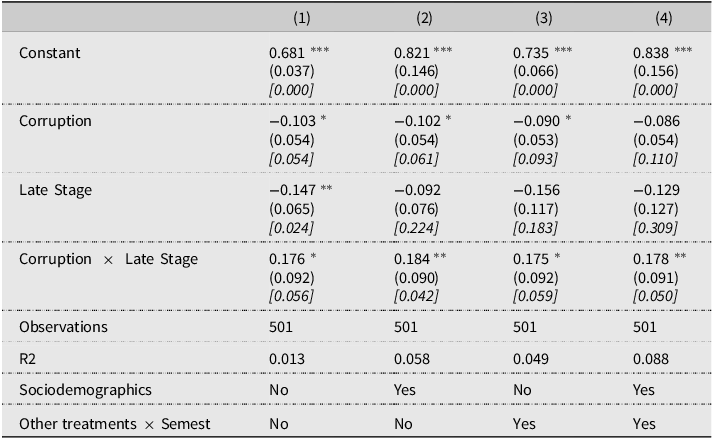
Notes: Table shows estimates for ${\beta _1}$
,
${\beta _1}$
, ${\beta _2},$
and
${\beta _2},$
and ${\beta _3}$
in Equation (4). Column (1) provides the simplest specification described in Equation (4). Column (2) adds sociodemographic covariates. Column (3) controls for other treatment branches. Finally, Column (4) controls for both covariates and other treatments. Heteroskedasticity robust standard errors provided. For the estimation of all regressions, we used the data that met the Qualtrics quality standards. Standard errors are specified in parentheses and exact p-values are reported between brackets.
${\beta _3}$
in Equation (4). Column (1) provides the simplest specification described in Equation (4). Column (2) adds sociodemographic covariates. Column (3) controls for other treatment branches. Finally, Column (4) controls for both covariates and other treatments. Heteroskedasticity robust standard errors provided. For the estimation of all regressions, we used the data that met the Qualtrics quality standards. Standard errors are specified in parentheses and exact p-values are reported between brackets. ${{\rm{\;}}^{\rm{*}}}p \lt 0.1$
;
${{\rm{\;}}^{\rm{*}}}p \lt 0.1$
; ${{\rm{\;}}^{{\rm{**}}}}p \lt 0.05$
;
${{\rm{\;}}^{{\rm{**}}}}p \lt 0.05$
; ${{\rm{\;}}^{{\rm{***}}}}p \lt 0.01$
.
${{\rm{\;}}^{{\rm{***}}}}p \lt 0.01$
.
Demand price elasticity and intermediaries referred by trusted individuals - Qualtrics’ Quality Filter Sample

Notes: Table shows estimates for ${\beta _1}$
,
${\beta _1}$
, ${\beta _2},$
and
${\beta _2},$
and ${\beta _3}$
in Equation (5). Column (1) provides the simplest specification described in Equation (5). Column (2) adds sociodemographic covariates. Column (3) controls for other treatment branches. Finally, Column (4) controls for both covariates and other treatments. Heteroskedasticity robust standard errors provided. For the estimation of all regressions, we used the data that met the Qualtrics quality standards. Standard errors are specified in parentheses and exact p-values are reported between brackets.
${\beta _3}$
in Equation (5). Column (1) provides the simplest specification described in Equation (5). Column (2) adds sociodemographic covariates. Column (3) controls for other treatment branches. Finally, Column (4) controls for both covariates and other treatments. Heteroskedasticity robust standard errors provided. For the estimation of all regressions, we used the data that met the Qualtrics quality standards. Standard errors are specified in parentheses and exact p-values are reported between brackets. ${{\rm{\;}}^{\rm{*}}}p \lt 0.1$
;
${{\rm{\;}}^{\rm{*}}}p \lt 0.1$
; ${{\rm{\;}}^{{\rm{**}}}}p \lt 0.05$
;
${{\rm{\;}}^{{\rm{**}}}}p \lt 0.05$
; ${{\rm{\;}}^{{\rm{***}}}}p \lt 0.01.$


 Open access

