





Introduction
Weeds are prevalent pests in container nursery crop production, increasing management costs and reducing the crop’s marketability (Case et al. Reference Case, Mathers and Senesac2005). To prevent losses from weed competition, growers routinely apply preemergence herbicides every 6 to 8 wk, but weeds continue to emerge (Gilliam et al. Reference Gilliam, Foster, Adrain and Shumack1990; Neal et al. Reference Neal, Derr, Marble and Senesac2017). In these crops, postemergence control options are limited, necessitating substantial reliance on hand weeding (Neal et al. Reference Neal, Derr, Marble and Senesac2017; Stewart et al. Reference Stewart, Marble and Pearson2017). Annual costs for hand weeding were estimated in 2003 to be as much as $9,800 ha−1 (Mathers Reference Mathers2003). According to a 2023 industry survey, 59% of growers reported that labor costs and availability are their greatest business concerns (McClellan Reference McClellan2024). Identifying and understanding the sources of weed seed contamination and spread could allow growers to implement effective prevention strategies and lessen weed management costs.
Limited research has been conducted to identify weed seed sources in container nurseries. The most recognized weed seed sources include contaminated transplants, weed seeds carried over to new crops in unwashed and reused containers, and dispersal from nearby plants (Bachman and Whitwell Reference Bachman and Whitwell1995; Cross & Skroch, Reference Cross and Skroch1992; Neal Reference Neal2016). Soilless potting substrates are usually free of weed seeds (Cross & Skroch, Reference Cross and Skroch1992) but can be contaminated if weeds are allowed to shed seeds near substrate storage areas. Each of these seed sources can be managed with available strategies and tools, but weeds continue to emerge in containers. While nursery crop producers perceive overhead irrigation systems as a potential vector for weed seed dispersal (authors’ personal communications with growers), little is known of the importance of surface irrigation ponds as a weed seed source in container nurseries.
Water use by nurseries in the United States in 2013 was estimated to be about 775 million kL on 212,147 ha of crops (Paudel et al. Reference Paudel, Pandit and Hinson2016). About 59% of nursery businesses reported using overhead irrigation systems, and 37% reported sourcing irrigation water from open ponds and recaptured water. In the southeastern United States the proportion of growers who use surface ponds and recaptured water is greater than the national average, with 75% of growers reporting using recaptured water (Fain et al. Reference Fain, Gilliam, Tilt, Olive and Wallace2000). While the volume of water applied each day is variable, a frequently used standard for the region is 1.9 cm d−1, equivalent to about 187,000 L ha−1 d−1 (i.e., 20,000 gallons per acre per day) of overhead irrigation (Fare et al. Reference Fare, Gilliam and Keever1992; Fernandez et al. Reference Fernandez, Pershey and Andresen2019; Warsaw et al. Reference Warsaw, Fernandez, Cregg and Andresen2009).
Prior research has shown that surface irrigation water can contain viable weed seeds. When screening open irrigation ditches and waterways in the Pacific Northwest, Kelley and Bruns (Reference Kelley and Bruns1975) found seeds of 130 species and an average of 1,065 seeds in a 254,000-L sample of water. In contrast, Williams and Sanders (Reference Williams and Sanders1984) reported only three seeds in 18,900 L of water from creeks and holding ponds in five nurseries. Extrapolating figures from the reports by both Williams and Sanders (Reference Williams and Sanders1984) and Kelly and Bruns (Reference Kelley and Bruns1975), we would predict that 1.9 cm of irrigation could deliver 30 to 783 weed seeds ha−1 daily.
In natural riparian systems and other agricultural systems, water has been reported to be an important vector of weed seed dissemination (Merrit and Wohl Reference Merrit and Wohl2006; Zhang et al. Reference Zhang, Li, Wang, Valverde and Qiang2019). The most prevalent weeds in these systems have highly buoyant seeds that are more effectively transported in water and deposited into source water through runoff (Li and Quang Reference Li and Qiang2009; Merrit and Wohl Reference Merrit and Wohl2006; Shi et al. Reference Shi, Li, Zhang and Qiang2020). Seeds of several container nursery weeds, including eclipta, common groundsel (Senecio vulgaris L.), marsh yellowcress, and rice flatsedge (Cyperus iria L.), are buoyant (Ray et al. Reference Ray, LeBude, Altland, Harlow and Neal2026). Additionally, seeds of several common nursery weeds, including eclipta, flexuous bittercress, and spotted spurge, germinated after being submerged in irrigation ponds for 1 yr (Ray et al. Reference Ray, LeBude, Altland, Harlow and Neal2026). Considering that seeds of several common container nursery weed species are buoyant and long-lived in water, it is plausible that viable seeds could reach irrigation intakes and be disseminated throughout production areas. Therefore, this experiment was conducted to document the number and species diversity of germinable weed seeds in irrigation water drawn from surface ponds and to evaluate the significance of irrigation water as a source of weed seed contamination in container nurseries.
Materials and Methods
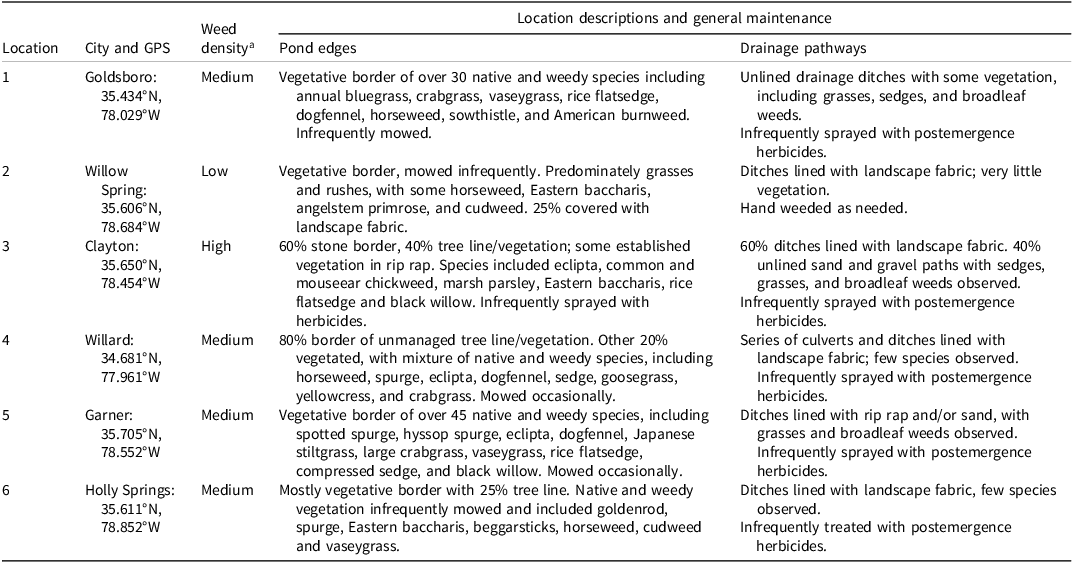
The presence and diversity of viable weed seeds in irrigation water were determined by conducting tests over two consecutive years at six commercial container nurseries located in central and southeastern North Carolina. The nurseries were selected to represent a range of historical weed population densities (based on author J.C. Neal’s personal observations), as well as practical accessibility to the irrigation ponds (Table 1). At all locations, irrigation runoff was returned to the irrigation pond via a series of culverts or drainage ditches. Pond edge characteristics varied, encompassing stone, managed vegetation, and unmanaged natural vegetation. Vegetation at the pond edges, including common nursery weeds, was documented. Detailed descriptions of pond surroundings, drainage ditches, and maintenance practices for each location are provided in Table 1.
Locations of the six nurseries in North Carolina where research was conducted. a

Table 1. Long description
The table presents data on weed density, location descriptions, and general maintenance practices at six nurseries in North Carolina. It includes six rows and four columns. The columns are labeled Location, Weed density, Pond edges, and Drainage pathways. Each row provides details for a specific nursery, including city and GPS coordinates, weed density classification, descriptions of pond edges with specific vegetation, and maintenance practices for drainage pathways. Notable trends include varying weed densities and different maintenance practices across the nurseries.
a Location descriptions include historic weed population densities and descriptions and maintenance practices for pond edges and drainage pathways. Ranking of historical weed population densities. Weed population rankings were entirely subjective and based on the principal investigator’s 20+ years of observing these locations. The low population nursery had very few weeds in crops or non-crop areas due to intensive management. The high population nursery removed weeds only prior to herbicide reapplication or plant shipment, allowing many weeds to mature. Medium density nurseries maintained weed management practices that reduced weed populations in crops and non-crop areas, but weeds were not uniformly controlled before reproductive maturity, ensuring some secondary spread.
Water Filtration and Sample Collection
Weed seeds in irrigation pond water were collected using a custom-built water filtration system mounted on a trailer for transportation. A gas-powered water pump (Honda GX240 engine; American Honda Motor Company, Torrance, CA) with an IPT 3P9XHR pump (Gorman-Rupp, Royersford, PA) drew water through a 4.6-m-long, 7.6-cm-diam spiral wire hydraulic hose with a cylindrical strainer basket that excluded anything greater than 1.3 cm diam. The intake strainer was positioned close to and at the same 60-cm depth as the nursery irrigation intakes and held in place with an attached anchor and buoy. Water was pumped through 130-µm disc filters (LP Disc-Kleen; Netafim USA, Fresno, CA), then the filtered water was discharged via a 7.6-m-long, 7.6-cm-diam lay-flat polyvinylchloride hose placed as far from the intake hose as possible to minimize water disturbance near the intake. A back-flow flush was manually engaged at 75,708-L (20,000 gallons) intervals, equal to the volume of water delivered in 1.9 cm 0.405 ha−1 (0.75 acre-inch). Back-flow water containing filtrates was then screened through a 1,700-µm mesh sieve (Avantech Manufacturing, Mentor, OH) to remove large particulates, and weed seeds were collected in 355-µm mesh sieves, a mesh opening smaller than the ∼1,000-µm diameter of most common nursery weed seeds (Neal et al. Reference Neal, Uva, DiTomaso and DiTommaso2023).
Six 75,708-L samples were filtered at each location in spring, summer, and late summer for 2 yr. In total, more than 15 million L of water were filtered, and 216 filtrate samples (2 years × 6 locations × 3 seasons × 6 samples) were collected. The filtration system was flushed between each sample collection to ensure there was no seed contamination from previous samples. Each 75,708-L sample required more than 2 h to filter, necessitating 2 d to collect six irrigation filtrate samples. Samples collected on the first day were designated A, B, and C; the second day samples were D, E, and F. The exact volume of water filtered with each sample was recorded. Each filtrate sample was placed in a 150-µm mesh nylon bag, labeled, and transported to the North Carolina State University Horticultural Field Laboratory in Raleigh (35.79159°N, 78.69389°W). Filtrate samples were spread onto the surfaces of 28- by 53-cm plastic trays (T.O. Plastics, Clearwater, MN) filled with bagged potting mix containing a proprietary blend of peat moss, pine bark fines, coarse perlite plus vermiculate (Jolly Gardener Pro-Line C/P growing mix; Oldcastle Lawn & Garden, Atlanta, GA), and amended with 3.6 kg m−3 of slow-release fertilizer (Harrell’s 18-4-8; Harell’s LLC, Sylacauga, AL), then hand-watered with municipal water. Trays were placed onto benches in a weed-free covered hoop house and irrigated daily with municipal water via an overhead irrigation system. To confirm weed-free conditions, control trays of potting mix with no irrigation filtrates were included with each germination test. No seedlings were observed in the control trays throughout the study. Bottom heat was provided as needed to maintain soil temperatures above 15 C, adequate for germination of common nursery weed species (Andersen Reference Andersen1968; Asgarpour et al. Reference Asgarpour, Ghorbani, Khajeh-Hosseini, Mohammadv and Chauhan2015; Holt Reference Holt1987). Trays were drenched with 0.14 g ai L−1 azoxystrobin (Heritage; Syngenta, Greensboro, NC) to minimize seedling losses due to disease. Emerged seedlings were counted weekly for 12 wk, identified to species, and removed after each count to ensure no seedling would be counted twice. Unidentifiable seedlings were transplanted into pots and grown to maturity for identification.
Actual irrigation sample volumes ranged from 75,708 L to 77,601 L. Seedling counts were adjusted to reflect the number of germinable seeds per 75,708 L−1 using Equation 1. These adjusted values were used in all statistical analyses. ${{{\rm{observed}}\;{\rm{germination}}} \over {\;{\rm{actual}}\;{\rm{volume}}}} = {{\;{\rm{germinable}}\;{\rm{seeds}}} \over {75,708\;{\rm{L}}}}$
We acknowledge that there could be some dormant weed seeds within the samples that could not be counted using the methods employed. However, seeds that did not germinate within 12 wk of placement in conditions suitable for germination would have a minimal effect on overall weed populations in the nursery. From this point forward we refer to the number of seedlings counted in germination tests as the number of germinable seeds in 75,708 L of irrigation, or 0.405 ha−1, of container-grown nursery crops in the southeastern United States.
Species recovered in filtrate samples varied across years and locations, making data analysis by species impractical. Therefore, seedling counts for all species were combined for analysis. Data were analyzed using a full factorial analysis of variance using the GLIMX procedure with SAS software (v.9.4; SAS Institute, Cary, NC), with year, season, and location as fixed effects and germinable seed count as a random effect. To allow more accurate comparisons of main effects, predicted means for the number of germinable seeds were used in all analyses. Means comparisons were performed using a Tukey HSD test at α = 0.05.
Weed Population Scouting
Crops were scouted for weed populations at each filtrate collection. A newly potted crop was selected within a production block irrigated by the collection pond. Due to labor constraints, individual weed counts were impractical. Instead, the number of containers infested with individual weed species was counted and converted to percent frequency. Pearson correlation coefficients between weed species frequencies in containers versus the number of seeds present in irrigation samples were calculated using JMP software (v.18; (SAS Institute). Correlation analyses using data for all species, including those with zero or very rare occurrences in both data sets, resulted in misleadingly high correlations for all comparisons. Therefore, correlation analyses were conducted using the 10 most abundant weed species present in each data set. Bivariate scatter plots of weeds in containers versus seeds in irrigation filtrates were generated using the Fit Y by X function in JMP software. The crops used in these studies were managed by the growers and received all standard management inputs including preemergence herbicide applications and hand weeding according to growers’ schedules. Despite efforts to coordinate weed frequency counts with growers, labor crews often removed weeds before our arrival. At three locations, these events were so frequent that it was not possible to obtain reliable estimates of weed population frequencies. Therefore, data from those three affected locations were omitted from correlation analyses.
Results and Discussion
Species Diversity
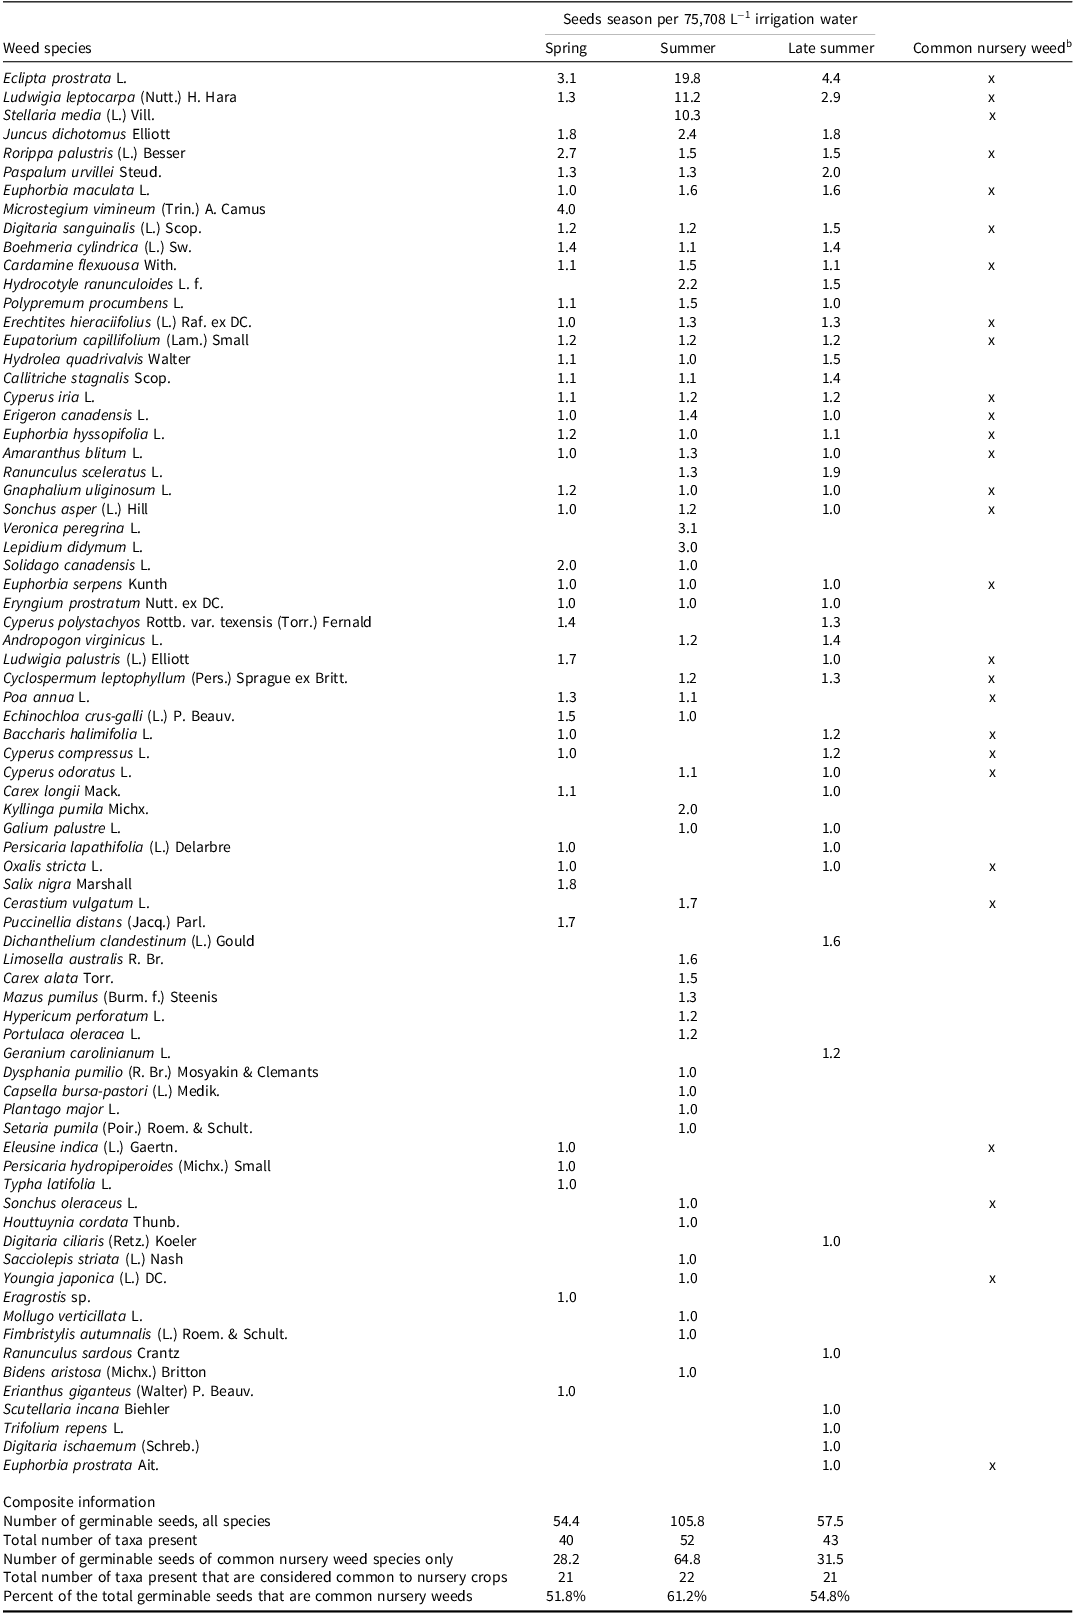
Germinable seeds were found in irrigation water samples in all locations, seasons, and years. A total of 75 taxa were present in the irrigation filtrates (Table 2), including 28 species known to be common weeds in container nurseries (Neal et al. Reference Neal, Uva, DiTomaso and DiTommaso2023; Neal and Derr Reference Neal and Derr2005). Among the 10 most abundant species, six are common weeds in container nurseries: eclipta, anglestem primrose-willow [Ludwigia leptocarpa (Nutt.) H. Hara], common chickweed [Stellaria media (L.) Vill.], marsh yellowcress, spotted spurge, and large crabgrass. Four of the 10 most abundant species, forked rush (Juncus dichotomus Elliot), vaseygrass (Paspalum urillei Steud.), Japanese stiltgrass [Microstegium vimineum (Trin.) A. Camus], and smallspike false nettle [Boehmeria cylindrica (L.) Sw.] have not been reported as weeds of container nurseries and were not observed during scouting of the crops at these study locations. Forked rush was present at the irrigation pond edge at one location; vaseygrass was observed on the banks of the ponds at three locations; Japanese stiltgrass was observed on the pond edge at one location and in high populations at the property border at another location; and smallspike false nettle was present at two locations (Table 1). The presence of Japanese stiltgrass in irrigation water supports previous reports of dispersal of this species by hydrochory (Eschtruth and Battles Reference Eschtruth and Battles2011; Tekiela and Barney Reference Tekiela and Barney2013). The absence of these four species in the scouted container crops suggests that nursery conditions or management practices may limit their establishment and survival within the crops.
Species in irrigation filtrate samples and the number of seeds per 75,708 L of irrigation in each sampling season. a

Table 2. Long description
The table presents data on weed species found in irrigation water samples, detailing the number of seeds per 75,708 liters across different seasons. It includes 75 taxa, with 28 species known to be common weeds in container nurseries. The table is organized into columns for Spring, Summer, Late Summer, and Common Nursery Weeds, with rows listing various weed species and their corresponding seed counts. Notable species include eclipta, anglestem primrose-willow, common chickweed, marsh yellowcress, spotted spurge, and large crabgrass, which are common weeds in container nurseries. Other species like forked rush, vaseygrass, Japanese stiltgrass, and smallspike false nettle are also present but not typically reported as weeds in container nurseries.
a The water sample size is equivalent to the recommended daily irrigation of 1.9 cm of irrigation on 0.405 ha. Species are listed in order of average abundance across seasons, from greatest to least.
b Species marked with an x have been reported to be common in container nurseries in the United States (Neal and Derr Reference Neal and Derr2005). Based on the authors’ experiences, Amaranthus blitum is also marked as common but is not present in Neal and Derr (Reference Neal and Derr2005) because it was relatively unknown in nurseries then.
Summer collections had the highest number of taxa, 52, while spring and late summer collections had 40 and 43 taxa, respectively (Table 2). Seasonal seed-shedding patterns were reflected in some species; for example, black willow (Salix nigra Marshall) seeds are shed in the spring (Neal et al. Reference Neal, Uva, DiTomaso and DiTommaso2023) and was present only in irrigation filtrates collected in the spring (Table 2). Other species were present in irrigation filtrates even when mature plants were not present in the nursery. Marsh yellowcress and low cudweed (Gnaphalium uliginosum L.), which shed seeds from spring to late summer, were present in irrigation samples from all seasons. Similarly, eclipta, horseweed, and spotted spurge seeds were present in irrigation samples from all seasons despite shedding seeds summer through autumn (Neal et al. Reference Neal, Uva, DiTomaso and DiTommaso2023). This suggests that seeds of some species can persist in irrigation water and remain available for intake into the irrigation system. In related studies, eclipta seeds maintained high germination after being submerged in irrigation ponds for 360 d and are highly buoyant (Ray et al. Reference Ray, LeBude, Altland, Harlow and Neal2026), traits that are reported to increase hydrochory (Shi et al. Reference Shi, Li, Zhang and Qiang2020).
Location and Seasonal Effects on Seed Numbers
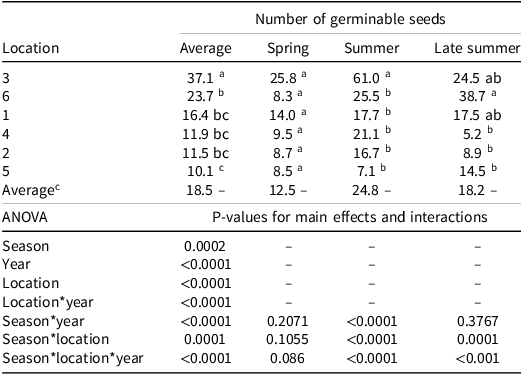
The species present in irrigation filtrates were highly variable among locations and seasons; thus, it was not possible to statistically compare seasonal or location differences at the species level. Therefore, total numbers of germinable seeds were compared. Germinable seeds were present in all filtrate samples, but the main effects of location, season, and year, as well as most two-way interactions, were statistically significant (Table 3).
Number of germinated seeds collected in 75,708 L of irrigation water by season and location, and results from analysis of variance for main effects and interactions.a,b

Table 3. Long description
The table presents the number of germinable seeds collected in 75,708 liters of irrigation water, categorized by season and location. It includes average values for spring, summer, and late summer across different locations. The table also provides results from an analysis of variance for main effects and interactions, with P-values indicating statistical significance. Notable trends include variations in seed counts across seasons and locations, with significant main effects observed for season, year, location, and their interactions.
a The water sample size is equivalent to the recommended daily irrigation of 1.9 cm of irrigation on 0.405 ha.
b Least squares means within columns followed by the same letter are not significantly different based on a Tukey-Kramer means comparison with α = 0.05.
c Averages of all data, not means of the averages from each location.
Averaged across seasons and years, the number of germinable seeds recovered from 75,708 L of irrigation ranged from 10.1 to 37.1 (Table 3). These results are consistent with previous findings by Williams and Sanders (Reference Williams and Sanders1984), who reported an equivalent of 12 seeds per 75,708 L−1 of irrigation. Scaling to a similar irrigation volume, Hope (Reference Hope1927) and Kelly and Bruns (Reference Kelley and Bruns1975) reported collecting 21,250 and 587 germinable seeds in 75,708 L−1, respectively. Higher seed numbers in those two trials may be related to different collection methods. In both tests, water flowing in irrigation ditches or over weirs was screened, and methods included collection of surface-floating weeds and debris. In contrast, our collections occurred with submerged intakes. Williams and Sanders (Reference Williams and Sanders1984) did not specify collection methods, but it is likely that the nursery sites used in their study would have submerged intakes.
There were no differences between locations in germinable seed numbers in spring and late summer collections, with numbers ranging from 8.3 to 25.8, and 5.2 to 38.7 seeds per 75,708 L−1, respectively (Table 3). Summer collections at Location 3 averaged 61 seeds per sample, significantly more than all other locations. The higher number of seeds present in summer samples, and the higher overall average number of seeds collected at Location 3, was associated with the increased presence of one species, eclipta, that occurred while collecting during a rain event.
Rain Effects on Seed Presence in Irrigation Samples
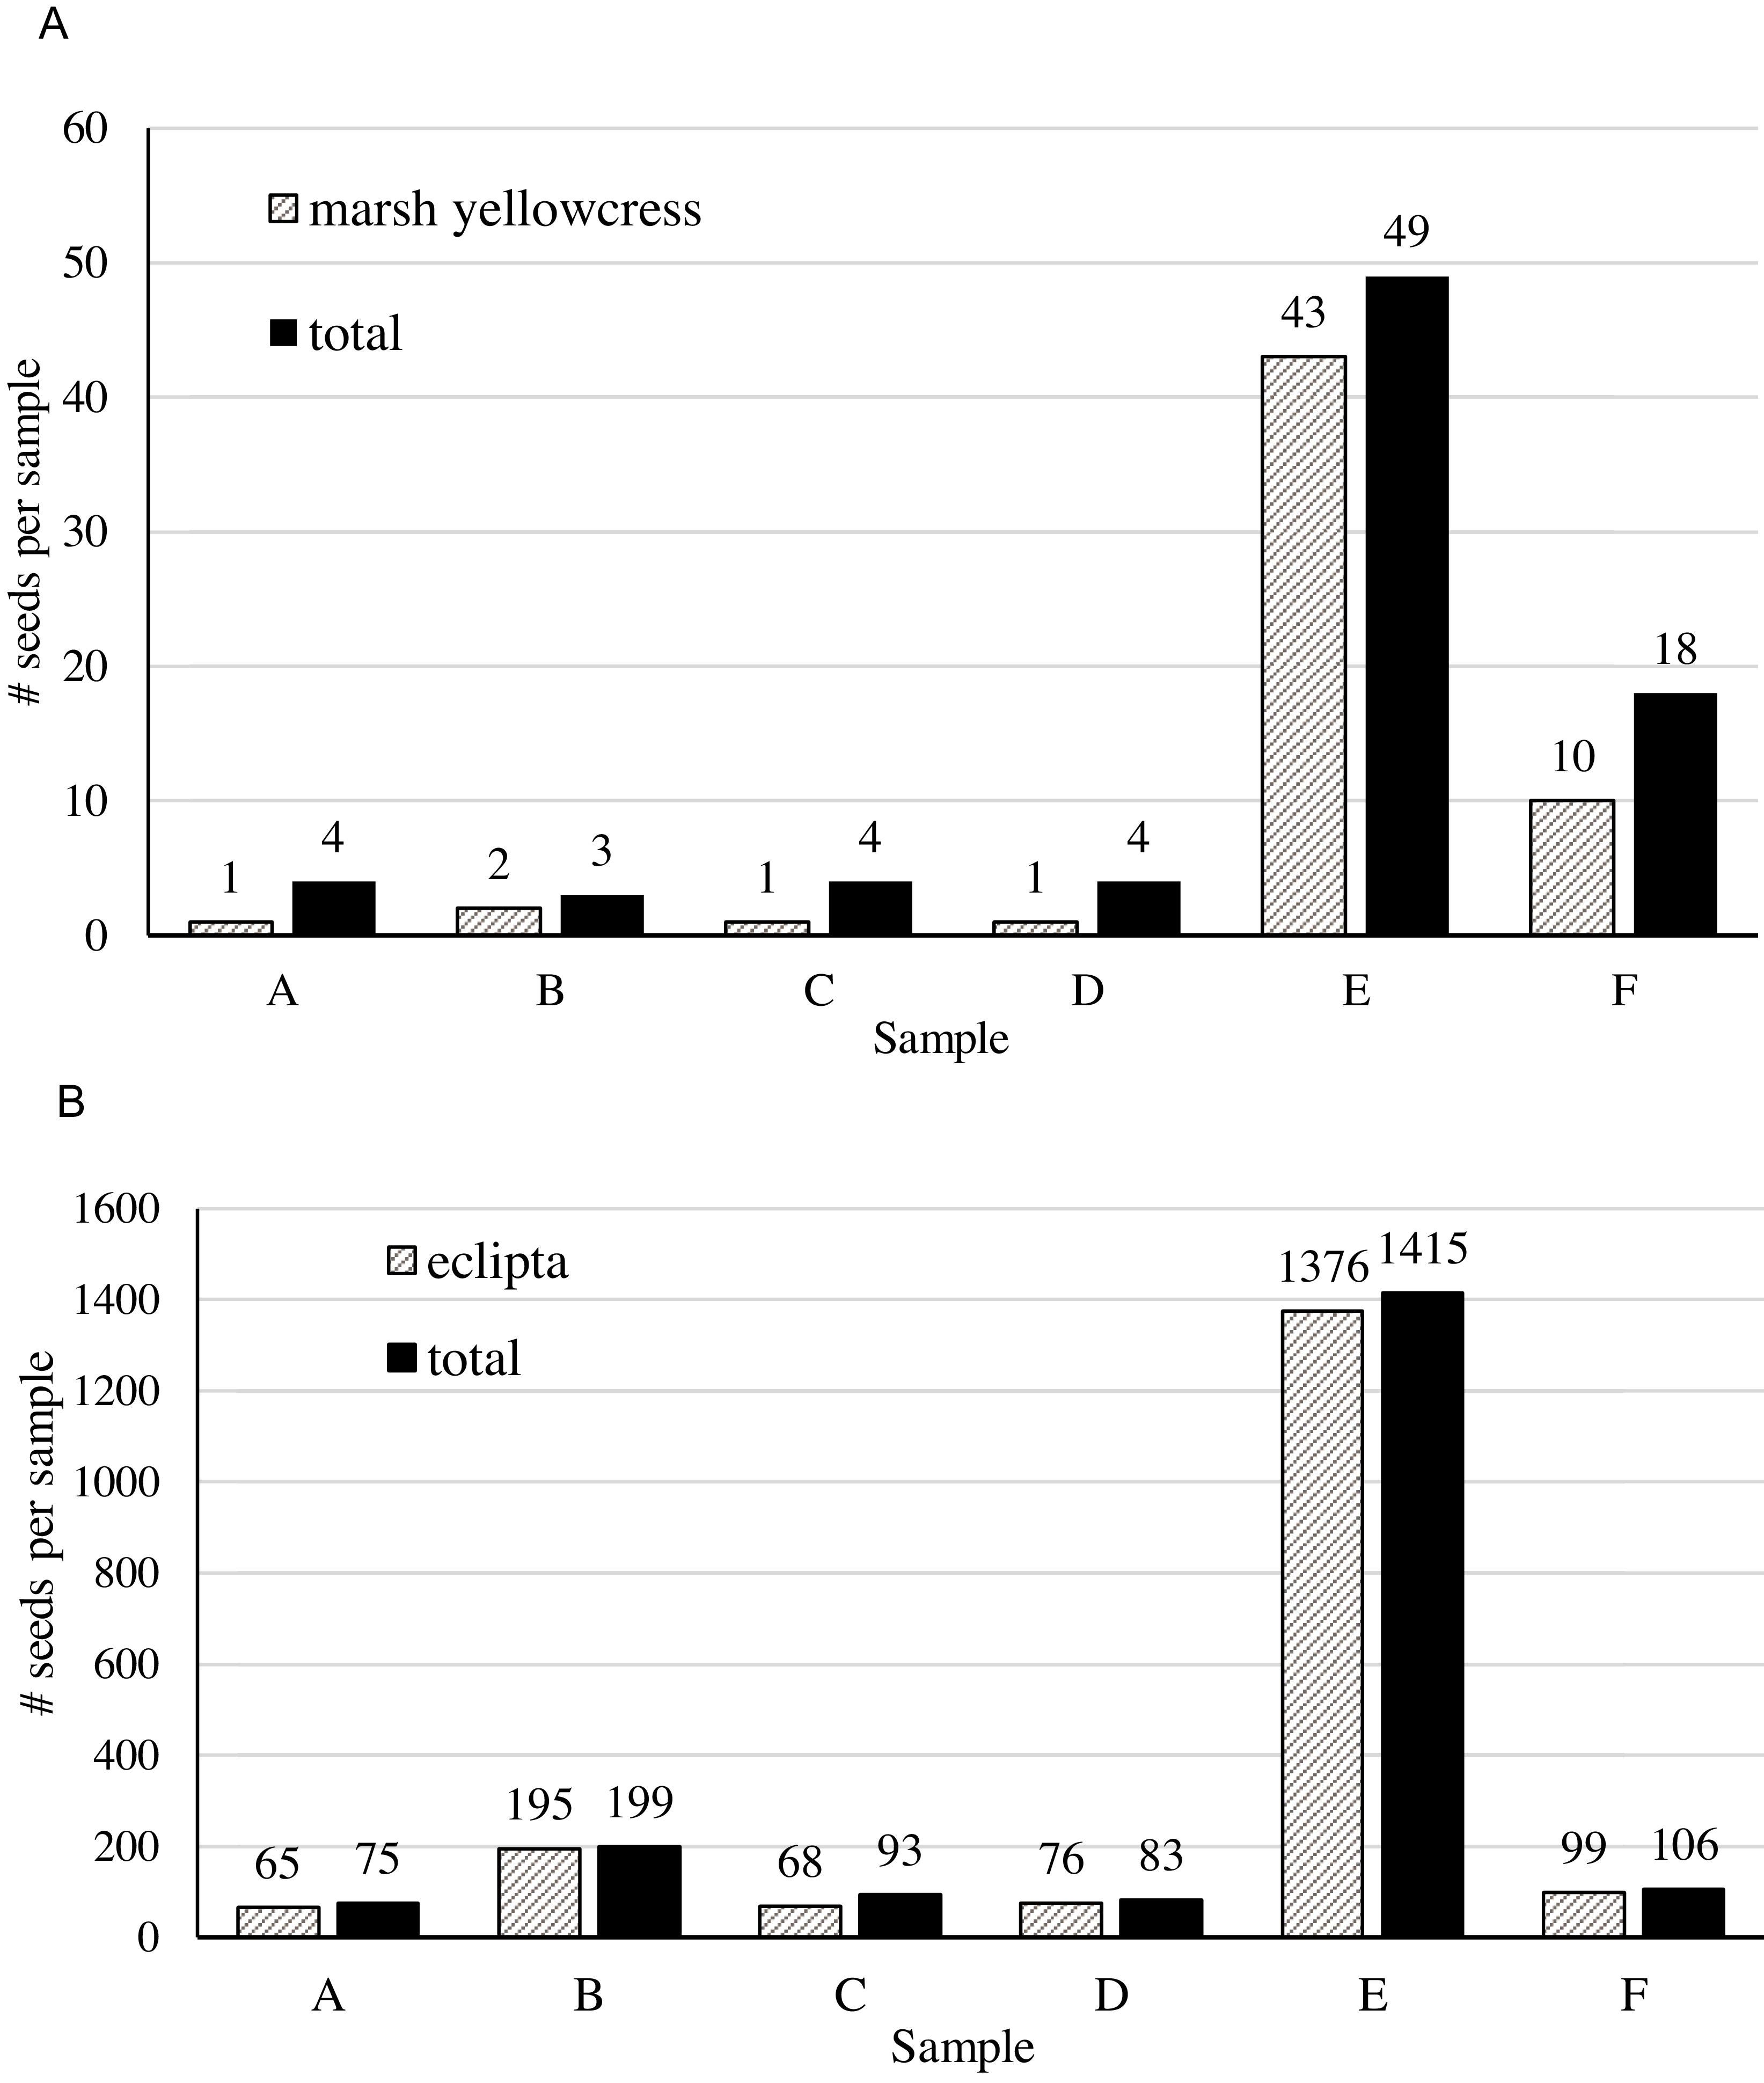
Rain occurred during two sample collections, each dramatically increasing weed seed collections (Figure 1, A and B). At Location 4, in the Year 1 spring collection, approximately 0.57 cm of rain fell in 2 h during the collection of Sample E. The number of seeds collected in filtrate samples increased from four seeds in Sample D, immediately before the rain, to 49 seeds during Sample E (Figure 1A). In the Year 2 summer collection at Location 3, 0.41 cm of rain fell in 1.5 h during the collection of Sample E. There were 83 germinable seeds in Sample D collected before the rain, 1,415 in Sample E during the rain, and 106 in Sample F immediately after the rain (Figure 1B). In each case, a single species accounted for more than 90% of the increase seed presence: marsh yellowcress at Location 4 and eclipta at Location 3. Both weed species have highly buoyant seeds (Ray et al. Reference Ray, LeBude, Altland, Harlow and Neal2026) and were present in water drainage areas near the ponds. Seeds with high levels of buoyancy are known to be more efficiently transported via hydrochory (Merrit & Wohl, Reference Merrit and Wohl2006; Shi et al. Reference Shi, Li, Zhang and Qiang2020). It is likely that rain transports buoyant seeds into irrigation ponds where they can be distributed via irrigation. It is also possible that rain could break the surface tension on the pond surface, mixing floating seeds into the water column where they are available for uptake by irrigation systems. Regardless, the effect of rain was short-lived, with seed counts returning to lower levels shortly after the rain ceased.
The number of germinable seeds in six 75,708-L irrigation samples, at two location-years when rainfall occurred during the collection of Sample E. Plot A = Year 1, spring at Location 4. Plot B = Year 2, summer at Location 3. Each sample represents the volume of irrigation for 1.9 cm of water on 0.406 ha. Rain events increased seed collections, and, in both cases, a single species accounted for 90% of the increase.

Figure 1. Long description
The bar graph compares the number of germinable seeds in six irrigation samples at two location-years. The x-axis represents the samples labeled A through F, while the y-axis indicates the number of seeds per sample. The graph includes two data series: one for marsh yellowcress and another for total seeds. Sample E shows the highest number of seeds, with 43 for marsh yellowcress and 49 total seeds. Sample F follows with 10 marsh yellowcress seeds and 18 total seeds. Other samples have significantly lower seed counts, with Sample A having 1 marsh yellowcress seed and 4 total seeds, Sample B with 2 marsh yellowcress seeds and 3 total seeds, Sample C with 1 marsh yellowcress seed and 4 total seeds, and Sample D with 1 marsh yellowcress seed and 4 total seeds. All values are approximated.
Weed Populations
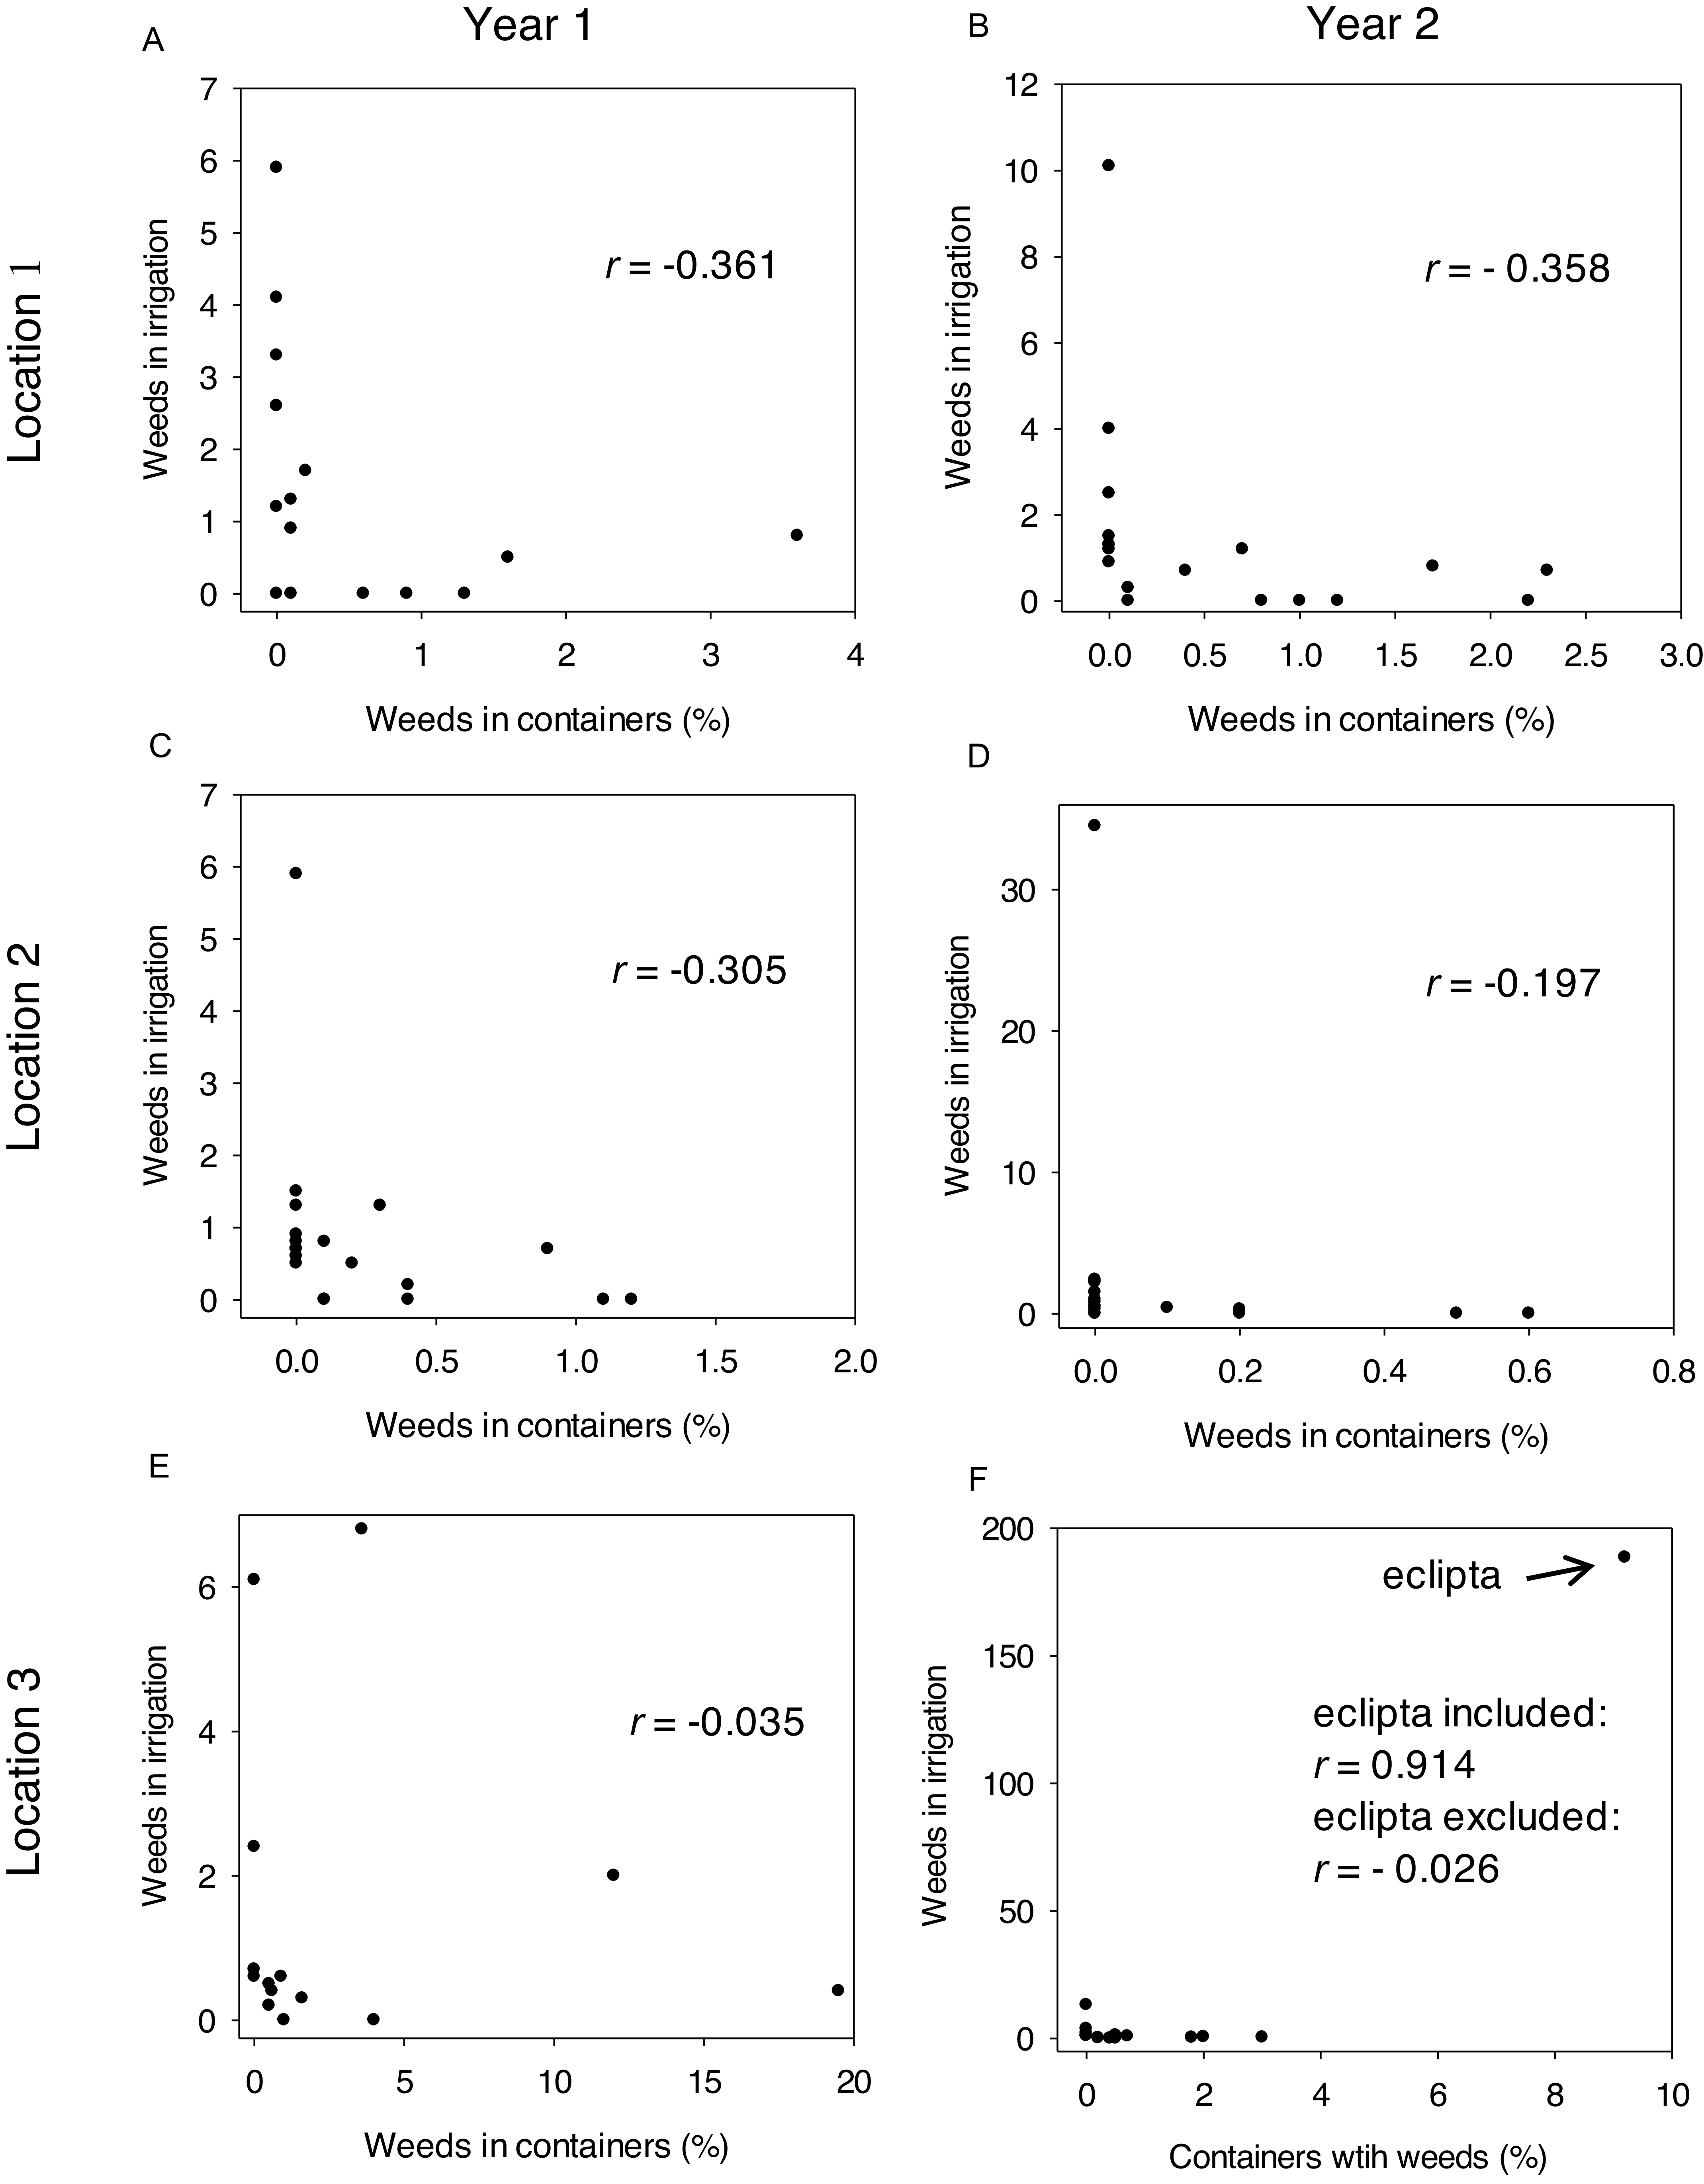
The three locations for which scouting data were collected exhibited varying weed populations, with the highest populations observed at Location 3 and the lowest at Location 2. This observation was consistent with the initial location selections to include those with low, moderate, and high weed populations. For five of the six weed scouting events included in this comparison, there was no significant correlation between weed species collected from irrigation water and those within crop containers (Figure 2). Pearson correlation coefficients ranged from −0.197 to −0.361 for Locations 1 and 2 and had insignificant P-values. These results suggest that seeds in irrigation water did not contribute substantially to weed populations in containers. However, at Location 3 in Year 2, a strong positive correlation (r = 0.914) (P < 0.0001) between weeds in irrigation filtrates and frequency of weeds in containers was observed. Removing eclipta from the data set reduced the correlation coefficient to −0.026 (P = 0.9023), demonstrating the disproportionate influence of this species on the correlation. This finding indicates that irrigation water may serve as a significant vector for certain weed species and that weed management programs should prioritize control of weed species with buoyant and persistent seeds, such as eclipta, near pond edges and drainage ditches.
Pearson correlations between the 10 most abundant weed species identified in container scouting (% frequency) and those found in irrigation samples (number of seeds per 75,708-L sample) at A) Location 1, Year 1; B) Location 1, Year 2; C) Location 2, Year 1; D) Location 2, Year 2; E) Location 3, Year 1; and F) Location 3, Year 2. The number of species shown varies across panels due to overlaps in species between containers and irrigation. For most locations and years, low Pearson correlation coefficient values (r-values) and species clustering along the axes indicate little or no relationship between dominant species in containers versus irrigation. However, due to high abundance of eclipta in both container and irrigation for Location 3, Year 2 (panel F), the two variables were highly correlated (r = 0.914). Excluding eclipta from the analysis reduced the correlation coefficient to −0.026, similar to r-values for the other locations and years.

Figure 2. Long description
A scatter plot showing the relationship between weeds in containers and weeds in irrigation across different locations and years. The plot consists of six panels labeled A to F, each representing a different location and year. Panel A shows Location 1, Year 1, with a correlation coefficient of -0.361. Panel B shows Location 1, Year 2, with a correlation coefficient of -0.358. Panel C shows Location 2, Year 1, with a correlation coefficient of -0.305. Panel D shows Location 2, Year 2, with a correlation coefficient of -0.197. Panel E shows Location 3, Year 1, with a correlation coefficient of -0.035. Panel F shows Location 3, Year 2, with a correlation coefficient of 0.914 when eclipta is included and -0.026 when eclipta is excluded. The x-axis represents the percentage of weeds in containers, and the y-axis represents the number of weeds in irrigation. The data points show varying degrees of correlation between the two variables across different locations and years. All values are approximated.
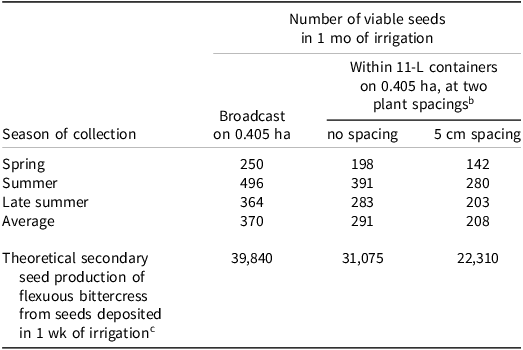
Irrigation may be a vector for introducing weed seeds that have the potential for secondary spread. With an average of 18.5 germinable seeds in each irrigation (from Table 2), and conservatively estimating an average of 20 irrigation days each month (omitting days with rain and low evapotranspiration demands), our data predict that about 370 germinable seeds would be spread on 0.405 ha in 1 mo (Table 4). Depending on the plant spacing, this may result in 208 to 291 seeds falling in crop containers, with the rest falling between pots. Furthermore, assuming about 7,000 11-L pots in 0.405 ha of production, 3% to 4% of the pots would be infested with weed seeds over the course of a single month. These few individual weeds could function as colonizers with the potential to reproduce and spread. For example: flexuous bittercress was introduced at a rate of about 1.2 seeds per 0.405 ha−1 day−1 (Table 2). Assuming eight flexuous bittercress seeds deposited in the first 7 d after planting and estimated flexuous bittercress fecundity of 4,980 seeds per plant within 5 wk (Bachman and Whitwell Reference Bachman and Whitwell1995), we can predict dispersal of more than 39,000 bittercress seeds within 5 wk from forcefully dehiscent siliques (Table 4). Controlling low populations of weeds introduced by irrigation or other vectors is important to prevent weed population growth and spread in nursery crops. Similarly, Kelly and Bruns (Reference Kelley and Bruns1975) concluded that the greatest effect of weed seed dispersal via irrigation in agronomic fields was the potential to introduce new species with the potential to colonize fields.
Estimates of the number of germinable seeds per 0.405 ha−1 distributed via irrigation each month, averaged across six locations and 2 yr. a

Table 4. Long description
The table presents data on the number of viable seeds distributed via irrigation over one month, averaged across six locations and two years. It includes three main sections: broadcast on 0.405 hectares, and within 11-liter containers on 0.405 hectares at two plant spacings: no spacing and 5 centimeters spacing. The table has five rows for the season of collection: spring, summer, late summer, average, and theoretical secondary seed production of flexuous bittercress from seeds deposited in one week of irrigation. Each row lists the number of viable seeds for each section. Notable trends include higher seed counts in summer and late summer compared to spring, with the average number of seeds being 370 for broadcast, 291 for no spacing, and 208 for 5 centimeters spacing. The theoretical secondary seed production is significantly higher, with 39,840 seeds for broadcast, 31,075 for no spacing, and 22,310 for 5 centimeters spacing.
a These calculations assume 1.9 cm (75,708 L) of irrigation per day and 20 irrigation days per month. Estimates are presented for total seed dispersal, and for potential seed deposition into individual containers at two crop plant spacing configurations, accounting for irrigation loss to gaps between containers.
b Based upon average numbers of containers per acre as reported by Yeary et al. (Reference Yeary, Fulcher and Leib2016).
c Assumptions: eight flexuous bittercress seeds introduced in 7 d of irrigation (from Table 2); and estimated flexuous bittercress fecundity of 4,980 seeds per plant within 5 wk (Bachman and Whitwell Reference Bachman and Whitwell1995).
Practical Implications
Germinable weed seeds were found in all irrigation water filtrate samples, but the number of seeds was low compared to other potential sources. Assuming 20 irrigation days per month, seeds spread via irrigation in 1 mo were estimated to be between 252 and 498 seeds per 0.405 ha−1 (1 acre). Seeds of some weed species such as eclipta, horseweed, and spotted spurge were present in irrigation water year-round, even when mature plants were absent. Early introductions of these species via irrigation could lead to the establishment and spread of weeds if not managed before secondary spread occurs. Although these numbers are small compared to the reproductive potential of established weeds, irrigation may serve as a vector for founder populations or persistent low-level introductions that should be managed before they can spread. For example, our data indicate that in the first week after potting, about eight flexuous bittercress seeds may be introduced via irrigation on 0.405 ha of crops. Uncontrolled, eight flexuous bittercress plants, which have forcefully dehiscent seed pods, could produce more than 39,000 seeds within 5 wk, significantly greater than the 40 seeds disseminated through irrigation over that same 5-wk period. Early detection and control of these initial introductions are crucial to minimizing subsequent weed proliferation driven by secondary dispersal. Weedy species with highly buoyant seeds that persist in water, such as eclipta and marsh yellowcress, pose a high risk of dissemination via irrigation and should be controlled around ponds and drainage pathways. Pumping irrigation water during a rain event significantly increased the dispersal of these buoyant species. However, the effect of rain was short-lived. Growers should forgo irrigation when it rains. Similarly, wind-dispersed species such as black willow, common groundsel, and horseweed should be removed from pond surroundings to reduce seed deposition into irrigation water. Filtering irrigation water through 130-µm disc filters before application would remove most weed species, but growers must balance this benefit with the costs associated with such filter systems.
Acknowledgments
We thank Consuelo Arellano for advice and assistance with statistical analysis. We also thank Alexander Krings for helping identify plant species germinated from irrigation filtrate samples.
Funding
Funding for this research was provided by the U.S. Department of Agriculture–Agricultural Research Service through cooperative agreement 58-5082-8-026. Research was also conducted in connection with Hatch Project NC-02707.
Competing Interests
The authors declare they have no competing interests.

 Open access

