


Introduction
Radiolarians are a major plankton group of the Paleozoic, capable of providing important insight into the evolution of heterotrophic plankton during their Ordovician diversification. Analysis of paleobiodiversity dynamics relies on documentation of chronostratigraphically well-constrained radiolarian assemblages (e.g., Danelian and Monnet, Reference Danelian and Monnet2021).
Radiolarians from the Upper Ordovician Katian Stage were first reported from the Hanson Creek Formation in Nevada (Dunham and Murphy, Reference Dunham and Murphy1976) and later revisited by Renz (Reference Renz1990). On the basis of conodonts from layers immediately above the radiolarian-bearing concretionary horizon, the assemblage represents the Ordovician Ka2 (mid-Katian) interval (Trotter and Webby, Reference Trotter and Webby1994). The Malongulli Formation of New South Wales, Australia, correlates with Ka2–Ka4 and was investigated for radiolarians by both Webby and Blom (Reference Webby and Blom1986) and Noble and Webby (Reference Noble and Webby2009). Several other nearby localities in the Lachlan Fold Belt possibly represent correlative Upper Ordovician horizons, albeit in different sedimentary facies (Goto and Ishiga, Reference Goto and Ishiga1991; Goto et al., Reference Goto, Umeda and Ishiga1992). Apart from these Laurentian and Gondwanan sites, assemblages discovered from the Zhaolaoyu Formation in North China (Song et al., Reference Song, Cui, Hua and Wang2000) and the Wufeng Formation in South China (Wang and Zhang, Reference Wang and Zhang2011; Zhang et al., Reference Zhang, Luo and Zhang2018) further broaden knowledge of the paleogeographic extent of Katian radiolarians. Obut (Reference Obut2022) recently reported Upper Ordovician radiolarians from deep shelf environments of the Siberian paleocontinent. This upper Katian to lower Hirnantian radiolarian assemblage from the western Gorny Altai region apparently shares several species with Katian assemblages previously recorded from New South Wales, Australia, and Nevada, USA, but awaits further detailed documentation.
The majority of known Katian faunas exhibit excellent to moderate preservation, but despite their significant position in the evolutionary history of early radiolarians, the systematics of several faunas remains vague (Aitchison et al., Reference Aitchison, Suzuki, Caridroit, Danelian, Noble, Danelian, Caridroit, Noble and Aitchison2017a). This study investigates the diversity of a well-preserved and stratigraphically well-constrained Katian fauna of the Malongulli Formation in Australia with a focus on the microskeletons of Secuicollacta Nazarov and Ormiston (Reference Nazarov and Ormiston1984), Palaeoephippium Goodbody (Reference Goodbody1986) and Haplotaeniatum Nazarov and Ormiston (Reference Nazarov and Ormiston1987). These cosmopolitan genera were abundant at that time and evolved into major lineages that persisted across the Late Ordovician Mass Extinction (LOME).
The Angullong sampling site as described by Noble and Webby (Reference Noble and Webby2009) was chosen to facilitate recovery of well-preserved radiolarians for examination by micro-CT. This evolving methodology provides detailed three-dimensional (3D) imagery necessary to explore their skeletal signatures and undertake structural analysis, particularly, in the case of this investigation, of features in forms that survived the LOME. Systematics of several other taxa recovered from the assemblage that have been reported elsewhere are also revised. Both a new genus and new species are documented and added to knowledge of Katian radiolarian diversity (Aitchison et al., Reference Aitchison, Suzuki, O'Dogherty, Danelian, Caridroit, Noble and Aitchison2017b).
Geological setting
Locality information
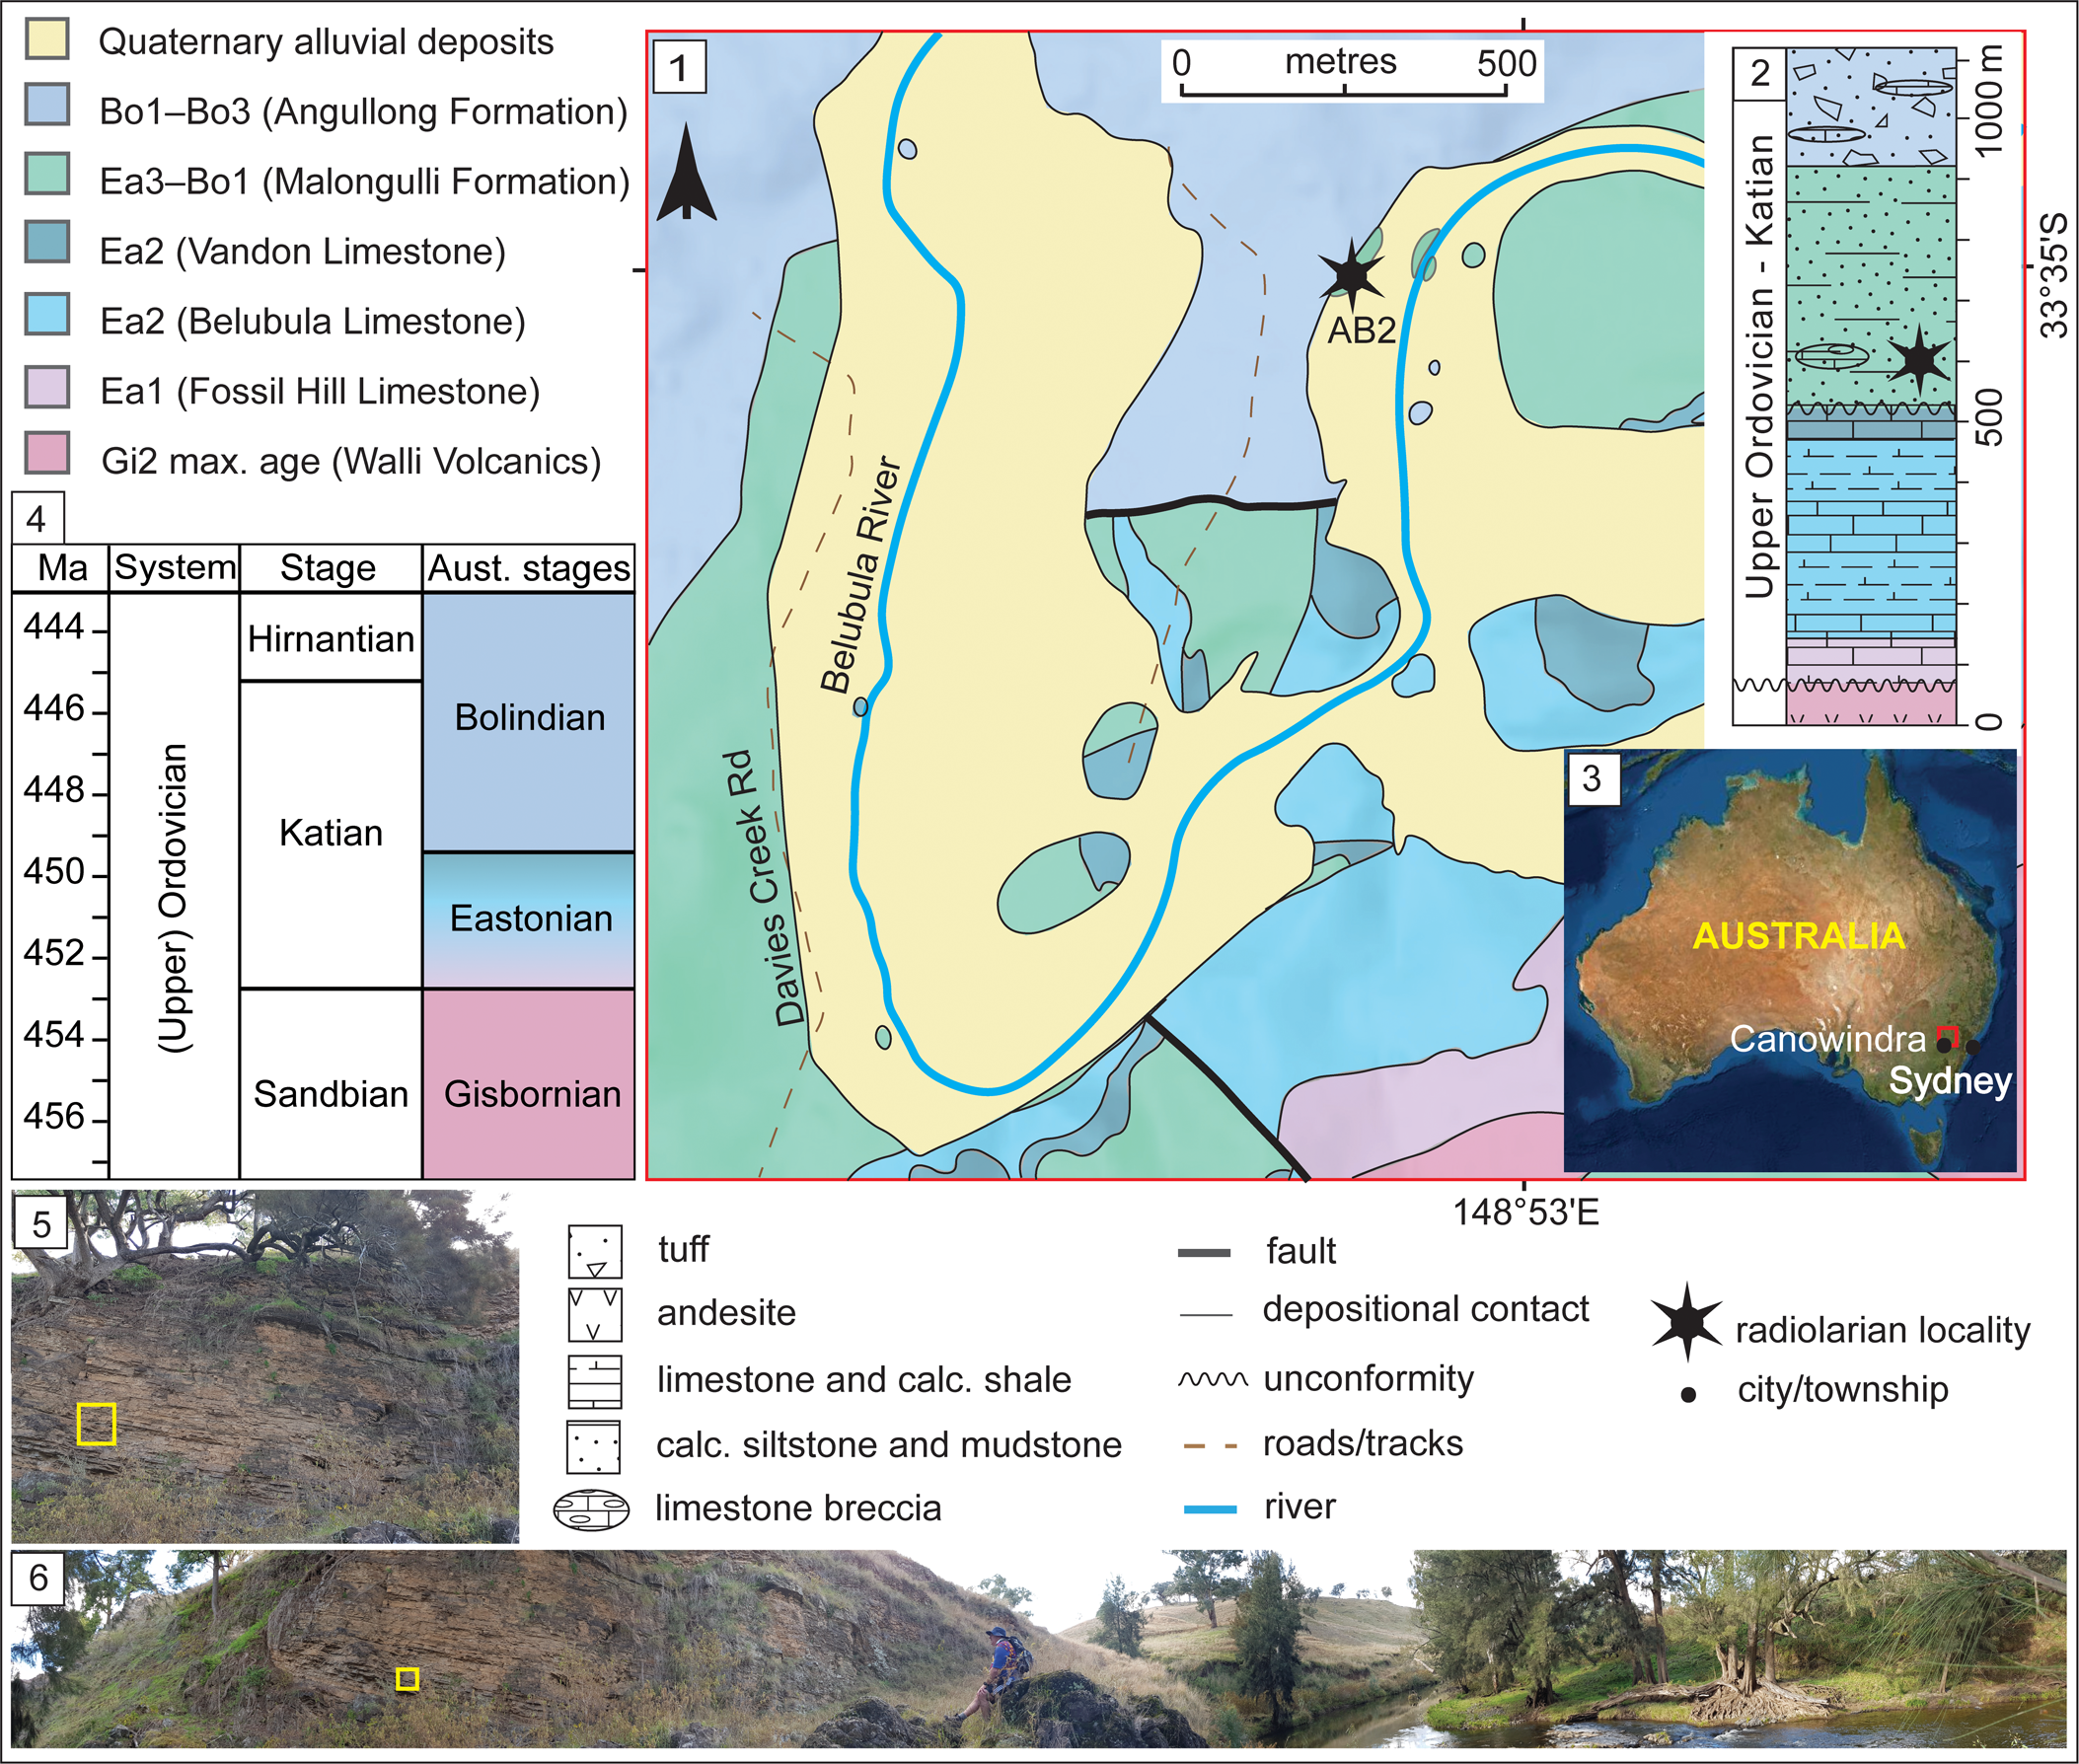
The Angullong section in the Malongulli Formation (33°34′57.58″S, 148°52′54.06″E), from which the studied sample SEES/210512-AB was collected, is an ~4 m thick outcrop. Exposure occurs on the northwest bank of the Belubula River on the Angullong farm property, ~15 km east of Canowindra, a township approximately 150 km west of Sydney, New South Wales, Australia (Fig. 1). The section consists of calcareous siltstone layers in which sponge spicules and radiolarian “ghosts” are visible. The Malongulli Formation (Stevens, Reference Stevens1952; Webby and Packham, Reference Webby and Packham1982) crops out in the Cliefden Caves area and is part of the Cabonne Group within the Molong Volcanic Belt (MVB). This is one of the four structural belts in the Macquarie Arc in the eastern subprovince of the Lachlan Orogen (Glen et al., Reference Glen, Walshe, Barron and Watkins1998, Reference Glen, Quinn and Cooke2012). The formation is composed of calcareous siltstones, shales, spiculitic layers, tuffs, and limestone breccias (Stevens, Reference Stevens1952) hosting a wide array of fossil faunal assemblages representative of deep-water facies. The unit is >380 m thick (Percival, Reference Percival1976) and unconformably overlies the shallow-water Cliefden Caves Limestone Subgroup (Vandon, Belubula, and Fossil Hill limestones), which is correlated with the Australian lower Eastonian (Ea1–Ea2) Stage (Webby and Peckham, Reference Webby and Packham1982; Zhen and Webby, Reference Zhen and Webby1995). It is conformably overlain by the Angullong Formation, a succession of volcaniclastic sediments and andesites that is of Australian lower Bolindian (Bo1–Bo3) Stage (Percival and Glen, Reference Percival and Glen2007). Deposition of the Malongulli Formation commenced when the sedimentary environment changed from benthic to pelagic, causing cessation of Cliefden Cave Limestone Subgroup deposition along the eastern flank of the MVB. Shallow-water sedimentation continued on the western flank of the MVB, resulting in occasional scouring and slumping from carbonate banks. This is a potential explanation for the erratic occurrence of limestone breccias in the Malongulli Formation (Webby and Peckham, Reference Webby and Packham1982). More-detailed accounts of the geology, tectonics, and stratigraphy of the area are presented by Percival (Reference Percival1976), Webby and Peckham (Reference Webby and Packham1982), Rigby and Webby (Reference Rigby and Webby1988), Webby (Reference Webby1992), Percival and Webby (Reference Percival and Webby1996), Glen et al. (Reference Glen, Walshe, Barron and Watkins1998), and Percival and Glen (Reference Percival and Glen2007).
(1) Geological map of the Cliefden Caves study area (after Colquhoun et al., Reference Colquhoun, Hughes, Deyssing, Ballard, Folkes, Phillips, Troedson and Fitzherbert2021 and references therein). (2) Generalized stratigraphic column for Ordovician strata in the Cliefden Caves area (modified from Rigby and Webby, Reference Rigby and Webby1988; Percival and Glen, Reference Percival and Glen2007). (3) Overview map showing the location of study area. (4) Correlation of Australian to International stages. (5) Field photograph of the sampling site of SEES/210512-AB2. (6) Panoramic view field photograph of the Angullong sampling site on the Belubula River. Bo = Bolindian Stage; Ea = Eastonian Stage; Gi = Gisbornian Stage.
Stratigraphic context
Locally, the Malongulli Formation unconformably overlies the Vandon Limestone member of the Cliefden Caves Subgroup. The unit immediately below the Malongulli Formation a.k.a. “the Grey Unit” (Percival, Reference Percival1976) is sparsely fossiliferous and lacks any age-diagnostic fossils. The base of the Malongulli Formation was first assigned to the Dicranograptus clingani Zone by Moors (Reference Moors1970), corresponding to the D. kirki Zone in Australasia (Cooper et al., Reference Cooper, Maletz, Taylor, Zalasiewicz, Webby, Paris, Droser and Percival2004). This represents the Australian upper Eastonian (Ea3) Stage. Later, Percival (Reference Percival1976) discovered an assemblage including Alulagraptus uncinatus (Keble and Harris, Reference Keble and Harris1925) and Dicellograptus eastonensis (Keble and Harris, Reference Keble and Harris1925) reflecting the Pleurograptus linearis Zone of the British Ordovician stratigraphy, from a bed immediately below the overlying Angullong Formation. This extended the stratigraphic range of the Malongulli Formation to the lower (Bo1) Bolindian Australian Stage (Percival, Reference Percival1976; Cooper et al., Reference Cooper, Maletz, Taylor, Zalasiewicz, Webby, Paris, Droser and Percival2004; Percival et al., Reference Percival, Kraft, Zhang and Sherwin2015). Conodonts reported from the Malongulli Formation by Trotter and Webby (Reference Trotter and Webby1994) and Noble and Webby (Reference Noble and Webby2009) include a diverse assemblage of North American midcontinent and North Atlantic affinities correlating with the graptolite-based age assignments. In addition to these graptolite and conodont faunas, the Malongulli Formation has yielded one of the most diverse sponge assemblages recorded from the Upper Ordovician (Rigby and Webby, Reference Rigby and Webby1988; Webby and Trotter, Reference Webby and Trotter1993) and macrofossils including brachiopods, corals, stromatoporids, bryozoans, trilobites, and nautiloids (Percival, Reference Percival1976; Stait et al., Reference Stait, Webby and Percival1985; Percival et al., Reference Percival, Engelbretsen, Brock and Farrell2016).
Materials and methods
The fauna described herein comes from laminated calcareous siltstones approximately 1.5 m above the base of the section described by Noble and Webby (Reference Noble and Webby2009) at Angullong on the Belubula River. From the 10 samples collected, only one yielded sufficiently well-preserved radiolarians suitable for micro-CT scanning.
Approximately 5 cm3 sized crushed pieces were immersed in a 15% acetic, 5% HCl solution for up to three weeks before the first wash. This was followed by wet sieving through the 355 μm and 63 μm sieves. The air-dried residue was then picked for radiolarians under a Leica M80 light microscope. Individual specimens were imaged using a desktop Hitachi TM3030 SEM before micro-CT scanning. The latter step was undertaken for only a few targeted radiolarian species requiring detailed systematic investigation.
Specimens of Pseudorotasphaera sp., Secuicollacta malongulliensis n. sp., Wiradjuri subulate Webby and Blom, Reference Webby and Blom1986, Palaeoephippium octaramosum Renz, Reference Renz1990, Haplotaeniatum fenestratum Goto, Umeda and Ishiga, Reference Goto, Umeda and Ishiga1992, Haplotaeniatum prolatum Noble and Webby, Reference Noble and Webby2009, and Haplotaeniatum spongium (Renz, Reference Renz1990) were scanned using a Zeiss Xradia Versa XRM-500 high-resolution micro-CT scanner at the Julius Kruttschnitt Mineral Research Centre, The University of Queensland. Specimens were mounted on 4 mm2 squares cut from a few standard double-sided conductive adhesive carbon tabs, arranged along a line on a SEM specimen stub (Ø: 12.5 mm, pin length: 6 mm). X, Y, and Z coordinates of each specimen on the stub were determined by a preliminary scan carried out at a lower resolution of 3 μm to locate the specimens during the scan. Micro-CT data acquisition, artifact reduction, and analysis followed the method described by Kachovich et al. (Reference Kachovich, Sheng and Aitchison2019) and Sheng et al. (Reference Sheng, Kachovich and Aitchison2020) except for substitution of Norland Optical Adhesive 61 (NOA61) and acrylonitrile butadiene styrene (ABS) mounts with carbon tabs on SEM stubs. This replacement enhances the efficiency of the analysis and the accuracy of the 3D model generated by Avizo 9.7 (2020.2 version) volume-rendering software by reducing the number of lower-density constituents (ABS mount and NOA61 glue) that need to be digitally removed from the dataset during the manual segmentation.
Repositories and institutional abbreviations
Specimens observed in this study are housed in the micropaleontology collection of the School of Earth and Environmental Sciences, The University of Queensland, Australia (SEES-UQ). SEES/210512 refers to the collection number, while AB2 is the sample number. The last three characters (SEES/210512-AB2-YYY) correspond to the species identification number. Other repositories mentioned herein include the Department of Geology, Faculty of Science, Shimane University (DGSU PR), Australian Museum (AM), Federal Fund of core material, paleontological, lithological, and oil collections of the oil-and-gas provinces of Russia (FF-P001), Paleontological Collections, Department of Geology, University of Alberta, Canada (UA), Institute of Geology, Beijing (BGIN), and Geological Institute, Moscow (GIN).
Results
Sample SEES/210513/AB2 yielded a diverse, well-preserved radiolarian assemblage with 13 radiolarian species representing 10 genera. Faunal composition along with relevant taxonomic assignments and their specimen abundance are presented in Table 1. The assemblage is dominated by spumellarians, with Kalimnasphaera maculosa Webby and Blom, Reference Webby and Blom1986 being the most abundant taxon. The rest of the assemblage constitutes subordinate populations of entactinarians, archaeospicularians, and albaillellarians. One new genus, Wiradjuri, together with a new species, Secuicollacta malongulliensis, are introduced. Although sample SEES/210513/AB2 did not yield any graptolites or conodonts during the present study, the age of the Angullong/Belubula River Section in the Malongulli Formation has been assigned by Trotter and Webby (Reference Trotter and Webby1994) and Noble and Webby (Reference Noble and Webby2009) to the lower half of the Oulodus velicuspis (conodont) Biozone of the North American midcontinent, which correlates to the international Ka2–3 stage slices (Goldman et al., Reference Goldman, Sadler, Leslie, Melchin, Agterberg, Gradstein, Gradstein, Ogg, Schmitz and Ogg2020).
List of radiolarians recovered from the Angullong/Belubula sampling site in the Malongulli Formation, New South Wales, Australia, during this investigation, indicating relative abundances of different taxa and faunal diversity. Calculations of shell dimensions are based on at least five specimens when available. If species count is less than five, all specimens were measured.

Discussion
Katian radiolarian diversity
Hitherto, Katian radiolarian assemblages found around the globe demonstrated a relatively low species diversity compared with Early and Middle Ordovician radiolarian assemblages reported elsewhere. The dominant forms such as Kalimnasphaera, Wiradjuri, and Secuicollacta that are abundant in Katian assemblages are cosmopolitan and can be found consistently in all encounters despite being situated in separate paleogeographic regions. The few taxa that appear to be restricted within a region are not necessarily endemic but potentially result from misidentification, taphonomic biases, habitat (deep-water/shallow-water species), and a tendency to focus on new species in publications. The complete list of Katian radiolarians identified to date (Table 2) indicates that Australian assemblages have the richest diversity (>70% of total number of species). This is likely a result of the density of sample sites compared with other regions. To understand the true diversity distribution across paleogeographic regions, more studies targeting the Katian are encouraged.
Katian radiolarian diversity reported from various paleogeographic regions globally.
1 Malongulli Formation, New South Wales (Goto et al., Reference Goto, Umeda and Ishiga1992; Noble and Webby, Reference Noble and Webby2009; this paper)
2 Wufeng Formation, Jiangsu and Hubei (Wang and Zhang, Reference Wang and Zhang2011; Zhang et al., Reference Zhang, Luo and Zhang2018)
3 Hanson Creek Formation, Eureka County, Nevada (Dunham and Murphy, Reference Dunham and Murphy1976; Renz, Reference Renz1990)
4 Tekhten Formation, NW Gorny Altai, West Siberia (Obut, Reference Obut2022)
Implications of skeletogenesis
As the interval that immediately preceded the LOME, the Katian is significant and holds information crucial for understanding causative abiotic triggers leading up to this catastrophic event that caused 85% of marine species (Jablonski, Reference Jablonski1991; Sheehan, Reference Sheehan2001) to be extinct. As radiolarian studies have not yet been adequately extended toward the Hirnantian, the mid-Katian (Ka2–3 stage slices) radiolarian fauna documented herein may hold clues to structural adaptations that ultimately proved either advantageous or disadvantageous for survival during the times of increasing ecological stress.
Among several genera that crossed into the Silurian, Secuicollacta, Haplotaeniatum, and Palaeoephippium were more successful in establishing themselves in the early Silurian oceans. Although some morphological modifications occurred during speciation, the primary body plan of these genera remained constant during the transition. Plussatispila MacDonald (Reference MacDonald2006) has a single known occurrence in the Darriwilian (Kachovich and Aitchison, Reference Kachovich and Aitchison2020) before its early Silurian acme and has not been recovered from investigated Katian localities. It is interesting to consider whether any specific structural features of Secuicollacta, Haplotaeniatum, and Palaeoephippium facilitated their smooth transition through times of environmental change.
Segmentation of the micro-CT model for Secuicollacta malongulliensis n. sp. provides some insights to skeletogenesis of the primitive secuicollactids. Considering the configuration of skeletal elements, the spicule evidently performed as the initial skeleton when primary skeletogenesis began. This was followed by secondary skeletogenesis that happened via primary units directly fused to the spicule through primary rods. Formation of primary units that are not directly linked to the spicule then followed. Finally, secondary bars may have developed to bridge components of all primary units and spicules, forming a coherent meshwork combining all primary and secondary centers of skeletogenesis. Test sphericity may be a function of curvature of buttressed spicular rays as the spicule is the primary center from which other features formed. This pattern of sequential skeletogenesis may have been a key to surviving the Hirnantian mass extinction. In flourishing conditions, the number of primary units may not be restricted, but evidently a test can be completed and enclosed even if the spicule can generate only a minimum of one or two primary units (hypothetically), and this may be more optimal in ecologically taxing circumstances.
The tendency to develop a pylome, observed among several Upper Ordovician radiolarians such as Kalimnasphaera maculosa, Haplotaeniatum prolatum, and H. spongium, as a favorable adaptation is difficult to determine as kalimnasphaerids became extinct while haplotaeniatids have successful Silurian pylomate descendants such as H. aperturatum Noble et al. (Reference Noble, Braun and McClellan1998) and H. cathenatum Nazarov and Ormiston (Reference Nazarov and Ormiston1993). However, as observed by Won et al. (Reference Won, Blodgett and Nestor2002), the pylome is not consistently present in all individuals among Silurian pylomate haplotaeniatids, implying that there could also have been another favorable adaptation in the skeletal structure that was advantageous for survival.
In contrast to the haplotaeniatids of the pre-Katian and post-LOME oceans, skeletal architectures of H. prolatum, H. spongium, and H. ovatum Noble and Webby, Reference Noble and Webby2009 are different. Micro-CT reconstructions show that the labyrinth compactness of H. spongium is less than that of mid- to lowermost Upper Ordovician forms of this genus (Maletz and Bruton, Reference Maletz and Bruton2008; Pouille et al., Reference Pouille, Danelian and Popov2014; Kachovich and Aitchison, Reference Kachovich and Aitchison2020; Perera et al., Reference Perera, Aitchison and Nothdurft2020; Perera and Aitchison, Reference Perera and Aitchison2022). However, the original morphology seems to return by the early Silurian for a majority of species (Noble et al., Reference Noble, Braun and McClellan1998; Noble and Maletz, Reference Noble and Maletz2000; Won et al., Reference Won, Blodgett and Nestor2002; Umeda and Suzuki, Reference Umeda and Suzuki2005; MacDonald, Reference MacDonald2006; Tetard et al., Reference Tetard, Danelian and Noble2014). It is worth considering whether the simpler body plan of Katian haplotaeniatids was advantageous during less-favorable environmental conditions.
As primitive members of the Palaeoscenidiidae, both P. octaramosum and Palaeopyramidium sp. A had a dense cover of spinules that reduced considerably by the Silurian although the spicular system remained the same. Therefore, the simple yet robust spicular system possibly could be a favorable adaptation that offered the lineage a better chance of survival.
Systematic paleontology
Phylum Radiozoa Cavalier-Smith, Reference Cavalier-Smith1987
Class Polycystina Ehrenberg, Reference Ehrenberg1838, sensu Riedel, Reference Riedel1967
Order Albaillellaria Deflandre, Reference Deflandre and Grassé1953, emend. Holdsworth, Reference Holdsworth1969
Family Ceratoikiscidae Holdsworth, Reference Holdsworth1969, sensu Holdsworth, Reference Holdsworth and Swain1977
Genus Protoceratoikiscum Goto, Umeda, and Ishiga, Reference Goto, Umeda and Ishiga1992
Type species
Protoceratoikiscum chinocrystallum Goto, Umeda, and Ishiga, Reference Goto, Umeda and Ishiga1992 (pl. 17, fig. 1) from the Warbisco Shale, northwest of Taralga, New South Wales, Australia.
Protoceratoikiscum crossingi Noble and Webby, Reference Noble and Webby2009
Figure 2.3
- Reference Noble and Webby2009
Protoceratoikiscum crossingi Noble and Webby, p. 553, figs. 4.1–4.3.
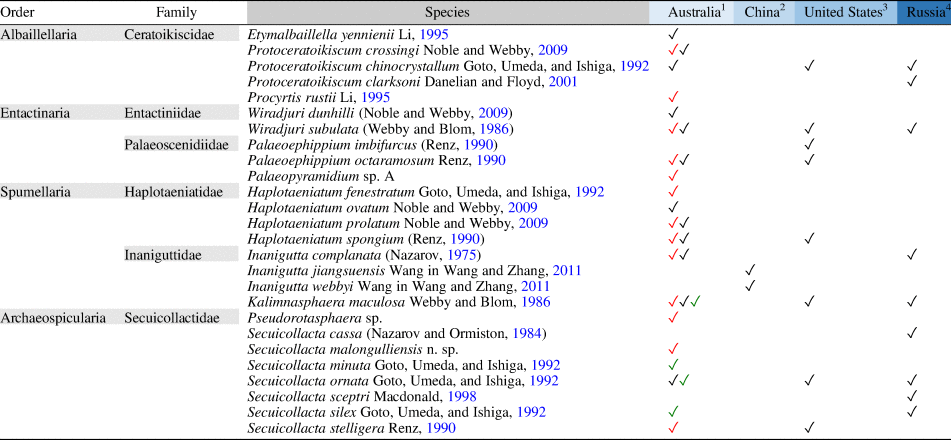
SEM images of radiolarians extracted from the Angullong/Belubula section, Malongulli Formation, New South Wales, Australia. (1) Kalimnasphaera maculosa SEES/210512-AB2-KM1; (2) Wiradjuri subulata SEES/210512-AB2-WS2; (3) Protoceratoikiscum crossingi SEES/210512-AB2-PC1; (4) Inanigutta complanata SEES/210512-AB2-IC1; (5) Procyrtis rustii SEES/210512-AB2-PR1; (6) Palaeopyramidium sp. A SEES/210512-AB2-PA1; (7–12) Secuicollacta malongulliensis n. sp. SEES/210512-SM2–SM7 (13, 14) Secuicollacta stelligera SEES/210512-AB2-SS1, -SS2. Scale bar = 100 μm. A faint yellow color is added to differentiate siliceous material adhering to, but not part of, specimens shown in (7) and (11).
Holotype
Specimen (AM.F. 135539) from the Malongulli Formation, New South Wales, Australia (Noble and Webby, Reference Noble and Webby2009, fig. 4.1).
Remarks
A very rare species in the samples processed, from which only a fragment of a single specimen was recovered.
Order Archaeospicularia Dumitrica, Caridroit, and De Wever, Reference Dumitrica, Caridroit and De Wever2000
Family Secuicollactidae Nazarov and Ormiston, Reference Nazarov and Ormiston1984
Genus Pseudorotasphaera Noble, Reference Noble1994
Type species
Pseudorotasphaera hispida Noble, Reference Noble1994 (pl. 3, fig. 5) from Payne Hills, Caballos Novaculite, Marathon Basin, west Texas, USA, by original designation.
Diagnosis
Latticed, polygonal to spherical cortical shell and loosely latticed medullary shell joined through up to 10 primary beams of lower primary units that are directly connected with the base of upper primary units (UPUs). Four to six primary bars radiating from the bases of primary spines and primary beams. Fusion of lower primary units (LPUs) and upper primary units contributes, respectively, to form the cortical and medullary shell lattices incorporated with secondary bars. Medullary shell, with or without secondary beams. Rod-like or grooved primary spines and angular to subcircular pore frames. Emended from Noble (Reference Noble1994).
Remarks
The original diagnosis of Noble (Reference Noble1994) is broadened herein to include Upper Ordovician forms that possess nongrooved primary spines, more than seven in number that lack secondary beams compared with species described from the Silurian. The amendment also partially adapts the terminology used by MacDonald (Reference MacDonald1998) to describe Rotasphaera, using terminology appropriate for highlighting differences in morphological features compared with single-shelled secuicollactids.
Pseudorotasphaera sp.
Figure 3; Supplemental Data 1
Description
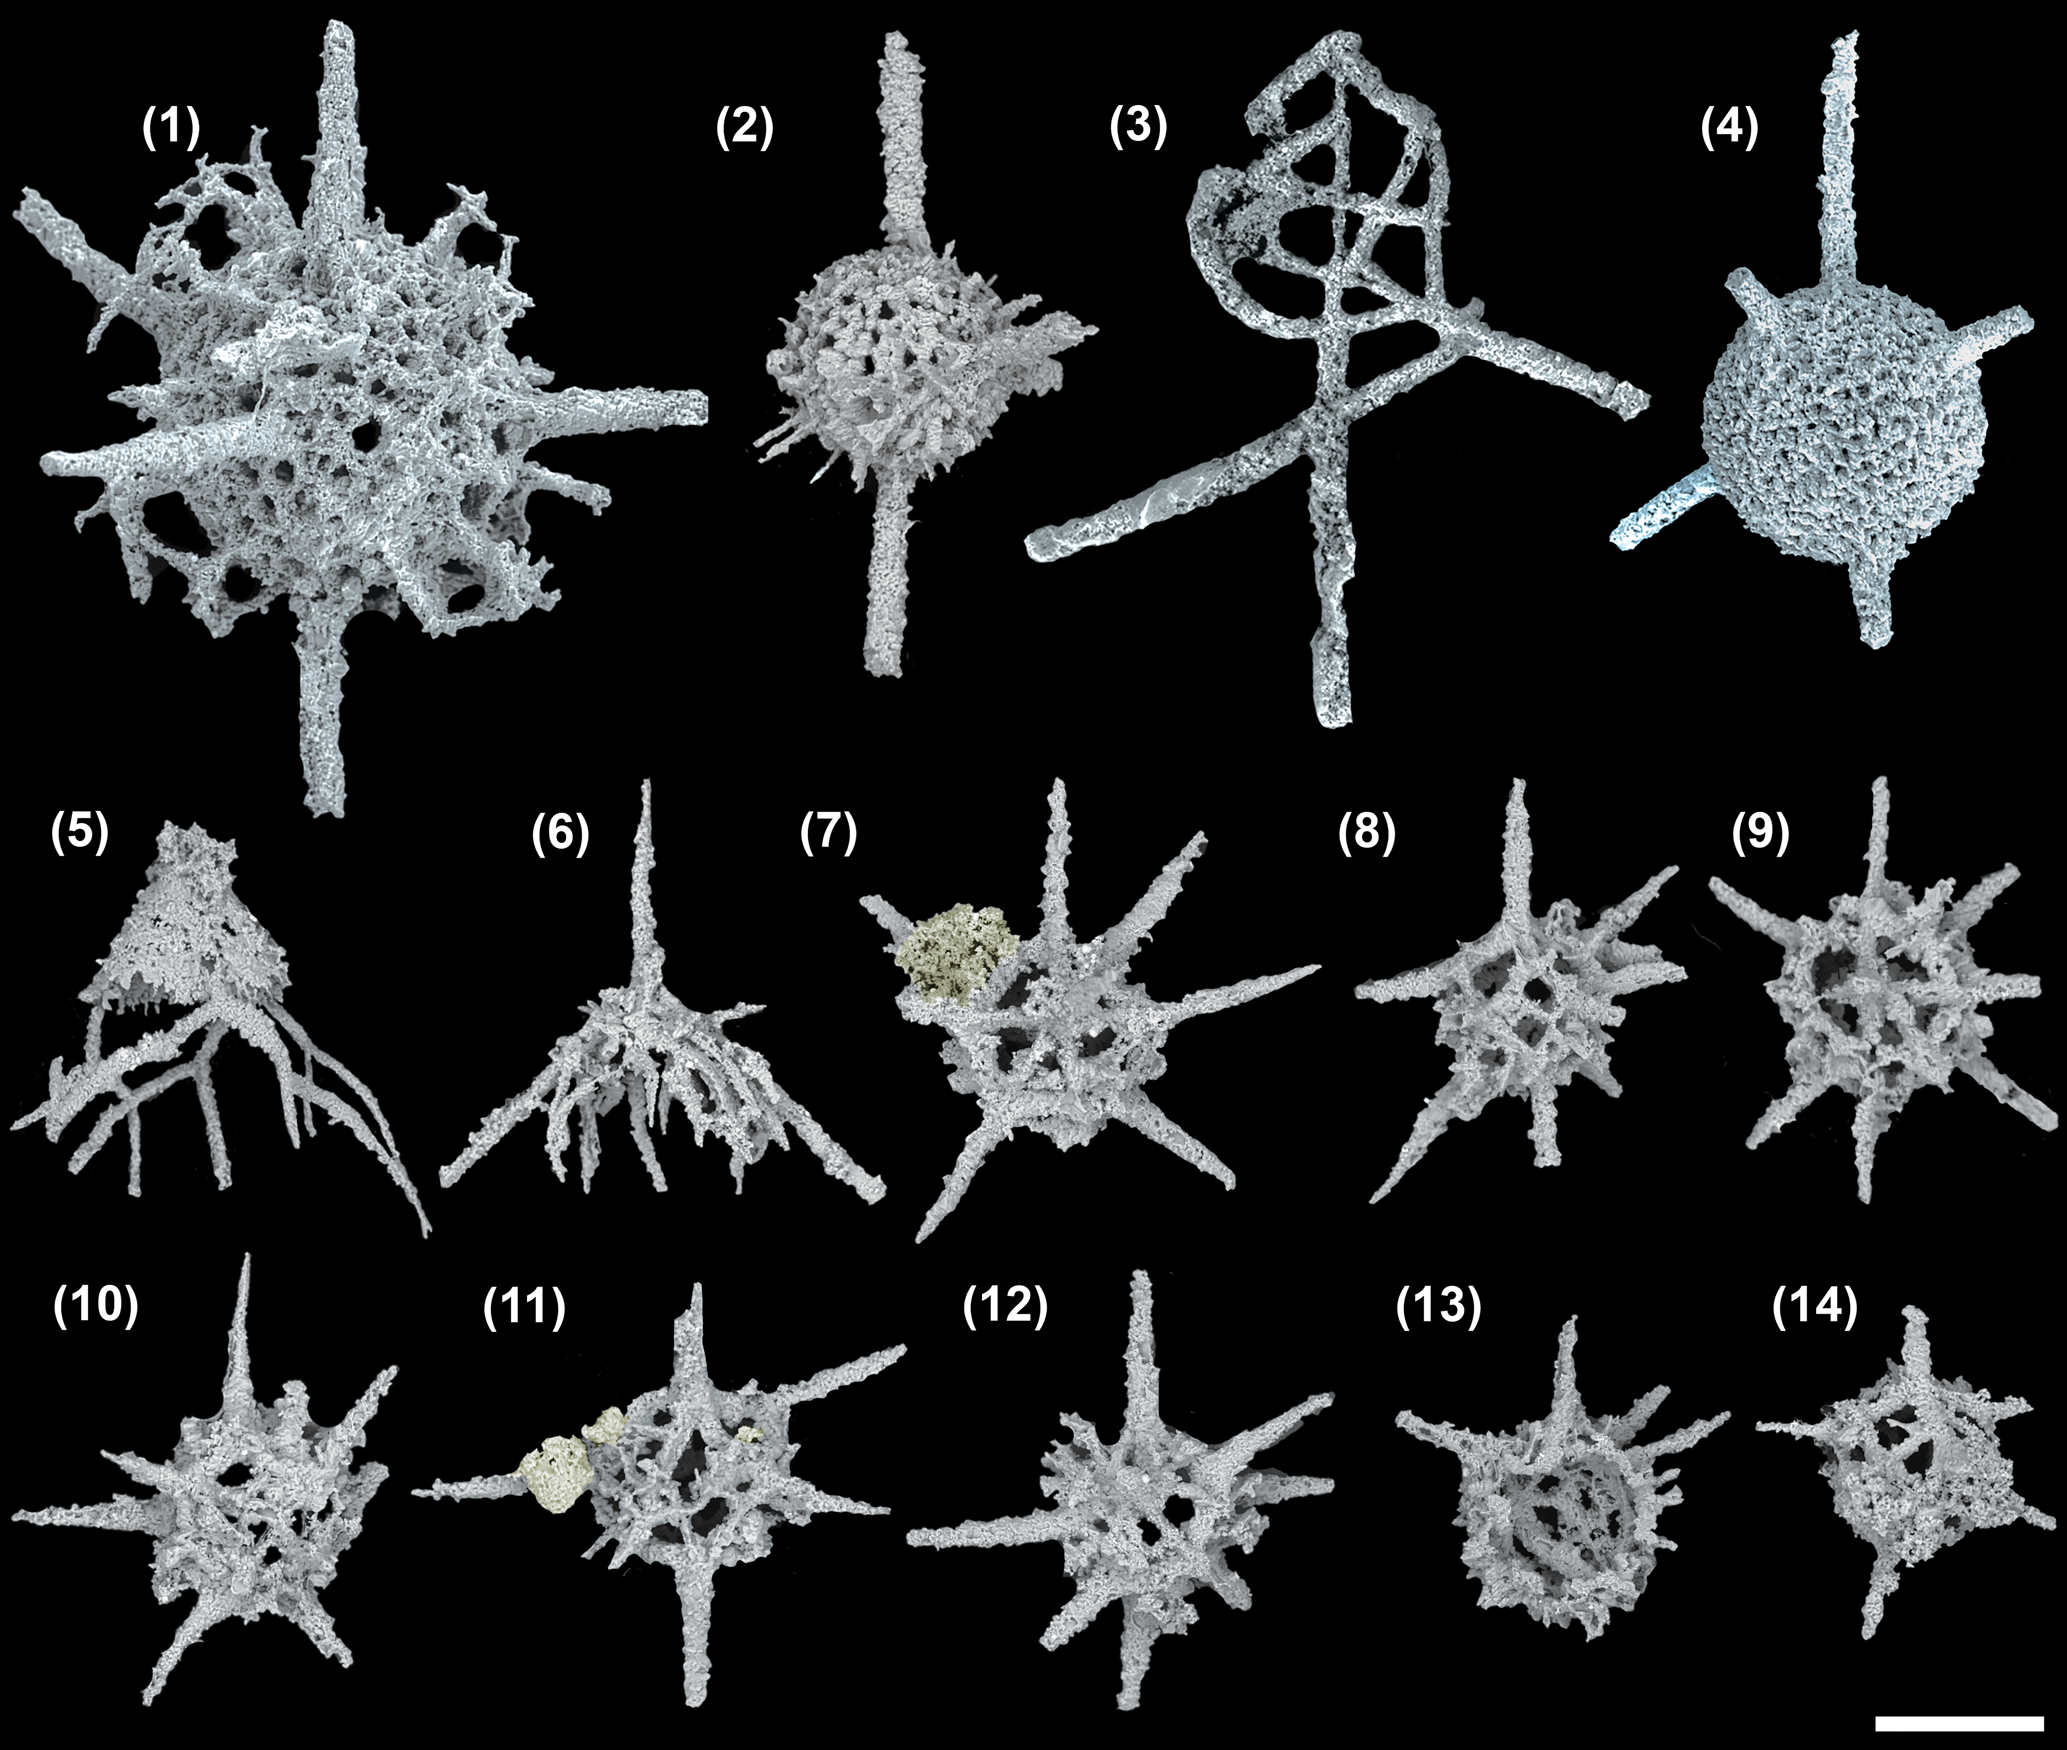
The cortical shell is spherical (Ø, ~115 μm) and constructed with up to 10 UPUs that link with the primary beams of the LPUs of the centrally located medullary shell (Fig. 3.1, 3.2). LPUs of the medullary shell (Ø, ~60 μm) are constructed of four or five primary bars radiating from the bases of primary beams (Fig. 3.3). These primary bars are irregular in shape but fuse with one another to form the lattice of the medullary shell in association with secondary bars (Fig. 3.7). The diameter of a primary beam is consistent along its length and averages 10 μm. These thick bases of the primary beams impose a polygonal shape to the medullary shell. Primary beams grow up to 20 μm, similar to the distance between cortical and medullary shell. The top of these primary beams provides the base and is the center of the UPUs on the cortical shell (Fig. 3.5). A UPU constitutes a primary spine and five to six primary bars radiating from its base. Neighboring UPUs fuse with closely positioned primary bars and secondary bars that bridge to distant primary bars of other UPUs (Fig. 3.4). This coalescence creates polygonal-shaped pores that vary in size (Fig. 3.6). Primary spines are of circular cross section and taper distally to terminate with blunt ends. These extend up to 60 μm and have base diameters between 12 and 15 μm. No secondary beams on the medullary shell or secondary spines on the cortical shell.
Structural details of Pseudorotasphaera sp. highlighted using a micro-CT model (SEES/210512-AB2-P1). (1) Complete specimen. (2) Medullary shell. (3) One lower primary unit (LPU) of the medullary shell comprising a primary beam, four primary bars, and secondary bars. (4) One upper primary unit (UPU) of the cortical shell comprises a primary spine, five primary bars, and secondary bars. (5) Cross section showing how a primary beam of an LPU connects to the base of a UPU. (6) Cortical shell lattice made by fusion of UPUs and secondary bars. (7) Medullary shell lattice made by fusion of LPUs and secondary bars. Gray and red spheres in (1–4, 6, 7) are inserted in the background to aid visualization. SP = primary spines of UPU. (1–5) Scale bars = 25 μm; (6, 7) scale bars = 10 μm.
Remarks
Micro-CT observation of the skeleton of Pseudorotasphaera sp. confirms the presence of structures similar to primary units on the medullary shell. As the term “primary unit” generally signifies the special rotasphaerid structure that occurs exclusively on either the cortical or medullary shell of secuicollactids, the terminology in Figure 3 is applied to differentiate between the two types of primary units found on both medullary and cortical shells of Pseudorotasphaera. All LPUs of Pseudorotasphaera are relatively similar in size and equally prominent compared with Diparvapila MacDonald (Reference MacDonald1998), which has primary units of varying sizes (prominence) located on the medullary shell.
Pseudorotasphaera was initially placed in the Pseudorotasphaeridae (Noble, Reference Noble1994), a family established to include taxa bearing two shells, cortical and medullary, made of primary units referred to as the “rotasphaerid structure.” Won et al. (Reference Won, Blodgett and Nestor2002) suggested abandoning Pseudorotasphaeridae as a separate family as the number of shells could differ even at the genus level. In the unpublished thesis of MacDonald (Reference MacDonald2003), a classification based on the presence or absence of a spicule was recommended. Although it has been confirmed that both Secuicollacta and Diparvapila have ectopic spicules placed on their cortical and medullary shells, respectively, assignment of Pseudorotasphaera was undecided as available specimens were not sufficiently informative. Dumitrica et al. (Reference Dumitrica, Caridroit and De Wever2000) assumed the medullary shell of Pseudorotasphaera is spicular. Although Secuicollacta and Diparvapila have been thoroughly revised with additional multiple encounters, there are no subsequent reports of pseudorotasphaerids.
Pseudorotasphaera differs from Secuicollacta in having a medullary shell and lacking an ectopically placed spicule. The absence of a spicule is related to any preservational or ontogenetic bias such as that used as the rationale for synonymizing Rotasphaera with Secuicollacta (Noble and Maletz, Reference Noble and Maletz2000; Jones and Noble, Reference Jones and Noble2006; Noble et al., Reference Noble, Aitchison, Danelian, Dumitrica, Maletz, Suzuki, Cuvelier, Caridroit, O'Dogherty, Danelian, Caridroit, Noble and Aitchison2017). Similar to Pseudorotasphaera sp., Diparvapila also has two shells, but the spicule is ectopically placed on top of the medullary shell along with a single primary unit at its opposite end. Even if the spicular rays of Diparvapila are mere primary units as argued by Won et al. (Reference Won, Blodgett and Nestor2002), another way to differentiate between Pseudorotasphaera and Diparvapila is that the latter has both a prominent and a small primary unit, whereas the former shows no difference except in the number of primary bars.
As only one specimen can be assigned to this Ordovician representative of Pseudorotasphaera at this stage, the extent of intraspecies variation remains uncertain. If more individuals are encountered, a new genus and species may be erected considering fundamental differences between Silurian and Ordovician pseudorotasphaerids such as a lack of secondary beams (beams between medullary and cortical shell that do not belong to an LPU) and the presence of spines with rod shapes rather than grooved forms. Differences in the number of spines may be a supplementary feature that varies at species level. It is clear that Pseudorotasphaera sp. is the oldest known ancestor of two-shelled secuicollactids, and Silurian pseudorotasphaerids and diparvapilids represent a single monophyletic group.
Genus Secuicollacta Nazarov and Ormiston, Reference Nazarov and Ormiston1984 sensu MacDonald, Reference MacDonald1998
Type species
Secuicollacta cassa Nazarov and Ormiston, Reference Nazarov and Ormiston1984 (pl. 4, fig. 5) from the Makyutov Complex, Tarangul River, Kosistek Village, southern Urals, Kazakhstan, by original designation.
Remarks
Terminology used to describe Ordovician secuicollactids in earlier literature (Webby and Blom, Reference Webby and Blom1986; Renz, Reference Renz1990; Goto and Ishiga, Reference Goto and Ishiga1991; Goto et al., Reference Goto, Umeda and Ishiga1992) reflects unfamiliarity with their spicular nature. This is subsequently acknowledged and discussed in detail by MacDonald (Reference MacDonald1998). Classification based on the number of “primary spines” sensu Goto et al. (Reference Goto, Umeda and Ishiga1992) or “spines” sensu Renz (Reference Renz1990) is ambiguous and may lead to misidentifications. As Upper Ordovician secuicollactids are the most primitive members of their lineage, spicules of some species may not be easily discernible unless analyzed in a 3D space. Therefore, based on the broadened understanding on the skeletal microstructure offered through micro-CT, it is recommended to use the updated criteria adapted herein for differentiation of early members. This may result in fewer species as more emphasis will be placed on intraspecies variation. However, it will likely also lead to more accurate recognition of phylogenetic affiliations.
Secuicollacta malongulliensis new species
Figures 2.7–2.12, 4; Supplemental Data 2
- Reference Webby and Blom1986
Rotasphaerids, Webby and Blom, p. 154, fig. 4.9, 4.10.
- Reference Noble and Webby2009
Secuicollacta ornata; Noble and Webby, p. 553, fig. 4.6.
Holotype
Specimen no. SEES/210512-AB2-SM1 (Fig. 4, Supplemental Data 3) in the micropaleontology collection of SEES-UQ. Known from Katian limestone beds in the Malongulli Formation, New South Wales, Australia.
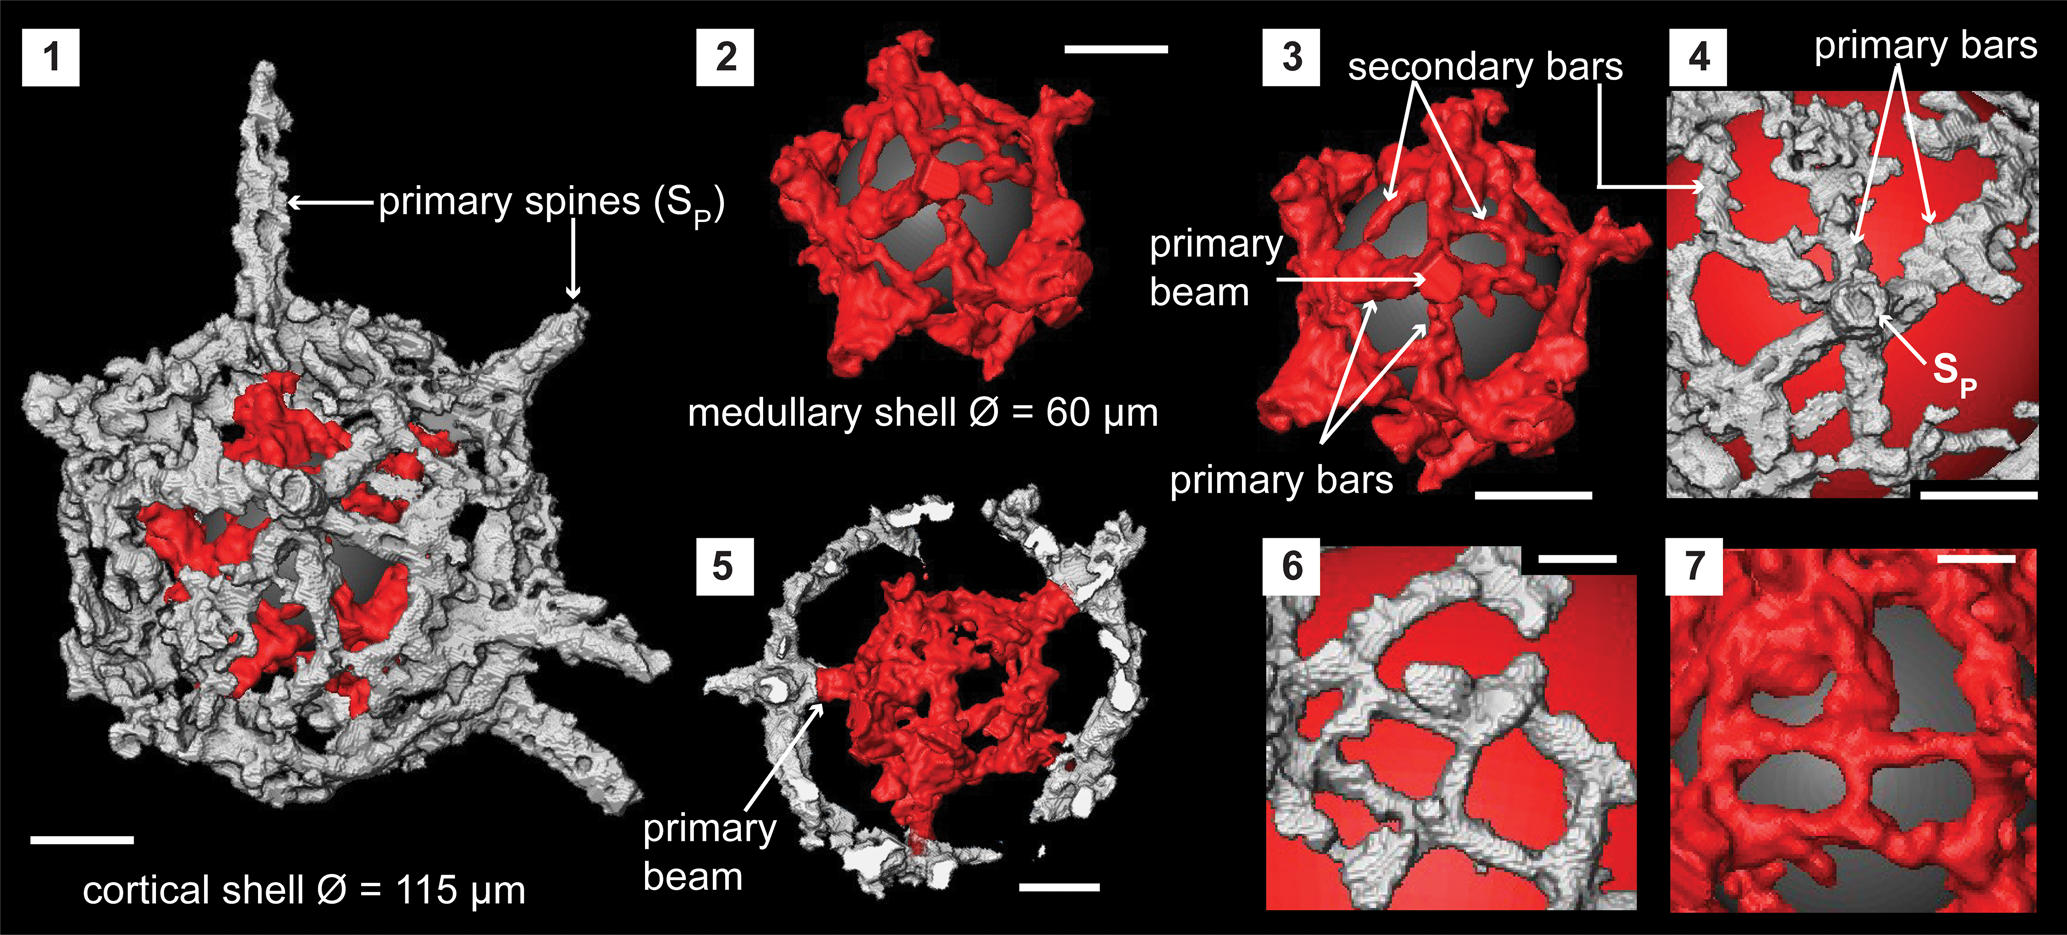
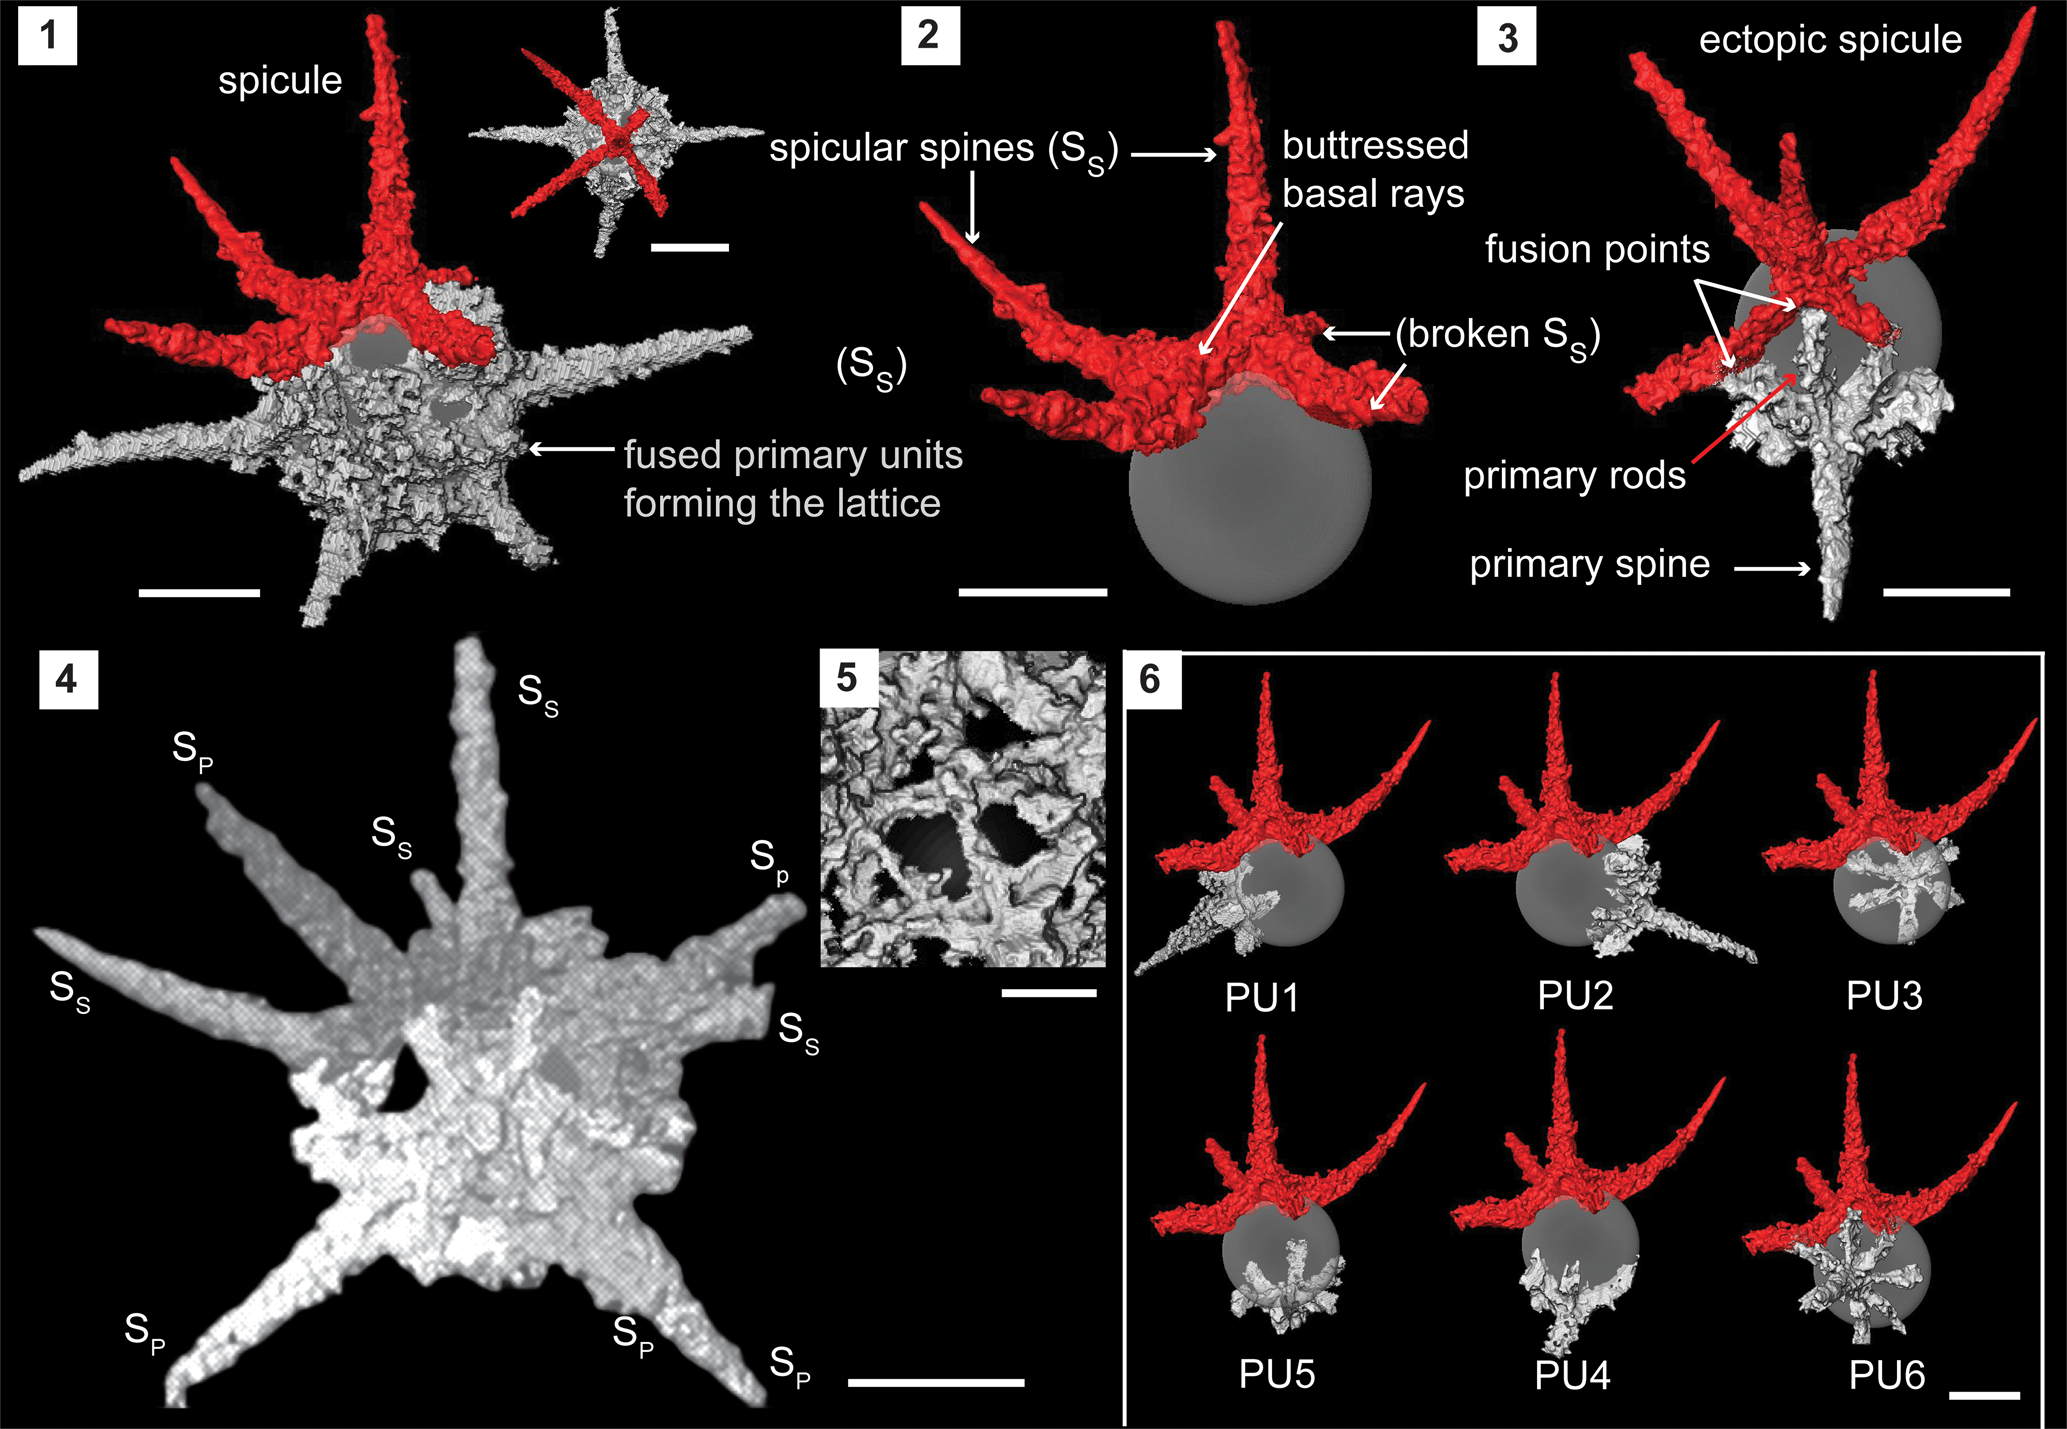
Structural details of Secuicollacta malongulliensis n. sp. highlighted using a micro-CT model (SEES/210512-AB2-SM1). (1) Complete specimen of S. malongulliensis n. sp. observed in two orientations. (2) Ectopically positioned initial spicule. (3) Primary unit highlighting its components and fusion with the spicule. (4) Example of an orientation that could obscure the spicule among the primary units. (5) Cortical shell lattice with polygonal pores. (6) Positions of all six primary units relative to the initial spicule. Gray sphere inserted to aid visualization. SS = spicular spine; SP = primary spine. (1–4, 6) Scale bars = 50 μm; (5) scale bar = 10 μm.
Paratypes
Specimen nos. SEES/210512-AB2-SM2–SM7 (Fig. 2.7–2.12) in the micropaleontology collection of SEES-UQ. Known from Katian limestone beds in the Malongulli Formation, New South Wales, Australia.
Diagnosis
An ectopically placed pentactine spicule fused with five to six primary units to form a hollow, single spherical shell. A coherent mesh fuses the spicule and primary units, resulting in polygonal pores. Spicular and primary-spine lengths are slightly lesser or equal to the shell diameter. By-spines are rarely developed.
Occurrences
Katian in Australia (Webby and Blom, Reference Webby and Blom1986; Noble and Webby, Reference Noble and Webby2009; this paper).
Description
Micro-CT observations show the skeleton is constructed exclusively of a spicule, which includes the initial skeleton and several primary units. On the scanned specimen, the spicule demonstrates a fixed geometry where it comprises five rays positioned nearly perpendicularly to three adjacent spicular rays (Fig. 4.1). All five spicular rays are arranged on two planes where one ray occupies an apical position. The rest of the rays lie on a basal plane perpendicular to the first. All four basal spicular rays develop from the base of the apical spicular ray with rigid buttresses (Fig. 4.2). Beyond where the spicular rays extend from the perimeter of the spherical shell (represented by a hypothetical gray sphere in Fig. 4.2), they rise as independent spines (SS) before inclining toward the apical spicular spine. The degree of inclination varies among specimens. A primary unit is composed of a primary spine (SP) perpendicular to the primary rods that radiate from the base of the primary spine (Fig. 4.3). Individual specimens have five or six primary units (Fig. 4.5). The number of primary rods is generally between five and seven and may differ from unit to unit even within the same specimen (Fig. 4.5). Unlike spicular spines, primary spines are commonly straight (Fig. 4.4). Both spicular and primary spines taper distally while typically growing to within a few micrometers of the shell diameter. Spicular spines are usually longer than primary spines (SS: 100 μm; SP: 92 μm). Primary rods fuse with the neighboring primary rods of adjacent primary units or/and with neighboring spicular rays if present (Fig. 4.3). The coarse lattice developed among the primary units and the spicule initiates at multiple points of the skeletal elements and forms a coherent lattice with polygonal pores (Ø, 10–15 μm) (Fig. 4.5). The diameter of the outer shell ranges between 80 and 120 μm. The spherical shell wall is ~17 μm thick around spine bases and ~2 μm thinner elsewhere. By-spines are very rare and, if present, <5 μm long. The presence of by-spines is likely a random trait and not useful as in the characterization of Silurian secuicollactids.
Etymology
Named after the Malongulli Formation from which the specimens were recovered.
Materials
Sixteen specimens from the Malongulli Formation, New South Wales, Australia. Average measurements are based on six specimens.
Remarks
Substantial secondary overgrowth of authigenic silica on examined specimens may have altered shell thicknesses and pore diameters by ±5 μm (Fig. 2.10, 2.12). Considering the new understanding of the microstructure, a revision of the diagnosis of all Ordovician secuicollactids is encouraged as, at the present state of knowledge, the nature of the spicule is hard to resolve. MacDonald (Reference MacDonald1998) suspected that specimens of S. ornata illustrated by Goto et al., Reference Goto, Umeda and Ishiga1992 have a three-rayed spicule although pentactines are the most common type of spicule found in secuicollactids. In respect to the much-discussed topic of whether secuicollactids have a true ectopic spicule or a special rotasphaerid structure (Furutani, Reference Furutani1990; Wakamatsu et al., Reference Wakamatsu, Sugiyama and Furutani1990; Noble, Reference Noble1994; MacDonald Reference MacDonald1998; Dumitrica et al., Reference Dumitrica, Caridroit and De Wever2000; Won et al., Reference Won, Blodgett and Nestor2002; Jones and Noble, Reference Jones and Noble2006), micro-CT observations support the first hypothesis as the spicule can be readily dissected from the rest of the rotasphaerid structures that are acknowledged herein as primary units following MacDonald (Reference MacDonald1998). The ortho slices (2D projections) show the point of radiation of the five rays although fusion between primary units and spicules makes segmentation challenging. Reexamination will be required to confirm whether all specimens reported from the Upper Ordovician (Webby and Blom, Reference Webby and Blom1986; Renz, Reference Renz1990; Goto et al., Reference Goto, Umeda and Ishiga1992; Noble and Webby, Reference Noble and Webby2009) as secuicollactids have a spicule or not.
The number of primary units should not be a sole criterion for species differentiation as intraspecies variations likely fall within an admissible range. The number of spicular rays and their configuration appears to be relatively constant within any given species. The task of identifying the spicule from among the interconnected primary units is challenging and requires thorough observation (Fig. 4.4). If an initial spicule is prominent, differentiation among species on the basis of test dimensions is not recommended as ontogeny and environmental conditions likely result in intraspecific variation. Meshworks developed from fusion of skeletal elements during late stages of skeletogenesis are distinctive and can be used for characterization together with the spicule availability and their configuration.
Secuicollacta stelligera Renz, Reference Renz1990
Figure 2.13, 2.14
- Reference Renz1990
Secuicollacta stelligera Renz, p. 376, pl. 2, figs. 1, 4, 5.
Holotype
Specimen (MR40 2A, V-8-0) from the Malongulli Formation, New South Wales, Australia (Renz, Reference Renz1990, pl. 2, fig. 5).
Description
Small secuicollactid constructed of an ectopically placed pentactine spicule and up to three primary units. Sphere (Ø, 90 μm) formed by coalescing straight primary and secondary bars in an angular meshwork. Short, tapering primary spines (~45 μm) are straight and slender compared with spicular rays that curve slightly toward the perpendicular spicule ray.
Remarks
Although smaller individuals of S. ornata Goto, Umeda, and Ishiga (Reference Goto, Umeda and Ishiga1992) and S. malongulliensis n. sp. may have shell diameters approaching 80 μm as with S. stelligera, the meshwork of S. stelligera is strongly angular, and it has larger pore spaces compared with other species in the genus. S. stelligera and S. silex Goto, Umeda, and Ishiga (Reference Goto, Umeda and Ishiga1992) may have similar shell diameter, but the length of the primary spines of the latter is almost similar to its sphere diameter whereas spines of S. stelligera are only half of its shell diameter.
Order Entactinaria Kozur and Mostler, Reference Kozur and Mostler1982
Family Entactiniidae Riedel, Reference Riedel1967, emend. Won, Reference Won1997
Genus Wiradjuri new genus
Type species
Wiradjuri subulata Webby and Blom, Reference Webby and Blom1986 (AM.F. 134752) from the Malongulli Formation, New South Wales, Australia (Webby and Blom, Reference Webby and Blom1986, fig. 2.9, 2.10).
Diagnosis
Spherical skeleton with one porous lattice shell, and rarely with members bearing an additional thick spongy layer connected to the lattice. Eccentric median microbar-centered six-rayed initial spicule (up to 11 μm) that continues as six rod-like primary spines with larger diameters.
Occurrence
Katian from Australia (Webby and Blom, Reference Webby and Blom1986; Goto et al., Reference Goto, Umeda and Ishiga1992; Noble, Reference Noble, Cluer, Price, Struhsacker, Hardyman and Morris2000; Noble and Webby, Reference Noble and Webby2009; herein), United States (Renz, Reference Renz1990), China? (Wang and Zhang, Reference Wang and Zhang2011; Zhang et al., Reference Zhang, Luo and Zhang2018), and Russia (Obut, Reference Obut2022).
Etymology
Acknowledging the :Wiradjuri Nation,” the group of First Nations people living in the central New South Wales region from which the type specimen was found.
Remarks
Wiradjuri n. gen. is introduced in this study to include bar-centered, six-rayed, single-shelled entactiniids that are widespread among Katian radiolarian assemblages. Constituent species include Wiradjuri subulata (Webby and Blom, Reference Webby and Blom1986) and Wiradjuri dunhilli (Noble and Webby, Reference Noble and Webby2009). Webby and Blom (Reference Webby and Blom1986) introduced W. subulate as Entactinia subulate, and this usage was followed by Renz (Reference Renz1990) and Noble (Reference Noble, Cluer, Price, Struhsacker, Hardyman and Morris2000). As Entactinia Foreman (Reference Foreman1963) is a junior synonym of Stigmosphaerostylus Rüst, Reference Rüst1982 (Aitchison and Stratford, Reference Aitchison and Stratford1997; Noble et al., Reference Noble, Aitchison, Danelian, Dumitrica, Maletz, Suzuki, Cuvelier, Caridroit, O'Dogherty, Danelian, Caridroit, Noble and Aitchison2017) and these forms have rod-like rather than three-bladed spines, Noble and Webby (Reference Noble and Webby2009) reassigned them within Borisella Afanasieva (Reference Afanasieva2000) along with W. dunhilli, another species with an extra spongy outer layer. However, both these Katian species differ significantly from the Devonian (upper Frasnian) type specimen, Borisella maksimovae Afanasieva, Reference Afanasieva2000. In contrast to the rod-like primary spines of Wiradjuri, Borisella has primary spines with “Y-shaped” basal cross sections similar to other entactiniids with bladed spines and a relatively short median microbar (<8.5 μm). Ordovician radiolarians that have been assigned to Borisella are abundant in Upper Ordovician strata of Australia (Webby and Blom, Reference Webby and Blom1986; Noble and Webby, Reference Noble and Webby2009; herein), the United States (Renz, Reference Renz1990), and Russia (Obut, Reference Obut2022). However, they have no obvious successors until considerably higher in the Upper Devonian. This prolonged stratigraphic hiatus of around 70 million years is not realistic, and reassignment of species that were previously known as Borisella subulata Noble and Webby, Reference Noble and Webby2009 and Borisella dunhilli Noble and Webby, Reference Noble and Webby2009 to the new genus Wiradjuri seems justified. The micro-CT observations reveal diagnostic morphological features associated with the type species, Wiradjuri subulata, that provide a basis for precise identification of Wiradjuri n. gen. in future encounters.
Inanigutta webbyi Wang in Wang and Zhang, Reference Wang and Zhang2011 and Inanigutta jiangsuensis Wang in Wang and Zhang, Reference Wang and Zhang2011 recovered from the upper Katian Wufeng Formation reportedly have a layer of spongy material on top of a latticed shell along with six rod-like primary spines. These could also potentially be members of Wiradjuri n. gen. and may be related to, or even synonymized with, W. dunhilli. However, the structure of their inner elements remains unclear at present.
Wiradjuri subulata (Webby and Blom, Reference Webby and Blom1986)
Figures 2.2, 5; Supplemental Data 3
- Reference Webby and Blom1986
Entactinia subulata Webby and Blom, p. 149, fig. 2.7–2.11.
- Reference Renz1990
Entactinia sp. aff. E. subulata; Renz, p. 370, pl. 1, figs. 4, 6, 8, 10.
- Reference Noble, Cluer, Price, Struhsacker, Hardyman and Morris2000
Entactinia sp. aff. E. subulata; Noble, pl. 1, figs. 5, 6.
- Reference Noble and Webby2009
Borisella subulata; Noble and Webby, p. 555, fig. 4.9.
Holotype
Specimen (AM.F. 134752) from the Malongulli Formation, New South Wales, Australia (Webby and Blom, Reference Webby and Blom1986, fig. 2.9, 2.10).
Description
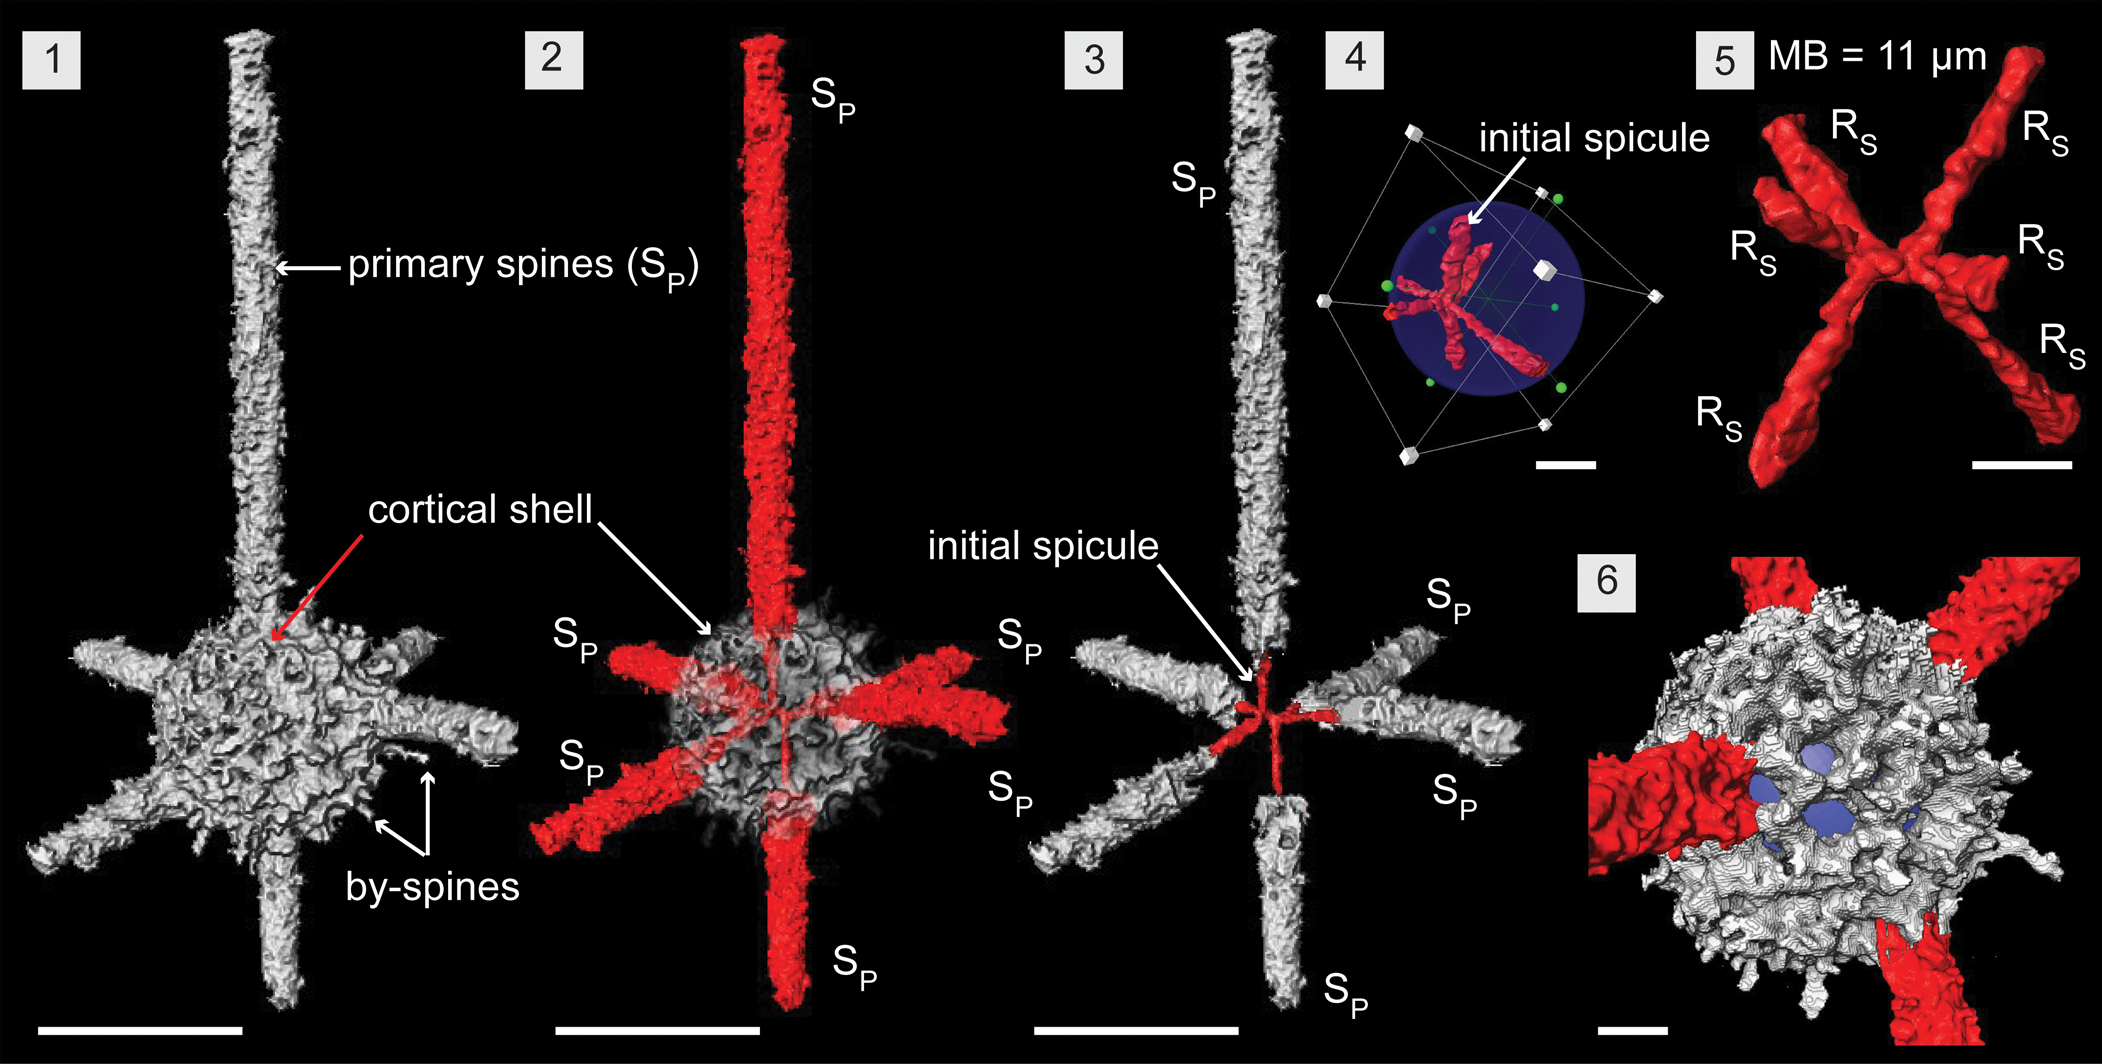
Wiradjuri subulata comprises a six-rayed median microbar-centered spicule, single thick latticed spherical shell, and six rod-like primary spines that are direct continuations of the six rays (Fig. 5.1, 5.2). In the initial skeleton, the spicule is eccentric and constructed of a median microbar (MB) of 11 μm in length. Three spicular rays (RS) initiate from each end of the MBs and continue until they meet the lattice shell. Rays are about 5 μm in diameter and range from 20 to 50 μm long depending on the position of the spicule inside the shell (Fig. 5.4, 5.5). Configuration of the rays is not definitive, but most specimens have a ray from both ends of the MB developing in an apical and anti-apical direction. The remaining four rays are arranged nearly perpendicular and close to being in a single plane (Fig. 5.3). The hollow, thick-walled (10–15 μm), porous, latticed, spherical shell (~Ø, 125 μm) exhibits subspherical to subangular pores of varying sizes (10–15 μm) (Fig. 5.6). Upon surfacing, slender spicular rays convert to massive rod-like primary spines with a base diameter of ~25 μm and median diameter of 20 μm for the rest of their length (Fig. 5.3). These may develop straight or slightly curved and terminate with tapered ends that can be curved, bifurcated, or straight. Rare, thin by-spines up to 20 μm long may develop from pore frames (Figs. 2.2, 5.1).
Structural details of Wiradjuri subulata highlighted using a micro-CT model (SEES/210512-AB2-WS1). (1, 2) Complete specimen of W. subulata. (3) Direct continuation of spicular rays as primary spines. (4) Eccentric position of the initial spicule within the shell. (5) Initial spicule highlighting components: median microbar and six spicular rays. (6) Shell lattice with subrounded pores. Blue spheres inserted to aid visualization in (4, 6). RS = spicular ray; SP = primary spine. (1–3) Scale bars = 100 μm; (4–6) scale bars = 25 μm.
Remarks
Wiradjuri subulata exhibits a high degree of intraspecific variation, mainly in the shape of primary spines. Observed specimens do not exhibit spine torsion or bifurcation of their distal ends. As observation of the initial spicule is highly subject to taphonomy, W. subulata with straight spines may be confused with juveniles of I. complanata Nazarov and Ormiston (Reference Nazarov and Ormiston1984), which also have a very delicate internal structure.
Family Palaeoscenidiidae Riedel, Reference Riedel1967 emend. MacDonald, Reference MacDonald2004
Genus Palaeoephippium Goodbody, Reference Goodbody1986
Type species
Palaeoephippium bifurcum Goodbody, Reference Goodbody1986 (UA 7155) from the Cape Phillips Formation, Cornwallis Island, Canadian Arctic Archipelago by original designation.
Palaeoephippium octaramosum Renz, Reference Renz1990
Figure 6; Supplemental Data 4
- Reference Webby and Blom1986
Entactiniidae n. gen. n. sp. A; Webby and Blom, p. 150, fig. 2.1.
- Reference Webby and Blom1986
aff. Entactiniidae n. gen. n. sp. A; Webby and Blom, p. 150, fig. 2.2.
- Reference Webby and Blom1986
Entactiniidae n. gen. n. sp. B; Webby and Blom, p. 150, fig. 2.3–2.6.
- Reference Webby and Blom1986
?Entactiniidae n. gen. n. sp. B; Webby and Blom, p. 150, fig. 3.2.
- Reference Webby and Blom1986
Entactiniidae (incerti generis) sp. 1; Webby and Blom, p. 151, fig. 3.3.
- Reference Renz1990
Palaeoephippium octaramosum Renz, p. 370, pl. 3, figs. 1–3.
- Reference Renz1990
Palaeotripus sexabrachiatus; Renz, p. 376, pl. 3, figs. 5, 7.
- Reference Renz1990
Palaeotrifidus ballator; Renz, p. 374, pl. 3, figs. 4, 6, 8–10.
- Reference Noble and Webby2009
Palaeoephippium octaramosum; Noble and Webby, p. 555, figs. 4.13–4.16, 6.12.
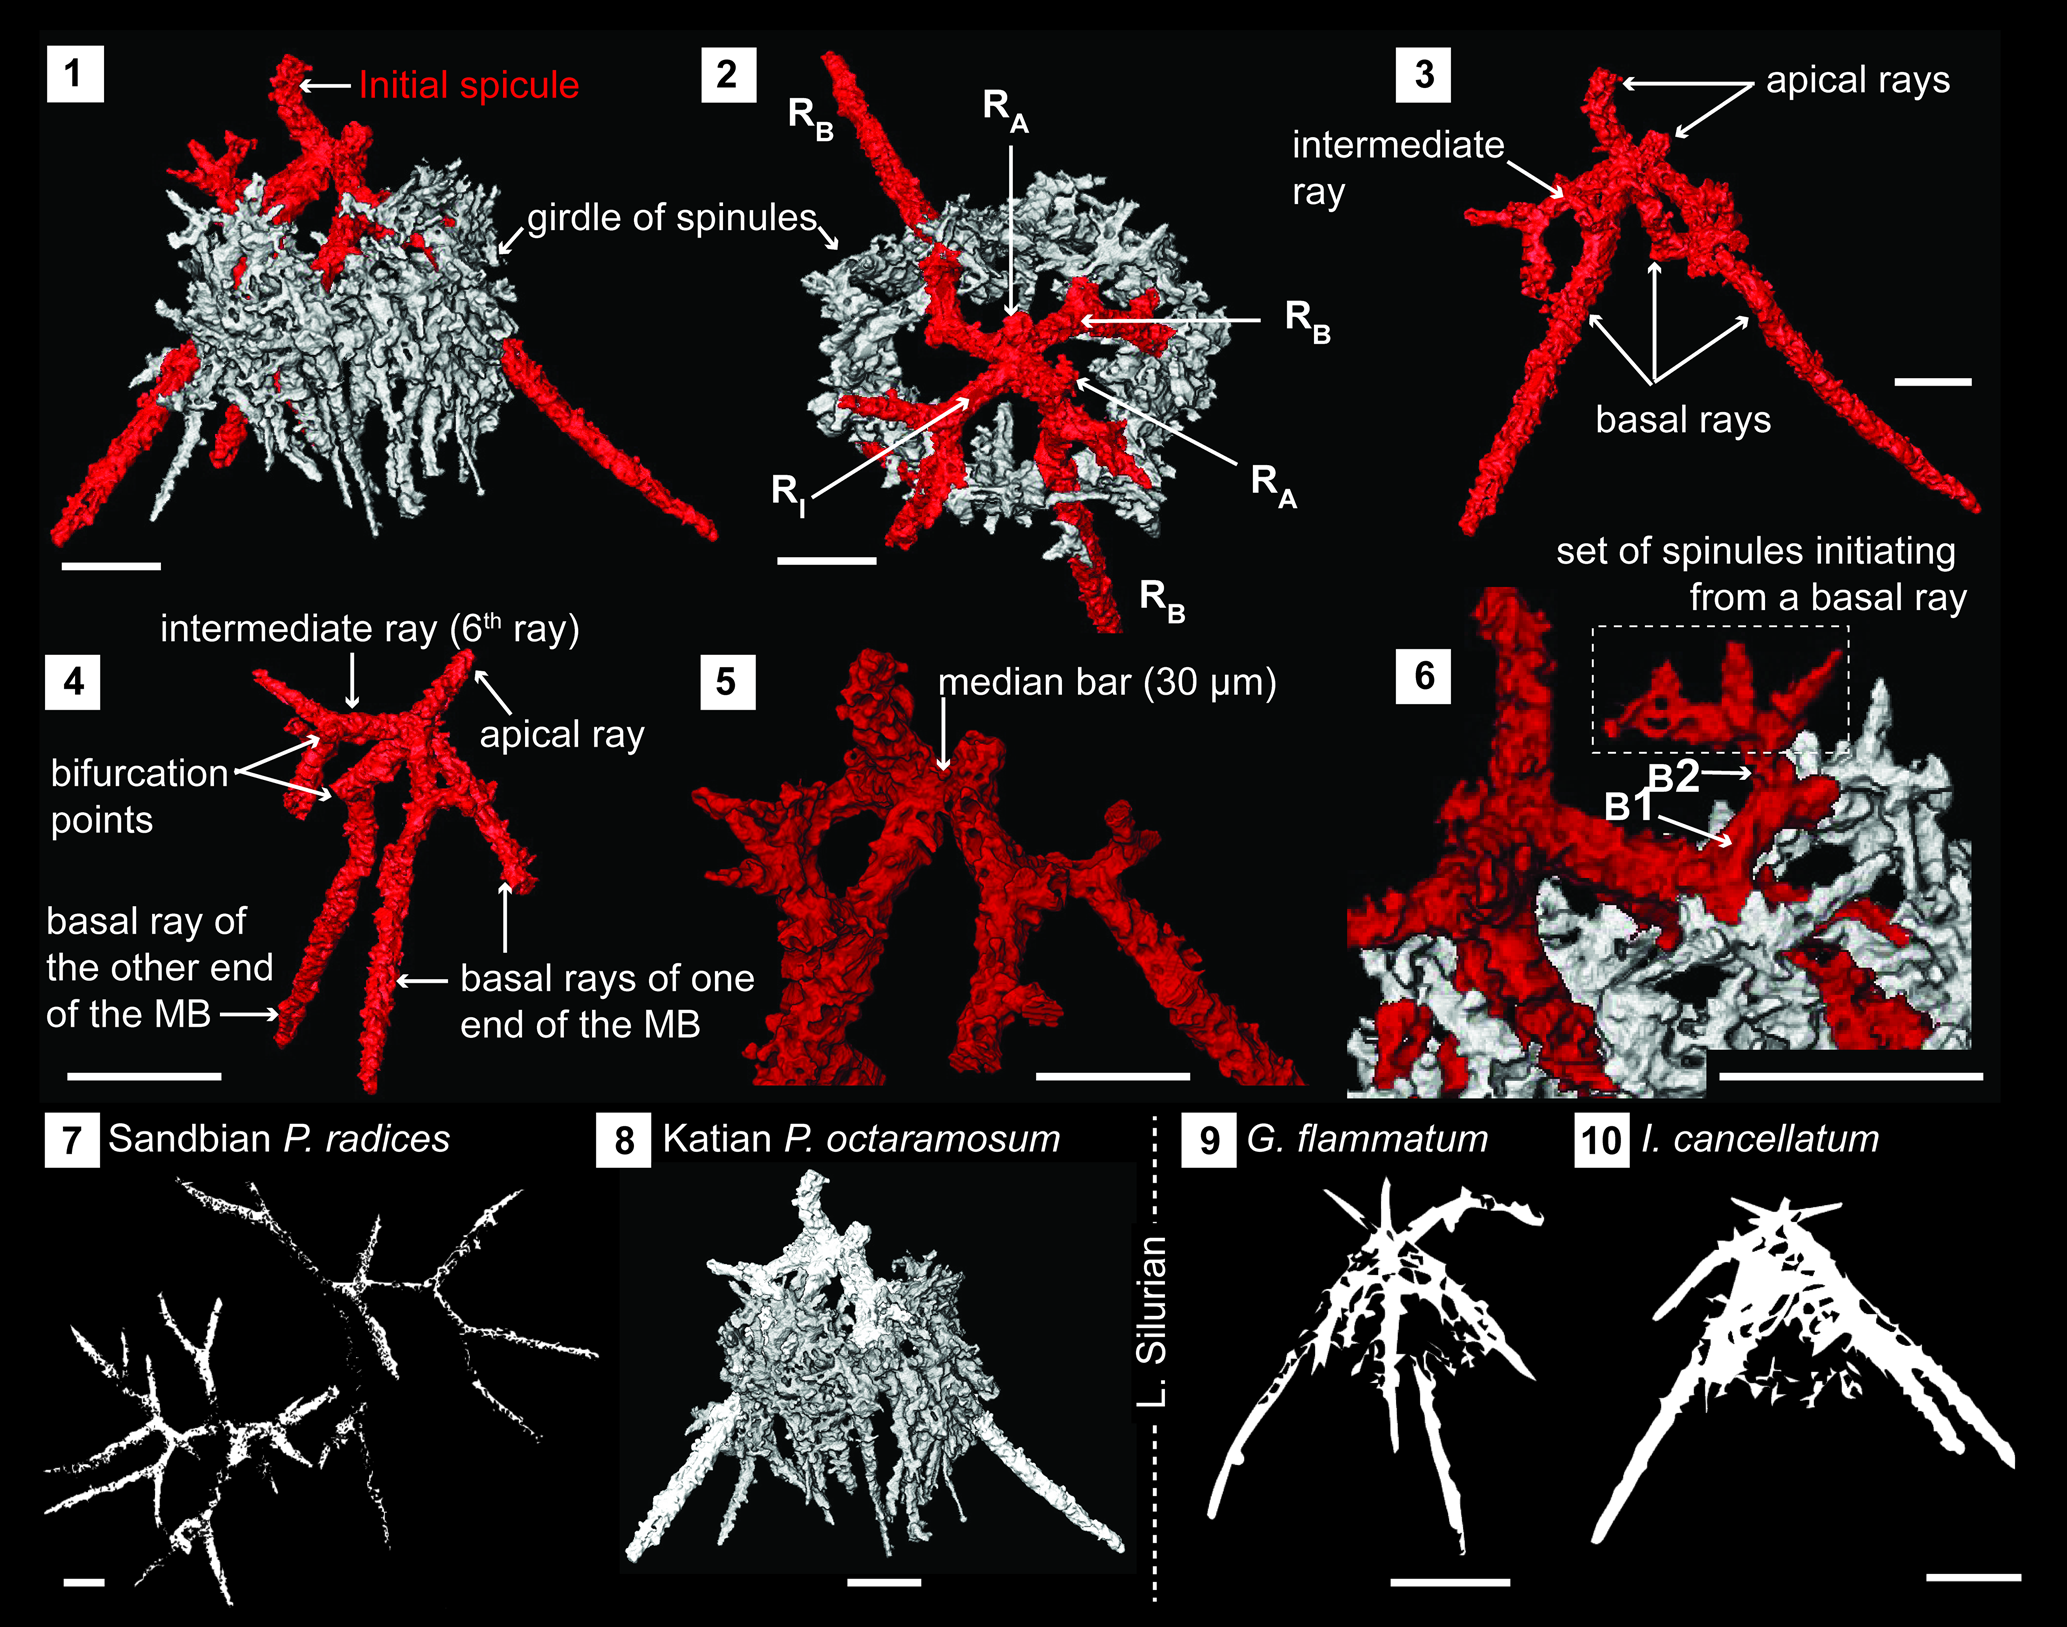
Structural details of palaeosceniids highlighted using a micro-CT model (SEES/210512-AB2-PO1). (1, 2) Complete specimen of Palaeoephippium octaramosum as seen in two orientations highlighting the skeletal elements. (3, 4) Initial spicule with specified ray arrangement and showing points of bifurcations. (5) Median bar. (6) Origination of spinules from first-order and second-order bifurcations. (7–10) Immediate phylogenetic affiliations indicating a possible evolutionary pathway from Sandbian to Llandovery forms. (7) Retraced from Perera and Aitchison (Reference Obut2022, fig. 12.9, 12.10). (9, 10) Retraced from MacDonald (Reference MacDonald2004, fig. 2.1, 2.9, respectively). RA = apical ray; RB = basal ray; RI = intermediate ray; B1 = first-order bifurcation; B2 = second-order bifurcation. Scale bars = 50 μm.
Holotype
Specimen (MR40 2H, 0–39–0) from Hanson Creek Formation, Nevada, USA (Renz, Reference Renz1990, pl. 3, fig. 3).
Description
Skeleton constructed of a six-rayed initial spicule with an encircling girdle of spinules (Fig. 6.1, 6.2). Of the spicule's six rays, three radiate from each end of a short 30 μm long median bar. Two of the six rays are in an apical position and extend from either end of the median bar (Fig. 6.3, 6.5). These are rod-like, generally slightly curved, and taper toward their distal end with or without bifurcation. Length varies but is usually less than half that of the basal rays. There are three basal rays, two of which initiate from one end of the median bar, with the other starting from the opposite end (Fig. 6.4). All are rod-like and have a first bifurcation within the initial 30–35 μm from the median bar. Resultant branches continue to bifurcate at least once before terminating at pointed ends (Fig. 6.4). After the first bifurcation, multiple spinules develop off basal rays until all fuse densely to form an encircling girdle (Fig. 6.6). The sixth ray of the spicule could be in an intermediate position as in the scanned specimen (Fig. 6.3, 6.4) or in a basal position or an apical position. Regardless of the position of this sixth ray, it could bifurcate, although this is less common when it occupies an apical position.
Remarks
The third apical ray reported in specimens of Palaeotripus sexabrachiatus Renz (Reference Renz1990) (presently a synonymy of P. octaramosum) is an example of the sixth spicular ray taking the apical position. Specimens figured and described as P. octaramosum by Renz (Reference Renz1990) reflect how this sixth ray can develop as a regular basal ray. Therefore, judging from all previous reports, the entire population of P. octaramosum demonstrates a high degree of intraspecies morphological variation driven primarily by the position of the sixth spicular ray. Systematics of the Palaeoscenidiidae are currently applied with an assumption that the existence of a similar geometric configuration is not necessarily indicative of a true phylogenetic relationship (MacDonald, Reference MacDonald2004). Therefore, the key to understanding the generic affiliation of any given palaeoscenid is to properly differentiate the basic morphological features: the median bar/point, apical rays, basal rays, intermediate rays, and spinules. Differentiation among ray types is challenging under some circumstances. For an example, if intraspecies variations cause the intermediate ray to attain a basal position as in species of Insolitignum MacDonald, Reference MacDonald1999, it promptly falls within the diagnosis of Palaeoephippium, resulting in potential confusion in generic assignment. The scanned specimen of Palaeoephippium octaramosum exhibits a similar scenario as one of the four basal rays takes an intermediate position. In addition, the specimen has two basal rays and an apical ray extending from one end of the median bar while the other end has a basal ray and an apical ray along with the ray in question, also satisfying the requirement for Insolitignum. This ray positioning is not uncommon as Noble and Webby (Reference Noble and Webby2009) mention that some specimens possess a ray in an intermediate position. Apart from the ray positioning, spinule development from basal rays to form a net-like tent is a characteristic of Insolitignum whereas Palaeoephippium is distinguished by ray branching. Palaeoephippium octaramosum strongly displays both these characteristic features and could be on an evolutionary pathway between the structurally simple Sandbian palaeoephipids that branch or bifurcate readily (e.g., P. radices Goodbody in Perera and Aitchison, Reference Perera and Aitchison2022) and lower Silurian Insolitignum (e.g., I. cancellatum Goodbody, Reference Goodbody1986) and Goodbodium Furutani, Reference Furutani1990 (e.g., G. flammatum Goodbody, Reference Goodbody1986) types of genera with development of a prominent network of spinules (Fig. 6.7).
Genus Palaeopyramidium Goodbody, Reference Goodbody1986
Type species
Palaeopyramidium spinosum Goodbody, Reference Goodbody1986 (UA 7136) from the Cape Phillips Formation, Cornwallis Island, Canadian Arctic Archipelago by original designation.
Palaeopyramidium sp. A
Figure 2.6
Description
Point-centered skeleton composed of one apical ray and possibly four basal rays. Apical ray is pointed and oriented at 135° angle to the basal rays. Basal rays (~165 μm) are longer than the apical ray (~106 μm) and have blunt distal ends. Numerous spinules are present toward the proximal end of basal rays and visibly gather at the point center from which all rays diverge. Spinules are curved and arranged as a skirt around the basal rays and may extend up to two-thirds of the basal ray length. Maximum width of the basal hemisphere is 240 μm.
Remarks
The single specimen encountered is not adequate for a species determination. Assignment at genus level is confident as, in addition to other diagnostic features, the angle maintained between the apical ray and basal rays is that of the type species P. spinosum Goodbody, Reference Goodbody1986. The existence of a fourth basal ray is difficult to resolve among the spinules but can be assumed on the basis of the arrangement of the other three basal rays. A thick skirt of spinules is unique to this Ordovician form as all known Silurian and Devonian species of Palaeopyramidium demonstrate very weak to moderate development of spinules.
Genus Procyrtis Li, Reference Li1995
Type species
Procyrtis rustii Li, Reference Li1995 (BGIN 920321) from the Baijingsi complex, Qilian Mountains, Qinghai Province, China, by original designation.
Procyrtis rustii Li, Reference Li1995
Figure 2.5
- Reference Li1995
Procyrtis rustii Li, p. 336, pl. 1, figs. 12, 17.
Holotype
Specimen (BGIN 920321) from Baijingsi of Qinghai, China (Li, Reference Li1995, pl. 1, fig. 17).
Description
Campanulate shell composed of a cephalis with an aperture and bifurcated rays extending from within. The upper cone-shaped segment or “cephalis” (vertical length = 95 μm) is composed of a shell open at the bottom with an aperture diameter of ~110 μm. The structure of the uppermost section of the cephalis is unclear due to poor preservation, and the existence of a horn (Li, Reference Li1995) is uncertain. Rays or “feet” of the specimen start bifurcating within their first 30 μm. They initiate as rods and taper after the first bifurcation to terminate with pointed ends. Rays may extend up to 150 μm long.
Remarks
One specimen was recovered from the Angullong locality in the Malongulli Formation. The original type material (BGIN 920321) has been destroyed (L. Hui, personal communication, 2020). Procyrtis qinglaii Li, Reference Li1995 can be differentiated from P. rustii as the former has a short cephalis (maximum vertical height = 78 μm) with a smaller aperture diameter (51–78 μm). Assignment within the Palaeoscenidiidae by Noble et al. (Reference Noble, Aitchison, Danelian, Dumitrica, Maletz, Suzuki, Cuvelier, Caridroit, O'Dogherty, Danelian, Caridroit, Noble and Aitchison2017) should be regarded as tentative until such time as a point center or a median bar can be confirmed within the cephalis from which the rays originate.
Order Spumellaria Ehrenberg, Reference Ehrenberg1876
Family Haplotaeniatidae Won, Blodgett, and Nestor, Reference Won, Blodgett and Nestor2002
Genus Haplotaeniatum Nazarov and Ormiston, Reference Nazarov and Ormiston1993
Type species
Haplotaeniatum labyrintheum Nazarov and Ormiston, Reference Nazarov and Ormiston1993 (GIN 4679/33) from the Sakmarskaya Suite, Southern Urals, Russia, by original designation.
Haplotaeniatum fenestratum Goto, Umeda, and Ishiga, Reference Goto, Umeda and Ishiga1992
Figure 7; Supplemental Data 5
- Reference Goto, Umeda and Ishiga1992
Haplotaeniatum fenestratum Goto, Umeda, and Ishiga, p. 158, pl. 7, figs. 1–3.
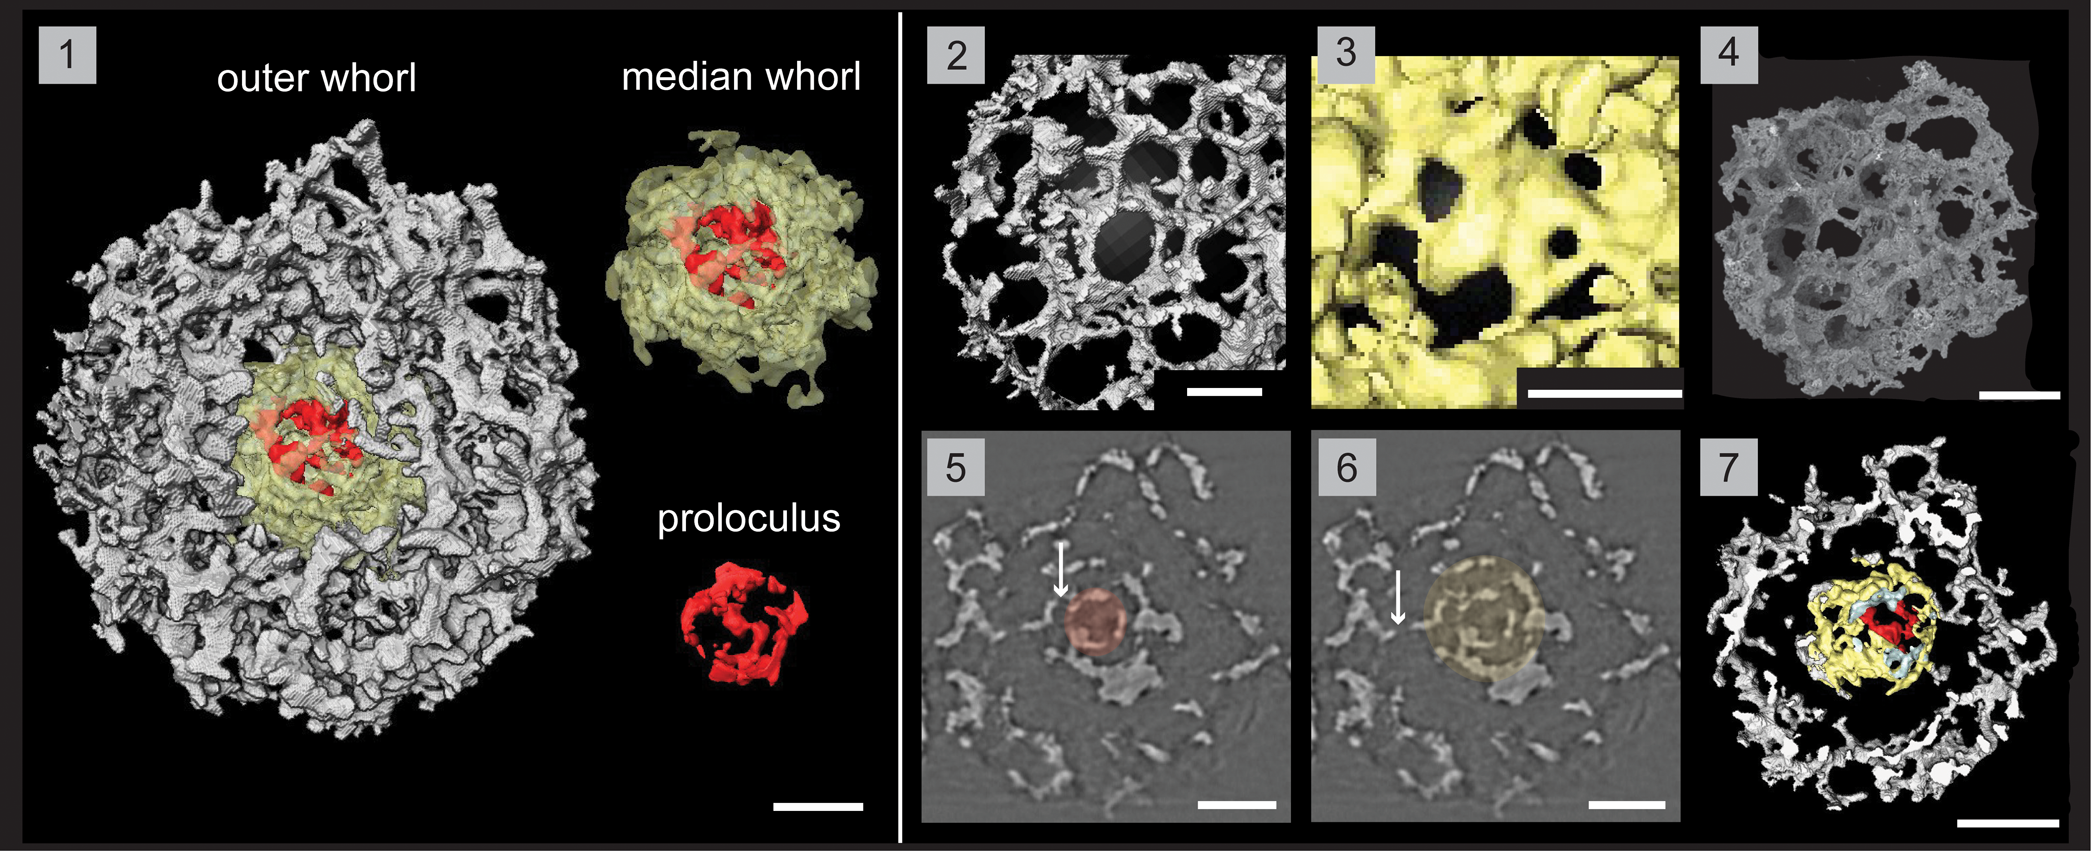
Structural details of Haplotaeniatum fenestratum highlighted using a micro-CT model (SEES/210512-AB2-HF1). (1) Complete specimen with separated whorls and proloculus. (2) Outer whorl labyrinth with larger pores and higher pore density. (3) Median whorl labyrinth with small pores. (4) SEM image of H. fenestratum (SEES/210512-AB2-HF2). (5) Original micro-CT image slice highlighting the proloculus. (6) Original micro-CT image slice highlighting the median whorl. (7) Cross section showing the space maintained between median and outer whorls. Arrows in (5) and (6) indicate connecting bars between whorls. (1, 2) Scale bars = 25 μm; (3) scale bar = 15 μm; (4–7) scale bars = 50 μm.
Holotype
Specimen (DGSU PR 1070) from the Malongulli Formation, northwest of Taralga, New South Wales, Australia (Goto et al., Reference Goto, Umeda and Ishiga1992, pl. 7, fig. 1).
Description
A typical haplotaeniatid constructed of a proloculus and at least two whorls that are distinctly separated and without any primary or secondary spines. Slightly eccentric proloculus is not a complete spheroid yet exhibits a spherical outline with a maximum diameter of 38 μm in selected orientations (Fig. 7.1). The median whorl may reach double the size of the proloculus (60–82 μm) and is constructed of an irregularly porous, thick mesh different from the outer layers (Fig. 7.1, 7.3). Median whorl is closer to the proloculus than to the adjacent layer of the outer whorl as a space is maintained between them (Fig. 7.7). Coarse labyrinth of the outer whorl creates large pores with thin pore frames (3 μm) except at pore junctions. The majority of the subrounded pores lie within a diameter range of 15–30 μm with occasional small pores (Ø, 5–15 μm) (Fig. 7.2). Pore density of the outer whorls is very high compared with the median whorl. Whorls are interconnected at multiple points via small connecting bars (Fig. 7.5, 7.6). Clearly separated levels are not prominent in the outer whorl although the volume is much greater than that of the median whorl. The diameter of the spheroidal specimen ranges from 160 to 175 μm.
Remarks
The terminology used by Goto et al. (Reference Goto, Umeda and Ishiga1992) to describe their specimen is indicative of an approach where haplotaeniatids are considered to be spicular radiolarians. With the best understanding about the inner structure revealed through recent micro-CT observations, Haplotaeniatum is now considered to be a spumellarian. Less-distinct layering within the whorls is probably because H. fenestratum lacks spines, which define the levels of layering by developing apophyses along their lengths. Thus, the volume of the skeleton is developed with the help of multiple link points that extend as arches or bridges by initiating a new layer on top of their base layers. More points of linkage can be observed in the layers of H. fenestratum than on proloculi of other spinose haplotaeniatids.
Haplotaeniatum prolatum Noble and Webby, Reference Noble and Webby2009
Figure 8; Supplemental Data 6
- Reference Noble and Webby2009
Haplotaeniatum prolatum Noble and Webby, p. 557, figs. 5.4–5.6, 6.9, 6.10.
Structural details of Haplotaeniatum prolatum highlighted using a micro-CT model (SEES/210512-AB2-HP1). (1) Complete specimen. (2) H. prolatum highlighting its interior configuration of skeletal elements. (3) Primary spines emanating from the proloculus. (4) Original micro-CT image slice showing the whorls initiating as apophyses of spines. The arrow indicates a connecting bar between proloculus and the first whorl. SP = primary spine; SS = secondary spine. Scale bar = 50 μm.
Holotype
Specimen (AM.F.135567) from the Malongulli Formation, New South Wales, Australia (Noble and Webby, Reference Noble and Webby2009, fig. 5.4).
Description
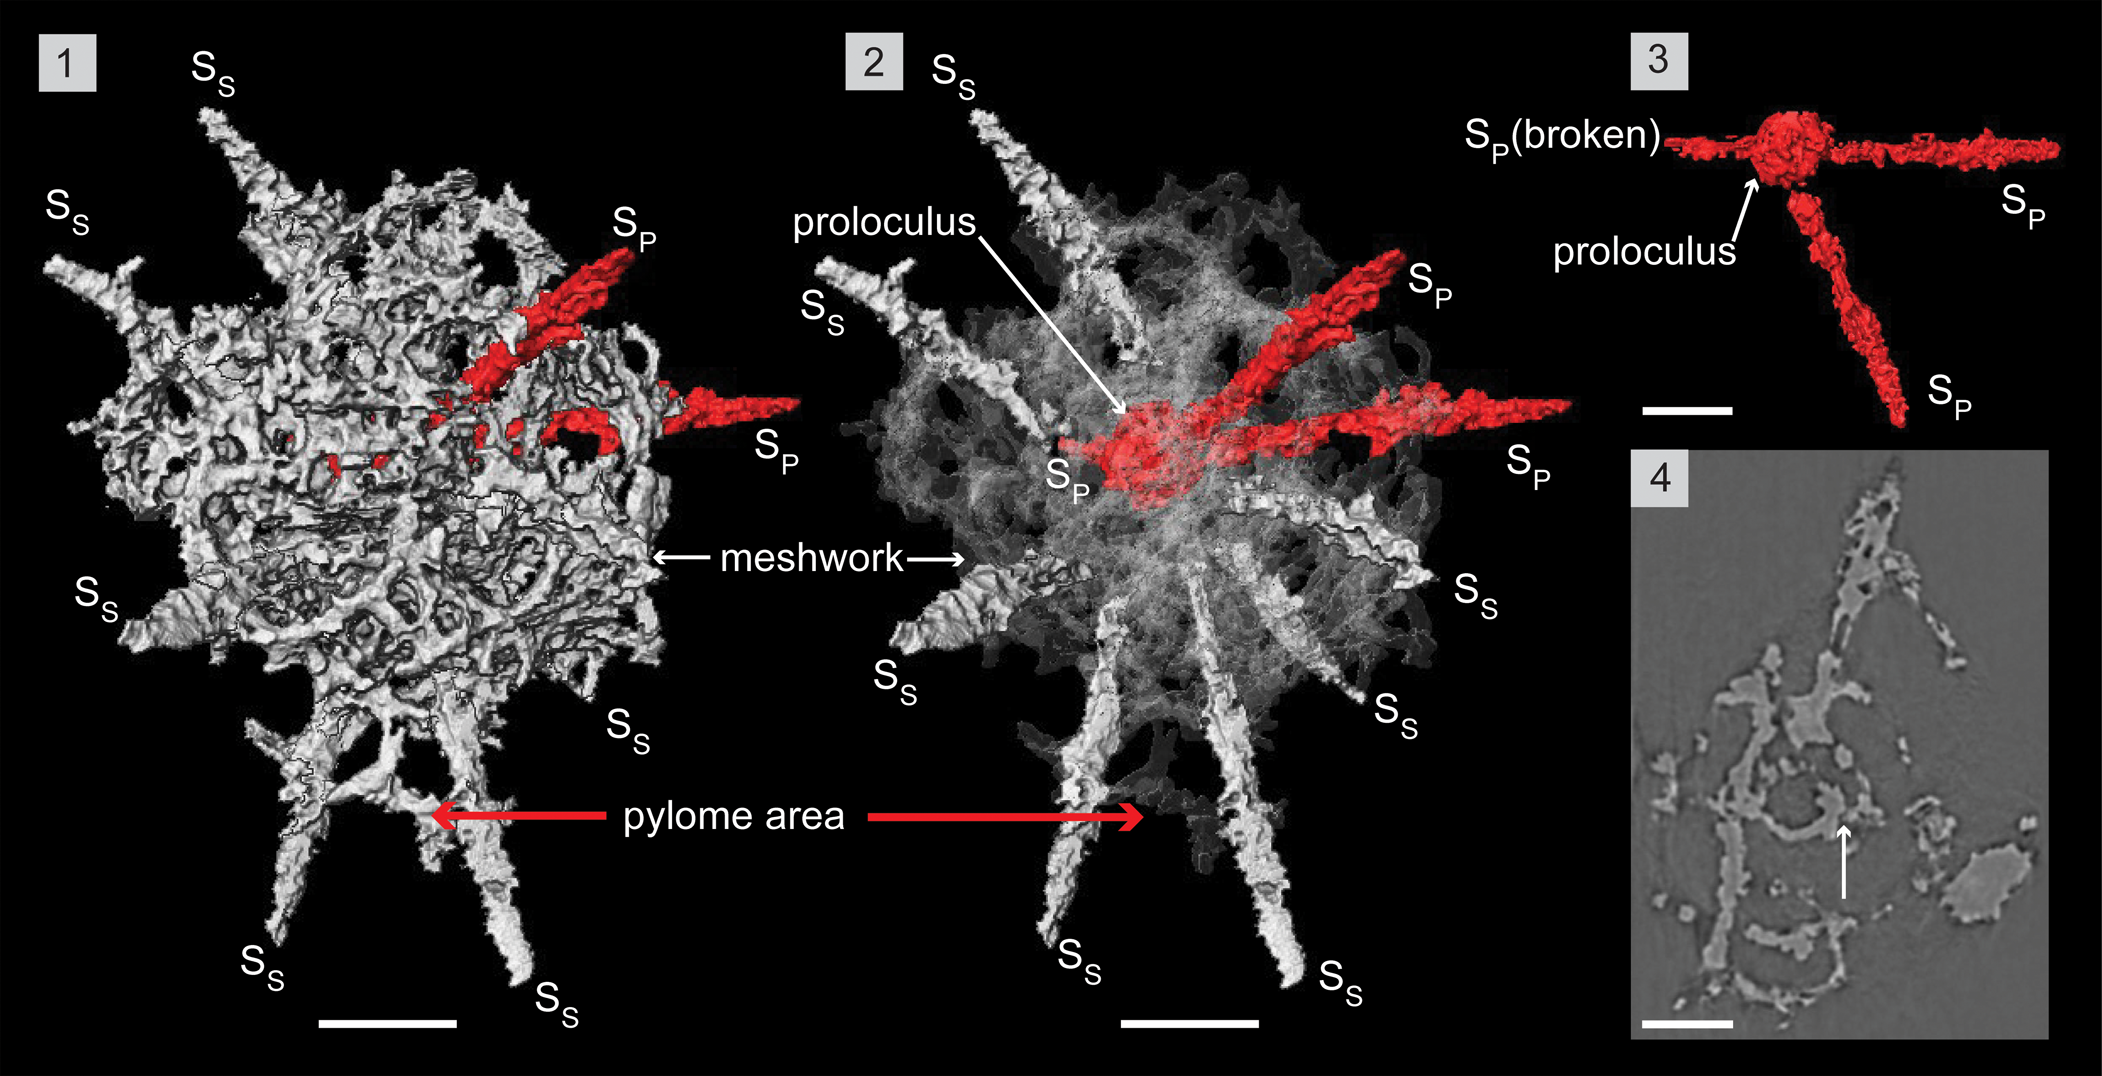
The micro-CT reconstruction of Haplotaeniatum prolatum reveals it is constructed of a proloculus from which at least three primary spines (SP) emanate and initiate a labyrinthine meshwork of whorls that randomly give rise to secondary spines (SS). The proloculus (Ø, ~38 μm) is slightly eccentric and consists of bars that resemble a spheroid (Fig. 8.1). Three rod-like primary spines originate and radiate in a random configuration from the proloculus, which gradually tapers toward the distal end (Fig. 8.3). Multiple apophyses located at several levels of the primary spines produce a labyrinthine meshwork that engulfs the proloculus and approximately two-thirds of most of the spines. The diameter at the proximal end of the primary spines is about 5–10 μm, and observation of the delicate linkages with the proloculus is subject to preservation. Apart from these primary spines, the proloculus also develops a few short connecting bars to the nearest whorl of the meshwork (see arrow in Fig. 8.4). Apophyses toward the most proximal end of the primary spines collectively initiate the closest whorl of the meshwork and continue through each level of apophyses. A specimen may display whorls established via three to four discontinuous levels (Fig. 8.4). Secondary spines develop from random points on the whorls and become part of whorls by creating apophyses that densify the meshwork (Fig. 8.2). In general, both secondary and primary spines develop to a length of ~50 μm beyond the outer seam of the shell. The meshwork at one end commonly develops further toward the distal ends of two to four neighboring spines, incorporating them to create a pylome (Fig. 8.1, 8.2). This extension may appear as a “passage” in fully developed individuals. Subcircular to oval pores range in size (5–30 μm) and develop between thin (~4 μm), flat pore frames. Some pore frames appear as arches when pores are bigger and mostly located close to the seam of the shell. This 3D meshwork is approximately 170–200 μm at its widest.
Remarks
The specimen used for the micro-CT observation is possibly a juvenile of H. prolatum. This inference is based on the incompletely developed passage that is still in the initial stages of incorporating neighboring spines.
As described by Goto et al. (Reference Goto, Umeda and Ishiga1992), the diameter of the “most internal sphere” of Haplotaeniatum spinatum is 40 μm, and the number of spines (two to four) emanating from the most inner shell (probably the proloculus) can be matched with the specimen examined in this investigation. Other shell dimensions of H. spinatum support this, and it is recommended that it be removed from the H. spongium combination erected by Noble and Webby (Reference Noble and Webby2009) and placed within H. prolatum. Secondary spine development seems unrestrictive compared with that of primary spines, and the latter are fixed or at most vary within a very narrow range. Once both primary and secondary spines pass through the shell flanks, differentiation is not possible, and the number of spines finally emanating beyond the shell seam may be insufficient to distinguish Haplotaeniatum at species level. Development of the narrow passage associated with the pylome may be a characteristic trait of the H. prolatum although Won et al. (Reference Won, Blodgett and Nestor2002) considered the pylome of haplotaeniatids as an inconsistent taxonomic feature individualized to the specimen being observed.
Haplotaeniatum spongium (Renz, Reference Renz1990)
Figure 9; Supplemental Data 7
- Reference Renz1990
Entactinia? spongia Renz, p. 369, pl. 1, figs. 1–3.
- Reference Goto, Umeda and Ishiga1992
Haplentactinia attenuata Goto, Umeda, and Ishiga, p. 156, pl. 5, fig. 2, 3.
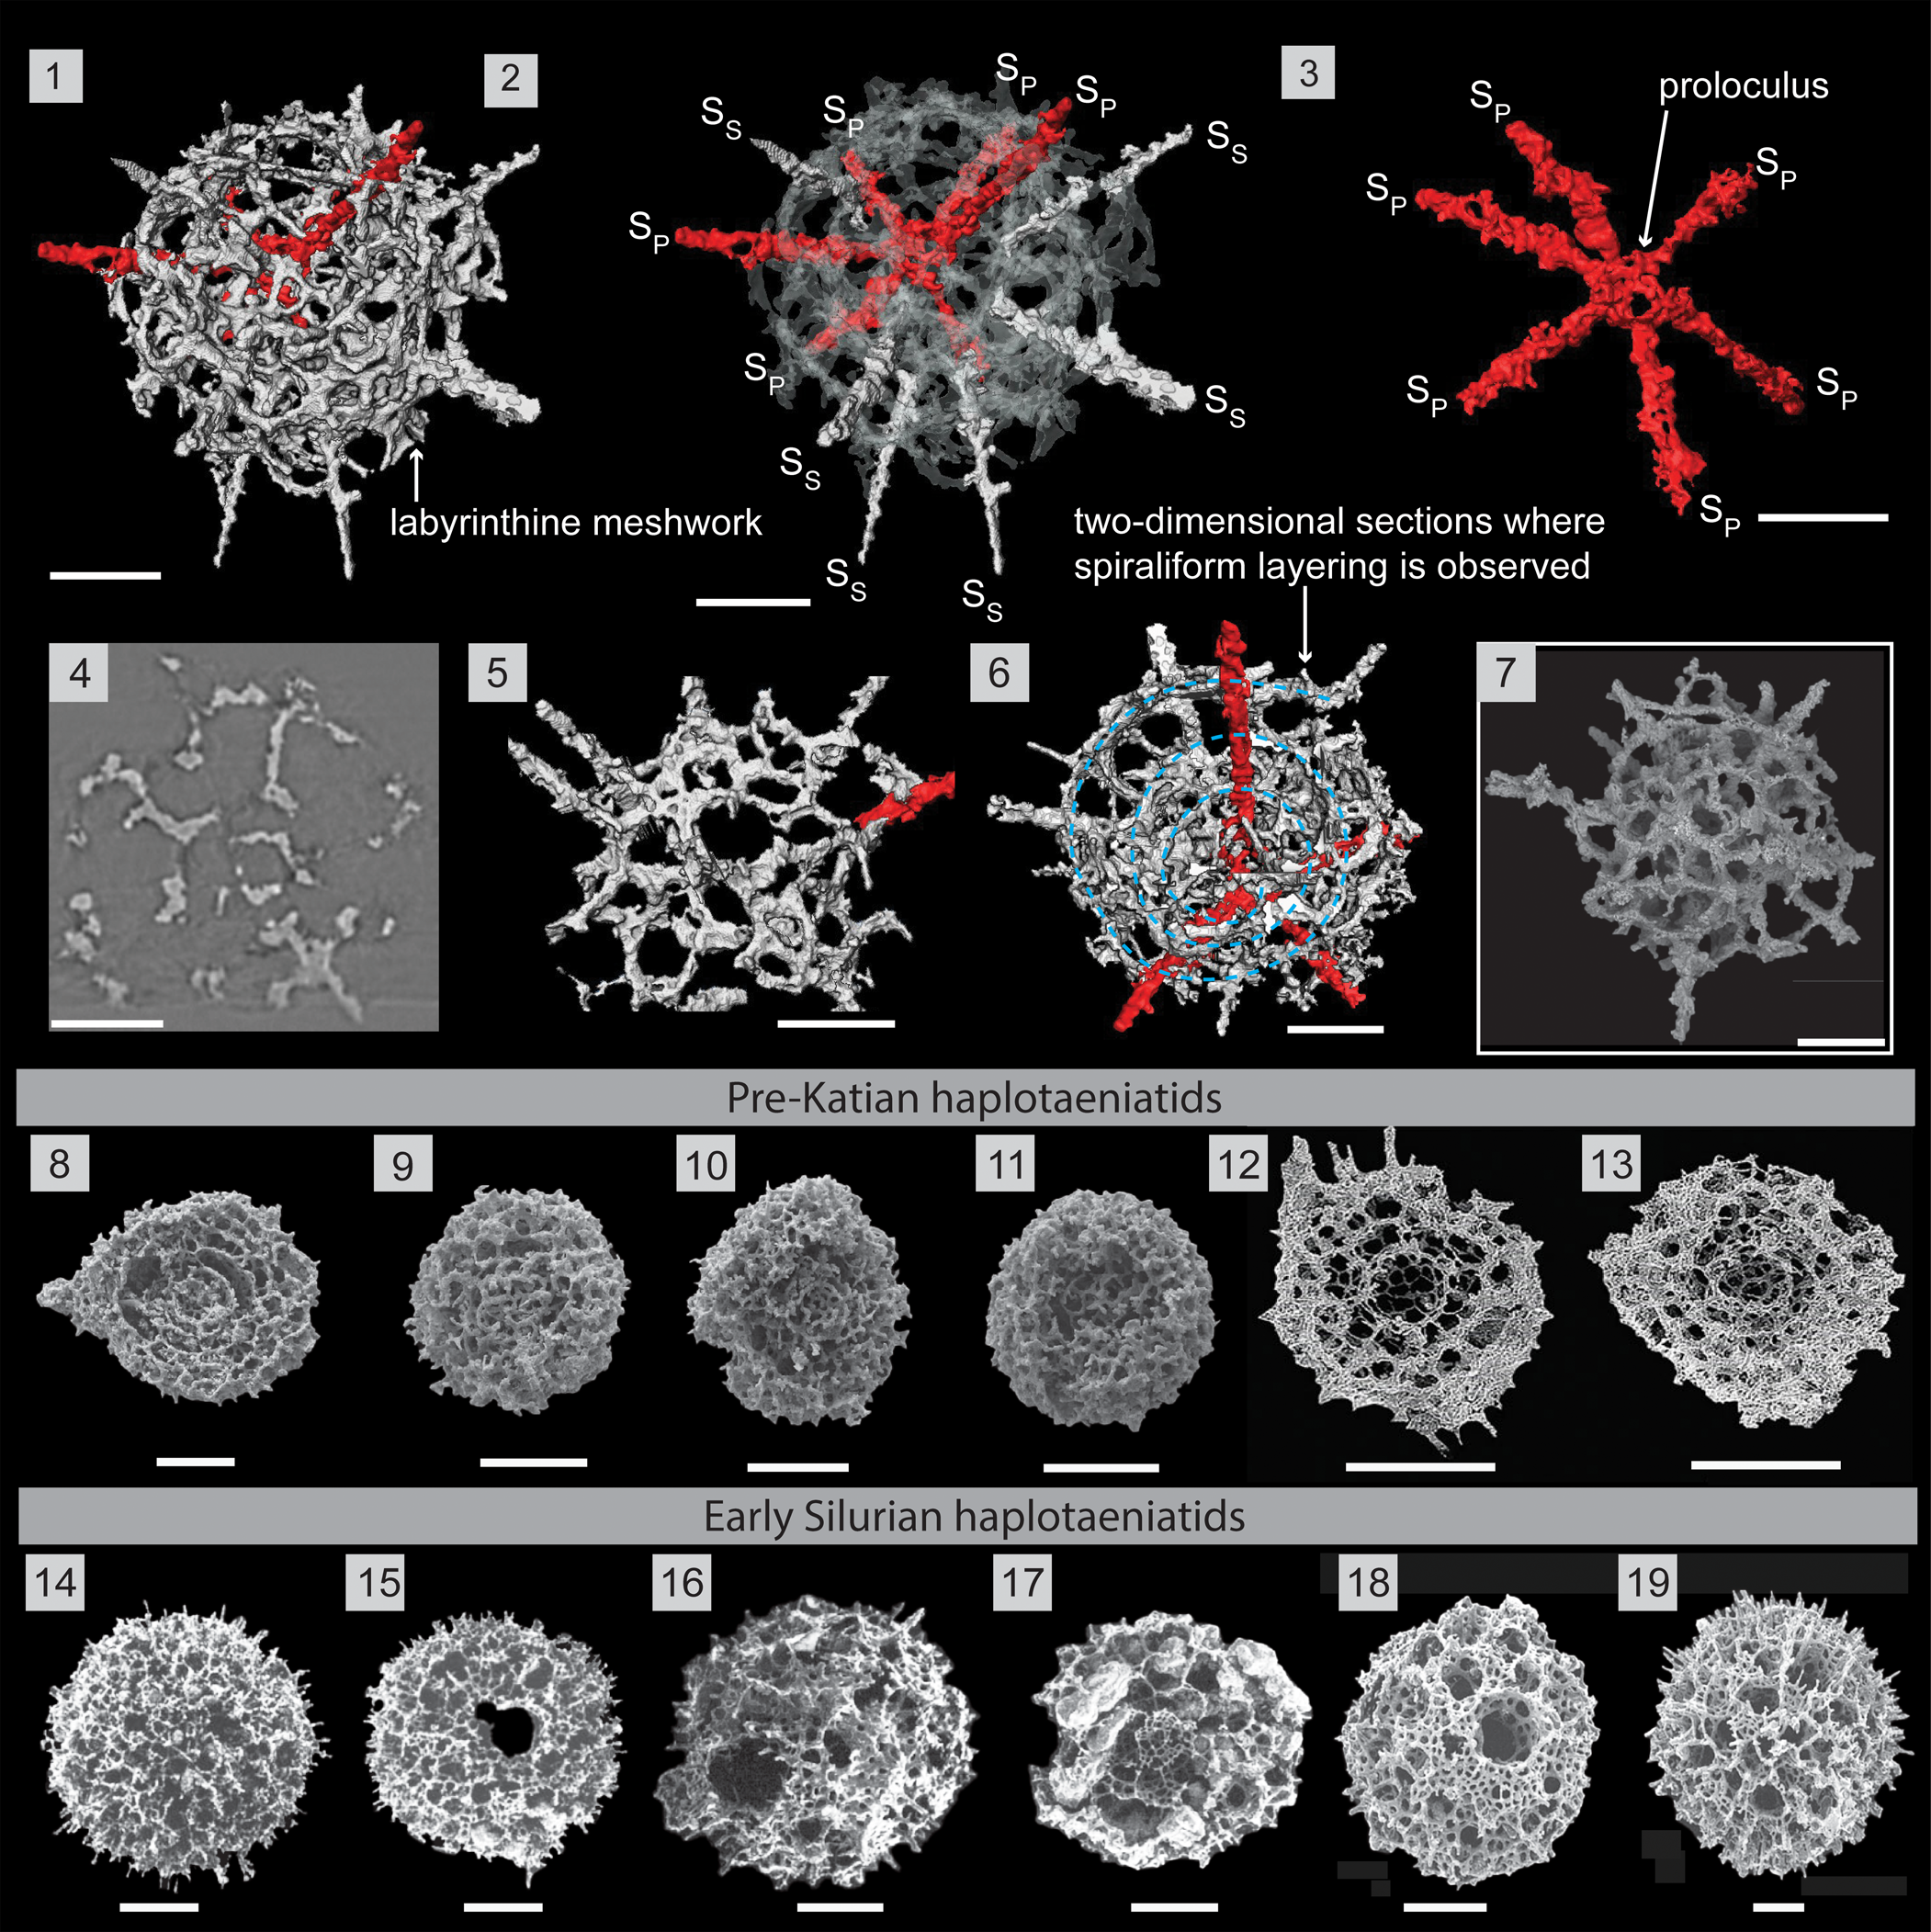
Structural details highlighted using a micro-CT model of Haplotaeniatum spongium (SEES/210512-AB2-HS1). (1) Complete specimen. (2) H. spongium indicating the interior configuration of skeletal elements. (3) Primary spines emanating from the proloculus. (4) Original micro-CT image slice showing the loose labyrinthine nature. (5) Outer whorl labyrinth with larger pores. (6) Specimen oriented to highlight two-dimensionality across a section where spiraliform layering (indicated by blue dashed lines) is observed. (7) SEM image of H. spongium (SEES/210512-AB2-HS2). (8–13) Pre-Katian haplotaeniatids. SEM images: (8–11) Pouille et al. (Reference Pouille, Danelian and Popov2014); (12, 13) Kachovich and Aitchison (Reference Kachovich and Aitchison2020). (14–19) Early Silurian haplotaeniatids. SEM images: (14, 15) Umeda and Suzuki (Reference Umeda and Suzuki2005); (16, 17) Noble and Maletz (Reference Noble and Maletz2000); (18, 19) MacDonald (Reference MacDonald2006). SP = primary spine; SS = secondary spine. (1–7) Scale bars = 50 μm; (8–19) scale bars = 100 μm.
Holotype
Specimen (MR40-1A, M-43-2) from the Malongulli Formation, New South Wales, Australia (Renz, Reference Renz1990, pl. 1, fig. 2).
Diagnosis
Haplotaeniatid with labyrinthine mesh consisting of more than two whorls around a small spheroidal proloculus. Six primary spines emanating from the proloculus and few to several secondary spines based at subsequent levels of the whorls that outgrow the shell flanks. Spine lengths are less than the shell diameter. No pylome. Emended from Renz (Reference Renz1990) and Noble and Webby (Reference Noble and Webby2009).
Description
Haplotaeniatum spongium has a small proloculus from which six spines radiate together with a loose labyrinthine meshwork of more than two whorls that acts as the base for few to several secondary spines (Fig. 9.1, 9.2). The initial skeleton is the spheroidal proloculus (Ø, ~30 μm) located at the center of the shell. The proloculus gives rise to six delicate rod-like primary spines that are small at their bases but increase in diameter as they extend to at least half of their final length (~105 μm) before tapering toward their distal end. The configuration of primary spines is random and may vary among different specimens (Fig. 9.3). The apophyses of these primary spines develop further to define the whorls of the labyrinthine meshwork. When the labyrinth develops, secondary spines initiate from random locations on layers of the labyrinth, providing more apophyses to increase the mesh density of the shell. Secondary spine shapes are also similar to primary spines but shorter as they do not extend down to the proloculus. Primary and secondary spines may variably grow beyond the flanks of the shell. In general, both spines grow up to 45 μm beyond the flanks, but primary spines may grow up to 200 μm. The characteristics and the measurements of the labyrinthine meshwork (pore size, pore frames) are similar to the described H. prolatum although the labyrinth is comparatively less dense and has a faintly spiraliform nature in the labyrinthine arrangement under some orientations (Fig. 9.5, 9.6).
Remarks
Ortho slices of the specimen SEES/210513/AB2/HS1 (Fig. 9.4) are similar to figure 6.11 of Noble and Webby (Reference Noble and Webby2009), highlighting the “moderately loose labyrinthine” character. The specimen in this investigation has 12 spines, among which six radiate directly from the proloculus, deviating from the species description of Noble and Webby (Reference Noble and Webby2009), who state that H. spongium has only six to eight spines. The six spines detected in specimens for this study could be a result of primary spines growing prominently compared with variably developed secondary spines. The number of secondary spines is not fixed and may be incorporated within the labyrinth, appearing simply as thick pore frames. Therefore, the diagnosis is broadened to include forms with more than eight spines.
Haplentactinia attenuata Goto et al. (Reference Goto, Umeda and Ishiga1992) was described as having four to six primary spines and 8–15 by-spines that appear to be secondary spines. Although the shell diameter is less than the encountered specimens, its superficial appearance, length of spines, and pore sizes are closer, which provides a basis for referring them to the H. spongium combination established by Noble and Webby (Reference Noble and Webby2009). H. spongium is readily distinguishable from other Ordovician haplotaeniatids (Pouille et al., Reference Pouille, Danelian and Popov2014; Perera et al., Reference Perera, Aitchison and Nothdurft2020; Perera and Aitchison, Reference Perera and Aitchison2022) owing to its very large pores (up to 30 μm) and the less-spongy nature of the labyrinthine meshwork.
As shown in Fig. 9.6, some areas of the outermost meshwork exhibit an irregularly porous character developed as a result of attaining a significant degree of two-dimensionality to the meshwork. The two-dimensional porous meshwork is more characteristic of the lower Silurian genus Gyrosphaera Noble and Maletz (Reference Noble and Maletz2000), which is presumed to be closely related to Haplotaeniatum due to the mutual spiraliform layering (Noble and Maletz, Reference Noble and Maletz2000; Jones and Noble, Reference Jones and Noble2006). Our observations corroborate these assumptions, and the H. spongium may represent an immediate ancestor of lower Silurian gyrosphaerid forms.
Family Inaniguttidae Nazarov and Ormiston, Reference Nazarov and Ormiston1984, sensu Noble, Reference Noble1994 and Danelian and Popov, Reference Danelian and Popov2003
Genus Inanigutta Nazarov and Ormiston, Reference Nazarov and Ormiston1984, sensu Nazarov, Reference Nazarov1988 and Perera and Aitchison, Reference Perera and Aitchison2022
Type species
Entactinia unica Nazarov, Reference Nazarov1975 (GIN 4333/2) from the Bestamak Formation, southwest foothills of the Chingiz Range, eastern Kazakhstan by original designation.
Inanigutta complanata (Nazarov, Reference Nazarov1975)
Figure 2.4
- Reference Nazarov1975
Entactinia complanata Nazarov, p. 56, pl. 15, figs. 11, 12, pl. 20, figs 7, 8.
- Reference Nazarov and Popov1980
Entactinia complanata; Nazarov and Popov, p. 29, pl. 1, figs. 2, 5, pl. 7, figs. 3, 4, pl. 11, figs. 3, 4, text-fig. 10.
- Reference Nazarov and Ormiston1984
Inanigutta complanata; Nazarov and Ormiston, pl. 4, fig. 1.
- ?Reference Goto, Umeda and Ishiga1992
Inanigutta cf. I. complanata Goto, Umeda, and Ishiga, p. 159, pl. 9, figs. 1–3.
- Reference Wang1993
Inanigutta complanata; Wang, p. 99, pl. 10, figs. 1, 2.
- Reference Danelian and Floyd2001
?Inanigutta complanata Danelian and Floyd, p. 493, fig. 4a.
- Reference Noble and Webby2009
Inanigutta complanata; Noble and Webby, pl. 5, figs. 10, 11, pl. 6, fig. 14.
- ?Reference Perera, Aitchison and Nothdurft2020
Inanigutta sp. cf. I. complanata; Perera et al., p. 2040, pl. 1, fig. i.
- Reference Perera and Aitchison2022
Inanigutta complanata; Perera and Aitchison, p. 16, fig. 11.9.
Holotype
Specimen (GIN 4333/29) from the Middle Ordovician, Bestamak Formation, southwestern foothills of the Chingiz Range, eastern Kazakhstan (Nazarov, Reference Nazarov1975, pl. 20, fig. 8).
Remarks
Specimens encountered are identical to those described by Noble and Webby (Reference Noble and Webby2009). No further investigation was undertaken as this taxon has been extensively studied in all encounters since 1984.
Genus Kalimnasphaera Webby and Blom, Reference Webby and Blom1986
Type species
Kalimnasphaera maculosa Webby and Blom, Reference Webby and Blom1986 (AM.F. 134783) from limestone breccias of the Malongulli Formation of New South Wales, Australia, by original designation.
Kalimnasphaera maculosa Webby and Blom, Reference Webby and Blom1986
Figure 2.1
- Reference Dunham and Murphy1976
Spumellaria; Dunham and Murphy, p. 884, pl. 1, figs. 1–5.
- Reference Webby and Blom1986
Kalimnasphaera maculosa Webby and Blom, p. 152, figs. 3.4–3.9, 4.1–4.8.
- Reference Renz1990
Kalimnasphaera sp. aff. K. maculosa; Renz, p. 370, pl. 2, figs. 6, 8–10.
- Reference Goto, Umeda and Ishiga1992
Kalimnasphaera sp. aff. K. maculosa; Goto, Umeda, and Ishiga, p. 159, pl. 8, figs. 1–3.
- Reference Noble and Webby2009
Kalimnasphaera maculosa; Noble and Webby, p. 559, figs. 5.12–5.15, 6.13.
Holotype
Specimen (AM.F. 134783)) from the Malongulli Formation, New South Wales, Australia (Webby and Blom, Reference Webby and Blom1986, pl. 3, fig. 4).
Remarks
K. maculosa is common in other Katian radiolarian assemblages from which its skeletal microstructure has been thoroughly investigated. Micro-CT observations of K. pingliangensis Perera and Aitchison (Reference Perera and Aitchison2022) provide further insight into microscale features of the genus. Since hundreds of specimens encountered in this study are visually identical to the previous reports, no further investigation was undertaken.
Acknowledgments
The research was financially supported by the Australian Research Council grant no. ARC DP 1501013325 (to J.C.A.). We thank landholders in the Cliefden Caves area on the Belubula River—P. Agostino (Malongulli), B. Crossing (Angullong), and A. Dunhill (Boonderoo)—for kindly facilitating access to sample locations. We also thank C. Evans at the Julius Kruttschnitt Mineral Research Centre, UQ, for conducting micro-CT measurements of the radiolarian specimens. We gratefully acknowledge the helpful advice from Wiradjuri Condobolin Corporation and CEO A. Coe regarding appropriate indigenous nomenclature for the new genus Wiradjuri. The authors thank Journal of Paleontology Associate Editor P. Noble and the two reviewers, T. Danelian and anonymous, for their constructive comments and guidance that helped to improve this manuscript. This paper is a contribution to the International Geoscience Programme (IGCP) Project 735: Rocks and the Rise of Ordovician Life.
Declaration of competing interests
The authors declare none.
Data availability statement
Data available from the Dryad Digital Repository: https://doi.org/10.5061/dryad.qfttdz0n9


 Open access