


Introduction
It is often claimed that bilinguals can learn a third language (L3) ‘better’ than monolinguals learn a second language (L2) (Abu-Rabia & Sanitsky, Reference Abu-Rabia and Sanitsky2010; Cenoz, Reference Cenoz2003). Indeed, a number of studies support this claim. For instance, adult bilinguals have shown superior vocabulary learning and processing in an additional language as compared to monolinguals (Antoniou, Liang, Ettlinger & Wong, Reference Antoniou, Liang, Ettlinger and Wong2015; Bartolotti & Marian, Reference Bartolotti and Marian2012; Bartolotti, Marian, Schroeder & Shook, Reference Bartolotti, Marian, Schroeder and Shook2011; Kaushanskaya, Reference Kaushanskaya2012; Kaushanskaya & Marian, Reference Kaushanskaya and Marian2009a, Reference Kaushanskaya and Marian2009b; Kaushanskaya & Rechtzigel, Reference Kaushanskaya and Rechtzigel2012; Keshavarz & Astaneh, Reference Keshavarz and Astaneh2004; Wang & Saffran, Reference Wang and Saffran2014; Zare & Mobarakeh, Reference Zare and Mobarakeh2013), as well as superior pragmatic skill development (Safont Jorda, Reference Safont Jorda2003) and better general additional language proficiency (Cenoz & Valencia, Reference Cenoz and Valencia1994; Sanz, Reference Sanz2000). The benefits of bilingualism with respect to language learning have been attributed to bilinguals’ greater metalinguistic awareness (Dillon, Reference Dillon2009; Jessner, Reference Jessner2008), better use of learning strategies (Kemp, Reference Kemp2007), the availability of a broader linguistic repertoire (Cenoz, Reference Cenoz2013; De Angelis, Reference De Angelis2007), and better management of cross-language interference (Bartolotti & Marian, Reference Bartolotti and Marian2012), as compared to monolinguals.
Although quite a few studies suggest bilingual advantages for the functions listed above, others show no group differences (or show an advantage for monolinguals, Okita & Jun Hai, Reference Okita, Jun Hai, Iragui, Hufeisen and Jessner2001), both for lexical learning (Antoniou et al., Reference Antoniou, Liang, Ettlinger and Wong2015; Gonzalez-Ardeo, Reference Gonzalez-Ardeo, Iragui, Hufeisen and Jessner2000) and for preposition learning (Gibson, Hufeisen & Libben, Reference Gibson, Hufeisen, Libben, Iragui, Hufeisen and Jessner2001). Thus, clear conclusions are difficult to draw and more research is needed, especially with regard to the linguistic domain of grammar, which has been addressed by only three studies (Cox, Reference Cox2017; Nation & McLaughlin, Reference Nation and McLaughlin1986; Nayak, Hansen, Krueger & McLaughlin, Reference Nayak, Hansen, Krueger and McLaughlin1990). Moreover, weaknesses and gaps within these studiesFootnote 1, as well as heterogeneity across them, make the existing literature on grammar even more inconclusive. The available research, then, provides a remarkably narrow empirical basis on which to make claims about bilingual advantages in language learning, particularly grammar learning – that is, rule-governed aspects of syntax (e.g., word order) as well as morphologically-marked features such as grammatical gender agreement or case-marking. Examining grammar is important not only because it underlies the flexibility and creativity of language, but also because neurocognitive theories of additional language learning posit differential levels of attainment for aspects of grammatical as compared to lexical learning and processing (e.g., Clahsen & Felser, Reference Clahsen and Felser2006a, Reference Clahsen and Felser2006b; Paradis, Reference Paradis2009; Ullman, Reference Ullman and Sanz2005, Reference Ullman, VanPatten and Williams2015). Additionally, the existing research on grammar has examined only behavioral measures of learning, so it is unknown how bilinguals and monolinguals compare on brain measures of grammar processing. In this study, we investigate these issues by examining both behavioral and brain (electrophysiological) measures of potential bilingual/monolingual differences in adult additional language learning of grammar.
Bilingual L3 versus monolingual L2 grammar learning
As mentioned above, to our knowledge there are only three published studies on adult language learning that have investigated potential differences in grammar learning between monolinguals and either bilinguals or multilinguals (Cox, Reference Cox2017; Nation & McLaughlin, Reference Nation and McLaughlin1986; Nayak et al., Reference Nayak, Hansen, Krueger and McLaughlin1990).
An early study compared monolinguals, bilinguals, and multilinguals (with mixed language backgrounds) on their learning of an artificial grammar (Nation & McLaughlin, Reference Nation and McLaughlin1986); that is, a system of elements, such as consonant letter strings, whose structure is determined by a set of rules. All learners were exposed to the same visual input (20 exemplar strings of letters) under either an implicit or explicit condition. Learners in the ‘implicit’ condition were given no specific instructions to learn the grammar rule, whereas those in the ‘explicit’ condition were informed that the system was rule-based and they should try to discover the rule. The results from a grammaticality judgment test following training showed that under the implicit condition the multilinguals outperformed both the bilinguals and monolinguals (who did not differ from each other), whereas the three groups did not differ in the explicit rule-search condition. The authors suggested that multilinguals are better able to allocate processing resources to generate rules under implicit conditions. Although artificial grammar paradigms are designed to elucidate aspects of the human capacity to learn language-like rules (Gomez, Reference Gomez1997; Reber, Reference Reber1967, Reference Reber1969), they lack the characteristic form-meaning mappings of natural languages. It is therefore uncertain whether and how results from artificial grammar paradigms can be generalized to natural languages.
Subsequently, Nayak et al. (Reference Nayak, Hansen, Krueger and McLaughlin1990) examined monolinguals and multilinguals (mixed language backgrounds; no bilinguals were tested) in their learning of an artificial language: that is, a system of elements whose structure is determined by complex grammar rules, and whose words and grammar are characterized by form-meaning mappings. In this study, the language consisted of 40 visually-presented sentences, and the words in its lexicon were mapped to specific geometric figures (e.g., a rectangle). Both multilinguals and monolinguals were trained under one of two conditions, which the authors referred to as the ‘memory’ and ‘rule-discovery’ conditions. Learners in the memory condition were asked to memorize the phrases, whereas those in the rule-search condition were instructed to determine the rules that governed word order in the language. After the training phase, learners completed a vocabulary test as well as a grammaticality judgment test that measured word-order learning. The results showed no monolingual/multilingual group differences for vocabulary learning under either condition. For word order, the multilinguals outperformed the monolinguals in the rule-search condition but not in the memory condition. These results were similar to those reported by Nation and McLaughlin (Reference Nation and McLaughlin1986) in that both studies reported advantages of multilinguals over monolinguals for grammar learning. However, the two studies differed in that these advantages were found by Nation and McLaughlin (Reference Nation and McLaughlin1986) in the ‘implicit’ condition, but by Nayak et al. (Reference Nayak, Hansen, Krueger and McLaughlin1990) in the rule-search (explicit) condition. Nayak et al. attributed this difference between the studies to the fact that their artificial language was more complex than the artificial grammar used by Nation and McLaughlin, and therefore required more linguistic processing than the pattern recognition processes examined by Nation and McLaughlin. Additionally, the studies differed as to what characterized their implicit conditions (no instructions in Nation et al., 1986 vs. instructions to memorize in Nayak et al., Reference Nayak, Hansen, Krueger and McLaughlin1990), which further complicates direct comparisons of the studies’ outcomes for multilingual/monolingual performance.
The third study was conducted in the context of the Latin Project, which was designed by Cristina Sanz and colleagues to examine bilingualism and the effects of both explicit instruction and feedback in the L2/L3 learning of morphosyntactic case, specifically agent/patient functions (e.g., Cox & Sanz, Reference Cox and Sanz2015; Cox, Reference Cox2017; Lado, Reference Lado2016; Stafford, Bowden & Sanz, Reference Stafford, Bowden and Sanz2012). The project employs a miniature version of Latin (a dead language). Relevant to the present study, Cox (Reference Cox2017) tested English L1–Spanish L2 bilinguals and English monolinguals (all > 60 years old) on the learning of Latin morphosyntactic case-function assignment – under either a visually-presented ‘explicit instruction’ condition, that provided metalinguistic grammar explanations, or a condition that was less explicit, in that it did not provide metalinguistic explanations (audio-visual presentation of meaningful sentences and pictures only). Cox (Reference Cox2017) administered four assessments of learning: written sentence interpretation, aural sentence interpretation, grammaticality judgment, and written sentence production. The results revealed that the bilinguals outperformed the monolinguals on the sentence interpretation tasks (which depended on case-assignment), regardless of instructional condition. Additionally, for grammaticality judgment and written sentence production, the results showed a statistical trend for the bilinguals in the explicit instruction condition to outperform monolinguals who did not receive metalinguistic explanations; whereas there were no significant differences between bilinguals or monolinguals who received explicit instruction. Although this study provides evidence for superior learning of additional language grammar in bilinguals compared to monolinguals under some conditions, it focused on older adults (> 60 years old), which limits the study's comparability to research on younger adult bilingual and monolingual learners.
Although all three studies are informative, an important advantage of the Nayak et al. (Reference Nayak, Hansen, Krueger and McLaughlin1990) study is its use of a well-controlled artificial language paradigm. Artificial languages, in contrast to artificial grammars, provide learners with form-meaning mappings, and are thus more similar to natural languages. Additionally, their rules are typically more complex than those of artificial grammars. Artificial languages also have certain advantages over full natural languages, as well as over miniature languages based on real languages such as Latin. In particular, artificial languages limit some of the major confounds and weaknesses inherent in natural (and miniature) language research of adult language learning. For example, in natural language research, learners often have uncontrolled or unknown types and amounts of language exposure. Moreover, in both full natural language and miniature language research, language transfer issues are often not fully controlled for (but see Tagarelli, Reference Tagarelli2014). Overall, these problems make it difficult to clearly elucidate issues of interest in language learning. Finally, learning a full natural language to high levels of proficiency takes several (often many) years, which makes it extremely difficult to examine the trajectory of learning.
Artificial languages are less susceptible to these confounds and weaknesses. First, both the amount and type of language exposure can be fully controlled for (Friederici, Steinhauer & Pfeifer, Reference Friederici, Steinhauer and Pfeifer2002b; Morgan-Short, Sanz, Steinhauer & Ullman, Reference Morgan-Short, Sanz, Steinhauer and Ullman2010; Morgan-Short, Steinhauer, Sanz & Ullman, Reference Morgan-Short, Steinhauer, Sanz and Ullman2012b). Additionally, grammatical and lexical similarity to already-known languages can be carefully manipulated, allowing one to control for issues of language transfer (Sanz & Lado, Reference Sanz, Lado, King and Hornberger2008; Lado & Sanz, Reference Lado and Sanz2016; note that transfer cannot be well controlled with artificial grammars, since they lack form-meaning connections). Another advantage of artificial languages is that they can generally be learned to high proficiency in hours to days, which provides the means to closely examine the trajectory of language learning (Morgan-Short et al., Reference Morgan-Short, Sanz, Steinhauer and Ullman2010; Morgan-Short et al., Reference Morgan-Short, Steinhauer, Sanz and Ullman2012b). Importantly, the neural correlates of artificial language learning and processing are very similar to those of natural languages (Friederici et al., Reference Friederici, Hahne and Saddy2002b; Morgan-Short et al., Reference Morgan-Short, Sanz, Steinhauer and Ullman2010; Morgan-Short, Finger, Grey & Ullman, Reference Morgan-Short, Finger, Grey and Ullman2012a; Morgan-Short et al., Reference Morgan-Short, Steinhauer, Sanz and Ullman2012b; Morgan-Short, Deng, Brill-Schuetz, Faretta-Stutenberg, Wong & Wong, Reference Morgan-Short, Deng, Brill-Schuetz, Faretta-Stutenberg, Wong and Wong2015). This suggests that artificial language paradigms are reasonable models of natural language learning. In fact, artificial language learning performance has been shown to correlate positively with natural L2 learning performance (Ettlinger, Morgan-Short, Faretta-Stutenberg & Wong, Reference Ettlinger, Morgan‐Short, Faretta‐Stutenberg and Wong2015). Indeed, there is a robust body of research that has used artificial language systems to investigate compelling questions in adult language learning and processing (DeKeyser, Reference DeKeyser1996, Reference DeKeyser1997; Friederici et al., Reference Friederici, Hahne and Saddy2002b; Grey, Williams & Rebuschat, Reference Grey, Williams and Rebuschat2014, Reference Grey, Williams and Rebuschat2015; Hama & Leow, Reference Hama and Leow2010; Morgan-Short et al., Reference Morgan-Short, Sanz, Steinhauer and Ullman2010; Morgan-Short et al., Reference Morgan-Short, Finger, Grey and Ullman2012a; Morgan-Short et al., Reference Morgan-Short, Steinhauer, Sanz and Ullman2012b; Morgan-Short et al., Reference Morgan-Short, Deng, Brill-Schuetz, Faretta-Stutenberg, Wong and Wong2015; Rebuschat & Williams, Reference Rebuschat and Williams2012; Williams, Reference Williams2005). Thus, in the present study, we employ an artificial language design.
Gaps and limitations in existing L3/L2 research
Overall, the available evidence offers quite limited insight into the potential effects of bilingualism on L3 learning of grammar, compared to monolingual L2 learning. As we have seen, early work using an artificial grammar paradigm found superior performance in multilinguals compared to bilinguals and monolinguals, with no differences between the latter two (Nation & McLaughlin, Reference Nation and McLaughlin1986). However, caution is warranted in generalizing findings from artificial grammar learning to natural language learning. A subsequent study, which used an artificial language, showed evidence of superior performance in multilinguals as compared to monolinguals on syntactic word order (Nayak et al., Reference Nayak, Hansen, Krueger and McLaughlin1990). However, this study did not test bilinguals. More recent work with a miniature language found that bilinguals outperformed monolinguals at sentence interpretation tasks that depended on morphosyntactic knowledge (Cox, Reference Cox2017), but the study included only older adults.
Additionally, none of these studies examined bilinguals and monolinguals longitudinally over the course of learning, from lower to higher levels of proficiency – even though such an approach is critical for revealing any L3/L2 differences in the trajectory of learning, or any differences that may be limited to particular points along the learning trajectory. Finally, previous research has examined only behavioral measures of learning, so possible neural correlates of any hypothesized bilingual advantages in language learning remain unclear, ultimately limiting the depth of our understanding of how bilingual L3 and monolingual L2 learning might differ.
ERPs and adult language learning
In the present study, both behavioral and event-related potential (ERP) measures were acquired to examine the neurocognition of language processing at low and high additional language proficiency, in bilingual and monolingual language learners. ERPs offer several benefits for studying language learning and processing. First, the ERP components that are typically elicited in both first and second language experiments have been very well studied, and are relatively well understood (Kaan, Reference Kaan2007; Morgan-Short & Tanner, Reference Morgan-Short and Tanner2014; Steinhauer & Connolly, Reference Steinhauer, Connolly and Whitaker2008; Van Hell & Tokowicz, Reference Van Hell and Tokowicz2010). Second, ERPs can reveal group differences that may not be evident in behavioral measures of performance (e.g., Grey, Tanner & Van Hell, Reference Grey, Tanner and van Hell2017; Tokowicz & MacWhinney, Reference Tokowicz and MacWhinney2005). Third, ERPs can elucidate qualitative differences – as revealed by different components – in how linguistic information is processed, including in the processing of lexical and grammatical features of an L2 (Batterink & Neville, Reference Batterink and Neville2013; Foucart & Frenck-Mestre, Reference Foucart and Frenck-Mestre2012; Gillon Dowens, Guo, Guo, Barber & Carreiras, Reference Gillon Dowens, Guo, Guo, Barber and Carreiras2011; McLaughlin, Osterhout & Kim, Reference McLaughlin, Osterhout and Kim2004; Morgan-Short et al., Reference Morgan-Short, Sanz, Steinhauer and Ullman2010; Morgan-Short et al., Reference Morgan-Short, Steinhauer, Sanz and Ullman2012b; Tanner, Inoue & Osterhout, Reference Tanner, Inoue and Osterhout2014; Tokowicz & MacWhinney, Reference Tokowicz and MacWhinney2005). Furthermore, ERPs can reveal quantitative differences between groups and conditions in factors such as the timing, distribution, and amplitude of components.
ERPs are especially useful for investigating potential bilingual/monolingual differences in adult language learning of grammar, given that there is a well-studied ERP component that has shown reliable associations with grammatical processing: the P600. The P600 is a positive-going waveform with a centro-posterior scalp distribution. Nearly three decades of research have revealed that the P600 is remarkably sensitive to and reliably elicited by (morpho)syntactic violations, for example by violations of word order (e.g., Friederici & Mecklinger, Reference Friederici and Mecklinger1996), subject-verb agreement (e.g., Osterhout & Mobley, Reference Osterhout and Mobley1995), and nominal (gender/number) agreement (e.g., Barber & Carreiras, Reference Barber and Carreiras2005). Although there are differences in the specific theoretical descriptions of P600 effects (Chow & Phillips, Reference Chow and Phillips2013; Friederici, Hahne & Saddy, Reference Friederici, Hahne and Saddy2002a; Osterhout, Kim & Kuperberg, Reference Osterhout, Kim, Kuperberg, Spivey, Joannissee and McCrae2012; van de Meerendonk, Kolk, Vissers & Chwilla, Reference van de Meerendonk, Kolk, Vissers and Chwilla2010), there is a general consensus that P600s reflect the processing of a stimulus in conflict with an expected linguistic representation, and a late attempt at resolving or reanalyzing this conflict. Note that in many studies, P600s are preceded by frontally-distributed and occasionally left-lateralized anterior negativities, termed LANs, and that this biphasic LAN-P600 pattern is considered by some researchers to be a key neural signature of (morpho)syntactic processing (Friederici et al., Reference Friederici, Hahne and Saddy2002a; Molinaro, Barber & Carreiras, Reference Molinaro, Barber and Carreiras2011). Specifically, the biphasic response is considered to reflect the early, automatic detection (LAN) followed by the later, controlled reanalysis (P600) of (morpho)syntactic violations. However, whereas the P600 is robust and replicable across ERP studies of (morpho)syntactic processing, the LAN is variable and often absent, and its functional significance is still debated (for recent discussions of the LAN, including LAN versus N400 patterns, see Molinaro, Barber, Caffarra & Carreiras, Reference Molinaro, Barber, Caffarra and Carreiras2015; Steinhauer & Drury, Reference Steinhauer and Drury2012; Tanner, Reference Tanner2015).
P600s are found both in L1 and L2 processing. In L2 processing, P600s are commonly elicited (as in L1) in response to (morpho)syntactic violations, in both L2 classroom and L2 immersion exposure contexts (Batterink & Neville, Reference Batterink and Neville2013; Gillon Dowens et al., Reference Gillon Dowens, Guo, Guo, Barber and Carreiras2011; Gillon Dowens, Vergara, Barber & Carreiras, Reference Gillon Dowens, Vergara, Barber and Carreiras2009; Tanner, McLaughlin, Herschensohn & Osterhout, Reference Tanner, McLaughlin, Herschensohn and Osterhout2013; White, Genesee & Steinhauer, Reference White, Genesee and Steinhauer2012). P600s in L2 appear to be more reliable at higher than at lower L2 proficiency (for reviews see Bowden, Steinhauer, Sanz & Ullman, Reference Bowden, Steinhauer, Sanz and Ullman2013; Morgan-Short, Reference Morgan-Short2014; Steinhauer, White & Drury, Reference Steinhauer, White and Drury2009; Steinhauer, Reference Steinhauer2014). Additionally, though the biphasic LAN-P600 response has been found in L2 studies, it has only been observed at higher L2 proficiency (e.g., Bowden et al., Reference Bowden, Steinhauer, Sanz and Ullman2013; Gillon Dowens et al., Reference Gillon Dowens, Vergara, Barber and Carreiras2009; Rossi, Hartmüller, Vignotto & Obrig, Reference Rossi, Hartmüller, Vignotto and Obrig2013). Similar to natural second languages, (morpho)syntactic violations in artificial languages also elicit (LAN)-P600 patterns, usually at higher rather than lower proficiency (e.g., Friederici et al., Reference Friederici, Hahne and Saddy2002b; Morgan-Short et al., Reference Morgan-Short, Sanz, Steinhauer and Ullman2010; Morgan-Short et al., Reference Morgan-Short, Finger, Grey and Ullman2012a; Morgan-Short et al., Reference Morgan-Short, Steinhauer, Sanz and Ullman2012b). Thus both P600s and LANs are more commonly observed at higher than lower L2 proficiency.
The observed changes in L2 ERP patterns (for both natural and artificial language) as a function of L2 proficiency have informed current neurocognitive theories of later-learned language processing. The theories, though different in their specific approaches to L1 and L2 processing, generally converge in suggesting that aspects of L2 processing can in principle approximate those of L1 (but see Clahsen & Felser, Reference Clahsen and Felser2006a, Reference Clahsen and Felser2006b). In particular, a number of neurocognitive theories propose that L2 grammar can eventually rely on similar mechanisms as L1 when L2 proficiency has reached high enough levels (e.g., Bates & MacWhinney, Reference Bates, MacWhinney, MacWhinney and Bates1989; Green, Reference Green, Hout, Hulk, Kuiken and Towell2003; MacWhinney, Reference MacWhinney and Robinson2001; Paradis, Reference Paradis2009; Ullman, Reference Ullman and Sanz2005, Reference Ullman, VanPatten and Williams2015).
However, these theoretical approaches have been developed to account primarily for monolingual L2 learning. It remains to be seen whether and how they might be applied to bilingual L3 learning. Indeed, there is very little ERP research that has explicitly studied L3 processing. We are aware of only a few L3 ERP studies, which have examined L1, L2, and L3 word recognition in trilinguals (Aparicio, Midgley, Holcomb, Pu, Lavaur & Grainger, Reference Aparicio, Midgley, Holcomb, Pu, Lavaur and Grainger2012), language inhibition during L1, L2, and L3 digit naming in trilinguals (Guo, Ma & Liu, Reference Guo, Ma and Liu2013), or language control in early and late bilinguals’ L3 processing (Martin, Strijkers, Santesteban, Escera, Hartsuiker & Costa, Reference Martin, Strijkers, Santesteban, Escera, Hartsuiker and Costa2013). These studies either compared processing within subjects’ three languages (Aparicio et al., Reference Aparicio, Midgley, Holcomb, Pu, Lavaur and Grainger2012; Guo et al., Reference Guo, Ma and Liu2013), or compared two sets of bilinguals’ L3 processing (Martin et al., Reference Martin, Strijkers, Santesteban, Escera, Hartsuiker and Costa2013); that is, none compared trilinguals to bilinguals or monolinguals, or bilinguals to monolinguals in their learning of an additional language. Moreover, these studies examined either lexical processing (Aparicio et al., Reference Aparicio, Midgley, Holcomb, Pu, Lavaur and Grainger2012; Martin et al., Reference Martin, Strijkers, Santesteban, Escera, Hartsuiker and Costa2013) or non-linguistic cognitive control (Guo et al., Reference Guo, Ma and Liu2013). To our knowledge no ERP studies on bilingual L3 have examined (morpho)syntactic processing. The present study is well-positioned, then, to be informative not only regarding potential neural correlates of bilingual/monolingual differences in adult language learning, but on bilingual L3 learning more generally.
The current study
In this study we aimed to address gaps and limitations in previous research on potential bilingual advantages in adult additional language learning. Using a well-established artificial language paradigm in which the language is actually spoken and comprehended (Morgan-Short et al., Reference Morgan-Short, Deng, Brill-Schuetz, Faretta-Stutenberg, Wong and Wong2015; Morgan-Short, Faretta-Stutenberg, Brill-Schuetz, Carpenter & Wong, Reference Morgan-Short, Faretta-Stutenberg, Brill-Schuetz, Carpenter and Wong2014; Morgan-Short et al., Reference Morgan-Short, Finger, Grey and Ullman2012a; Morgan-Short et al., Reference Morgan-Short, Steinhauer, Sanz and Ullman2012b; Morgan-Short et al., Reference Morgan-Short, Sanz, Steinhauer and Ullman2010), we investigated bilingual L3 compared to monolingual L2 grammar processing, specifically syntactic word order. Because previous research suggests that early, relatively balanced bilinguals are most likely to show positive effects of bilingualism on additional language learning (Bartolotti et al., Reference Bartolotti, Marian, Schroeder and Shook2011; Cenoz & Valencia, Reference Cenoz and Valencia1994; Kaushanskaya & Marian, Reference Kaushanskaya and Marian2009a; Sanz, Reference Sanz2000), we recruited only early, relatively balanced bilinguals.
To extend existing behavioral research, we gathered behavioral measures of language comprehension and language production, as well as grammaticality judgments of syntactic word order. To inform the neural bases of bilingual/monolingual adult language learning, we also acquired electrophysiological (ERP) measures of syntactic processing. Moreover, to reveal the longitudinal changes in the behavioral and neural correlates of language learning in bilinguals and monolinguals, we gathered language comprehension and production measures continuously, and assessed both grammaticality judgments and electrophysiological patterns at two points in the learning trajectory, at low and high proficiency. We investigated the following research questions (RQs):
RQ 1. Do the bilingual and monolingual groups differ in either their production or comprehension of the additional language?
RQ 2. Do the bilingual and monolingual groups differ in their grammaticality judgments of syntactic word order of the additional language, at either low or high proficiency?
RQ 3. Do the two groups differ in their ERP responses to violations of the syntactic word order of the additional language, at either low or high proficiency?
Drawing on prior research that has examined behavioral differences in bilingual/monolingual additional language learning, we predicted that the bilinguals would outperform the monolinguals on comprehension and production (RQ 1) and on grammaticality judgment (RQ 2) – perhaps particularly at low proficiency in the language, since at high proficiency both groups may reach ceiling. Regarding ERP responses (RQ 3), the lack of any prior research on bilingual L3 (morpho)syntactic processing using ERPs precluded strong predictions.
Methods
Participants
Seventeen Mandarin L1–English L2 early bilinguals were tested. These bilinguals were compared to a matched group of native English-speaking monolinguals (n = 16) that had been previously tested under the exact same experimental conditions (Morgan-Short et al., Reference Morgan-Short, Steinhauer, Sanz and Ullman2012b; Morgan-Short et al., Reference Morgan-Short, Sanz, Steinhauer and Ullman2010). Mandarin–English bilinguals were recruited because Mandarin and English both differ from the artificial language used in the present study, Brocanto2, with respect to their grammatical features, in particular word order (head-first phrase structure in Mandarin and English versus head-final in Brocanto2; see below). This minimizes potential cross-linguistic transfer from the natural language(s) in both groups to Brocanto2, and moreover avoids any transfer differences between the two groups (for transfer considerations in L2/L3 research see Note 1).
Prior to being invited to participate in the study, the bilinguals were screened for inclusionary criteria. Due to the study's focus on early, balanced bilinguals, participants had to meet the following criteria: they began learning both English and Mandarin before or by the age of 6 years old (Chee, Caplan, Soon, Sriram, Tan, Thiel & Weekes, Reference Chee, Caplan, Soon, Sriram, Tan, Thiel and Weekes1999a; Chee, Tan & Thiel, Reference Chee, Tan and Thiel1999b; Fabbro, Reference Fabbro1999; Paradis, Reference Paradis2004, Reference Paradis2009; Stafford, Reference Stafford2011); they reported literacy in both languages (Bialystok, Reference Bialystok2001; Sanz, Reference Sanz, Perez-Vidal, Bel and Gauau2007); they reported at least weekly hearing/speaking and reading/writing of both languages; and they reported similar self-ratings of proficiency (see Table 1) in the two languages (Marian, Blumenfeld & Kaushanskaya, Reference Marian, Blumenfeld and Kaushanskaya2007).
Language background characteristics for the bilingual group

Note. Values reflect means (and standard deviations) and [95% confidence intervals]. AoE = age of exposure, defined as self-reported age (in years), of first exposure to the language; the AoE range for English was 0–6 years. Speaking, listening, and reading represent self-reported proficiency (maximum value 10) in these modalities, obtained from the LEAP-Q (Marian et al., Reference Marian, Blumenfeld and Kaushanskaya2007). For comparisons between English and Mandarin for the four variables, all ps > .15.
Just as with the monolinguals in Morgan-Short et al. (Reference Morgan-Short, Steinhauer, Sanz and Ullman2012b), the bilinguals were also screened for their experience learning Romance languages, such as Spanish or French, since Brocanto2 was designed to be Romance language-like in its (morpho)syntactic features (Morgan-Short et al., Reference Morgan-Short, Deng, Brill-Schuetz, Faretta-Stutenberg, Wong and Wong2015; Morgan-Short et al., Reference Morgan-Short, Finger, Grey and Ullman2012a; Morgan-Short et al., Reference Morgan-Short, Steinhauer, Sanz and Ullman2012b; Morgan-Short et al., Reference Morgan-Short, Sanz, Steinhauer and Ullman2010); see below. Specifically, all participants had to meet the following criteria in order to be eligible to participate: no more than three years of classes total in any Romance language, with no more than one year at university, and no more than two weeks of immersion in a Romance language-speaking area, and none at all of either in the last two years. These criteria were selected to minimize unwanted confounds of exposure to (and thus potential transfer of) linguistic knowledge from other Romance languages (while at the same time avoiding excluding too many participants).
During the study, data from four of the 17 bilingual participants were excluded: two did not reach the low proficiency criterion (see below in Study Procedure), one scored below the pre-established IQ criterion (85 or above as measured by the Kaufman Brief Intelligence Test; KBIT; Kaufman & Kaufman, Reference Kaufman and Kaufman2004), and one could not complete the final session of the study due to technical issues with the electroencephalogram (EEG) system. Thus, data from 13 early Mandarin–English bilinguals (nine female, all right-handed; Oldfield, Reference Oldfield1971) were included in the analyses. For more detailed descriptive information on this final sample of bilinguals see Table 1.
The bilinguals were trained and tested under the exact same conditions as the previously-tested matched English monolingual group (Morgan-Short et al., Reference Morgan-Short, Finger, Grey and Ullman2012a; Morgan-Short et al., Reference Morgan-Short, Steinhauer, Sanz and Ullman2012b; Morgan-Short et al., Reference Morgan-Short, Sanz, Steinhauer and Ullman2010). Like the monolingual group, all bilingual participants had normal or corrected-to-normal vision and no reported neurological, learning, or neurodevelopmental disorders. For additional descriptive details on age, IQ, years of education, number of foreign languages studied, and days between sessions for both groups, see Table 2. As can be seen in Table 2, the bilinguals and monolinguals differed only in the number of foreign languages they had studied, with the monolinguals reporting having studied significantly more foreign languages in a classroom setting than the bilinguals (also see Discussion), t(1,27) = 3.00, p = .006, d = 1.15.
Descriptive information for bilingual and monolingual groups

Note. Values reflect means (and standard deviations) and [95% confidence intervals]. Non-verbal IQ assessed with the non-verbal sub-section of the KBIT (Kaufman & Kaufman, Reference Kaufman and Kaufman2004). S1 = session 1, S2 = session 2, S3 = session 3. The monolingual and bilingual groups did not differ for any variable other than the number of foreign languages studied (p = .006).
Materials and procedure
The artificial language: Brocanto2
The target language used in this study was Brocanto2. This artificial language was designed by Morgan-Short and colleagues, following Brocanto (Frederici et al., Reference Friederici, Hahne and Saddy2002b), for the purpose of investigating additional language learning in a well-balanced and well-controlled experimental setting (for more details, see Morgan-Short et al., Reference Morgan-Short, Deng, Brill-Schuetz, Faretta-Stutenberg, Wong and Wong2015; Morgan-Short et al., Reference Morgan-Short, Faretta-Stutenberg, Brill-Schuetz, Carpenter and Wong2014; Morgan-Short et al., Reference Morgan-Short, Finger, Grey and Ullman2012a; Morgan-Short et al., Reference Morgan-Short, Steinhauer, Sanz and Ullman2012b; Morgan-Short et al., Reference Morgan-Short, Sanz, Steinhauer and Ullman2010). Brocanto2 is composed of a small lexicon and a limited number of grammar rules, allowing it to be learned to a high level of proficiency over the course of several days. Thus it allows for an in-depth longitudinal (within-subject) examination of the trajectory of language learning, from low to high proficiency.
Brocanto2 has been shown to be a reasonable model of natural language learning. First, this fully productive artificial language follows universal requirements of natural languages: all the grammatical features of Brocanto2 are found in natural languages, such as Supyire (spoken in Mali), which has subject–object–verb word order, grammatical gender agreement, and post-nominal adjectives and determiners (Carlson, Reference Carlson1994). Moreover, Brocanto2 is presented auditorily, and participants use the language in both comprehension and production tasks. Brocanto2 was based on another artificial language, Brocanto, developed and investigated by Friederici and colleagues (Friederici et al., Reference Friederici, Hahne and Saddy2002b; Opitz & Friederici, Reference Opitz and Friederici2002). Importantly, both Brocanto and Brocanto2 have elicited neural patterns similar to those found in natural languages (Friederici et al., Reference Friederici, Hahne and Saddy2002b; Opitz & Friederici, Reference Opitz and Friederici2002; Morgan-Short et al., Reference Morgan-Short, Deng, Brill-Schuetz, Faretta-Stutenberg, Wong and Wong2015; Morgan-Short et al., Reference Morgan-Short, Steinhauer, Sanz and Ullman2012b; Morgan-Short et al., Reference Morgan-Short, Sanz, Steinhauer and Ullman2010).
Brocanto2 has a lexicon of 13 pronounceable words that can be combined to form 1,404 possible sentences, which refer to game moves in a computerized chess-like game (Morgan-Short et al., Reference Morgan-Short, Sanz, Steinhauer and Ullman2010; Morgan-Short et al., Reference Morgan-Short, Steinhauer, Sanz and Ullman2012b). See Figure 1 for a sample Brocanto2 game board. There are four nouns in Brocanto2, each of which refers to a game token - two are masculine (pleck, neep) and two are feminine (vode, blom; gender is not overtly marked on the nouns). There is one article, which is marked for linguistic gender (li, masculine; lu, feminine), and there are two adjectives, also marked for linguistic gender (troise/neime – masculine; troiso/neimo – feminine). The language also has two adverbs (noyka, zayma) as well as four verbs (klin, praz, yab, nim), which refer to the game moves (move, switch, release, capture, respectively) and differ with respect to transitivity.
Example Brocanto2 game board and game piece configuration.

Brocanto2 has fixed subject-object-verb word order at the sentence level and noun-(adjective)-article word at the noun-phrase level – making it a head-final language. A sentence such as Pleck troise li vode troiso lu praz means that “the round pleck switches with the round vode.” In the present study we focus on syntactic word order, which was tested in judgment tasks during the acquisition of EEG data (see below). As mentioned above, Brocanto2 was designed to be Romance language-like. Brocanto2 is similar to Romance languages (and different from both English and Mandarin) in its marking of grammatical gender on determiners and adjectives as well as in its post-nominal adjectives. In addition, the subject-object-verb word order in Brocanto2 is a possible word order in Romance languages (and different from both English and Mandarin), and at least one Romance language, i.e., Romanian, has post-nominal determiners. The fact that Brocanto2 has both post-nominal determiners and complete noun-phrase direct objects that occur pre-verbally seems to be unlike Romance languages (and also unlike English and Mandarin).
The lexicon of Brocanto2 follows English phonotactics, though none of the words exist in English. In Mandarin, li can either be a proper noun or a reference to a unit of distance (falling-rising tone means the distance is approximately 500 meters) and lu can have several meanings, depending on whether the tone is rising, falling, or rising-falling, and also on the sentence context. Since Mandarin is a tonal language (Zhou, Ye, Cheung & Chen, Reference Zhou, Ye, Cheung and Chen2009), and meaning is encoded in the rising and falling tones on lexical items, the words li and lu as they are presented in Brocanto2 (always with even tone; never rising or falling) are unlikely to be confused with Mandarin words, and in fact no bilingual participants reported thinking that li or lu were Mandarin words.
Finally, note that participants did not see any written Brocanto2 stimuli during training, practice, or in the judgment task; that is, Brocanto2 was presented solely auditorily, just as much of language learning and use is largely aural/oral.
Instructed training
Both bilinguals and monolinguals were trained in Brocanto2 under an Instructed condition. This was the exact same training condition that Morgan-Short and colleagues referred to as the ‘Explicit’ condition (Morgan-Short et al., Reference Morgan-Short, Steinhauer, Sanz and Ullman2012b; Morgan-Short et al., Reference Morgan-Short, Sanz, Steinhauer and Ullman2010). (We use the term ‘instructed’ rather than ‘explicit’ because the former seems to better describe the nature of the training context.) In the Instructed condition, which was designed to resemble a traditional foreign language classroom setting, participants received metalinguistic explanations about Brocanto2 grammar; for example, “In Brocanto2, both the subject and object are placed before the verb. The subject occurs first and the object occurs second.” Participants were also provided with 33 meaningful examples of the language: constellations or game moves presented together with the corresponding Brocanto2 sentence. This training lasted approximately 13 minutes.
Comprehension and production practice
Over the course of the study, participants engaged with 44 blocks of practice in Brocanto2: 22 blocks of comprehension practice and 22 of production. The practice blocks were completed in alternating blocks of two (two comprehension, then two production, then two comprehension, etc.). Each block consisted of 20 items, each of which corresponded to one game move. In comprehension practice, participants listened to a Brocanto2 sentence and had to make the corresponding game move on the computer screen using a mouse. In production practice, participants viewed a game move on the computer screen and were instructed to say aloud a Brocanto2 sentence that described that move. After each item, participants’ total score in the game increased or decreased by 10 points, depending on the accuracy of the comprehension or production response. The total game score was displayed on-screen during all practice sessions. Responses were scored by the researcher, who had an answer key to refer to, during production practice, and were scored automatically by the computer program during comprehension practice. During comprehension practice, response times were also acquired automatically for each item. Comprehension response time was measured as the time between the end of each Brocanto2 sentence and the time that the participant completed the corresponding game move.
Grammaticality judgment test
At two points in the study (once in Session 1 and again in Session 3, see Study Procedure just below), participants underwent behavioral/EEG assessments in Brocanto2. Specifically, participants completed an untimed grammaticality judgment test (GJT) while EEG data were recorded. The GJT contained 240 sentences, 40 of which contained word order violations and 40 of which were matched correct (grammatical) control sentences. See Table 3 for examples of grammatical and ungrammatical Brocanto2 sentences.
Examples of grammatical and ungrammatical sentences in Brocanto2

Note. * marks the point of ungrammatical word order.
The other 160 sentences presented gender agreement or verb argument violations, or were matched correct control sentences; these are not discussed here. Each word order violation sentence was created from its matched correct control sentence by replacing a word from one category (e.g., noun) with a word from a different category (e.g., adjective) that violated the word order structure of Brocanto2, and thus created an ungrammatical Brocanto2 sentence. The ungrammatical and grammatical (correct) word order sentences differed only with respect to this word order violation. There were four GJT lists, which were counter-balanced across participants and test sessions. For additional details on the design and balance of these items for the GJT, see Morgan-Short et al. (Reference Morgan-Short, Steinhauer, Sanz and Ullman2012b). The following presentation sequence occurred for each sentence: A fixation cross appeared while a Brocanto2 sentence was presented through earphones. A prompt (“Good?”) was presented 500 ms after the last word of each sentence. Participants had up to five seconds to make a judgment with a mouse. The next sentence was presented immediately after their response.
Study procedure
After giving informed consent, participants underwent a screening session, during which information on language background and proficiency was collected, and memory and IQ were tested. One day to one month later, participants returned for Session 1 of the study, which began with pre-training. During pre-training they were taught the rules of the chess-like computer game, which provided a meaningful context in which Brocanto2 could be learned. The rules of the game are independent of the grammar rules of Brocanto2. (Playing the game consists of the comprehension and production-based game moves described above.) During pre-training, participants read the rules of the game at their own pace and the computer program demonstrated the four possible game moves (capture, release, move, switch), which participants were then able to practice; game moves were made using a computer mouse. This pre-training was presented in English; no Brocanto2 or English-equivalent words were used. Immediately following the game pre-training, participants underwent naming pre-training. During naming pre-training participants were presented with each of the four game tokens (pleck, neep, vode, blom) on the screen and clicked on the token to hear its name. They were then given a naming test for all four tokens, which continued until they achieved 100% naming accuracy, as demonstrated by naming each token correctly three times in a row.
Immediately after pre-training, participants underwent Instructed training (described above). Following this, they completed comprehension and production practice until they reached above-chance accuracy on two consecutive comprehension blocks – referred to here as the point of “low proficiency” in Brocanto2. Once participants reached this criterion they completed the first GJT session during which EEG data were recorded.
Session 2 of the study took place one to five days after Session 1. This time period was selected to minimize forgetting while also maximizing participants’ scheduling availability given the time-intensive experimental design of the study (multiple sessions, each lasting several hours, over the course of several days). These time periods were statistically matched between the bilinguals and monolinguals (see Table 2). During Session 2, participants were again given Instructed training, which was identical to that provided in Session 1. After this training they completed comprehension and production practice up to block 36 of the total of 44 practice blocks.
Finally, Session 3 took place one to five days after Session 2. During this session, participants finished the last 8 blocks of practice (4 comprehension and 4 production blocks). Upon finishing these 8 practice blocks, participants completed the second GJT/EEG assessment. For ease of exposition this is referred to as the “high proficiency” point.
EEG data acquisition and analysis
EEG acquisition followed the same parameters as those used by Morgan-Short and colleagues (Morgan-Short et al., Reference Morgan-Short, Finger, Grey and Ullman2012a; Morgan-Short et al., Reference Morgan-Short, Steinhauer, Sanz and Ullman2012b; Morgan-Short et al., Reference Morgan-Short, Sanz, Steinhauer and Ullman2010). Scalp EEG was recorded in DC mode at a sampling rate of 500 Hz from 64 tin electrodes (10-20 system; Jasper, Reference Jasper1958), mounted in an elastic cap (Electro-Cap International, Inc., Eaton, OH). EEG was amplified using Neuroscan SynAmps and filtered online with a band-pass filter (DC to 100 Hz, 24-dB/octave attenuation), and offline using a 0.16-30 Hz band-pass filter. Scalp electrodes were referenced online to the left mastoid, and impedances were kept below 5kΩ. Electrooculogram (EOG) activity was measured using free electrodes placed above and below the right eye (vertical EOG) and on the right and left canthi (horizontal EOG). Participants’ data from target words free of artifacts greater than 30 μV in the EOG and greater than 75 μV in the EEG were included in analyses.
ERPs were time-locked to the onset of the critical word for each sentence: i.e., the word that created the word order violation in ungrammatical sentences and the matched correct word in the grammatical sentences (e.g., blom lu *troiso / blom lu pleck; critical word underlined). ERPs were averaged offline in each participant for lateral and midline electrode sites using a 200 ms pre-stimulus baseline. Data processing was done using the EEGLAB (Delorme & Makeig, Reference Delorme and Makeig2004) and ERPLAB (Lopez-Calderon & Luck, Reference Lopez-Calderon and Luck2014) plug-ins for MATLAB; statistical analysis was carried out in SPSS (version 22; IBM Corp.). We grouped lateral scalp electrodes into distributional regions (for similar approaches, see e.g., Chow & Phillips, Reference Chow and Phillips2013; Hahne & Friederici, Reference Hahne and Friederici2001; Frenzel, Schlesewsky & Bornkessel-Schlesewsky, Reference Frenzel, Schlesewsky and Bornkessel-Schlesewsky2011; Tanner & Van Hell, Reference Tanner and Van Hell2014): on left scalp sites, left frontal1 (FP1, AF3, AF7), frontal2 (F3, F5, F7), frontal3 (FC3, FC5, FC7), central1 (C3, C5, T7), central2 (CP3, CP5, TP7), posterior1 (P3, P5, P7), posterior2 (PO3, O1, PO7); on right scalp sites, right frontal1 (FP2, AF4, AF8), frontal2 (F4, F6, F8), frontal3 (FC4, FC6, FT8), central1 (C4, C6, T8), central2 (CP4, CP6, TP8), posterior1 (P3, P5, P7), and posterior2 (PO4, O2, PO8). Data from midline sites comprised Fz, Cz, and Pz. Analyses were conducted separately on lateral and midline sites.
We analyzed three time-windows: 200–400 ms, 400–700 ms, and 700–1000 ms. The time-windows were selected on the basis of both visual inspection of the grand mean ERP waveforms and previous L1/L2 ERP research. They were similar to those used in previous Brocanto2 studies (e.g., Morgan-Short et al., Reference Morgan-Short, Sanz, Steinhauer and Ullman2010, Morgan-Short et al., Reference Morgan-Short, Finger, Grey and Ullman2012a; Morgan-Short et al., Reference Morgan-Short, Steinhauer, Sanz and Ullman2012b), and are generally representative of the ERP effects of interest (e.g., possible LANs, and P600s; for similar windows, see e.g., De Vincenzi, Job, Di Matteo, Angrilli, Penolazzi, Ciccarelli & Vespignani, Reference De Vincenzi, Job, Di Matteo, Angrilli, Penolazzi, Ciccarelli and Vespignani2003; Martin-Loeches, Muñoz, Casado, Melcon & Fernández‐Frías, Reference Martín‐Loeches, Muñoz, Casado, Melcon and Fernández‐Frías2005; Van Den Brink & Hagoort, Reference Van Den Brink and Hagoort2004).
Analyses across the two groups were conducted separately at each level of proficiency: low and high. This was done in order to clearly characterize bilingual vs. monolingual patterns at low and high proficiency while also keeping the ANOVAs within reasonable levels of complexity and power (see Luck & Gaspelin, Reference Luck and Gaspelin2017 for a discussion on overly-complex ANOVAs in ERP research). For lateral sites, the ANOVAs at each level of proficiency (low and high) included the within-subjects factors of Grammaticality (grammatical, ungrammatical), Hemisphere (left, right), and Anterior/posterior (frontal1, frontal2, frontal3, central1, central2, posterior1, posterior2), and the between-subjects factor Group (bilingual, monolingual). For the midline sites, ANOVAs at each level of proficiency included Grammaticality and Electrode (Fz, Cz, Pz) as within-subjects factors, and Group as the between subjects-factor. For both lateral and midline analyses, significant interactions with Grammaticality were followed up with step-down ANOVAs. We report Greenhouse-Geisser corrected p-values for data with more than one degree of freedom in the numerator. We report follow-up analyses on midline ANOVAs only if they provide unique information not revealed in the lateral analyses.
Behavioral data analysis
The behavioral data were analyzed following Morgan-Short and colleagues (Morgan-Short et al., Reference Morgan-Short, Finger, Grey and Ullman2012a; Morgan-Short et al., Reference Morgan-Short, Steinhauer, Sanz and Ullman2012b; Morgan-Short et al., Reference Morgan-Short, Sanz, Steinhauer and Ullman2010). For comprehension and production performance, accuracy (percent correct) data for comprehension and production, and reaction time data for comprehension, were analyzed. For the GJT, d-prime scores were calculated, providing an unbiased measure of participants’ ability to discriminate between grammatical and ungrammatical items (Macmillan & Creelman, Reference Macmillan and Creelman2005; Stanislaw & Todorov, Reference Stanislaw and Todorov1999; Wickens, Reference Wickens2002). These scores were calculated using the formula d-prime = z(hit rate) - z(false alarm rate). Data were analyzed using SPSS (version 22, IBM Corp.). Note that a d-prime of zero indicates chance performance and a d-prime of four indicates near-perfect discrimination ability between grammatical and ungrammatical sentences.
Results
Practice performance
Accuracy: comprehension and production
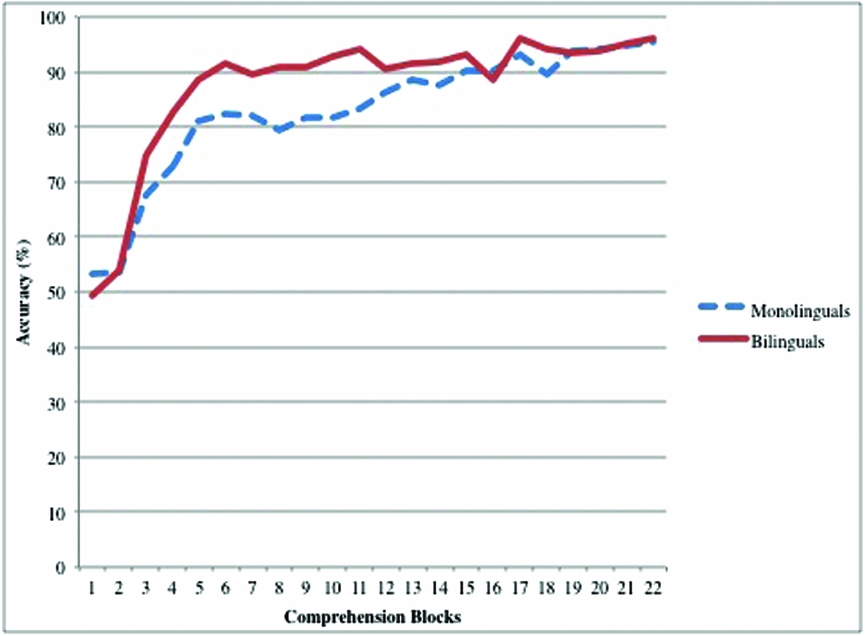
Practice performance for the bilinguals and monolinguals is summarized in Table 4, and accuracy across all the practice blocks is depicted in Figure 2 (comprehension) and Figure 3 (production). As can be seen, by the end of practice both groups reached very high levels of accuracy in comprehending and producing Brocanto2. Descriptively, the bilinguals appear to reach low proficiency (above chance performance; see Methods) faster (i.e., after less practice) than monolinguals (blocks to LP, Table 4). Additionally, over the course of practice, the bilinguals appear to be more accurate than the monolinguals in both comprehension and production, at least after the first few blocks and until around blocks 17–18 (out of 22 in each modality; Figures 2 and 3), at which point the monolinguals catch up to the bilinguals’ performance. Despite these descriptive differences suggesting superior performance by the bilinguals, ANOVAs comparing bilinguals and monolinguals on the block and accuracy variables summarized in Table 4, and planned t-tests comparing bilinguals and monolinguals on accuracy for each of the 22 comprehension and 22 production blocks, showed no statistical differences between the two groups, with all ps > .15 (for full descriptive statistics of each comprehension and production block see Appendix A).
Summary of practice performance in bilinguals and monolinguals

Notes. Values reflect means (and standard deviations) and [95% confidence intervals]. Accuracy represented as percent correct. Blocks to LP = number of production and comprehension blocks to reach low proficiency, 45% twice in a row (i.e., above chance performance); Blocks to 95% = number of production and comprehension blocks between low proficiency and reaching 95% twice in a row on practice; LP = accuracy at low proficiency; Comp = accuracy over all comprehension blocks; Prod = accuracy over all production blocks; At low = response time (in seconds) at low proficiency; At high = response time (in seconds) at high proficiency, that is, the last 4 comprehension blocks of practice, just prior to the high proficiency judgment/ERP assessment.
Comprehension accuracy for bilinguals and monolinguals, shown across the 22 comprehension practice blocks.
Production accuracy for bilinguals and monolinguals, shown across the 22 production practice blocks.

Response time: comprehension
Although comprehension response time, defined as the time between the end of each Brocanto2 sentence and when the participant completed the corresponding game move (see Methods), is a somewhat coarse measure of response speed, it is nevertheless useful for examining (a) whether participants responded more quickly over the course of learning and (b) whether the accuracy improvements outlined above might have occurred at a cost to processing time, i.e., whether there was a speed-accuracy tradeoff. Descriptively, similar to the results reported above for accuracy, the bilinguals generally responded faster than the monolinguals, at least after the first few blocks and until around block 18 (see Figure 4). However, as with the accuracy data, ANOVAs comparing bilinguals and monolinguals on the response time variables summarized in Table 4, and planned t-tests comparing bilinguals and monolinguals on response time for each of the 22 comprehension blocks, showed no statistical differences between the two groups, with all ps > .15. (See Appendix A for full descriptive statistics of each comprehension block).
Comprehension response times for bilinguals and monolinguals, shown across the 22 comprehension practice blocks.
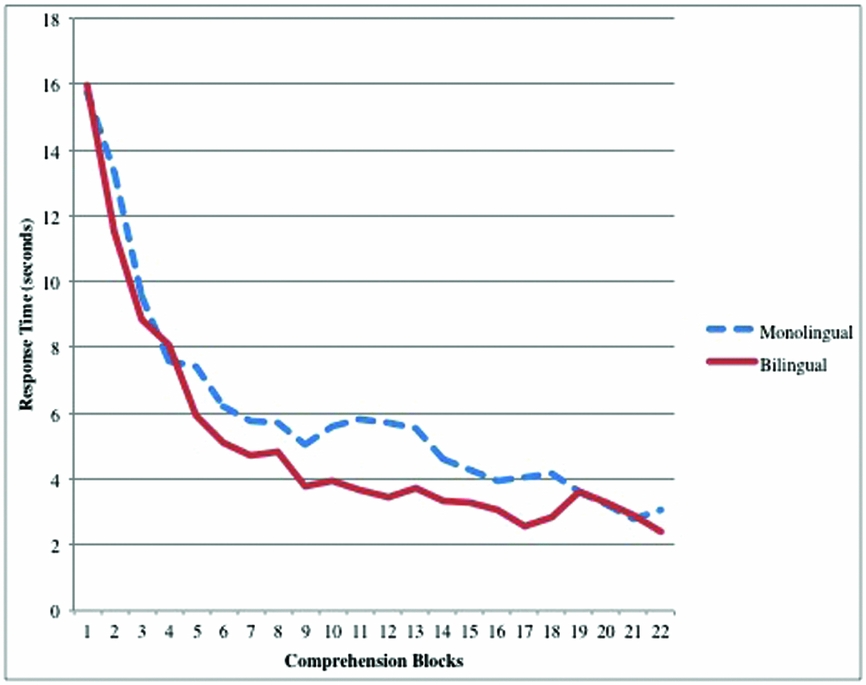
In sum, although descriptively the bilinguals seem to show better performance on comprehension and production and faster performance on comprehension, especially after the first few blocks and prior to around blocks 17–18, the statistical analyses did not reveal any bilingual/monolingual group differences in comprehension or production.
Grammaticality judgment test
Descriptive d-prime information for GJT performance at low proficiency (tested at the end of Session 1) and high proficiency (tested at the end of Session 3) is reported in Table 5. The mean d-prime scores are depicted in Figure 5. In separate analyses of d-prime scores at low and high proficiency (to parallel the separate ERP analyses at low and high proficiency) with Group (bilingual, monolingual) as the between-subjects factor, there were no significant differences between the groups at either time point (low proficiency, F(1,27) = .771, p = .388, η2p = .028; high proficiency, F(1,27) = .423, p = .521, η2p = .015). This was further confirmed by an ANOVA that included Time (low, high) as a within-subjects factor and showed only a main effect of Time F(1,27) = 22.62, p < .001, η2p = .45 with no other main effects or interactions (Time × Group, p = .877, η2p = .001; Group, p = .425, η2p = .024).
Summary of grammaticality judgment performance in bilinguals and monolinguals

Note. Values reported as d-prime. Values reflect means (standard deviations), ranges, and [95% confidence intervals].
Mean grammaticality judgment performance at low and high proficiency in the bilingual and monolingual groups. Error bars show standard error.
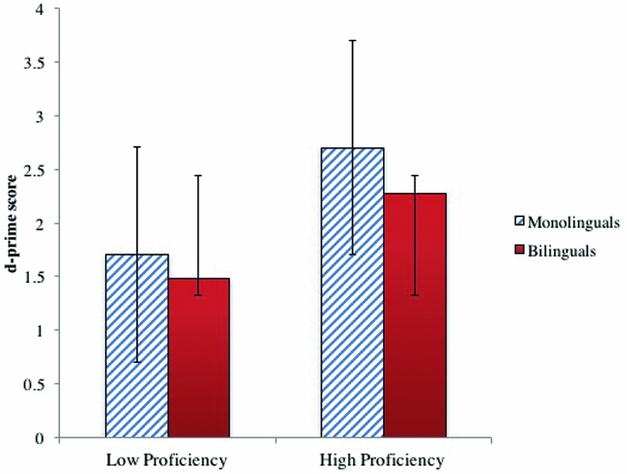
Thus, as expected, there was an improvement in detecting word order violations from low to high proficiency. However, we did not observe bilingual/monolingual differences in grammaticality judgment at either low or high proficiency in Brocanto2. Note that although mean performance on the GJT may give the impression that monolinguals performed better, the 95% confidence intervals for the GJT demonstrate that there is in fact considerable overlap for the two groups. Therefore, what appears to look like better monolingual performance on the behavioral measure is not a significant difference when examined at closer descriptive (95% CI) and statistical levels.
ERP results
At low proficiency
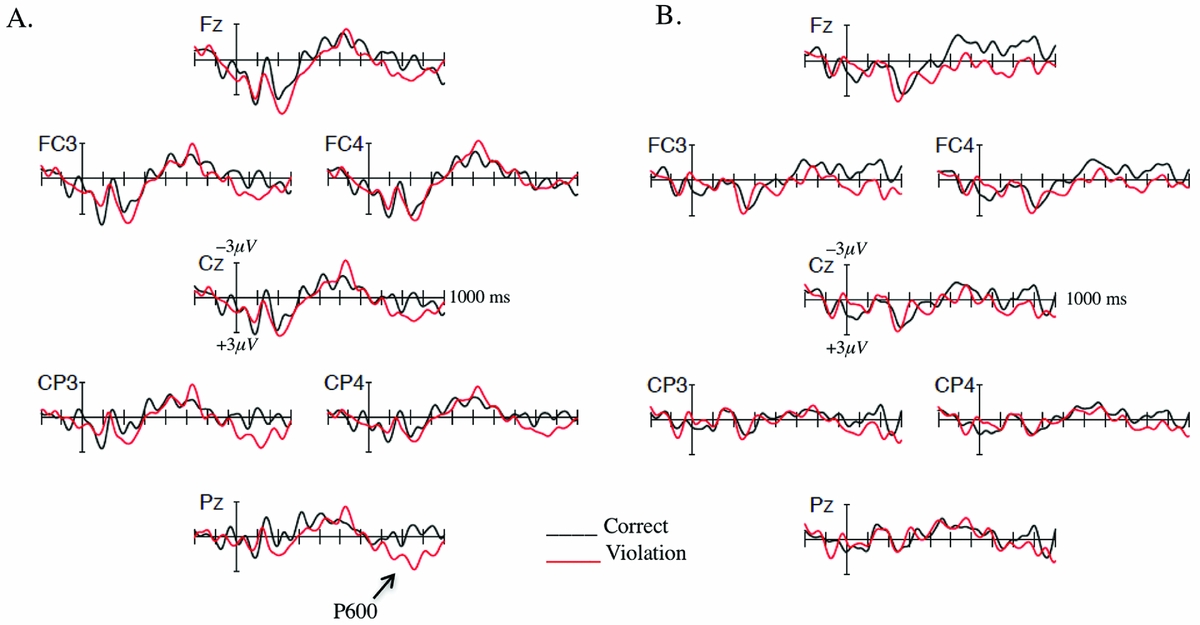
ERP waveforms and topographic voltage maps for word order processing at low proficiency in bilinguals and monolinguals are presented in Figure 6 and Figure 7. Visual inspection of the ERP waveforms suggested that ungrammatical word order (compared to matched grammatical word order sentences) elicited a P600 response in the bilingual group, with no corresponding ERP effect in the monolingual group (see Figures 6 and 7).
ERP waveforms at low proficiency. Panel A: Grand mean ERP waveforms in the bilingual group (n = 13) over 7 representative electrodes for correct word order (black line) and word order violation (red line) conditions at low proficiency. Panel B: Grand mean ERP waveforms in the monolingual group (n = 16) for correct word order (black line) and word order violation (red line) conditions at low proficiency. Each tick mark represents 100 ms. Note that negative voltage is plotted up and voltage is in microvolts (scale = −3µV to +3 µV).
Topographic voltage maps. Maps show the scalp distribution of activity in the word order violation minus correct conditions, averaged for the 200-400 ms, 400-700 ms, and 700-1000 ms time-windows in each group at low and high proficiency. Calibration scale is ±2µV.
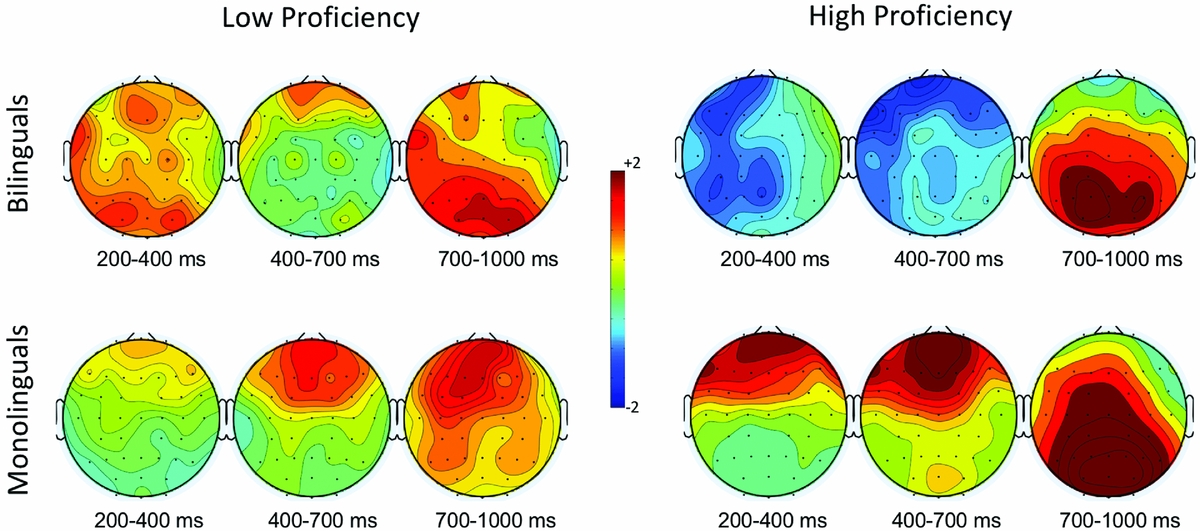
Results from the global ANOVAs for the three time-windows of interestFootnote 2, with Grammaticality, Hemisphere, and Anterior/posterior as within-subjects factors, and Group as the between-subjects factor, are presented in Table 6. Though there were no significant effects in the earlier time-windows (200-400 ms and 400–700 ms), there was a main effect of Grammaticality in the 700–1000 ms time-window. Visual inspection suggested this effect was being driven by the apparent P600 in the bilingual group.
F-statistics from the grand average ANOVAs on mean amplitudes at low proficiency in the 200–400 ms, 400–700 ms, and 700–1000 ms time windows

Note. Gram. = Grammaticality; Elec. = Electrode; Hemi. = Hemisphere; Antpost = Anterior/posterior; df = degrees of freedom. †p < .10; *p < .05.
To further examine this potential difference, and because low power in the sample might preclude detecting by-Group interactions, we conducted full follow-up ANOVAs within each group. In the bilinguals, the ANOVA for lateral sites showed a marginally significant Grammaticality × Hemisphere interaction, F(1,12) = 3.36, p = .091, η2p = .22 which was qualified by a significant Grammaticality × Hemisphere × Anterior/posterior interaction, F(6,72) = 3.43, p = .046, η2p = .22. Follow-up analyses revealed a main effect of Grammaticality with significant (small-to-moderate) effects at central2 (p = .030, η2p = .34), posterior1 (p = .014, η2p = .41), and posterior2 (p = .009, η2p = .45), confirming a P600 effect in the bilinguals. In contrast, in the monolinguals the follow-up ANOVAs produced no significant (or marginally significant) effects or interactions. In sum, the bilinguals but not the monolinguals showed a P600 in response to word order violations in Brocanto2. (Note that the absence of the P600 in the monolinguals was also reported by Morgan-Short et al., Reference Morgan-Short, Steinhauer, Sanz and Ullman2012b with slightly different time windows.)
At high proficiency
Topographic voltage maps and ERP waveforms for word order processing at high proficiency in bilinguals and monolinguals are presented in Figures 7 and 8. Visual inspection of the waveforms and voltage maps suggested that word order violations elicited P600s in both groups. Additionally, visual examination suggested that the monolinguals showed an anterior positivity preceding the P600 effect whereas the bilinguals showed an anterior negativity.
ERP waveforms at high proficiency. Panel A: Grand mean ERP waveforms in the bilingual group (n = 13) over 7 representative electrodes for correct word order (black line) and word order violation (red line) conditions at high proficiency. Panel B: Grand mean ERP waveforms in the monolingual group (n = 16) for correct word order (black line) and word order violation (red line) conditions at high proficiency. Each tick mark represents 100 ms. Note that negative voltage is plotted up and voltage is in microvolts (scale = −3µV to +3 µV).
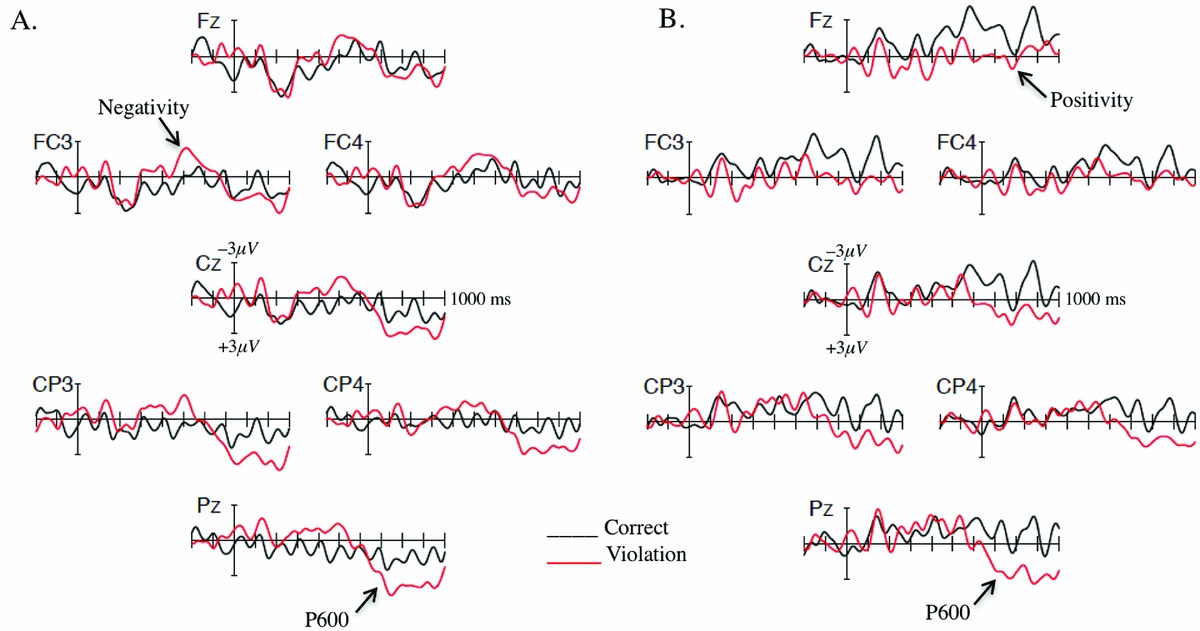
Results from the ANOVAs at high proficiency in the three time-windows of interest are presented in Table 7. There were no significant effects in the 200–400 ms time-window. In the 400–700 ms time-window, there was a significant Grammaticality × Group interaction. Follow-up analyses for this interaction confirmed an anterior positivity in the monolinguals: significant main effects of Grammaticality at frontal1 (p = .011, η2p = .36) and frontal2 (p = .011, η2p = .36), and a marginally significant effect at frontal3 (p = .092, η2p= .18), consistent with the findings reported by Morgan-Short et al. (Reference Morgan-Short, Steinhauer, Sanz and Ullman2012b). Follow-up analyses in the bilingual group yielded no significant results despite the visually-apparent anterior negativity.
F-statistics from the grand average ANOVAs on mean amplitudes at high proficiency in the 200–400 ms, 400–700 ms, and 700–1000 ms time windows

Note. Gram. = Grammaticality; Elec. = Electrode; Hemi. = Hemisphere; Antpost = Anterior/posterior; df = degrees of freedom. † p < .10; * p < .05
In the 700–1000 ms time-window there was a main effect of Grammaticality and no significant interactions. This result suggested that ungrammatical word order elicited a P600 effect across both bilinguals and monolinguals, reflecting the visual interpretation of ERP effects in the two groups (see Figures 7 and 8). To examine this directly, we conducted follow-up ANOVAs within each group. The results of these follow-ups indeed showed a marginally significant P600 in the bilingual group, F(6,72) = 3.21, p = .088, η2p = .21 and a significant P600 in the monolingual group, F(1,15) = 6.01, p = .027, η2p = .29, with similar effect sizes in the two groups.
In sum, at high proficiency in Brocanto2 both the bilinguals and monolinguals showed evidence of P600s in response to ungrammatical word order. However, the groups differed in their ERP responses preceding the P600 effect, with monolinguals showing an anterior positivity that was not observed in the bilinguals.
Discussion
This study investigated potential behavioral and neural bilingual/monolingual differences in adult additional language learning. There has been remarkably little research on potential differences in bilingual and monolingual additional language learning of grammar. Moreover, none of it has examined – as we did here – the trajectory of the learning or its neural correlates. Early Mandarin–English bilinguals and English monolinguals learned a well-studied artificial language, Brocanto2, and were compared on behavioral measures of comprehension, production, and grammaticality judgment, as well as on their ERP patterns during syntactic processing at both low and high proficiency in the language. We first discuss the results for behavioral measures, followed by discussion of the ERP results.
Discussion of behavioral outcomes
The behavioral results revealed the following. The descriptive statistics for performance during practice suggested apparent bilingual advantages in language comprehension and production. However, statistical analyses did not reveal any significant differences in practice measures between the bilinguals and monolinguals. Similarly, though both groups improved in grammatical sensitivity to syntactic word order (as measured by grammaticality judgment tests) between low and high proficiency, there were no statistical differences between the groups on these tests. The finding that bilinguals and monolinguals did not differ significantly in behavioral measures of production and comprehension, or in grammaticality judgment of word order, contrasts with research that has shown bilingual advantages in language learning or performance in other domains, including vocabulary learning, pragmatic ability, and general proficiency (see Introduction; e.g., Antoniou et al., Reference Antoniou, Liang, Ettlinger and Wong2015; Safont-Jorda, Reference Safont Jorda2003; Sanz, Reference Sanz2000).
The descriptive patterns in our behavioral measures nevertheless suggest the possibility of underlying group differences. In particular, the bilinguals appeared to show superior language production and comprehension and faster comprehension than the monolinguals, especially after the initial practice blocks and before the last few blocks, when the monolinguals performed at similar levels as the bilinguals. This pattern partially fits with the small amount of research on bilingual L3 versus monolingual L2 learning of grammar. Cox (Reference Cox2017) found that older adult bilinguals outperformed matched monolinguals on sentence interpretation (e.g., comprehension), similar to the comprehension outcomes found here. Additionally, as in the current study, Cox (Reference Cox2017) found suggestive evidence of superior production, although that study assessed written sentence production whereas the current study assessed oral sentence production. Note also that Cox (Reference Cox2017) administered interpretation and written production assessments at discrete points (immediate and delayed posttests), in contrast to the continuous assessments we acquired here during comprehension and production practice. As indicated above, the difference we observed in bilingual and monolingual performance was most pronounced in the broad middle portion of learning (see Figures 2, 3, 4); by the end of practice both groups had essentially reached ceiling performance. Overall, then, the evidence suggests that there may be differences in the trajectory of learning for bilingual L3 as compared to monolingual L2 learning, with bilinguals reaching high levels of comprehension and production ability earlier than monolinguals, though further studies are needed.
The grammaticality judgment test yielded no significant differences between bilinguals and monolinguals in their discrimination between correct word order and word order violations, at either low or high proficiency. These results align with prior work that has found no bilingual/monolingual differences in a grammaticality judgment test following artificial grammar learning (Nation & McLaughlin, Reference Nation and McLaughlin1986). Additionally, the results seem compatible with the findings reported by Cox (Reference Cox2017) of no bilingual/monolingual group differences in grammaticality judgment for participants that received explicit instruction. Nevertheless, at both low and high proficiency there was an apparent descriptive bilingual/monolingual group difference in the grammaticality judgment task. In particular, the monolinguals seemed to show better grammatical discrimination ability, on average, than bilinguals as measured by d-prime scores (see Table 5 and Figure 5). In the present study, recall that although the bilingual and monolingual groups were matched on a number of variables, there was a significant difference between monolinguals and bilinguals in the number of foreign languages they had studied, with the monolingual group having studied more languages in a classroom setting than the bilingual group (Table 2). One possible interpretation of the apparent GJT mean difference is that increased experience with classroom language learning, which was the exact setting that our Instructed training was designed to approximate, may have been advantageous to the monolingual group in performing the grammaticality judgments. However, even though the mean performance appears to be different, the 95% CIs of the two groups overlap substantially (see Table 5), underscoring the finding that the bilinguals and monolinguals in fact did not differ significantly in their grammatical judgment ability. Future studies may elucidate this issue.
Discussion of ERP outcomes
Despite the lack of clear behavioral differences in bilingual L3 and monolingual L2 learning, the ERP results revealed marked differences in bilinguals’ and monolinguals’ syntactic processing of the additional language. At low proficiency, the bilinguals showed a P600 in response to word order violations while the monolinguals did not. At high proficiency, although both groups showed P600s for word order violations, they diverged in their neural patterns preceding the P600s: in the monolinguals, word order violations elicited an anterior positivity, whereas the bilinguals did not exhibit this anterior positivity (and instead appeared to show an anterior negativity).
The P600 in the bilinguals at low proficiency is particularly striking when one considers that the monolingual group was not only matched to the bilingual group on various subject level factors (Table 2) but also on Brocanto2 practice performance at low proficiency (Table 4, LP). Moreover, the monolinguals were not significantly different at judging the same word order violations. Given the general consensus of the P600 as an index of structural conflict reanalysis or resolution, the P600 observed in the bilingual group indicates that even at a very low (just above chance) level of linguistic proficiency, bilinguals are already employing neural mechanisms commonly associated with syntactic processing in native speakers of languages. As discussed in the Introduction, in monolingual L2 learning research, on both natural and artificial languages, P600s are not often found at lower L2 proficiency (for reviews see Bowden et al., Reference Bowden, Steinhauer, Sanz and Ullman2013; Steinhauer et al., Reference Steinhauer, White and Drury2009). Indeed, several neurocognitive theories of L2 learning posit that higher levels of L2 proficiency are needed in order for L2 to approximate L1 patterns (e.g., Bates & MacWhinney, Reference Bates, MacWhinney, MacWhinney and Bates1989; Green, Reference Green, Hout, Hulk, Kuiken and Towell2003; MacWhinney, Reference MacWhinney and Robinson2001; Ullman, Reference Ullman and Sanz2005, Reference Ullman, VanPatten and Williams2015), but these do not discuss bilingual L3. The P600 observed at low proficiency in the bilinguals but not monolinguals indicates that perhaps bilingual L3 does not follow exactly the same trajectory as monolingual L2 learning that has been described in existing L2 research and related neurocognitive theories. Rather, even at quite low proficiency, the bilinguals’ L3 neural processing may already resemble patterns observed in L1 speakers of languages, even when monolinguals do not (yet) show this pattern. Thus, the evidence suggests that when learning an additional language, bilinguals may more rapidly develop (as compared to monolinguals, for at least certain aspects of language) the neural processes found in native speakers of languages – even when bilinguals do not show signficiantly better performance. Future research that further examines the trajectory of bilingual L3 using fine-grained measures of processing, such as ERPs, should help to further elaborate these issues.
So why might the bilingual group, and not the matched monolinguals, show this neural sensitivity during syntactic processing in the additional language at low proficiency? A common explanation for observed behavioral advantages in bilingual compared to monolingual language learning posits that bilinguals benefit from greater metalinguistic awareness (Dillon, Reference Dillon2009; Jessner, Reference Jessner2008), beginning even in early childhood (e.g., Bialystok, Reference Bialystok2001; Cummins, Reference Cummins, Homel, Palif and Aaronson1987). Although it is difficult to directly tie such an explanation to the P600 observed here in the bilingual group at low proficiency, one possibility is that the bilinguals possess greater metalinguistic awareness that aids them in linguistic processes that are reflected in the P600.
Another account for bilingual advantages in language learning proposes that bilinguals are more adept than monolinguals at managing cross-language interference while processing a newly-learned language. Bartolloti and Marian (Reference Bartolotti and Marian2012) suggest that interference from other languages is one of the reasons that adult language learning seems to be so difficult. They propose that bilinguals’ naturalistic experience with two languages makes them better than monolinguals at controlling between-language competition during novel word learning. Even though they propose this explanation for bilingual advantages at word learning, it might also help explain the P600 observed here for syntactic processing in the bilinguals at low proficiency. In particular, the bilinguals’ naturalistic experience with two languages may have made them more adept than the monolinguals at managing competition between their known syntax (both Mandarin and English for the bilinguals, or only English for the monolinguals) and the new Brocanto2 syntax. Better management of such cross-language syntactic competition may have manifested in the bilinguals’ ability to engage reanalysis mechanisms early in language learning (i.e., at low proficiency).
At high proficiency, both bilinguals and monolinguals showed P600s during syntactic processing. The P600 in the monolingual group is consistent with prior L2 research showing that P600s are found more reliably at higher levels of L2 proficiency (Bowden et al., Reference Bowden, Steinhauer, Sanz and Ullman2013; Steinhauer et al., Reference Steinhauer, White and Drury2009), and can be taken as evidence in support of neurocognitive theories of L2 that propose that increases in L2 proficiency enable processing to approximate patterns found for native languages (e.g., Bates & MacWhinney, Reference Bates, MacWhinney, MacWhinney and Bates1989; Green, Reference Green, Hout, Hulk, Kuiken and Towell2003; MacWhinney, Reference MacWhinney and Robinson2001; Ullman, Reference Ullman2001, Reference Ullman and Sanz2005). However, the monolinguals also showed an anterior positivity that was not observed in the bilingual group. This positivity has also been reported in other L2 ERP studies of (morpho)syntactic processing (Bowden et al., Reference Bowden, Steinhauer, Sanz and Ullman2013; Mueller, Oberecker & Friederici, Reference Mueller, Oberecker and Friederici2009), and may reflect increased engagement of attentional mechanisms (similar to the P3a component; Friedman, Cycowicz & Gaeta, Reference Friedman, Cycowicz and Gaeta2001; Polich, Reference Polich2007) in the monolingual group (Bowden et al., Reference Bowden, Steinhauer, Sanz and Ullman2013; Morgan-Short et al., Reference Morgan-Short, Steinhauer, Sanz and Ullman2012b). The fact that the bilingual group did not exhibit this neural effect suggests that the bilinguals, unlike the monolinguals, did not need to engage additional extra-linguistic attentional mechanisms during syntactic processing. Note that research on non-linguistic bilingual/monolingual differences suggests that one dimension of a bilingual advantage in cognition is tied to superior attentional control in bilinguals compared to monolinguals (e.g., Bialystok, Craik, Klein & Viswanathan, Reference Bialystok, Craik, Klein and Viswanathan2004; Costa, Hernandez & Sebastian-Galles, Reference Costa, Hernandez and Sebastian-Galles2008; but note Paap & Greenberg, Reference Paap and Greenberg2013). This may help explain the anterior positivity in the monolinguals that was not observed in the bilinguals, but will need to be more directly tested in future research.
It is worthwhile to note that in the same time period during which the monolinguals showed the anterior positivity, the bilinguals appeared to show an anterior negativity (Figures 7 and 8). This visually apparent (but not statistically significant) negativity found for the bilinguals hints at the presence of a biphasic LAN-P600 response. As mentioned in the background, the biphasic LAN-P600 response is considered by some researchers to be a key neural signature of (morpho)syntactic processing in native speakers of languages (Friederici et al., Reference Friederici, Hahne and Saddy2002a; Molinaro et al., Reference Molinaro, Barber and Carreiras2011). The potential presence of a LAN in the bilinguals, instead of the anterior positivity in the monolinguals, suggests that indeed very different processes are at play in the two groups. In particular, it seems to suggest that bilinguals may be engaging automatic syntactic processing mechanisms (reflected by the LAN) whereas the monolinguals appear to need to engage extra-linguistic attention-related processes (anterior positivity) to handle the same syntactic information. This possibility warrants further examination in future studies. Note also that ERP component overlap could in principle be masking a negativity in the monolinguals (due to a stronger positivity with the same spatiotemporal characteristics), or conversely a positivity in the bilinguals (overridden by a stronger negativity). Additionally, the apparent negativity in the bilinguals may have reduced the amplitude of their P600. For discussion of overlapping ERPs, see e.g., Roehm, Bornkessel-Schlesewsky, Rösler and Schlesewsky (Reference Roehm, Bornkessel-Schlesewsky, Rösler and Schlesewsky2007) and Tanner and Van Hell (Reference Tanner and Van Hell2014).
Directions for future research
As noted in the Introduction, very little research has examined bilingual L3 as compared to monolingual L2 learning of grammar, and none of this has probed the trajectory of learning or the underlying neural correlates, as was done in the current study. Thus, the initial study opens a variety of avenues for future research.
The present study explicitly controlled for several linguistic and experiential factors that would be interesting to independently investigate in future work. For example, English and Mandarin were selected to minimize cross-linguistic transfer issues to Brocanto2. However, future studies could manipulate cross-linguistic (dis-)similarity between the bilinguals’ two languages and the target L3 of the study, in order to test for potential effects of this variable on bilingual L3 processing, and how it compares to monolingual L2 (for a review of L2 ERP studies and of cross-linguistic similarity, see Van Hell & Tokowicz, Reference Van Hell and Tokowicz2010).
The present study also controlled for the age of acquisition of the bilinguals’ two languages, with only early bilinguals examined. Though our understanding of L3 learning and processing in early bilinguals deserves further study, investigation of the role of later (or more variable ages of) L2 acquisition on bilingual L3 learning and processing is also warranted. Bilingual proficiency in English and Mandarin was also controlled for, with only bilinguals who reported similarly high self-rated proficiency in reading, writing, speaking, and listening for both languages being eligible. Future research could examine whether variation in the proficiency of the bilinguals’ two languages might affect L3 learning and processing patterns.
Another potentially productive path for future research is whether different types of language training may influence bilingual L3 as compared to monolingual L2 grammar learning and processing. Whereas the present study employed a training condition that was designed to approximate a traditional foreign language classroom setting, it would be interesting to extend this work to other learning settings, such as immersion. Similarly, it seems important to extend the current study's investigation of bilingual L3/monolingual L2 learning and processing with controlled instructed input to actual foreign language classroom settings (i.e., outside of the laboratory context).
Finally, although the present study acquired brain measures longitudinally, these were gathered at discrete time points at low and high proficiency. It is also possible to acquire such measures continuously, throughout training (Batterink & Neville, Reference Batterink and Neville2013; Tagarelli, Reference Tagarelli2014), as was done here for behavioral measures of production and comprehension. This is an interesting possibility for future research in the examination of bilingual L3 and monolingual L2 learning.
Conclusion
To our knowledge, this is the first study to examine the neural (as well as behavioral) correlates of syntactic processing in bilingual L3 as compared to monolingual L2 learning, let alone to examine this behavioral and neural trajectory longitudinally. Although the descriptive pattern of the behavioral data suggested bilingual advantages at certain time points, the groups did not show any statistical differences in performance measures. In contrast, the ERP data revealed electrophysiological differences in bilingual and monolingual additional language learning of grammar, in at least two ways. First, even at a low level of proficiency in the additional language, bilinguals (and not the matched monolinguals) already demonstrated evidence of employing reanalysis mechanisms that are commonly observed during syntactic processing in native speakers of languages. Second, though both the bilinguals and monolinguals showed evidence of syntactic reanalysis at higher proficiency, the ERP patterns suggested that only the monolinguals also needed to engage extra-linguistic attentional mechanisms. Overall, the study supports the existing empirical trend suggesting bilingual advantages at additional language learning, and adds key insights to the still very limited existing research on grammar learning.
Appendix A
Descriptive statistics on accuracy (percent correct) for each of the 22 comprehension blocks

Descriptive statistics on response times for each of the 22 comprehension blocks

Descriptive statistics on accuracy (percent correct) for each of the 22 production blocks


