

Recent evidence from studies in humans( Reference Ortinau, Hoertel and Douglas 1 ) and rats( Reference Tantot, Parkes and Marchand 2 , Reference Furlong, Jayaweera and Balleine 3 ) indicated that high-fat diet (HFD) intake was associated with appetite suppression and reduced sensitivity to the current food value. Fish was not an exception. Studies had reported that grass carp (Ctenopharyngodon idella) had been adopted as a strategy to deal with exposure to high fat by reducing appetite( Reference Li, Yuan and Liang 4 ). The use of fat-rich feeds is the current trend in intensive aquaculture for the protein-sparing and growth-promoting effects of such diets( Reference Du, Liu and Tian 5 , Reference Li, Jiang and Liu 6 ). However, the suppression of appetite caused by excessive fat in diet would lead to a poor growth, which had limited the use of HFD in aquatic animals( Reference Li, Yuan and Liang 4 ). Therefore, it is meaningful to investigate the mechanism by which HFD induce appetite suppression.
As lipid is one of major nutrients in fish for supporting numerous physiological processes( Reference Tocher, Bell and Mcghee 7 , Reference Cai, Mai and Ai 8 ), it is not surprising that lipid levels of diet were related to appetite in fish( Reference Gélineau, Corraze and Boujard 9 ). The brain tissue of fish acts as an integrator of signals of relevance to energy balance and regulates appetite of fish by neuroendocrine secretion. Cocaine- and amphetamine-regulated transcript (CART) and neuropeptide Y (NPY) are two neuropeptides that mutually interact to inhibit or stimulate appetite( Reference Zhou, Liang and Yuan 10 , Reference Kobayashi, Peterson and Waldbieser 11 ). In teleost fish, evidence obtained in recent years pointed to the presence of sensor systems for changes in the levels of fatty acids (FA), which were related to the control of appetite through changes in mRNA expression of orexigenic and anorexigenic neuropeptides( Reference Zhou, Liang and Yuan 12 , Reference Librán-Pérez, Polakof and López-Patiño 13 ). One of these mechanisms was based on FA metabolism through inhibition of carnitine palmitoyltransferase 1 (CPT1) to import fatty-acid–CoA into the mitochondria for oxidation( Reference Gao, Moran and Lopaschuk 14 – Reference Tang, Sun and Yan 16 ). Another possible element dominating FA-sensing systems was FA transport, in which FA bind to fatty acid translocase (FAT)/cluster of differentiation 36 (CD36) and further modulates transcription factors, such as sterol regulatory element-binding protein type 1c (SREBP1c)( Reference Librán-Pérez, Polakof and López-Patiño 13 , Reference Libránpérez, Lópezpatiño and Míguez 17 ). The activation of these systems was associated with the inhibition of the orexigenic NPY and the enhancement of the anorexigenic CART, ultimately leading to the decrease in food intake( Reference Librán-Pérez, Otero-Rodiño and Míguez 18 ). Several studies had focused on FA sensing systems that were connected to the regulation of appetite in fish; however, it was still difficult to establish which factors acted in long-term experiment, as most of the available data originated from short-term acute experiments( Reference Soengas 19 ). In fact, the sensing systems characterised in rainbow trout whose activation in response to increased levels of oleate had been found to result in decreased food intake did not respond in the same way when fish were fed for 4 weeks with a lipid-enriched diet( Reference Librán-Pérez, Geurden and Dias 20 ). Was this also true for Megalobrama amblycephala? If so, which factors lead to weaker appetite? In this study, we will focus on a precise mechanism by which a HFD induces the suppressed appetite after long-term feeding of a HFD.
In addition to sensor systems for FA, the inflammatory factors are another potential contributor to the food intake of fish fed with HFD. In mammals, appetite suppression was a common and debilitating symptom that occurs as a consequence of acute and chronic inflammation( Reference Carrero, Qureshi and Axelsson 21 ). In acute experimental models, administration of lipopolysaccharide (LPS), TNF-α and IL-6 directly reduced food intake by affecting a central system that integrated the action of numerous neuropeptides( Reference SchãBitz, Pezeshki and Pohl 22 – Reference Arruda, Milanski and Romanatto 24 ). Moreover, chronic administration of LPS could induce feeding reduction in a dose-dependent manner( Reference Dudele, Fischer and Elfving 25 ). Studies in mice had shown that the appetite suppression was caused by inflammatory factors, which were related to the activation of mammalian target of rapamycin (mTOR), and inhibition of mTOR could relieve inflammation-induced appetite suppression( Reference Yue, Wang and Li 26 ). Studies in mammals have suggested that appetite suppression induced by chronic inflammation might be related to higher levels of leptin in the blood( Reference Dwarkasing, Marks and Witkamp 27 ). In mammals, leptin had a dual role as a hormone and a cytokine. As a hormone, it played a key function of modulating energy homoeostasis through mechanisms that included appetite( Reference Chu, Chen and Chen 28 ). One of the classic pathways by which leptin suppressed appetite was activation of mTOR phosphorylated by protein kinase B (Akt)( Reference Mayamonteiro and Bozza 29 ). As a cytokine, leptin had pro-inflammatory properties, and multiple inflammatory cytokines including TNF-α and IL-6 stimulated up-regulation of leptin gene expression( Reference Cava and Matarese 30 , Reference Landman, Puder and Xiao 31 ). In fish, leptin played a key role in the regulation of food intake by altering orexigenic (such as NPY) and anorexigenic (such as CART) neuropeptides to regulate appetite( Reference Li, Liang and Xie 32 ). In addition, a study in rainbow trout showed that leptin could also be activated by the AKT signalling pathway, as found in mammals( Reference Gong, Jönsson and Bjornsson 33 ). All of these facts suggest that inflammatory factors were important in regulating appetite. However, there are no available studies in fish assessing the response of appetite to inflammation, as demonstrated in mammals. A recent article showed that feeding zebrafish (Danio rerio) with a HFD for 8 weeks caused an increase of inflammatory markers( Reference Landgraf, Schuster and Meusel 34 ). Our previous study also found that the expression of TNF-α in the liver of M. amblycephala fed HFD was significantly increased, suggesting that a chronic inflammation might be developed in the HFD group( Reference Zhou, Mi and Liu 35 ). However, whether the low-chronic inflammation caused by high fat in fish was associated with food intake remained unknown.
Studies in fish have shown that long-term administration of HFD would lead to a reduction in food intake, but the precise mechanism still remained unknown. In this study, we aim to figure out the mechanism by which a HFD lead to weakened appetite.
Methods
Ethics statement
The care and use of animals and all experimental procedures involving animals were approved by the ethics committee, and conform to the ‘ARRIVE’ Guidelines for Reporting Animal Research( Reference Kilkenny, Browne and Cuthill 36 ).
Experimental diets
The composition of the basal diet and HFD is shown in Table 1. Fish meal, soyabean meal, cottonseed meal and rapeseed meal served as protein sources. Soyabean oil and fish oil were used as lipid sources. Wheat flour was adopted as a carbohydrate source. Dietary ingredients were ground into fine powder, thoroughly mixed and then blended with an additional 100 ml of water/kg of diet to form a soft dough, which was pelleted (without injected steam) using a Pillet Mill (Guangyuan Engineering Co., Ltd) with a 2-mm-diameter die. The experiment feed was dried at air temperature at 28°C overnight and stored in sealed plastic bags at −4°C until use. The proximate composition of the experimental diets was determined according to the standard Association of Official Analytical Chemists (AOAC) methodology.
Formulation and proximate composition of the experimental diets
* Premix supplied the following minerals (g/kg ) and vitamins (mg/kg): CuSO4.5H2O, 0·02 g; FeSO4.7H2O, 0·25 g; ZnSO4.7H2O, 0·22 g; MnSO4.4H2O, 0·07 g; Na2SeO3, 0·0004 g; KI, 0·00026 g; CoCl2.6H2O, 0·001 g; vitamin A, 270 mg; vitamin D, 5 mg; vitamin E, 4500 mg; vitamin K3, 220 mg; vitamin B1, 320 mg; vitamin B2, 1090 mg; niacin, 2800 mg; vitamin B5, 2000 mg; vitamin B6, 500 mg; vitamin B12, 1·6 mg; vitamin C, 5000 mg; pantothenate, 1000 mg; folic acid, 165 mg; choline, 60 000 mg.
Experimental diets were analysed for FA profiles using GC (6890 series; Agilent Technologies) according to the American Oil Chemists’ Society method. The FA composition of the basal diet and HFD is shown in Table 2.
Fatty acid composition of the normal-fat diet (NFD) and high-fat diet (HFD)

Fish and experimental design
Juvenile M. amblycephala were obtained from a local fish hatchery (Nanjing, China). Before the experiment, fish were reared in several floating net cages (2×1×1 m, length:width:height) for 1 month to acclimate to the experimental conditions. During this period, fish were domesticated to eat in the upper aquifer. After a 1-month acclimation, 120 fish of similar sizes (average initial weight: 40·00 (sem 0·35) g) were randomly distributed into eight cages, which were anchored in an outdoor pond. Juvenile M. amblycephala were divided into two groups for 60 d and each treatment had four replicates. Fish in the control group were fed a normal-fat diet (NFD, 6 % lipid), whereas those in the treatment group were fed a HFD (11 % lipid). Body weight of fish in each replicate was measured once every 15 d, and food intake was determined every 3 d. We kept feeding until the fish did not eat in the upper layer. Fish were hand-fed to apparent satiation three times daily (08.00, 12.00 and 17.00 hours) for 60 d. Fish intake was indicated by cumulative food intake per fish. Cumulative food intake per fish=cumulative food intake in each cage/the number of fish in each cage. Water temperature varied from 27 to 30°C, and pH fluctuated between 7·2 and 7·6. Ammonia nitrogen and nitrite nitrogen were maintained below 0·4 and 0·064 mg/l, respectively. Dissolved oxygen was maintained above 6·00 mg/l during the feeding trial.
Sample collection
At the end of the feeding trial, approximately 24 h after the last feeding, sampling was started. All fish were quickly removed from each cage and anaesthetised in diluted MS-222 (tricaine methanesulfonate; Sigma) at a concentration of 100 mg/l. Total number and weight of fish in each cage were determined to calculate the growth performance. A total of six fish were randomly removed from each cage and blood sample was collected by caudal vein puncture using heparinised syringes coated with lithium heparin as an anti-coagulant. After centrifugation (3000 g for 10 min at 4°C), plasma was stored at –80°C for subsequent analysis. Then, fish were killed immediately by decapitation, individual brains were dissected over an ice bed, washed thoroughly with chilled saline (0·89 g/l NaCl) and stored at –80°C for the analysis of gene expression.
Plasma biochemical assays
The serum level of total TAG was measured with a Hitachi 7180 800T/H automatic biochemistry analyzer (Hitachi). Measurement of NEFA concentration was carried out in duplicate using an enzymatic colourimetric method, using the Wako NEFA C kit (Wako Chemicals Inc.). The concentration of serum leptin was determined using the mouse insulin ELISA kit according to the manufacturer’s instructions (R&D Systems, no. DLP00).
Plasma inflammatory markers
The concentrations of serum TNF-α, IL-6 and monocyte chemoattractant protein-1 (MCP-1) were measured using cytokine-specific ELISA kits according to the manufacturer’s instructions (R&D Systems, nos MTA00B, D6050 and DCP00). Plasma nitric oxide (NO) levels were determined by the nitrate reductase assay using a commercial kit (reference no. A012) produced by Jianchen, Bioengineering Institute (Nanjing, China).
Quantitative RT-PCR analysis
Total RNA was isolated from liver and brain using Trizol reagent (Invitrogen) according to the manufacturer’s instructions, and treated with RQ1 RNase-free DNase (Promega) to eliminate genomic DNA contamination. Quantity and purity of isolated RNA were later determined by absorbance measures at 260 and 280 nm, respectively. The integrity of RNA was tested by electrophoresis in 1·0 % formaldehyde denaturing agarose gels. The mRNA expressions were detected in brain and adipose tissue.
Total RNA was reverse-transcribed using a RT-PCR Kit (Takara) according to the instructions of SYBR® PrimeScript™. The volume of PCR reactions was 10 μl, containing 0·5 μl of deoxy-ribonucleoside triphosphate (dNTP) mixture (10 mm each), 0·25 μl of RNase inhibitor (40 U/μl), 0·5 μl of primer (50 mm), 0·25 μl of ExScript™ RTase (200 U/μl), 2·0 μl of buffer (5×) and 6·5 μl of diethyl pyrocarbonate (DEPC) water. The cycling conditions were set as follows: 42°C for 40 min, 90°C for 2 min and 4°C thereafter.
After reverse transcription, target complementary DNA (cDNA) was diluted and amplified by RT-PCR using an SYBR Green II Fluorescence Kit (Takara Bio Inc.) to determine the mRNA abundance. Primers were designed based on the available sequences in M. amblycephala (Table 3). RT-PCR was conducted in a MiniOpticon real-time detector (Bio-Rad). The protocol consisted of forty cycles, with the first step of denaturation at 95°C for 30 s, a final extension of 95°C for 5 s and annealing at 60°C for 34 s. Each sample was run in triplicate, and PCR reactions without target cDNA were adopted as negative controls. At the end of the reaction, the fluorescent data were converted into C
t values. Then, each transcript level was normalised to β-actin using the
 $$2^{{-\Delta \Delta }} ^{{C_{{\rm t}} }} $$
method.
$$2^{{-\Delta \Delta }} ^{{C_{{\rm t}} }} $$
method.
Real-time PCR primer sequences

NPY, neuropeptide Y; CART, cocaine- and amphetamine-regulated transcript; IκB, inhibitor of κB; CPT1, carnitine palmitoyltransferase 1; ACO, acetyl-CoA oxidase; FAT, fatty acid translocase; SREBP1c, sterol regulatory element-binding protein type 1c; AKT, protein kinase B; mTOR, mammalian target of rapamycin; EF1α, elongation factor 1α.
Lipopolysaccharide injection
Megalobrama amblycephala juveniles were obtained from the local fish hatchery (Nanjing, China). Before the experiment, fish were kept in tanks to acclimate to the experiment by feeding with a commercial diet, which contains 6 % lipid and 30 % crude protein, for 2 weeks. Next, 160 fish with a mean body weight of 40·00 (sem 0·5) g were randomly distributed into sixteen tanks (300 litres each). Fish were divided into two treatment groups and each treatment had eight replicates: one group was injected intraperitoneally with LPS (injected intraperitoneally with LPS) at dosages of 2 mg/kg and another group was injected with PBS as the control group. Fish were allowed to access food at 3, 6, 9, 12, 18, 24 and 48 h and food intake was recorded. In all, two groups with four replicates were used for brain tissue sampling, for gene analysis. Other two groups with four replicates were used for determination of food intake.
Statistical analysis
Data concerning chronic experiment were subjected to independent sample t test using the SPSS program version 19.0 (SPSS Inc.) for Windows, after testing the normality and homogeneity of variances with the Levene test. Data for LPS injection were subjected to one-way ANOVA and independent sample t test using the SPSS program version 19.0 for Windows. The normality and homogeneity were tested using Levene’s test for equality of variance. Duncan’s multiple-range test was used to compare the significance of gene expression and food intake among different times after injection of PBS and LPS. Independent sample t test was used to compare gene expression and food intake between the fish injected with PBS and LPS at the same times. Differences were considered statistically significant at P<0·05. All data were presented as means with their standard error of the mean of four replicates.
Results
Growth performance
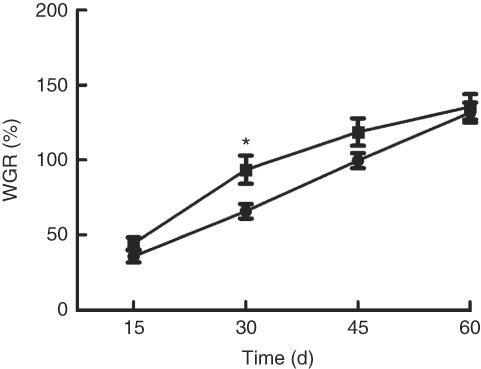
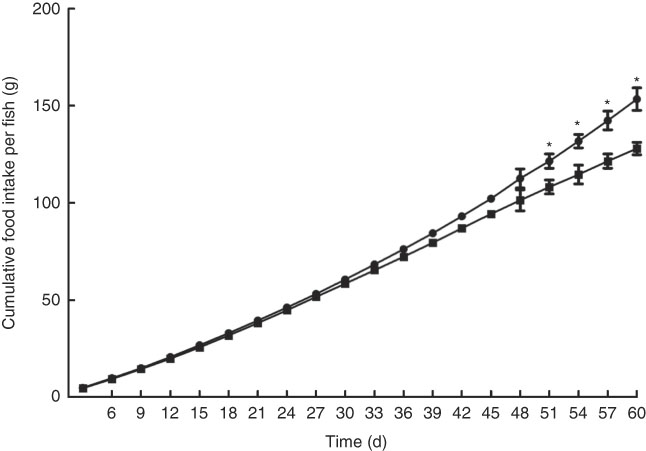
Growth performance of M. amblycephala fed different dietary fat levels is presented in Fig. 1. Weight gain rate (WGR) was significantly (P<0·05) higher in the HFD for 30 d than that in the NFD, whereas WGR showed no significant differences between two groups fed for 60 d. Food intake of M. amblycephala fed different dietary fat levels is presented in Fig. 2. Food intake of M. amblycephala tended to decline significantly when fish were fed the HFD for 48 d.
Weight gain rate (WGR) in blunt snout bream (Megalobrama amblycephala) fed a normal-fat diet (NFD, ![]() ) or high-fat diet (HFD,
) or high-fat diet (HFD, ![]() ) for 60 d. WGR=(final body weight − initial body weight)×100/initial body weight. Values are means (n 4), with their standard errors represented by vertical bars. * Mean values were significantly different between treatment and control groups (P<0·05).
) for 60 d. WGR=(final body weight − initial body weight)×100/initial body weight. Values are means (n 4), with their standard errors represented by vertical bars. * Mean values were significantly different between treatment and control groups (P<0·05).
Cumulative food intake in blunt snout bream (Megalobrama amblycephala) fed a normal-fat diet (NFD, ![]() ) or high-fat diet (HFD,
) or high-fat diet (HFD, ![]() ) for 60 d. Values are means (n 4), with their standard errors represented by vertical bars. * Mean values were significantly different between treatment and control groups (P<0·05).
) for 60 d. Values are means (n 4), with their standard errors represented by vertical bars. * Mean values were significantly different between treatment and control groups (P<0·05).
Plasma biochemistry parameters
Plasma leptin, TAG and NEFA concentrations were reported in Table 4. Compared with the basic control group (NFD), plasma leptin, TAG and NEFA concentrations were significantly increased in the group fed the HFD (P<0·05).
Plasma biochemistry parameters in Megalobrama amblycephala fed the normal-fat diet (NFD) or high-fat diet (HFD) for 60 d*
* Four fish per group for data analysis (n 4).
Inflammatory markers
Data on inflammatory marker concentrations in plasma are shown in Table 5. Compared with the basic control group (NFD), the HFD significantly increased (P<0·05) the circulating protein levels of pro-inflammatory cytokines TNF-α, IL-6 and MCP-1. Similarly, the concentration of NO, a marker of inflammation, was significantly higher (P<0·05) than that of the control group (NFD).
Inflammatory markers in Megalobrama amblycephala fed the normal-fat diet (NFD) or high-fat diet (HFD) for 60 d*
MCP-1, monocyte chemoattractant protein-1; NO, nitric oxide.
* Four fish per group for data analysis (n 4).
Expressions of genes involved in appetite, fatty acid sensing and inflammation
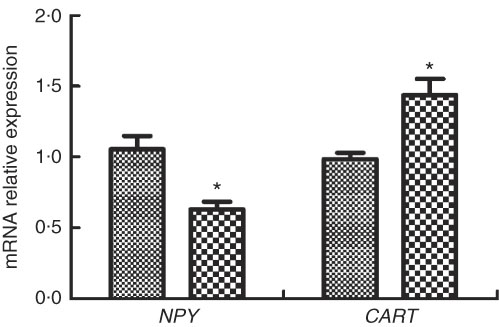
The expressions of appetite genes in M. amblycephala fed different dietary fat levels are presented in Fig. 3. Compared with the basic control group (NFD), the expression of NPY was significantly lower and the expression of CART was significantly higher in the HFD group (P<0·05).
Relative gene expression of neuropeptide Y (NPY) and cocaine- and amphetamine-regulated transcript (CART) in brain of blunt snout bream (Megalobrama amblycephala) fed a normal-fat diet (NFD, ![]() ) or high-fat diet (HFD,
) or high-fat diet (HFD, ![]() ) for 60 d. Values are means (n 4), with their standard errors represented by vertical bars. * Mean values were significantly different between treatment and control groups (P<0·05).
) for 60 d. Values are means (n 4), with their standard errors represented by vertical bars. * Mean values were significantly different between treatment and control groups (P<0·05).
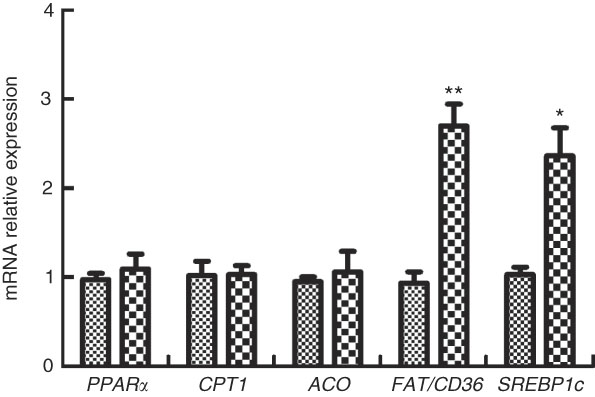
The expressions of genes involved in FA sensing in M. amblycephala fed different dietary fat levels are presented in Fig. 4. The mRNA levels of PPARα, CPT1 and acetyl-CoA oxidase (ACO) showed no significant difference (P>0·05) between the two groups, whereas the mRNA levels of FAT/CD36 and SREBP1c were higher in the HFD group than those in the NFD group (P<0·05).
Relative gene expression of PPARα, carnitine palmitoyltransferase 1 (CPT1), acetyl-CoA oxidase (ACO), fatty acid translocase (FAT/CD36) and sterol regulatory element-binding protein type 1c (SREBP1c) in brain of blunt snout bream (Megalobrama amblycephala) fed a normal-fat diet (NFD, ![]() ) or high-fat diet (HFD,
) or high-fat diet (HFD, ![]() ) for 60 d. Values are means (n 4), with their standard errors represented by vertical bars. Mean values were significantly different between treatment and control groups: * P<0·05 and ** P<0·01.
) for 60 d. Values are means (n 4), with their standard errors represented by vertical bars. Mean values were significantly different between treatment and control groups: * P<0·05 and ** P<0·01.
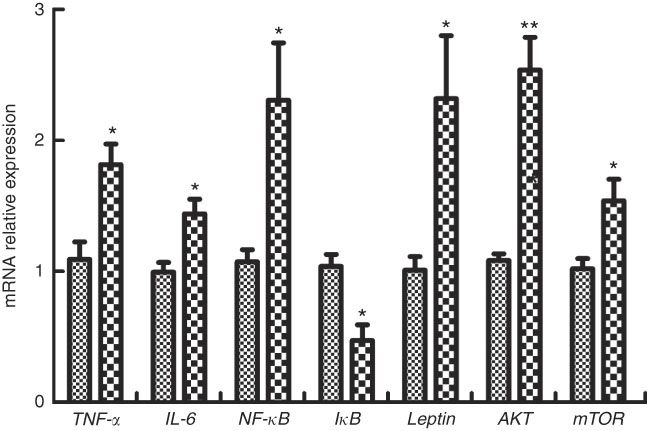
The expressions of genes involved in inflammatory factors in M. amblycephala fed different dietary fat levels are presented in Fig. 5. Compared with the basic control group (D1), the mRNA levels of IL-6, TNF-α and NF-κB were significantly increased (P<0·05) in fish of the HFD group, and the mRNA level of inhibitor of κB (IκB) showed an opposite trend. Furthermore, genes involved in cellular signalling, mTOR, Akt and leptin were significantly increased (P<0·05) in the HFD group.
Relative gene expression of TNF-α, IL-6, NF-κB, inhibitor of κB (IκB), leptin, mammalian target of rapamycin (mTOR) and protein kinase B (AKT) in brain of blunt snout bream (Megalobrama amblycephala) fed a normal-fat diet (NFD, ![]() ) or high-fat diet (HFD,
) or high-fat diet (HFD, ![]() ) for 60 d. Values are means (n 4), with their standard errors represented by vertical bars. Mean values were significantly different between treatment and control groups: * P<0·05, ** P<0·01.
) for 60 d. Values are means (n 4), with their standard errors represented by vertical bars. Mean values were significantly different between treatment and control groups: * P<0·05, ** P<0·01.
Effect of lipopolysaccharide injection
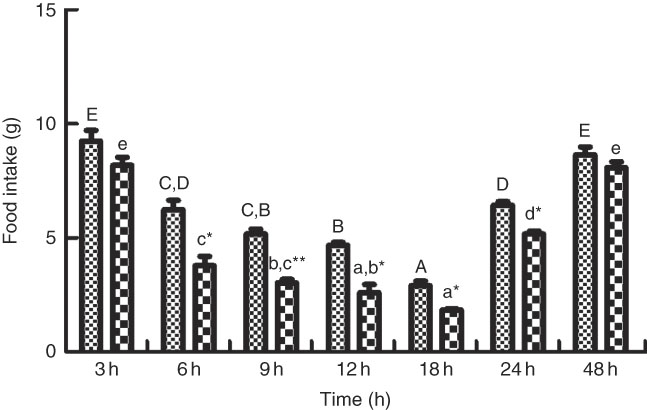
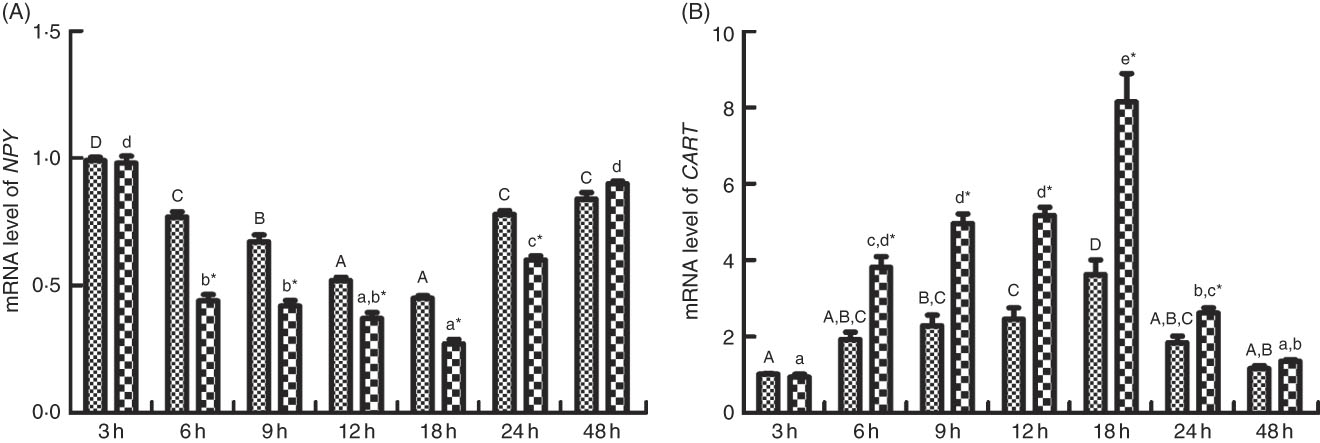
As shown in Figs. 6 and 7, the change of food intake among different times after PBS injection shared similar trends with those in the LPS-injection group. Food intake significantly reduced (P<0·05) at 6 h after PBS and LPS injection, reached the lowest at 18 h (P<0·05) and rose back to normal at 48 h. Comparing food intake between the fish injected with PBS and LPS at the same times, at 6, 9, 12, 18 and 24 h, the food intake in fish injected with LPS was significantly lower (P<0·05) than those of PBS injection. The expression patterns of NPY shared similar trend with the profiles of food intake (Fig. 7(A)). In terms of CART expression, an opposite trend with NPY was observed (Fig. 7(B)). CART transcripts were quickly up-regulated (P<0·05) at 6 h after PBS and LPS injection, reached the peak level at 18 h (P<0·05) and dropped back to normal level at 48 h. At 6, 9, 12, 18 and 24 h, the mRNA levels of CART in fish injected with LPS were significantly higher (P<0·05) than those of PBS.
The food intake of blunt snout bream injected intraperitoneally with PBS (![]() ) and lipopolysaccharide (LPS (
) and lipopolysaccharide (LPS (![]() ), 2 mg/kg). Values are means (n 4), with their standard errors represented by vertical bars. A,B,C,D,E Mean values with unlike letters were significantly different in the same model among groups at 3, 6, 9, 12, 18, 24 and 48 h after PBS was injected (P<0·05). a,b,c,d,e Mean values with unlike letters were significantly different in the same model among groups at 3, 6, 9, 12, 18, 24 and 48 h after LPS was injected (P<0·05). Meanwhile, the star bars also indicate the significance between the two treatments (PBS and LPS) at same time points. Mean values were significantly different between treatment and control groups: * P<0·05 and ** P<0·01.
), 2 mg/kg). Values are means (n 4), with their standard errors represented by vertical bars. A,B,C,D,E Mean values with unlike letters were significantly different in the same model among groups at 3, 6, 9, 12, 18, 24 and 48 h after PBS was injected (P<0·05). a,b,c,d,e Mean values with unlike letters were significantly different in the same model among groups at 3, 6, 9, 12, 18, 24 and 48 h after LPS was injected (P<0·05). Meanwhile, the star bars also indicate the significance between the two treatments (PBS and LPS) at same time points. Mean values were significantly different between treatment and control groups: * P<0·05 and ** P<0·01.
Relative gene expression of neuropeptide Y (NPY, A) and cocaine- and amphetamine-regulated transcript (CART, B) in brain of blunt snout bream injected intraperitoneal with lipopolysaccharide (LPS (![]() ), 2 mg/kg) and PBS (
), 2 mg/kg) and PBS (![]() ). Values are means (n 4), with their standard errors represented by vertical bars. A,B,C,D Mean values with unlike letters were significantly different in the same model among groups at 3, 6, 9, 12, 18, 24 and 48 h after PBS was injected (P<0·05). a,b,c,d Mean values with unlike letters were significantly different in the same model among groups at 3, 6, 9, 12, 18, 24 and 48 h after LPS was injected (P<0·05). Meanwhile, the star bars also indicate the significance between the two treatments (PBS and LPS) at same time points. * Mean values were significantly different between treatment and control groups (P<0·05).
). Values are means (n 4), with their standard errors represented by vertical bars. A,B,C,D Mean values with unlike letters were significantly different in the same model among groups at 3, 6, 9, 12, 18, 24 and 48 h after PBS was injected (P<0·05). a,b,c,d Mean values with unlike letters were significantly different in the same model among groups at 3, 6, 9, 12, 18, 24 and 48 h after LPS was injected (P<0·05). Meanwhile, the star bars also indicate the significance between the two treatments (PBS and LPS) at same time points. * Mean values were significantly different between treatment and control groups (P<0·05).
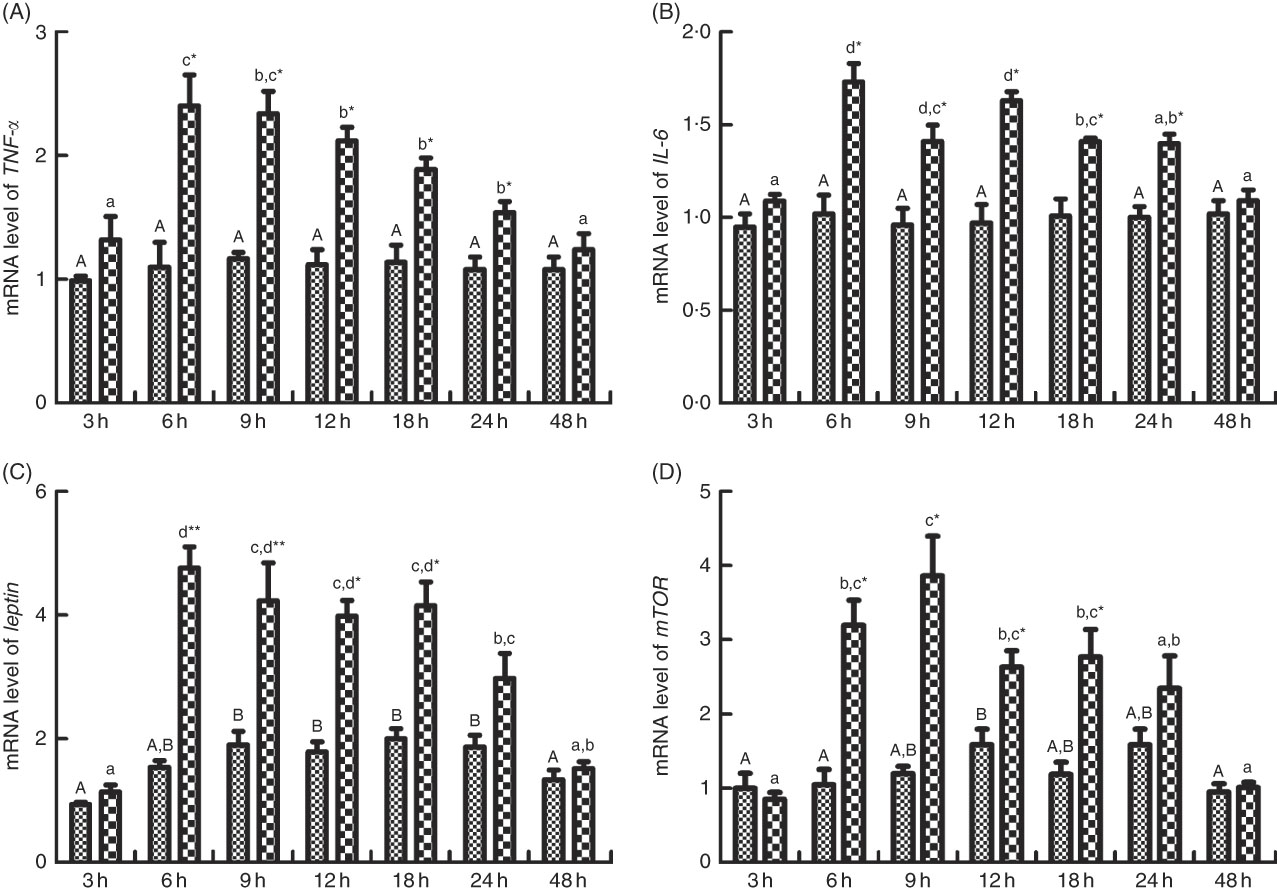
The mRNA expression levels of TNF-α, IL-6, leptin and mTOR are shown in Fig. 8(A)–(D). No significant differences in mRNA expression of TNF-α and IL-6 were observed among different times after PBS injection. However, the mRNA levels of TNF-α were increased significantly (P<0·05) and peaked at 6 h after LPS injection and descended down to normal level at 48 h (Fig. 8(A)). The expression of IL-6 increased (P<0·05) and peaked at 6 h after LPS injection, increased (P<0·05) again at 12 h after a down-regulation at 9 h, followed by a recovery at 48 h (Fig. 8(B)). Comparing mRNA expressions of TNF-α and IL-6 between the fish injected with PBS and LPS at the same times, at 6, 9, 12, 18 and 24 h, the expression level of TNF-α and IL-6 significantly up-regulated (P<0·05) in fish injected with LPS than those of PBS (Fig. 8(A) and (B)). Leptin transcripts were significantly up-regulated (P<0·05) at 6, 9, 12 and 24 h after PBS injection, whereas leptin transcripts were significantly up-regulated (P<0·05) and peaked at 6 after LPS injection, and then descended down to normal level at 48 h. The mRNA expression of mTOR was significantly (P<0·05) elevated at 12 h after PBS injection, whereas mTOR transcripts were significantly up-regulated (P<0·05) at 6 h after LPS injection, reached the highest level at 9 h (P<0·05) and descended down to normal level at 48 h. Comparing mRNA expressions of leptin and mTOR between the fish injected with PBS and LPS at the same times, at 6, 9, 12 and 18 h, the expression level of leptin and mTOR significantly up-regulated (P<0·05) in fish injected with LPS than those of PBS.
Relative gene expression of TNF-α (A), IL-6 (B), leptin (C) and mammalian target of rapamycin (mTOR, D) in brain of blunt snout bream injected intraperitoneally with PBS (![]() ) and lipopolysaccharide (LPS (
) and lipopolysaccharide (LPS (![]() ), 2 mg/kg). Values are means (n 4), with their standard errors represented by vertical bars. A,B Mean values with unlike letters were significantly different in the same model among groups at 3, 6, 9, 12, 18, 24 and 48 h after PBS was injected (P<0·05). a,b,c,d Mean values with unlike letters were significantly different in the same model among groups at 3, 6, 9, 12, 18, 24 and 48 h after LPS was injected (P<0·05). Meanwhile, the star bars also indicate the significance between the two treatments (PBS and LPS) at same time points. Mean values were significantly different between treatment and control groups: * P<0·05 and ** P<0·01.
), 2 mg/kg). Values are means (n 4), with their standard errors represented by vertical bars. A,B Mean values with unlike letters were significantly different in the same model among groups at 3, 6, 9, 12, 18, 24 and 48 h after PBS was injected (P<0·05). a,b,c,d Mean values with unlike letters were significantly different in the same model among groups at 3, 6, 9, 12, 18, 24 and 48 h after LPS was injected (P<0·05). Meanwhile, the star bars also indicate the significance between the two treatments (PBS and LPS) at same time points. Mean values were significantly different between treatment and control groups: * P<0·05 and ** P<0·01.
Discussion
The use of fat-rich feeds was a current trend in intensive aquaculture for saving protein; however, studies in recent years have shown that excess fat in diet may cause a poor growth performance( Reference Li, Yuan and Liang 4 ). Similar results were also observed from previous research in our laboratory – that HFD show no significant effects and tend to reduce the growth performance of M. amblycephala ( Reference Xu, Chen and Chen 37 ). In this study, we found that the impact of a HFD on growth was time-dependent in M. amblycephala. Fish fed the HFD for 30 d showed a significant elevation in WGR, whereas there was no significant difference in WGR between two groups when fish were fed diets with different fat levels for 60 d. We compared several experiments in rainbow trout and found similar results. Rainbow trout fed a lipid-enriched diet for 4 weeks exhibited a significant increase in WRG( Reference Librán-Pérez, Geurden and Dias 20 ), whereas trout fed a HFD for 7 weeks showed no significant differences in WRG( Reference Gélineau, Bolliet and Corraze 38 ). Moreover, a recent study in zebrafish also showed similar results – that a sharply increasing trend of weight in zebrafish fed HFD was observed, but the increase of weight was slower after feeding HFD for 4 weeks( Reference Landgraf, Schuster and Meusel 34 ). The reason why a short-term (30 d) HFD could promote growth but a long-term (60 d) HFD failed might be associated with the appetite suppression of fish in the HFD group. In this study, fish fed a HFD for 60 d showed a decrease in food intake, whereas there was no significant difference in food intake during the first 30 d. Other comparable studies carried out in rainbow trout similarly observed a significant decreased food intake owing to the higher dietary lipid content( Reference Gélineau, Corraze and Boujard 9 ), whereas trout fed a HFD for 4 weeks displayed no decrease in food intake( Reference Librán-Pérez, Geurden and Dias 20 ). Lower food intake observed in long-term feeding of HFD may be attributed to the slowness in growth performance of M. amblycephala. It is well known that food intake of fish was related to the expression of neuropeptides in the brain( Reference Zhou, Liang and Yuan 39 , Reference Liu, Liang and Li 40 ). In the present study, NPY mRNA levels were significantly down-regulated, whereas the opposite trend was observed in CART mRNA levels in the brain of fish offered a HFD, indicating that HFD could suppress appetite. Similar results in grass carp had also been reported: HFD feeding for 8 weeks contributed to elevated mRNA level of CART and decreased mRNA level of NPY, actions both in favour of suppressed appetite( Reference Li, Yuan and Liang 4 ). In teleost fish, evidence obtained in recent years was linked to the presence of sensor systems for FA, which were related to the control of appetite through changes in the expression of orexigenic neuropeptides( Reference Librán-Pérez, Polakof and López-Patiño 13 , Reference Soengas 19 ). In addition, suppression of appetite in mammals was a common and debilitating symptom that occured as a consequence of acute and chronic inflammation( Reference Dwarkasing, Marks and Witkamp 27 ). In the current study, the circulating levels of FA and inflammatory factors in plasma were elevated significantly after long-term high-fat feeding. As both levels of FA and inflammatory factors were potential factors that induced appetite suppression, the next context would focus on exploring the precise mechanism of appetite suppression induced by high fat.
In teleost fish, short-term acute experiments, such as intraperitoneal or in vitro administration of oleate (long-chain fatty acids) or octanoate (medium-chain fatty acids), had demonstrated the presence of sensor systems for FA, which perceived the levels of FA contributing to changes in neuropeptide expression( Reference Gao, Moran and Lopaschuk 14 , Reference Migrenne, Magnan and Cruciani-Guglielmacci 15 ). However, the precise connection between changes in FA sensing and the expression of neuropeptide factors was not known even in mammals, although several possibilities had been suggested in fish, such as suppression of FA mitochondrial metabolism and activation of FA transport( Reference Tang, Sun and Yan 16 , Reference Libránpérez, Lópezpatiño and Míguez 17 , Reference Soengas 19 ). In this experiment, the HFD significantly increased circulating FA level, which was evidenced by elevated concentrations of TAG and NEFA in plasma. However, whether this persistent hyperlipidaemia resulting from a long-term HFD was linked to appetite suppression had not been explored. It was well reported that PPARα could facilitate the metabolism of FA by regulating the key enzymes involved in FA oxidation, such as CPT1, which was regarded as a reliable marker of mitochondrial FA oxidation( Reference Lu, Zhang and Wang 41 ). Data in current experiment showed that the abundance of PPARα and CPT1 gene expression in brain was not affected by the fat level in diets. In addition, the gene expression of ACO, known as enzymes regulating FA oxidation, showed no significant difference between the two groups. These data suggested that FA sensing based on mitochondrial oxidation was not activated in brain of M. amblycephala fed the HFD. This result was inconsistent with our previous findings in which the mRNA level in liver of PPARα and CPT1 in M. amblycephala of the HFD group was significantly lower than that in the NFD group( Reference Lu, Xu and Wang 42 ). In that study, Lu et al.( Reference Lu, Xu and Wang 42 ) held this view that the decline in expression of PPARα and CPT1 was attributed to mitochondrial dysfunction caused by fat accumulation in liver. Different from liver, brain was a tissue for informational integration and almost no reports had shown that HFD could cause mitochondrial dysfunction in brain of fish. Facing higher circulating level of FA, brain tissue perhaps developed other adaptive strategies, such as strengthening the transport of FA. FAT (CD36) was the translocase responsible for transmembrane transport of FA( Reference Zhou, Li and Lin 43 ). In this research, the mRNA level of FAT/CD36 and SREBP1c was significantly elevated owing to the higher dietary lipid content. Similar findings had also been reported in grass carp that the mRNA level of FAT/CD36 was increased in fish fed HFD( Reference Tian, Liu and Gao 44 ). The data obtained in recent years confirmed that FA regulated appetite possibly by directly binding to FAT/CD36 and then activated SREBP1c( Reference Libránpérez, Lópezpatiño and Míguez 17 , Reference Soengas 19 ). However, Librán-Pérez et al.( Reference Librán-Pérez, Geurden and Dias 20 ) had also reported that FA sensing based on FAT/CD36 in fish was more dependent on the presence of specific FA, such as oleate or octanoate, rather than global FA. In our opinion, the higher mRNA levels of FAT/CD36 and SREBP1c observed in this experiment might be owing to the differences in FA composition between the HFD and NFD and the fact that fish fed a long-term HFD consumed more specific FA. Activation of sensor systems for FA by directly binding to FAT/CD36 was more dependent on specific FA, whereas appetite suppression caused by the HFD was independent of specific FA. Therefore, we hold that the decline in appetite caused by the HFD might be partly, not only, mediated by FA sensing based on FA transport. There were other factors involved in the HFD that suppressed appetite.
In addition to sensor systems for FA, the inflammatory factors were known to be other potential contributors to the appetite suppression of fish fed HFD. In mammals, suppression of appetite was a common and debilitating symptom that occured as a consequence of acute and chronic inflammation( Reference Dwarkasing, Marks and Witkamp 27 ). Our previous study found that the expression of TNF-α in the liver of M. amblycephala fed HFD was significantly increased, suggesting that chronic inflammation might be developed in the HFD group( Reference Zhou, Mi and Liu 35 ). In this study, we systematically monitored the inflammatory response induced by long-term feeding of the HFD. The data showed that the mRNA levels of TNF-α, IL-6 and MCP-1 in the brain and the protein content of those inflammatory cytokines were significantly up-regulated in the HFD group. In addition, the NO content in plasma, considered as an inflammatory marker, was significantly increased in the HFD group. In fish, the up-regulation of the inflammatory factors mRNA expression might be related to signalling molecules for regulation of inflammatory gene transcriptions. One of the upstream signalling molecules of pro-inflammatory factors was NF-κB( Reference Dong, Jiang and Liu 45 ). Once NF-κB was activated, it induced the expression of multiple inflammatory mediators, including TNF-α, IL-6 and MCP-1( Reference Wang, Yang and Ji 46 ). IκB, a cytoplasmic protein, binded to NF-κB and masked the nuclear localisation sequence, thereby preventing the nuclear translocation( Reference Correa, Matsui and Tergaonkar 47 ). It had been reported that the down-regulation of IκB gene expression stimulated nuclear translocation of NF-κB, thus evoking the transcription of NF-κB target genes( Reference Yu, Chen and Bao 48 ). Data in this research showed that long-term HFD facilitated NF-κB nuclear translocation to elevate pro-inflammatory factor expression by down-regulating the expression of IκB in brain. Those data in this experiment suggest that HFD feeding would leave M. amblycephala in long-term chronic inflammation. Studies in mammals showed that leptin was involved in the regulation of appetitive gene expression by inflammatory factors( Reference Dwarkasing, Marks and Witkamp 27 ). In this study, data showed that the mRNA expression of leptin in the brain and its protein context in plasma were significantly increased in fish fed the HFD. In fish, a similar result in grass carp had also been reported – that long-term feeding of HFD resulted in a significant increase in the mRNA level of leptin ( Reference Li, Yuan and Liang 4 ). In mammals, one of the classic pathways by which leptin regulated appetite suppression was the activation of mTOR phosphorylated by AKT( Reference Mayamonteiro and Bozza 29 ). In this study, the mRNA levels of AKT and mTOR were increased in the HFD group than those in the NFD group. Similar results in rainbow trout had also been reported – that higher protein levels of AKT and mTOR were observed in fish fed a HFD( Reference Librán-Pérez, Geurden and Dias 20 ). Our data thus confirm that inflammation was a potential factor for appetite suppression induced by HFD through elevating the expression of leptin and then activating mTOR.
To further verify the effects of inflammatory cytokines on appetite neuropeptides in M. amblycephala, LPS was administered by intraperitoneal injection to induce an inflammatory response. The results showed that inflammation occurred at 6 h after injection and disappeared 48 h later. Similar results had also been reported in Eriocheir sinensis and M. amblycephala that inflammatory response reached its peak at 6–12 h after LPS injection( Reference Zhou, Mi and Liu 35 , Reference Li, Jia and Li 49 ). Concerning appetite, data in current study revealed that appetite was significantly suppressed in fish injected with LPS when the inflammatory response was processing, which was directly evidenced by a decrease in food intake and was further evidenced by the significantly decreased expression of NPY and the significantly elevated expression of CART. Furthermore, the mRNA levels of leptin and mTOR were significantly increased after LPS injection. In rats, decreased food intake owing to LPS injection was associated with activation of mTOR, and blocking the mTOR pathway significantly attenuated appetite suppression induced by LPS( Reference Yue, Wang and Li 26 ). These results suggested that inflammation-induced appetite suppression in M. amblycephala might be related to the molecular signalling of leptin-activated mTOR.
In summary, the suppression of appetite was responsible for the reason that long-term HFD failed to promote the growth of M. amblycephala. The decline in appetite caused by high fat may be partly, not the only, mediated by sensor systems for FA based on FA transport. Besides, the inflammation was another potential contributor to the appetite suppression of fish fed a HFD. Results from this study implied inflammatory factors induced by HFD might be involved in the regulation of appetite by increasing the secretion of leptin and then activating mTOR.
Acknowledgements
The authors are grateful to members of Aquatic Animal Nutrition Group of Nanjing Agricultural University (CongCong Wang, Li Zhang, XiuFei Cao and JiaDai Liu) for assistance with sample collection.
This research was supported by the National Natural Science Foundation of China (G.-Z. J., grant no. 31502178), China Agriculture Research System (W.-B. L., grant no. CARS-45-14) and the Fundamental Research Funds for the Central Universities (G.-Z. J., grant no. KJQN201612).
The authors’ contributions were as follows: Y.-J. D., G.-Z. J. and W.-B. L. designed the research; Y.-J. D. and W.-B. L. formulated the research question; Y.-J. D. and X.-Y. Y. conducted the research and analysed the data; and all authors contributed to writing the article and had primary responsibility for the final content. All authors read and approved the final manuscript.
The authors declare that there are no conflicts of interest.


