

The Canadian population is aging. Biological and social changes that occur with aging increase the risk of developing chronic conditions and functional loss leading to frailty. Older adults living with frailty are more vulnerable to minor stressors, take longer to recover from illness, and have difficulty participating in daily activities. Frailty is broadly seen as a state of increased vulnerability and functional impairment caused by cumulative declines across multiple systems (Fried et al., Reference Fried, Tangen, Walston, Newman, Hirsch, Gottdiener, Seeman, Tracy, Kop, Burke and McBurnie2001; Rockwood et al., Reference Rockwood, Song, MacKnight, Bergman, Hogan, McDowell and Mitnitski2005). In 2009/10, an estimated 20.4% of British Columbians aged 65 years and older living in the community (of 128,000 people) were frail (Hoover et al., Reference Hoover, Rotermann, Sanmartin and Bernier2013). Furthermore, in general, as most caregivers tend to be women and as couples age together, it is women who tend to take on the caregiver role making them more vulnerable than men to adverse health impacts including frailty. At the healthcare system level, frailty and its associated increased risk of adverse outcomes lead to increased use of healthcare services and costs, independently of age and other chronic conditions (Cesari et al., Reference Cesari, Prince, Thiyagarajan, De Carvalho, Bernabei, Chan, Gutierrez-Robledo, Michel, Morley, Ong, Rodriguez Manas, Sinclair, Won, Beard and Vellas2016). However, frailty exists on a spectrum (Fit for Frailty, n.d.), and while frailty is often chronic and progressive, it is also dynamic, and some patients may be able to improve their frail status (Espinoza & Fried, Reference Espinoza and Fried2007).
In September 2019, the Canadian Frailty Network developed The Canadian AVOID Frailty Strategy, a health campaign using the acronym AVOID (Activity, Vaccinate, Optimize medications, Interact, Diet & nutrition) to help older adults prevent frailty by addressing modifiable risk factors, promoting healthy aging, and maintaining independence through a focus on exercise, immunizations, medication review, social engagement, and good nutrition. The mission of Canadian Frailty Network (CFN) was to improve the lives of older adults living with frailty.
Across Canada, there are very few community-based inexpensive interventions that could be accessed by older persons who are or may be concerned with becoming frail. Furthermore, none of the existing programs for managing frailty have utilized trained peer-coaches, who provide an effective, inexpensive, and highly acceptable mode of program delivery to older adults, as has been shown by other studies (Fu et al., Reference Fu, Fu, McGowan, Shen, Zhu, Yang, Mao, Zhu, Ding and Wei2003; Howell et al., Reference Howell, Pond, Bryant-Lukosius, Powis, McGowan, Makuwaza, Kukreti, Rask, Hack and Krzyzanowska2023; McGowan, Reference McGowan2015; McGowan & Green, Reference McGowan and Green1995). Such peer-coach led intervention programs which introduce and support lifestyle/behavioural changes have been developed for several chronic conditions in British Columbia (BC), Canada, where it has been successfully running for over 35 years.
The current study reports on the effectiveness of a community peer-led telephone intervention incorporating self-management support strategies and the components of the AVOID strategy (Rasiah et al., Reference Rasiah, Prorok, Adekpedjou, Barrie, Basualdo, Burns, De Paul, Donnelly, Doyle, Frank, Dolsen, Giguère, Hsiung, Kim, McDonald, O’Grady, Patey, Puxty, Racey and Resin2022) to help community-dwelling older persons/patients/clients manage frailty, with the goal of improving or at least slowing down the progression of frailty.
The self-management program for frailty
Self-Management BC (SMBC) has been implementing peer-led self-management programs designed to support individuals with chronic conditions for more than 35 years. During this period, it has recruited and trained over 10,200 peer leaders and coaches and has delivered programs to nearly 85,000 older adults living with chronic health challenges. These programs employ diverse delivery modalities, including in-person and virtual group sessions, online courses, individualized self-help formats, and telephone-based coaching (www.selfmanagementbc.ca).
Previous research examining effectiveness of a peer support program for vulnerable, low-income older adults aged 60+ years, living in Cape Town, South Africa (Geffen et al., Reference Geffen, Kelly, Morris and Howard2019), found that providing regular weekly visits and phone calls from trained peer volunteers reduced loneliness, increased physical activity, and increased ability to manage chronic disease. In contrast, our study took place in a health authority in BC Canada that serves over two million people and covers several diverse communities (e.g., Indigenous populations and a rapidly growing multicultural demographic), most of whom are not low-income although they may face some financial strain. Furthermore, our study involved people 65 years or older who were already assessed as experiencing moderate levels of frailty. And finally, the present study employs a well-established self-management program using peer coaches who provide weekly telephone calls (but no in-person visits), described in detail below, that has been successfully implemented for several other chronic conditions (McGowan et al., Reference McGowan, Lynch and Hensen2019; McGowan & Hofer, Reference McGowan and Hofer2022).
The operational framework of the Frailty Self-Management Program is designed to foster sustained engagement and behavioural change through structured, individualized support. Following participant enrollment, program coordinators facilitate the pairing of participants with trained peer coaches. The intervention consists of 13 weekly telephone sessions between the participant and their coach, each approximately 45 minutes in duration, conducted over a three-month period. This longitudinal design enables iterative learning and reinforcement of self-management principles. The program, modelled on the Stanford self-management framework, emphasizes three core strategies: problem-solving, the development and application of action plans, and structured decision-making processes. This program integrates these principles with the Canadian Government Federal Frailty AVOID Strategy, which encompasses five key components for frailty prevention: Activity, Vaccinations, Optimizing medications, Interaction, and Diet.
Program structure and delivery
Peer coaches are community volunteers trained through a three-day virtual program, equipped to guide participants using the Self-Management Frailty Health Coach Program Manual (Self-Management BC, 2022) and the coursebook Living a Healthy Life with Chronic Conditions (Lorig et al., Reference Lorig, Laurent, Gonzalez, Sobel, Minor and Gecht-Silver2020). Following initial pairing of a participant/client by a program coordinator, coaches conduct weekly telephone sessions with their participants over a 13-week period, with each session lasting approximately 45 minutes. Participants also receive a copy of the coursebook at no cost and engage in structured discussions with their coach based on scripted lesson plans.
The telephone sessions incorporate components of the five AVOID strategies sequentially, beginning with Activity. Coaches facilitate comprehension by referencing specific coursebook sections and encouraging participants to review materials between sessions. Each strategy is revisited twice during the program to reinforce learning and application, and participants are encouraged to develop a weekly action plan on each of the five components.
Coach training and support
Peer coaches undergo a comprehensive three-day virtual training program delivered by the Frailty Program Educator. Training emphasizes mastery of self-management principles, effective communication techniques, and adherence to program protocols. Coaches utilize two primary resources: the Self-Management Frailty Health Coach Program Manual (Self-Management BC, 2022), which only the coaches have and the coursebook Living a Healthy Life with Chronic Conditions (Lorig et al., Reference Lorig, Laurent, Gonzalez, Sobel, Minor and Gecht-Silver2020) which both coaches and participants receive. These materials provide structured guidance for session delivery and participant engagement. Coaches also receive three check-in calls during the 13-week program from the program coordinator to discuss their participants’ progress and assist the coach if they are having trouble.
Integration of frailty prevention strategies
The initial phase of the program (weeks 1–3) focuses on foundational skill development. Coaches introduce participants to three essential self-management strategies: (a) a systematic problem-solving process, (b) the formulation of weekly action plans, and (c) a structured approach to decision making for complex health-related issues. These strategies are operationalized through guided exercises and reference to designated sections of the coursebook, ensuring consistency and fidelity to the program model.
Sessions 3 through 13 focus on specific components of the AVOID strategy, addressing one of the five components over each two-week period in a sequential manner. Beginning with Physical Activity and referring to specific pages of the coursebook, coaches provide evidence-based information that facilitate improvement. Coaches encourage participants to review the information between each session and to think about making a weekly action plan related to Physical Activity for the next session. In the fourth session, participants report on their experience completing their first action plan on Physical Activity. If the participant was successful, the coach and participant progress to discuss the second component of the AVOID strategy, namely, Vaccinations. If the participant had not been successful in achieving their action plan, the coach would guide the participant to problem solve the main reason for not completing the plan and develop a new action plan to achieve it. Then, the coach would proceed to Vaccinations in the same session. In a similar manner, each of the five components of the AVOID strategy is discussed and then revisited in the next session to reinforce comprehension and encourage practical application. This cyclical approach ensures that participants have multiple opportunities to engage with and implement recommended strategies. Essentially, coaches and participants spend ten 45-minute sessions dealing with the five components of the AVOID strategy, and three sessions learning and practicing the three self-management processes of problem solving, making action plans, and making decisions. Upon successful completion of training and fulfillment of program obligations, coaches received a nominal honorarium of $75 in recognition of their contribution.
Research design and hypotheses for the present study
To test the effectiveness of the behavioural intervention, we used a waitlist control group pre–post test design, whereby participants were randomly assigned to one of two groups, with one group receiving the program upon enrollment in the study (immediate group) and the second group was asked to wait 5 months before beginning their program (delayed group). See Figure 1. This design allowed us to have a control group and all participants being able to benefit from the program. Furthermore, reassessments of group 1 five months after completion of the program (at 10 months in the study) allowed us to assess the program’s potential longer lasting effectiveness. Assessing outcome measures in group 2 between 5 and 10 months effectively served as a built-in replication of the study assessing the program’s effectiveness.
Schematic of the research design.

With this design, we were able to test the following hypotheses. During the first 5 months of the study, from baseline to 5 months, it was expected that the immediate group would generally improve, that is, decrease their frailty scores (having participated in the program) compared with the delayed group who was expected to remain generally the same (no program participation yet), barring any ‘natural’ progression of the condition. In the second 5-month time interval, it was expected that the delayed groups would catch up to the immediate group and decrease their frailty scores, perhaps by the same amount as the immediate group; also, if the program had a lasting impact, the immediate group would maintain their scores at a similar level as they had at the 5-month point in time. Again, some decrease may be expected due to general aging or natural progression of the condition.
Methods
Participants
A total of 129 participants 65 years of age and older were recruited for this study. Recruitment was conducted via notices (flyers, posters, brochures) available at primary care providers’ offices, clinics, and community centres, as well as media ads in community papers and social media. Inclusion criteria included: being 65 years of age or older; living with one or more chronic health conditions; living in a central health region; are concerned about becoming frail; have a home telephone, computer with access to the internet; and are able to commit to being in the study for 3 months (i.e., duration of the intervention).
Participants were randomly assigned to one of two groups, immediate and delayed intervention, as they entered the study (as described below), using quasi-random assignment so as to maximize available trained peer coaches. Randomization was done simply on a first-come first-served basis. As participants entered the study, the first 30 were assigned to group 1, the next 30 to group 2, and as the next volunteers entered, the study they were assigned to alternative groups in batches of 5 to 10 to keep the group sizes relatively equal.
This resulted in 67 participants in group 1 (immediate) and 62 participants in group 2 (delayed), although one participant in group 2 who completed the program was removed from all analyses having reported 16 chronic conditions compared with all remaining participants who reported between 0 and 9 chronic conditions.
After contacting the research office and meeting the initial eligibility criteria, prospective participants were mailed the Living a Healthy Life with Chronic Conditions book and the Clinical Frailty Scale (CFS) (Pulok et al., Reference Pulok, Theou, van der Valk and Rockwood2020; Rockwood et al., Reference Rockwood, Song, MacKnight, Bergman, Hogan, McDowell and Mitnitski2005; Rockwood & Theou, Reference Rockwood and Theou2020). The project research coordinator telephoned each candidate to explain the frailty scale and instructed them to review the levels in the scale to ascertain which level they were at. The coordinator also instructed them to review it with their spouse and or family member(s) to obtain a consensus. Approximately one week later, the coordinator telephoned each candidate again to discuss the levels of the scale and select their level. Participants who scored between 3 and 6 were selected for the study: the rationale being that if they scored 1 (‘very fit’) or 2 (‘fit’), they would likely not benefit from the intervention, and if they scored 7 (‘living with severe frailty’) or higher (i.e., worse on the frailty scale), they would be too frail to participate and also unlikely to benefit. Any participant not meeting the eligibility criteria for the study were offered an alternative SM program. Ethical approval to conduct this Harmonized Minimal Risk Behavioural Study was granted by the University of Victoria (Ethics # H22-02926-A001, amended with H22-02926-A002, 2023).
Outcome measures
Clinical Frailty Scale
The Canadian Frailty Network (project funder) specified that the Clinical Frailty Scale be used to measure frailty in this study. As noted above, the project coordinator telephoned each candidate to explain the frailty scale and instructed them to review the levels in the scale to ascertain which level they were at. The coordinator also instructed them to review it with their spouse and or family member(s) to obtain a consensus. During the project, each participant completed the scale three times with the repeated guidance of the project coordinator – at baseline, 5 months, and 10 months. In addition to the Clinical Frailty Scale score, participants completed the following self-report questionnaires. These have all been used in previous studies (McGowan et al., Reference McGowan, Lynch and Hensen2019; McGowan & Hofer, Reference McGowan and Hofer2022) for assessing patients/clients on several dimensions related to self-management.
Self-Efficacy (SE) to manage disease is a 6-item scale where respondents are asked to rate each item on a 10-point response scale indicating their level of confidence, from 1 meaning not at all confident to 10 meaning totally confident. The responses are added to produce one total score for each participant. Scores can range from 6 to 60, with higher scores indicating higher level of confidence.
Depression (PhQ-9) is a standardized 9-item scale (Kroenke et al., Reference Kroenke, Spitzer and Williams2001) asking respondents to rate how often they experienced several feelings over the past 2 weeks (e.g., little interest/pleasure in doing things; feeling down, depressed, or hopeless; trouble falling/staying asleep or sleeping too much). Responses for each item range from ‘not at all’ (0) to ‘nearly every day’ (3). Responses are added for the 9 items; total scale scores thus range from 0 to 27, with higher scores indicating more frequent negative feelings. An additional overall item is also asked at the end, where the respondent is to indicate how difficult the problems made it for them to work, take care of things at home, or get along with other people. A 4-point response scale was used, with responses ranging from not difficult at all (0) to extremely difficult (4).
Medical care/communication with doctor – Three items that the respondent is asked to rate his/her/their frequency of preparing a list of questions for their doctor, asking questions, and discussing personal problems. Each response can range from 0 (never) to 5 (always). Responses on these three items are added together for an overall ‘communication’ score. Higher scores indicate better communication.
Health Literacy (Chew et al., Reference Chew, Griffin, Partin, Noorbaloochi, Grill, Snyder, Bradley, Nugent, Baines and VanRyn2008) has three questions asking about being able to navigate health information: How often does someone help you read hospital materials; how often do you have problems leaning about your medical condition; and how confident are you in filling out forms by yourself. Responses range from always (1) to never (5). These items are treated as separate outcome measures.
Patient Activation Measure (PAM) (Hibbard et al., Reference Hibbard, Stockard, Mahoney and Tusler2004) is a standardized questionnaire asking respondents how whether they agree/disagree with each of 13 items about their health. A ‘N/A’ response option is available. Responses are coded from 1 (strongly disagree) to 4 (strongly agree), with no neutral/middle point. All items are phrased positively, so each person’s responses are simply added to obtain a total score. Scores can range from 13 (where the participant strongly disagreed with each statement) to 52 (where participant strongly agreed with each item). The raw scores are transformed to ‘activation’ scale scores that range from 0 to 100. These can further be classified into one of four levels of activation. Higher scores indicate higher activation level.
Quality of Life: The RAND 36-Item Health Survey 1.0 Questionnaire (RAND, 2019) is a set of 36 items that assess respondents on eight dimensions based on their self-report. The eight subscales are physical functioning (10 items), role limitations due to physical health (4 items), role limitations due to emotional problems (3 items), energy/fatigue (4 items), emotional well-being (5 items), social functioning (2 items), pain (2 items), and general health (5 items). Responses on each subscale are reverence coded as necessary, averaged and transformed to a scale ranging from 0 to 100. Higher scores indicate more positive outcomes.
Procedure
Selected study participants received a self-management reference book and were randomly assigned to one of two groups, the immediate-start group (group 1) and the delayed-start group (group 2), as described above. Upon entering the study and following providing their informed consent, each participant completed the self-report questionnaire with all outcome measures. Participants assigned to group 1 were immediately paired with a peer coach, and the frailty self-management program was delivered to them as described in some detail in the introduction, under the subheading ‘The Self-Management Program for Frailty’. After completing the program, each participant again completed the questionnaire and assessed their frailty score. In the meantime, participants in group 2 were asked to wait 5 months, at which time they again completed the questionnaire, assessed their frailty level, and were paired with a peer coach to receive the frailty program. During this second 5-month period, participants in group 1 carried on with their normal life. At the end of the 10-month period, each study participant again completed the questionnaire and assessed their frailty level – group 2 after completing their program and group 1 after 5 months postprogram completion. In total, each participant completed the self-report questionnaire with all the outcome measures along with their self-assessed frailty level (as instructed by the project coordinator) at each of three time points: at baseline (at enrollment), at 5 months, and at 10 months. Participants received a $25 honorarium each time they completed the questionnaire and assessment.
Study design and data analyses
As described above, Figure 1 shows the schematic of the waitlist control group pre–post test design used in this study. Randomization process was assessed by establishing that the two groups were not different on any outcome measure, especially frailty, at baseline (at alpha = .25 to ensure sufficient statistical power). For each outcome variable, the hypotheses for the study were tested by looking at the interaction effect between group and time, using mixed repeated measures analyses of variance (ANOVA), with group as the between-subjects factor and time as the repeated factor, with alpha = .05 familywise (per outcome measure). Sphericity was tested using Mauchly test of sphericity, and the Greenhouse-Geyser correction was applied to the degrees of freedom if necessary. If the interaction effect was not statistically significant, a statistically significant main effect of time was probed with pairwise post hoc t-tests using the Bonferroni correction for Type I error. For statistically significant effects, a generalized effect size (ges) is reported. Analyses of variance were conducted using R version 4.5.1, function anova test in the ‘rstatix’ package. The relatively small number of missing data were treated as missing at random.
Results
As shown in Table 1, at baseline, the two groups were equivalent on all measures except the number of chronic conditions, with the waitlist control group reporting overall more chronic conditions on average.
Demographic description of participants at baseline

* p-values are obtained from two-tailed independent-samples t-tests for mean equivalence or chi-square tests for independence (group by categorical variable).
** M is group mean; SD is standard deviation.
*** One person did not provide this information.
Improvement in frailty scores
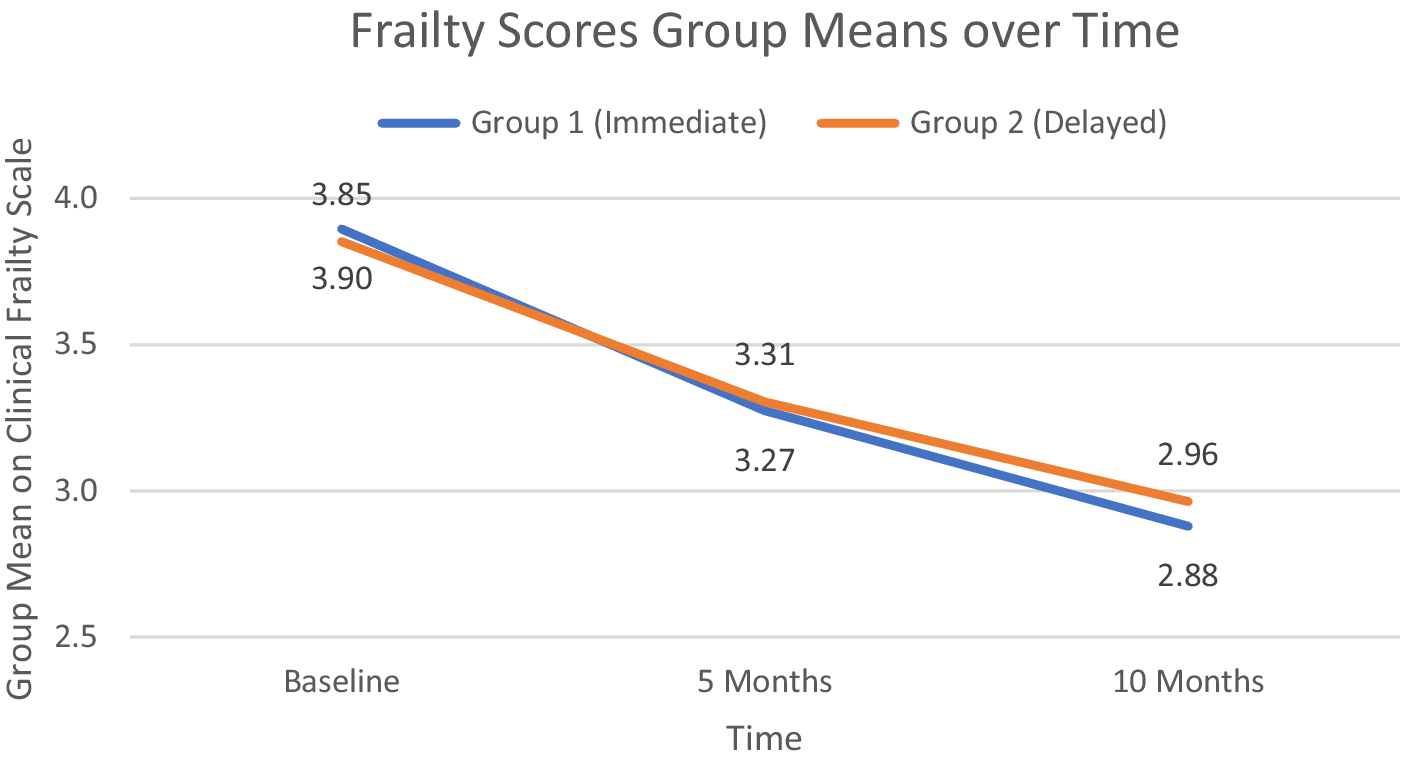
Figure 2 shows the group means on the frailty scale for both groups at the three testing periods. As can be clearly seen, the interaction effect was not statistically significant (F(2, 222) <1, p = .538), nor was the main effect of group (F(1, 111) < 1.0, p = .841). The main effect of time was statistically significant and moderately strong (F(1.96, 217.55) = 86.84, p < .0001, ges = .154); the group mean frailty scores improved over time for both groups similarly, and post hoc tests indicated that the improvement was significant for each 5-month interval.
Group mean clinical frailty scores at baseline, 5 months (group 1 program completion), and 10 months (group 2 program completion).

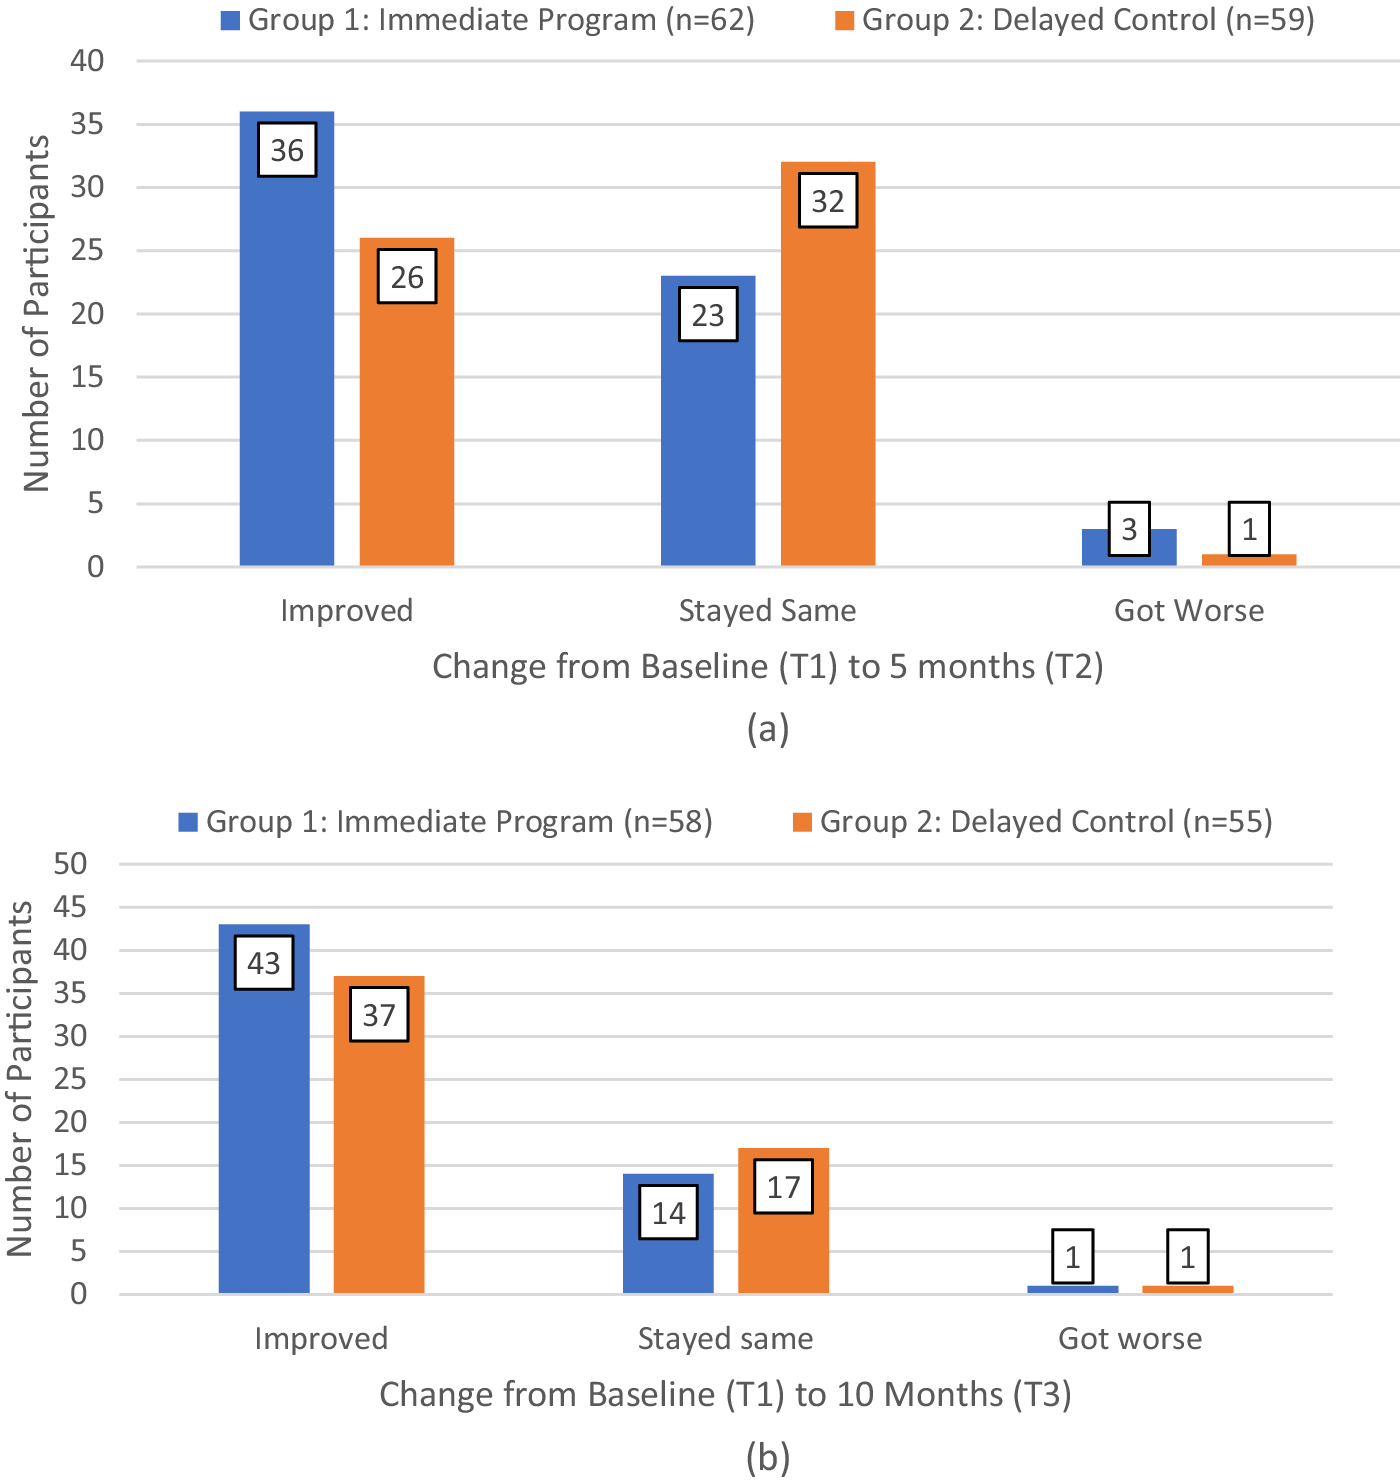
Looking at the clinical frailty scores more closely, at the individual participant level, Figure 3 shows the number of individuals in each group who improved, remained at the same level, or worsened from baseline to 5 months (Figure 3a) and baseline to 10 months (Figure 3b). This shows that in the first 5 months, more participants who got the intervention immediately improved their frailty scores (58.1% in group 1) with 37.1% remaining at the same level, compared with those in group 2 who had to wait (44.1% improved while 54% remained at the same frailty level; see Figure 3a). By the end of the study, at 10 months when everyone had completed the program, those in group 2 had caught up, and 70.8% (80 of all 113) participants who completed the program having improved their frailty scores: 73.1% in group 1 and 67.3% in group 2.
Number of participants in each group whose clinical frailty score has improved, remained the same, or deteriorated, during the first 5 months of the study (a) and from baseline to the end of the study (b).

Looking at how individual participants transitioned between the frailty levels, pre- to post study at 10 months, of the 50 participants (across both groups) who had rated their CFS score as a 4 at baseline, 29 (58%) had moved to a level 3, and 16 (32%) had moved to level 2, 2 (4%) had moved to level 1, and 3 (6%) remained at level 4; of these participants, no one rated their frailty worse than 4. Of the 43 participants who began at level 3, 15 (35%) had moved to 2 and 1 (2%) had moved to 1, while 24 (56%) remained at 3 and 2 (5%) increased to 4. Of the 14 people who started the study at level 5, 9 (64%) had moved to 4, 2 moved to 3 and 1 moved to 2, while 2 remained at 5, and no one dropped beyond 5.
Depression (PHQ-9 scores)
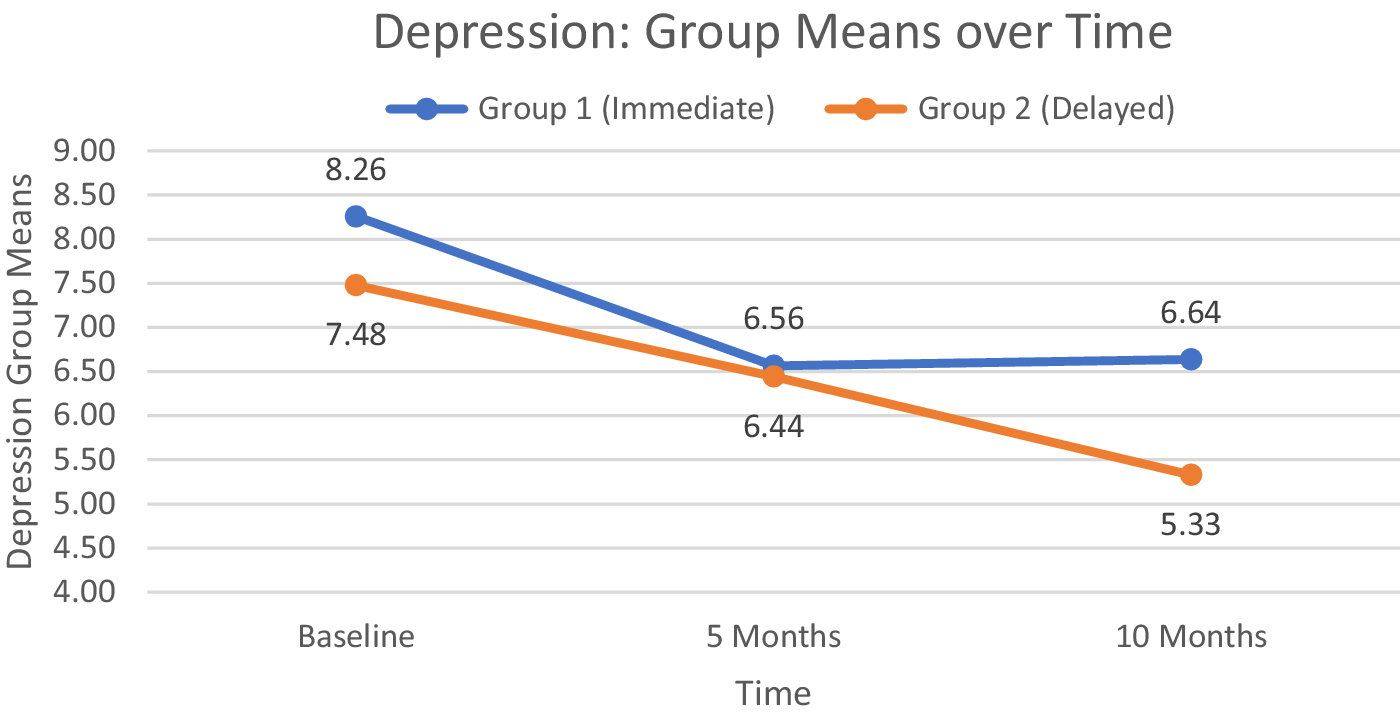
Although the group means follow the predicted pattern, as shown in Figure 4, the interaction effect between group and time was not statistically significant (F(1.68, 188.56) = 1.798, p = .174). The group main effect was also nonsignificant (F(1,112) < 1.0, p = .428), but time did show a statistically significant effect (F(1.68, 188.56) = 15.505, p < .0001). Post hoc pairwise t-tests confirmed that depression scores averaged across all participants were lower at both 5 and 10 months compared with baseline, though the overall means at 5 and 10 months did not differ.
Group mean depression scores on the PHQ-9 scale at baseline, 5 months (group 1 program completion), and 10 months (group 2 program completion).

Self-Efficacy (SE), Patient Activation Measure (PAM), Communication with Doctor, and Health Literacy
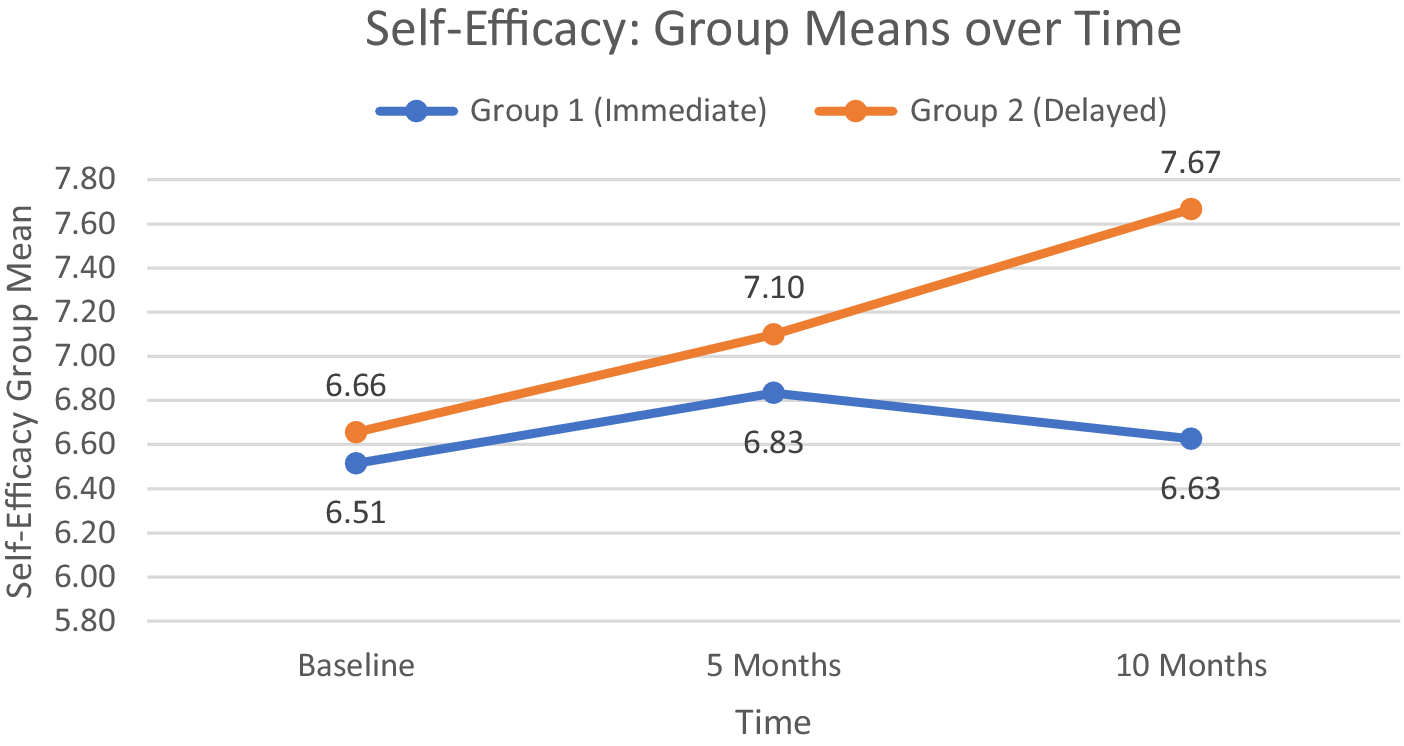
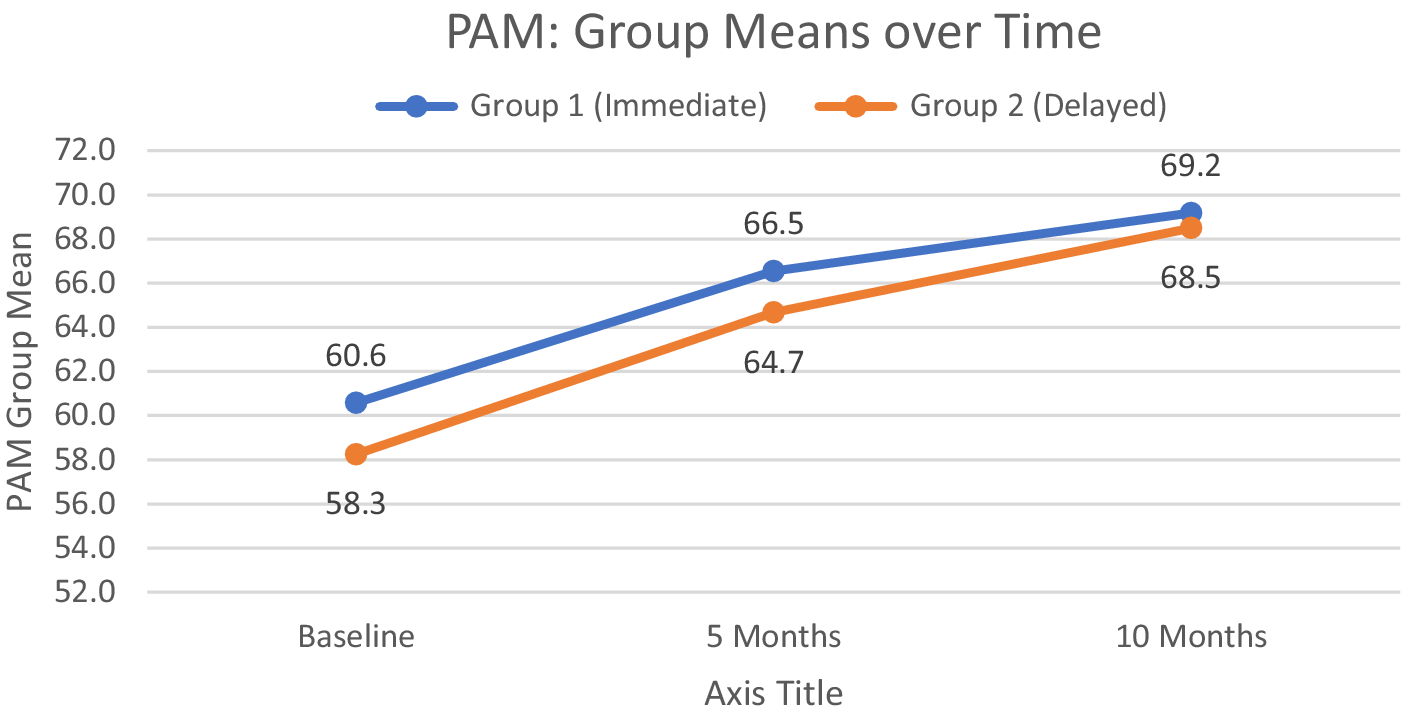
For SE and PAM, and Communication with Doctor, the pattern of results was similar. The interaction effects were not statistically significant for SE (F < 1.0), for PAM (F < 1.0) nor for Communication (F(1.89, 204.18) = 2.293, p = .107). Groups 1 and 2 did not differ statistically on any of these measures, but both groups improved on all measures over time: For main effect of time, SE (F(1.78, 190.5) = 3.354, p = .042); PAM (F(2, 228) = 21.626, p < .0001, ges = .046) and Communication (F(1.89, 204.18) = 8.235, p < .001, ges = .012). Post hoc pairwise t-tests typically showed a statistical difference between baseline and 10 months and for baseline to 5 months for the PAM. Figures 5 and 6 show the group means for SE and PAM, respectively. For Communications with Doctor, the means from baseline to 10 months for group 1 were 7.9 (SD = 3.7), 8.8 (SD = 4.1), and 9.2 (SD = 4.2), and for group 2, these were 8.5 (SD = 4.0), 8.7 (SD = 3.9), and 9.7 (SD = 3.6).
Group mean scores on the self-efficacy scale at baseline, 5 months (group 1 program completion), and 10 months (group 2 program completion).

Group mean scores on the Patient Activation Measure (PAM) at baseline, 5 months (group 1 program completion), and 10 months (group 2 program completion).

No group differences nor time differences were observed on any of the three health literacy items. For each of the first two items, all means ranged from 4.2 to 4.4 on the 5-point response scale (indicating almost never) meaning that participants: (1) rarely have someone help them read hospital materials and (2) almost never have problems learning about their medical condition. For having confidence in filling out forms by themselves, the means ranged from 1.8 to 2.2 (almost always). Overall, this sample of participants had high health literacy scores, leaving little room for improvement on these measures.
Quality of life: Eight RAND health subscales
The 10-item subscale measuring physical functioning had a statistically significant interaction, F(1.91, 211.58) = 3.581, p = .032, albeit the effect was weak (gse = .005). Figure 7(a) shows that the group means for this subscale followed the predicted pattern – an improvement for group 1 (immediate) from baseline to 5 months then dropping slightly but remaining above baseline at 10 months, and no change for group 2 (delayed) in the first 5 months but improving from 5 to 10 months following the program. Whereas physical functioning shows improvement, the scores on the 4-item subscale for role limitations due to physical health showed no statistically significant effects – no interaction (F(1.98, 217.45) < 1.0), no main effect of group (F(1, 110) <1.0), and no main effect of time (F(1.98, 217.45) = 1.898, p = .152).
Group mean scores on the RAND subscales over time for (a) physical functioning, (b) energy/fatigue, (c) pain, (d) social functioning, (e) emotional well-being, and (f) general health.

The 4-item energy/fatigue subscale also did not show any statistically significant effects at the .05 level, but there was a trend whereby group 2 scored generally higher on this subscale than group 1 throughout the study period (see Figure 7b): for the main effect of group, F(1, 113) = 3.036, p = .084. For the interaction effect, F(1.98, 223.56) = 1.873, p = .156; and for the main effect of time, F(1.98, 223.56) = 2.188, p = .114.
The 2-item subscale assessing pain showed a main effect of time, F(1.96, 217.85) =4.834, p = .009, ges = .009), and no interaction effect (F(1.96,217.85) <1.0) nor main effect of group (F(1, 111) <1.0). Note that in Figure 7c which shows the group means over time, higher scores indicate less pain (these items were reverse coded in the scale transformation). Compared to baseline, both groups indicated less pain at the end of the study at 10 months.
On the social and emotional fronts, the 2-item social functioning subscale, pictured in Figure 7d, shows the predicted pattern; however, the interaction effect was not statistically significant (F(2, 226) = 1.693, p = .186). The interesting cross over in the group means also eliminated both time and group main effects: F(2, 226) = 1.693, p = .186 for time and F(1, 113) < 1.0 for group. Emotional well-being, a 5-point subscale with group means shown in Figure 7e, also showed the predicted interaction pattern, but it did not reach statistical significance, F(2, 226) < 1.0), and neither did the group main effect F(1, 113) <1.0. The time main effect did reach statistical significance at the .05 level, F(2, 226) = 3.238, p = .041, but post hoc t-tests did not reveal any group mean differences across time. The 3-item subscale measuring role limitations due to emotional problems showed the same pattern: no, F9 interaction effect F(2,218) <1.0; no group main effect F(1, 109) < 1.0; and a weak time main effect (1.96, 214) = 3.122, p = .046, gse = .009) but post hoc t-tests indicating no differences across time.
Finally, group means across time for the 5-point general health subscale are shown in Figure 7f. The interaction effect was statistically nonsignificant (F(2, 228) < 1.0), nor was the group main effect (F(1, 114) = 2.191, p = .142). The repeated-measures time main effect did reach statistical significance (F(1.94, 221.08) = 3.387, p = .036, gse = .016), and post hoc t-tests found a statistically significant difference between baseline and 10 months.
Supplementary qualitative data: postprogram participant interviews
During this 12-month project, the research team had a brief opportunity to investigate participants’ opinions on the relative importance of each of the five components of the AVOID strategy. Participants of group 1 who had completed the 10-month questionnaire (n = 61) were invited to participate in a telephone interview to discuss their experiences with the program, particularly their engagement with each of the five components of the AVOID strategy. Forty-five of the 61 participants expressed interest, and the first 30 respondents were interviewed.
Two-thirds of respondents identified resuming or initiating regular exercise as the most significant benefit of the program. Twenty (67%) participants reported that they had already received recommended vaccinations, while four noted that the program served as a reminder to update their immunizations. Regarding medication adherence, 15 (50%) indicated that they were already following prescribed regimens, whereas four participants stated that discussions with their coach prompted them to consult their physician and improve adherence.
Social engagement was another key theme with 13 (43%) participants reporting active involvement in social activities and classes, church events, card games, volunteering, dancing, and other senior-oriented programs. Conversely, eight (27%) participants acknowledged becoming aware of their social isolation, particularly following the COVID-19 pandemic, and had begun developing action plans to increase social interaction and spend more time with family and friends. Seven (23%) participants expressed ongoing concerns about COVID-19 or reported physical pain limiting in-person interactions; these individuals primarily engaged socially via Zoom but anticipated greater participation in the future.
Dietary changes were also noted. Eleven (37%) participants reported adopting healthier eating habits to manage conditions such as diabetes and hypercholesterolemia. An additional six (20%) participants described specific strategies for weight loss and improved nutrition, including reducing sugary foods, joining dietary challenge programs, purchasing frozen vegetables, preparing soups, increasing fish consumption, utilizing meal delivery services, and incorporating more vegetables into meals. Finally, seven (23%) participants emphasized the value of reminders about healthy eating practices, particularly after reviewing the Living a Healthy Life coursebook with their coaches.
Discussion
Although the predicted interaction effect between groups across the three time points was not borne out as expected for most of the outcome measures, improvements were observed on almost all measures over time. Interaction effects are statistically less powerful to detect, and the relative heterogeneity of the sample within each group made the interaction effect more difficult to detect and also likely contributed to nonsignificant group main effects. The ubiquitous main effect of time showing improvement in scores compared to baseline in the combined groups supports the observation that the Self-management Program as adopted for frailty developed and presented here is beneficial in improving, or at least maintaining frailty, and self-management associated measures, for at least 10 months.
With regard to the frailty scores, the results presented are encouraging. Over the course of the 10 months of participation in the study, the frailty scores of a large majority (71%) of participants actually decreased by 1–3 points (depending on their starting point), while only 2 participants (2%) increased by 1 point on the CFS. Because the difference between the immediate group and the waitlist control group was not statistically significant, it is difficult to claim that this ‘improvement’ was strictly due to the 13-week SM program. However, the new self-management activities participants learned in the program to help them manage the five prongs of the AVOID strategy surely contributed to this positive outcome.
The results of other outcome measures support the positive finding of the CFS scores. Based on the self-reports on the RAND subscales, participants’ physical aspects appear to have been improved by the program. Compared to baseline, physical functioning improved, and pain lessened, with energy/fatigue levels and role limitations due to physical health remaining steady. The program did not have much impact on the participants’ emotions. Interestingly, social functioning showed the expected pattern, that participating in the program was associated with an increase in social functioning, perhaps due to increased levels of Activity or Interaction (or both), two of the key AVOID strategies that the participants were taught to address in the program, but unfortunately, the interaction did not reach statistical significance. Future studies that would look at the impacts and associations of the individual AVOID strategies on the RAND Health Survey outcome measures would elucidate the underlying mechanisms. In the present study, the concern and the primary outcome measure were on frailty, not the aspects of the AVOID strategies.
Study limitations include the relative heterogeneity of the sample, resulting in a low statistical power to detect a significant interaction effect. The trends in the data were present, and likely a larger sample size would have been able to detect a statistically significant interaction. Second, the sample consisted of self-selected volunteer-participants, who exhibited high level of health literacy and motivation to participate in the study, with PAM scores at baseline already high levels (at levels 3 and 4) for more than half of participants in each group (62.7% in group 1 and 55.7% in group 2). At these ceiling levels, the potential for improvements on these measures was not available. Third, it should be noted that the precision of the clinical frailty scores may not be quite exact, and a difference in one point up or down could easily be within a random and/or measurement error or even simply based on how the participant was feeling during the particular time period when they were assessed. The Clinical Frailty Scale scores obtained in the present study were subjective, being based on self-report, and although consensus with family member(s) was sought to gain some objectivity, this cannot be guaranteed. That said, there is no extant objective measure of frailty at this time. Formal assessment of frailty in a clinician’s office is a highly time-consuming process, and one that is not likely to be adopted by general practitioners. Despite the various difficulties in measuring frailty per se, the results of the self-management outcome measures presented here, particularly the RAND-36 scales which show improvements of potential symptoms of frailty, corroborate the improved CFS scores and are in themselves encouraging. In summary, the results of the intervention described in this study offer modest evidence that the Frailty Self-Management program based on the AVOID strategy can benefit older adults experiencing frailty.
A notable but expected observation in this study was that despite the availability of the Frailty Program in the community, enrolment and participation rates were higher for females than for males. Research findings from large health promotion, disease prevention and self-management programs such as the Chronic Disease Self-Management Program (Erdem & Korda, Reference Erdem and Korda2014; Park & Ko, Reference Park and Ko2021; Smith et al., Reference Smith, Bergeron, Ahn, Towne, Mingo, Robinson, Mathis, Meng and Ory2018), have consistently found that females were more likely than males to participate, and despite the availability and benefits of the programs, male participation remains low. Sex differences in frailty between women and men also exist. In community-dwelling adults older than 65 years, frailty was found to be more common and of greater severity in women as determined by the Frailty Index (Park & Ko, Reference Park and Ko2021; Fried et al., Reference Fried, Tangen, Walston, Newman, Hirsch, Gottdiener, Seeman, Tracy, Kop, Burke and McBurnie2001). Moreover, a similar sex-specific trend has been observed in pre-frail older adults as determined in a recent meta-analysis of 240 studies spanning across 62 countries world-wide (O’Caoimh et al., Reference O’Caoimh, Sezgin, O’Donovan, Molloy, Clegg, Rockwood and Liew2020). While there is great variability in frailty assessment depending on the tool being used (Theou et al., Reference Theou, Brothers, Mitnitski and Rockwood2013), females were found to have higher frailty scores than men regardless (Theou et al., Reference Theou, Brothers, Peña, Mitnitski and Rockwood2014). Additionally, frail women are at increased risk of developing deficits in activities of daily living (ADLs) and/or instrumental ADLs (IADLs) and institutionalization (Bandeen-Roche et al., Reference Bandeen-Roche, Xue, Ferrucci, Walston, Guralnik, Chaves, Zeger and Fried2006). These studies, and the present study, show that sex discrepancies in frailty exist; therefore, it is important to understand the causes of these differences so that sex-specific frailty interventions can be further developed as part of providing the best possible patient-centred care for frail older adults.
The British Columbia’s Ministry of Health’s document, Frailty in Older Adults – Early Identification and Management (Ministry of Health, 2023), provides practice guidelines for physicians, nurse practitioners, and medical students on identifying and managing care for older adults experiencing frailty. These guidelines, however, do not include or address additional beneficial impacts that could be provided to adults experiencing frailty when community volunteer peers become involved. The care and support provided by trained peer volunteer coaches could be leveraged to expand the services offered by the current healthcare professionals at a relatively low cost. The allied community intervention described in this study, which pairs peer coaches with mildly frail older adults who guide them to learn and practice three self-management strategies to adhere to the principles of the AVOID strategy, has shown that such a program can at least slow down the progression of frailty. Furthermore, the relatively low cost, telephone-based intervention makes it readily adoptable in other Canadian, including remote, communities.
Acknowledgements
This study was funded by the Canadian Frailty Strategy (CFN) and the University of Victoria. CFN is funded by the Government of Canada’s Networks of Centres of Excellence (NCE) Program, an initiative of Canada’s research granting agencies. CFN is hosted by Queen’s University and receives support from Kingston Health Sciences Centre and Kingston General Health Research Institute.
Research staff
-
- Fran Hensen, RN, BScN, MAL/Ed, Clinical Nurse Specialist, Health Coach Educator
-
- Gurpreet Sandhu MPH, Coordinator, Frailty Health Coaching Program
-
- Navah Jacobs, CDA, BSc DH, Research Assistant and Data Coordinator
-
- Helena Kadlec, PhD, Research and Statistical Consultant and Manuscript Preparation
-
- Jo Ann Miller, PhD, IALH Research Manager
-
- Grace Park, Family Physician & Regional Medical Director for Home and Community Care in the Fraser Health Authority
A special acknowledgement goes to the 83 volunteers who completed the Frailty Health Coach training and participated as a coach for the 13-week program.


 Open access