1. Introduction
The interaction between bluff bodies and fluid flows in density stratified environments introduces complex wake dynamics due to the interplay between inertial and buoyancy forces, typically characterised by the Reynolds number ( $ \textit{Re}$
) and the Froude number (
$ \textit{Re}$
) and the Froude number ( $ \textit{Fr}$
). Stratification suppresses turbulence and alters vortex shedding, often producing vertically confined, pancake-shaped structures and more stable elongated wakes compared with homogeneous flows (Lin & Pao Reference Lin and Pao1979; Spedding, Browand & Fincham Reference Spedding, Browand and Fincham1996). For example, Lin & Pao (Reference Lin and Pao1979) noted reduced turbulent mixing and enhanced wake stability, while Spedding et al. (Reference Spedding, Browand and Fincham1996) observed stratification-induced suppression of vertical eddy growth in the wake of a towed sphere. Furthermore, stratification facilitates the generation of internal waves, which plays a critical role in energy redistribution and flow stability (Long Reference Long1955; Thorpe Reference Thorpe1975; Spedding Reference Spedding2014). Despite these insights, previous work has largely focused on steady motion, leaving the impact of unsteady body dynamics, such as oscillations, underexplored in stratified settings.
$ \textit{Fr}$
). Stratification suppresses turbulence and alters vortex shedding, often producing vertically confined, pancake-shaped structures and more stable elongated wakes compared with homogeneous flows (Lin & Pao Reference Lin and Pao1979; Spedding, Browand & Fincham Reference Spedding, Browand and Fincham1996). For example, Lin & Pao (Reference Lin and Pao1979) noted reduced turbulent mixing and enhanced wake stability, while Spedding et al. (Reference Spedding, Browand and Fincham1996) observed stratification-induced suppression of vertical eddy growth in the wake of a towed sphere. Furthermore, stratification facilitates the generation of internal waves, which plays a critical role in energy redistribution and flow stability (Long Reference Long1955; Thorpe Reference Thorpe1975; Spedding Reference Spedding2014). Despite these insights, previous work has largely focused on steady motion, leaving the impact of unsteady body dynamics, such as oscillations, underexplored in stratified settings.
In contrast, extensive studies have examined the wake of oscillating cylinders in unstratified fluids, both experimentally and numerically (Tanida, Okajima & Watanabe Reference Tanida, Okajima and Watanabe1973; Griffin & Ramberg Reference Griffin and Ramberg1974, Reference Griffin and Ramberg1976; Williamson & Roshko Reference Williamson and Roshko1988; Xu, Zhou & Wang Reference Xu, Zhou and Wang2006; Leontini et al. Reference Leontini, Lo Jacono and Thompson2013; Tang et al. Reference Tang, Cheng, Tong, Lu and Zhao2017). These investigations have revealed a wide range of vortex shedding regimes, many of which are sensitive to the oscillation amplitude and frequency relative to the natural shedding frequency of a stationary cylinder. Among the oscillation modes, streamwise oscillations, in which the cylinder vibrates in line with the mean flow direction, present unique and rich dynamics. For example, Griffin & Ramberg (Reference Griffin and Ramberg1976) studied the wake of a vibrating cylinder and observed a ‘vortex fission’ process, in which the vortex street exhibited a reduced lateral spacing as the oscillation frequency increased. The authors found that the vortex wavelength was inversely proportional to the oscillation frequency, with high-frequency forcing leading to closely spaced vortex structures.
A key dimensionless parameter in such studies is the frequency ratio $f_{d}/f_{St}$
, where
$f_{d}/f_{St}$
, where $f_{d}$
is the driving frequency of cylinder oscillation and
$f_{d}$
is the driving frequency of cylinder oscillation and $f_{St}$
is the natural vortex shedding frequency of a stationary cylinder in a uniform flow. This ratio governs the interaction between the imposed unsteadiness and the intrinsic shedding dynamics of the wake. When the driving frequency is close to the natural shedding frequency, strong interactions arise, resulting in lock-in, bifurcations or suppression of vortex shedding, depending on the amplitude and frequency. Xu et al. (Reference Xu, Zhou and Wang2006) conducted experimental studies using laser-induced fluorescence, particle image velocimetry and hot wire techniques, and revealed the presence of a symmetric S-II wake mode, characterised by binary vortices aligned symmetrically about the centreline, associated with zero mean and fluctuating lift. They interpreted this wake mode as a superposition of the wake from a stationary cylinder in uniform flow and the symmetric vortex street generated by a cylinder oscillating in quiescent fluid.
$f_{St}$
is the natural vortex shedding frequency of a stationary cylinder in a uniform flow. This ratio governs the interaction between the imposed unsteadiness and the intrinsic shedding dynamics of the wake. When the driving frequency is close to the natural shedding frequency, strong interactions arise, resulting in lock-in, bifurcations or suppression of vortex shedding, depending on the amplitude and frequency. Xu et al. (Reference Xu, Zhou and Wang2006) conducted experimental studies using laser-induced fluorescence, particle image velocimetry and hot wire techniques, and revealed the presence of a symmetric S-II wake mode, characterised by binary vortices aligned symmetrically about the centreline, associated with zero mean and fluctuating lift. They interpreted this wake mode as a superposition of the wake from a stationary cylinder in uniform flow and the symmetric vortex street generated by a cylinder oscillating in quiescent fluid.
Based on these findings, Leontini et al. (Reference Leontini, Lo Jacono and Thompson2013) performed numerical simulations to explore the influence of amplitude and frequency on wake structure. They showed that many flow states, ranging from quasiperiodic to synchronised and symmetric, could be interpreted in terms of how the primary vortex shedding frequency is modified by the imposed oscillations. The work demonstrated that even small variations in driving parameters could induce qualitative changes in wake topology. Later, Tang et al. (Reference Tang, Cheng, Tong, Lu and Zhao2017) extended this investigation by systematically exploring the synchronisation modes at $ \textit{Re}=175$
, introducing the concept of
$ \textit{Re}=175$
, introducing the concept of $p/q$
modes, where
$p/q$
modes, where $p$
vortex pairs are shed in each
$p$
vortex pairs are shed in each $q$
oscillation cycle. Their study revealed intricate mode transitions and complex frequency interactions, driven by competition between steady-flow-induced and oscillation-induced vortex formation.
$q$
oscillation cycle. Their study revealed intricate mode transitions and complex frequency interactions, driven by competition between steady-flow-induced and oscillation-induced vortex formation.
Despite these advances in homogeneous fluids, oscillatory wakes in stratified fluids remain underexplored, representing a significant gap in the literature. Although recent numerical investigations have begun to examine the propulsion mechanisms of slender bodies in stratified environments, revealing improved performance through kinematic synchronisation with buoyancy-driven flow structures (Wang, Kandel & Deng Reference Wang, Kandel and Deng2024), and identifying stratification-dependent Strouhal number regimes for efficient propulsion (Wang, Kandel & Deng Reference Wang, Kandel and Deng2025), these efforts have focused mainly on streamlined or actively propelled bodies. In contrast, studies involving oscillating bluff bodies in stratified flows remain limited. Among the early contributions, Stevenson & Thomas (Reference Stevenson and Thomas1969) experimentally investigated the generation of internal waves by a horizontally oscillating cylinder at low Reynolds numbers ( $ \textit{Re} = 1$
–100), validating Lighthill’s linear theory (Lighthill Reference Lighthill1967). Extending this, Davies et al. (Reference Davies, Boyer, Fernando and Zhang1994) conducted a comprehensive experimental study of a circular cylinder undergoing combined horizontal translation and streamwise oscillation in a linearly stratified fluid. Their observations revealed a wide array of flow patterns across a range of
$ \textit{Re} = 1$
–100), validating Lighthill’s linear theory (Lighthill Reference Lighthill1967). Extending this, Davies et al. (Reference Davies, Boyer, Fernando and Zhang1994) conducted a comprehensive experimental study of a circular cylinder undergoing combined horizontal translation and streamwise oscillation in a linearly stratified fluid. Their observations revealed a wide array of flow patterns across a range of $ \textit{Fr}$
,
$ \textit{Fr}$
, $ \textit{Re}$
and driving frequencies, with shadowgraph images indicating transitions from symmetric to asymmetric wakes and highlighting prominent internal wave activity at low
$ \textit{Re}$
and driving frequencies, with shadowgraph images indicating transitions from symmetric to asymmetric wakes and highlighting prominent internal wave activity at low $ \textit{Fr}$
.
$ \textit{Fr}$
.
Beyond these foundational works, additional studies have examined oscillating bodies in quiescent stratified fluids, typically focusing on vertical or transverse oscillations. For example, Mowbray & Rarity (Reference Mowbray and Rarity1967) documented the iconic internal wave beams of ‘St. Andrew’s Cross’ generated by vertically oscillating cylinders, while Hurley (Reference Hurley1997) and Xu et al. (Reference Xu, Boyer, Fernando and Zhang1997) further detailed wave radiation and vortex shedding structures under stratification. These investigations revealed that stratification not only alters near-field vortex dynamics but also governs internal wave dispersion and momentum transfer. Techniques such as synthetic schlieren (Sutherland et al. Reference Sutherland, Dalziel, Hughes and Linden1999) and force measurements (Ermanyuk & Gavrilov Reference Ermanyuk and Gavrilov2002, Reference Ermanyuk and Gavrilov2008) have confirmed strong nonlinearity and local mixing at high oscillation amplitudes, while theoretical advances have refined our understanding of frequency-dependent added mass and radiation damping (Sturova Reference Sturova2001; Voisin Reference Voisin2024). Of particular interest, Christin et al. (Reference Christin, Meunier and Le Dizès2021) demonstrated rich fluid–structure interactions, including distinct high-frequency vortex-induced vibrations and low-frequency buoyancy-driven galloping.
Numerical studies that specifically address streamwise oscillating cylinders in stratified flows are scarce. Experimental evidence, such as that of Davies et al. (Reference Davies, Boyer, Fernando and Zhang1994), suggests that stratification can stabilise the wake by suppressing vertical growth and delaying asymmetry, mirroring similar effects seen in steady flows (Boyer et al. Reference Boyer, Davies, Fernando and Zhang1989; Deng & Kandel Reference Deng and Kandel2022). These observations underscore the stabilising role of buoyancy, but leave open the question of how stratification interacts with unsteady wake instabilities and symmetry-breaking transitions. Addressing this knowledge gap, particularly the coupling between oscillatory forcing and buoyancy effects, is essential to develop a predictive understanding of wake behaviour in environmental and engineering contexts.
To this end, we conduct full-domain numerical simulations, defined herein as two-dimensional, time-resolved simulations that solve the fully nonlinear Navier–Stokes equations throughout the domain without imposed symmetry constraints, of a streamwise oscillating cylinder in a stably stratified flow. These are supplemented by the Floquet stability analysis, in which we enforce symmetry on the time-periodic base flow to isolate symmetry-breaking instabilities (see § 2.2). Floquet theory, which linearises the Navier–Stokes equations about a time-periodic base state, has previously been used to characterise the wake instability modes of fixed and transversely oscillating cylinders in homogeneous fluids (Barkley & Henderson Reference Barkley and Henderson1996; Elston, Sheridan & Blackburn Reference Elston, Sheridan and Blackburn2004; Deng & Caulfield Reference Deng and Caulfield2016; Gioria et al. Reference Gioria, Jabardo, Carmo and Meneghini2009; Zhang et al. Reference Zhang, Xin, Zhan and Zhou2021). However, such analysis in stratified flows remains limited, with only a few examples such as Chen & Spedding (Reference Chen and Spedding2017), who examined steady wakes behind thin plates. Stratification introduces anisotropy and modifies the energy transfer pathways, potentially altering both the mode structure and the bifurcation scenario of the wake. This raises key questions: Does stratification suppress vertical instabilities and promote symmetric wake patterns, or can it trigger new buoyancy-driven bifurcations? What are the critical thresholds for the Froude number ( $ \textit{Fr}$
) and oscillation amplitude (
$ \textit{Fr}$
) and oscillation amplitude ( $A_D$
) that delineate symmetry-breaking transitions?
$A_D$
) that delineate symmetry-breaking transitions?
In this study we address these questions by systematically investigating the influence of stratification on the wake of a circular cylinder that oscillates in the stream at a fixed Reynolds number ( $ \textit{Re} = 175$
) and a driving frequency ratio (
$ \textit{Re} = 175$
) and a driving frequency ratio ( $f_d/f_{St} = 1.6$
), while varying the Froude number (
$f_d/f_{St} = 1.6$
), while varying the Froude number ( $1 \leqslant \textit{Fr} \leqslant \infty$
) and amplitude (
$1 \leqslant \textit{Fr} \leqslant \infty$
) and amplitude ( $0.1 \leqslant A_D \leqslant 0.6$
). Floquet stability analysis is employed to quantify the growth of perturbations and determine the dominant instability modes. To complement this, we apply dynamic mode decomposition (DMD) (Schmid et al. Reference Schmid, Li, Juniper and Pust2011; Schmid Reference Schmid2022) to linearised perturbation fields to extract coherent structures and capture transitions between quasiperiodic and synchronised regimes. The combined use of full-domain numerical simulation, Floquet analysis and DMD enables us to (i) identify the critical thresholds for wake symmetry breaking, (ii) characterise the influence of stratification on wake synchronisation and stability, and (iii) elucidate the spatial structure and dynamics of instability modes. Our results provide new insights into buoyancy-driven transitions in oscillatory wakes and extend the theoretical framework of wake stability into the regime of stratified unsteady flows.
$0.1 \leqslant A_D \leqslant 0.6$
). Floquet stability analysis is employed to quantify the growth of perturbations and determine the dominant instability modes. To complement this, we apply dynamic mode decomposition (DMD) (Schmid et al. Reference Schmid, Li, Juniper and Pust2011; Schmid Reference Schmid2022) to linearised perturbation fields to extract coherent structures and capture transitions between quasiperiodic and synchronised regimes. The combined use of full-domain numerical simulation, Floquet analysis and DMD enables us to (i) identify the critical thresholds for wake symmetry breaking, (ii) characterise the influence of stratification on wake synchronisation and stability, and (iii) elucidate the spatial structure and dynamics of instability modes. Our results provide new insights into buoyancy-driven transitions in oscillatory wakes and extend the theoretical framework of wake stability into the regime of stratified unsteady flows.
2. Computational methodology
2.1. Full-domain numerical simulation
Figure 1 illustrates the computational set-up. A circular cylinder of diameter $D$
is centred at the origin (
$D$
is centred at the origin ( $x=0, y=0$
) of a rectangular computational domain of length
$x=0, y=0$
) of a rectangular computational domain of length $L$
and height
$L$
and height $H$
. The fluid is linearly stratified under gravity,
$H$
. The fluid is linearly stratified under gravity, $\boldsymbol{g} = -g \hat{\boldsymbol{y}}$
, where
$\boldsymbol{g} = -g \hat{\boldsymbol{y}}$
, where $g$
is the gravitational acceleration and
$g$
is the gravitational acceleration and $\hat {\boldsymbol{y}}$
is the unit vector in the vertical direction. The undisturbed density profile
$\hat {\boldsymbol{y}}$
is the unit vector in the vertical direction. The undisturbed density profile $\rho _b(y)$
varies linearly with the vertical coordinate
$\rho _b(y)$
varies linearly with the vertical coordinate $y$
:
$y$
:
 \begin{align} \rho _b(y) = \rho _0 - \gamma \,y. \end{align}
Here $\gamma = \Delta \rho / H$
is the constant density gradient,
$\gamma = \Delta \rho / H$
is the constant density gradient, $\rho _0$
is the reference density at
$\rho _0$
is the reference density at $y=0$
and
$y=0$
and $\Delta \rho$
is the density difference across the vertical extent. The total density is decomposed as
$\Delta \rho$
is the density difference across the vertical extent. The total density is decomposed as
 \begin{align} \rho (\boldsymbol{x}, t) = \rho _b(y) + \rho ^*(\boldsymbol{x}, t), \end{align}
where $\rho ^*(\boldsymbol{x}, t)$
is the perturbation density. The pressure is similarly decomposed into a hydrostatic background component
$\rho ^*(\boldsymbol{x}, t)$
is the perturbation density. The pressure is similarly decomposed into a hydrostatic background component $p_b(y)$
satisfying
$p_b(y)$
satisfying
 \begin{align} \frac {{\textrm{d}} p_b}{{\textrm{d}} y} = -\rho _b(y)\,g, \end{align}
and a perturbation component $p^*(\boldsymbol{x}, t)$
.
$p^*(\boldsymbol{x}, t)$
.

Figure 1. Schematic of the computational domain.
Under the Boussinesq approximation, density variations affect only the buoyancy term in the momentum equation. The governing equations for the incompressible stratified flow are
 \begin{align} \boldsymbol{\nabla }\boldsymbol{\cdot }\boldsymbol{U} = 0, \\[-28pt] \nonumber \end{align}
 \begin{align} \frac {\partial \boldsymbol{U}}{\partial t} + (\boldsymbol{U}\boldsymbol{\cdot }\boldsymbol{\nabla })\boldsymbol{U} = -\frac {1}{\rho _0}\boldsymbol{\nabla }p^* + \frac {\rho ^*}{\rho _0}\boldsymbol{g} + \nu \,{\nabla} ^{2}\boldsymbol{U} + \boldsymbol{a}, \\[-28pt] \nonumber \end{align}
 \begin{align} \frac {\partial \rho ^*}{\partial t} + (\boldsymbol{U}\boldsymbol{\cdot }\boldsymbol{\nabla })\rho ^* - \gamma \,v = \frac {\nu }{\textit{Pr}}\,{\nabla} ^2 \rho ^*, \\[-2pt] \nonumber \end{align}
where $\boldsymbol{U} = (u, v)$
is the velocity field, with
$\boldsymbol{U} = (u, v)$
is the velocity field, with $u$
and
$u$
and $v$
denoting the streamwise and vertical components, respectively;
$v$
denoting the streamwise and vertical components, respectively; $p^*$
is the pressure perturbation;
$p^*$
is the pressure perturbation; $\nu$
is the kinematic viscosity;
$\nu$
is the kinematic viscosity; $Pr = \nu / \kappa$
is the Prandtl number, with
$Pr = \nu / \kappa$
is the Prandtl number, with $\kappa$
being the scalar diffusivity.
$\kappa$
being the scalar diffusivity.
To model streamwise oscillation, the cylinder is held fixed in a non-inertial frame with acceleration
 \begin{align} \boldsymbol{a} = -\frac {{\textrm{d}}^2 X}{{\textrm{d}} t^2} \hat {\boldsymbol{x}} = 4\pi ^2 f_d^2 A \sin (2\pi f_d t) \hat {\boldsymbol{x}}, \end{align}
where $\hat {\boldsymbol{x}}$
denotes the unit vector in the streamwise direction, and the imposed displacement is
$\hat {\boldsymbol{x}}$
denotes the unit vector in the streamwise direction, and the imposed displacement is
 \begin{align} X(t)=A\sin (2\pi f_{d}t), \end{align}
where $A$
is the oscillation amplitude and
$A$
is the oscillation amplitude and $f_d$
is the oscillation frequency. The inflow (left), top and bottom boundaries are prescribed with Dirichlet conditions:
$f_d$
is the oscillation frequency. The inflow (left), top and bottom boundaries are prescribed with Dirichlet conditions:
 \begin{align} \boldsymbol{U} = (U_\infty - u_{{cyl}}, 0). \end{align}
Here $u_{{cyl}} = {\textrm{d}}X/{\textrm{d}}t = 2\pi f_d A \cos (2\pi f_d t)$
represents the cylinder velocity relative to the non-inertial frame and
$u_{{cyl}} = {\textrm{d}}X/{\textrm{d}}t = 2\pi f_d A \cos (2\pi f_d t)$
represents the cylinder velocity relative to the non-inertial frame and $U_\infty$
is the free-stream velocity. This approach avoids mesh deformation while accurately capturing the relative motion between the cylinder and the incoming flow (Blackburn & Henderson Reference Blackburn and Henderson1999; Leontini et al. Reference Leontini, Lo Jacono and Thompson2013; Tang et al. Reference Tang, Cheng, Tong, Lu and Zhao2017).
$U_\infty$
is the free-stream velocity. This approach avoids mesh deformation while accurately capturing the relative motion between the cylinder and the incoming flow (Blackburn & Henderson Reference Blackburn and Henderson1999; Leontini et al. Reference Leontini, Lo Jacono and Thompson2013; Tang et al. Reference Tang, Cheng, Tong, Lu and Zhao2017).
While the governing equations (2.4)–(2.6) are written in dimensional form, all results are reported in non-dimensional variables for clarity. We take the cylinder diameter $D$
as the characteristic length scale and the free-stream velocity
$D$
as the characteristic length scale and the free-stream velocity $U_\infty$
as the characteristic velocity scale. The principal non-dimensional parameters used to interpret the results are the oscillation amplitude,
$U_\infty$
as the characteristic velocity scale. The principal non-dimensional parameters used to interpret the results are the oscillation amplitude,
 \begin{align} A_D = \frac {A}{D}, \end{align}
the Reynolds number,
 \begin{align} \textit{Re} = \frac {U_\infty D}{\nu }, \end{align}
which quantifies the ratio of inertial to viscous forces, and the Froude number,
 \begin{align} \textit{Fr} = \frac {U_\infty }{\textit{ND}}, \end{align}
which measures the ratio of inertial forces to buoyancy forces. Here $N$
is the buoyancy frequency, defined as
$N$
is the buoyancy frequency, defined as
 \begin{align} N = \sqrt {\frac {g\,\gamma }{\rho _0}}. \end{align}
The Reynolds number is fixed at $ \textit{Re} = 175$
, while the Froude number is varied from
$ \textit{Re} = 175$
, while the Froude number is varied from $ \textit{Fr}=1$
to
$ \textit{Fr}=1$
to $\infty$
, covering moderately stratified to unstratified regimes. No-slip conditions are imposed on the cylinder surface. A zero normal condition is used for velocity at the outlet (right boundary), and pressure is prescribed via a Dirichlet condition at the outlet and Neumann conditions elsewhere. Homogeneous Neumann conditions are applied to the density perturbation field at all boundaries.
$\infty$
, covering moderately stratified to unstratified regimes. No-slip conditions are imposed on the cylinder surface. A zero normal condition is used for velocity at the outlet (right boundary), and pressure is prescribed via a Dirichlet condition at the outlet and Neumann conditions elsewhere. Homogeneous Neumann conditions are applied to the density perturbation field at all boundaries.
Simulations are performed using solvers constructed within the OpenFOAM framework (Weller et al. Reference Weller, Tabor, Jasak and Fureby1998) using finite-volume discretisation. The momentum and scalar convection terms are discretised using second-order upwind schemes, whereas the Laplacian terms employ central differences. Time integration uses a second-order Crank–Nicolson scheme, and the PISO algorithm ensures pressure–velocity coupling.
The oscillation amplitude spans $0.1 \leqslant A_D \leqslant 0.6$
and the frequency ratio is fixed at
$0.1 \leqslant A_D \leqslant 0.6$
and the frequency ratio is fixed at $f_d/f_{St} = 1.6$
, where
$f_d/f_{St} = 1.6$
, where $f_{St}$
is the natural vortex shedding frequency corresponding to a Strouhal number
$f_{St}$
is the natural vortex shedding frequency corresponding to a Strouhal number $St = f_{St} D / U_\infty = 0.192$
for a stationary cylinder at
$St = f_{St} D / U_\infty = 0.192$
for a stationary cylinder at $ \textit{Re} = 175$
. This frequency ratio has been shown to produce a broad spectrum of wake patterns in homogeneous flows at similar Reynolds numbers (Leontini et al. Reference Leontini, Lo Jacono and Thompson2013; Tang et al. Reference Tang, Cheng, Tong, Lu and Zhao2017). The Prandtl number is set to
$ \textit{Re} = 175$
. This frequency ratio has been shown to produce a broad spectrum of wake patterns in homogeneous flows at similar Reynolds numbers (Leontini et al. Reference Leontini, Lo Jacono and Thompson2013; Tang et al. Reference Tang, Cheng, Tong, Lu and Zhao2017). The Prandtl number is set to $Pr=1$
, consistent with previous studies (de Stadler et al. Reference de Stadler, Sarkar and Brucker2010; Chernykh et al. Reference Chernykh, Druzhinin, Fomina and Moshkin2012; Orr et al. Reference Orr, Domaradzki, Spedding and Constantinescu2015), and was found to provide a good approximation of wake dynamics for
$Pr=1$
, consistent with previous studies (de Stadler et al. Reference de Stadler, Sarkar and Brucker2010; Chernykh et al. Reference Chernykh, Druzhinin, Fomina and Moshkin2012; Orr et al. Reference Orr, Domaradzki, Spedding and Constantinescu2015), and was found to provide a good approximation of wake dynamics for $Pr \approx 7$
, typical of thermally stratified water.
$Pr \approx 7$
, typical of thermally stratified water.
To estimate the thickness of the momentum and density boundary layers, denoted by $l_{m}$
and
$l_{m}$
and $l_{d}$
, respectively, the following relationships are employed (Schlichting & Gersten Reference Schlichting and Gersten2003):
$l_{d}$
, respectively, the following relationships are employed (Schlichting & Gersten Reference Schlichting and Gersten2003):
 \begin{align} l_{m} \sim O\left (\frac {D}{\sqrt {\textit{Re}}}\right ) \end{align}
and
 \begin{align} l_{d} \sim O\left (\frac {D}{\sqrt {{\textit{RePr}}}}\right ). \end{align}
2.2. Floquet stability analysis
To examine how perturbations grow and ultimately break the reflectional symmetry of the flow, we perform a Floquet stability analysis to determine the critical parameters. The nonlinear governing equations (2.4)–(2.6) are solved within the OpenFOAM framework to obtain a two-dimensional base flow, $(\overline {\boldsymbol{U}}, \overline {p}^*, \overline {\rho }^*)$
, over up to 100 oscillation cycles to ensure temporal periodicity.
$(\overline {\boldsymbol{U}}, \overline {p}^*, \overline {\rho }^*)$
, over up to 100 oscillation cycles to ensure temporal periodicity.
To obtain a perfectly symmetric base flow for analysing symmetry breaking, we enforce reflectional symmetry about the wake centreline ( $y=0$
) by constraining the flow variables at each time step. Specifically, the numerical solution is required to satisfy
$y=0$
) by constraining the flow variables at each time step. Specifically, the numerical solution is required to satisfy
 \begin{align} \overline {u}(x, y, t) = \overline {u}(x, -y, t), \quad \overline {v}(x, y, t) = -\overline {v}(x, -y, t) \end{align}
and
 \begin{align} \overline {p}^*(x, y, t) = \overline {p}^*(x, -y, t), \quad \overline {\rho }^*(x, y, t) = -\overline {\rho }^*(x, -y, t), \end{align}
where $\overline {\boldsymbol{U}} = (\overline {u}, \overline {v})$
,
$\overline {\boldsymbol{U}} = (\overline {u}, \overline {v})$
, $\overline {p}^*$
and
$\overline {p}^*$
and $\overline {\rho }^*$
denote the base flow quantities. This procedure ensures that any subsequent loss of symmetry observed in the linear stability analysis originates exclusively from the growth of perturbations, rather than from numerical artefacts.
$\overline {\rho }^*$
denote the base flow quantities. This procedure ensures that any subsequent loss of symmetry observed in the linear stability analysis originates exclusively from the growth of perturbations, rather than from numerical artefacts.
From the periodic base flow, 64 equispaced snapshots are extracted over one oscillation period and interpolated using a Fourier series reconstruction to provide a smooth, time-continuous representation of the base state.
Infinitesimal perturbations $(\boldsymbol{u}', p', \rho ')$
are then introduced, and the governing equations are linearised with respect to the base flow, yielding
$(\boldsymbol{u}', p', \rho ')$
are then introduced, and the governing equations are linearised with respect to the base flow, yielding
 \begin{align} \boldsymbol{\nabla }\boldsymbol{\cdot }\boldsymbol{u}' = 0, \\[-28pt] \nonumber \end{align}
 \begin{align} \frac {\partial \rho '}{\partial t} + (\overline {\boldsymbol{U}} \boldsymbol{\cdot }\boldsymbol{\nabla }) \rho ' + (\boldsymbol{u}' \boldsymbol{\cdot }\boldsymbol{\nabla }) \overline {\rho }^* - \gamma v' = \frac {\nu }{\textit{Pr}} {\nabla} ^2 \rho ', \\[-28pt] \nonumber \end{align}
 \begin{align} \frac {\partial \boldsymbol{u}'}{\partial t} + (\overline {\boldsymbol{U}} \boldsymbol{\cdot }\boldsymbol{\nabla }) \boldsymbol{u}' + (\boldsymbol{u}' \boldsymbol{\cdot }\boldsymbol{\nabla }) \overline {\boldsymbol{U}} = -\frac {1}{\rho _0} \boldsymbol{\nabla }p' + \frac {\rho '}{\rho _0} \boldsymbol{g} + \nu {\nabla} ^2 \boldsymbol{u}'. \\[-2pt] \nonumber \end{align}
The stability of the periodic base flow is assessed using the Floquet theory (Barkley & Henderson Reference Barkley and Henderson1996; Schmid & Henningson Reference Schmid and Henningson2001; Iooss & Joseph Reference Iooss and Joseph2012). The dominant Floquet multiplier $\mu$
is computed by integrating (2.18)–(2.20) over one oscillation period
$\mu$
is computed by integrating (2.18)–(2.20) over one oscillation period $T$
and evaluating the perturbation kinetic energy, i.e.
$T$
and evaluating the perturbation kinetic energy, i.e.
 \begin{align} E(t) = \frac {1}{2} \int _V \big ( u^{\prime 2} + v^{\prime 2} \big ) {\textrm{d}}V, \end{align}
where $u'$
and
$u'$
and $v'$
are, respectively, the streamwise and transverse components of the perturbation velocity and
$v'$
are, respectively, the streamwise and transverse components of the perturbation velocity and $V$
denotes the computational domain. The Floquet multiplier is estimated as
$V$
denotes the computational domain. The Floquet multiplier is estimated as
 \begin{align} |\mu | \approx \sqrt {\frac {E(t+T)}{E(t)}}. \end{align}
Instability is indicated by $|\mu | {\gt} 1$
, which indicates the growth of the perturbation amplitude with each cycle.
$|\mu | {\gt} 1$
, which indicates the growth of the perturbation amplitude with each cycle.
As discussed by Elston et al. (Reference Elston, Sheridan and Blackburn2004, Reference Elston, Blackburn and Sheridan2006), two-dimensional Floquet analysis of oscillating cylinders in quiescent fluids can exhibit a spurious multiplier near unity, stemming from the nearly harmonic nature of the base motion. Consequently, while stable modes ( $|\mu | \lt 1$
) are challenging to accurately resolve, unstable modes (
$|\mu | \lt 1$
) are challenging to accurately resolve, unstable modes ( $|\mu | {\gt} 1$
) can be robustly identified. Following their methodology, we applied two-dimensional Floquet analysis to determine the critical parameters for symmetry-breaking instabilities in the wake of a streamwise oscillating cylinder immersed in a stratified fluid.
$|\mu | {\gt} 1$
) can be robustly identified. Following their methodology, we applied two-dimensional Floquet analysis to determine the critical parameters for symmetry-breaking instabilities in the wake of a streamwise oscillating cylinder immersed in a stratified fluid.
2.3. Dynamic mode decomposition
Dynamic mode decomposition (Schmid et al. Reference Schmid, Li, Juniper and Pust2011; Schmid Reference Schmid2022) is employed to analyse the perturbation velocity field $\boldsymbol{u}'$
and extract coherent flow structures, along with their associated frequencies and growth or decay rates. Unlike Floquet analysis, which isolates the dominant mode responsible for symmetry breaking over one oscillation period, DMD is a data-driven technique that captures a broader spectrum of dynamic modes from time-resolved snapshots, offering insight into complex flow transitions and modal interactions.
$\boldsymbol{u}'$
and extract coherent flow structures, along with their associated frequencies and growth or decay rates. Unlike Floquet analysis, which isolates the dominant mode responsible for symmetry breaking over one oscillation period, DMD is a data-driven technique that captures a broader spectrum of dynamic modes from time-resolved snapshots, offering insight into complex flow transitions and modal interactions.
We applied the standard full-rank DMD algorithm (Schmid et al. Reference Schmid, Li, Juniper and Pust2011) to a sequence of perturbation velocity snapshots $\boldsymbol{u}^{\prime}_1, \ldots , {\boldsymbol{u}^{\prime}_n}$
obtained over a time window during which the flow is statistically periodic. The procedure consists of the following steps.
$\boldsymbol{u}^{\prime}_1, \ldots , {\boldsymbol{u}^{\prime}_n}$
obtained over a time window during which the flow is statistically periodic. The procedure consists of the following steps.
-
(i) Construct snapshot matrices: $\boldsymbol{V}_{n-1}^{(1)} = [\boldsymbol{u}^{\prime}_1, \ldots , \boldsymbol{u}_{n-1}']$
and
$\boldsymbol{V}_{n}^{(2)} = [\boldsymbol{u}_2', \ldots , \boldsymbol{u}^{\prime}_n]$
.
$\boldsymbol{V}_{n-1}^{(1)} = [\boldsymbol{u}^{\prime}_1, \ldots , \boldsymbol{u}_{n-1}']$
and
$\boldsymbol{V}_{n}^{(2)} = [\boldsymbol{u}_2', \ldots , \boldsymbol{u}^{\prime}_n]$
. -
(ii) Perform QR factorisation:
$\boldsymbol{V}_{n-1}^{(1)} = \boldsymbol{Q} \boldsymbol{R}$
. -
(iii) Compute the projected system matrix:
$\boldsymbol{S} = \boldsymbol{R}^{-1}\,\boldsymbol{Q}^H \boldsymbol{V}_{n}^{(2)}$
. -
(iv) Compute the eigen-decomposition of
$\boldsymbol{S}$
to obtain the eigenvalues
$\{\mu _j\}$
and the eigenvectors
$\boldsymbol{x}_j$
. -
(v) Convert discrete-time eigenvalues to continuous growth rates and frequencies:
$\lambda _j = \ln (\mu _j)/\Delta t$
.


Each DMD eigenvalue $\lambda _j$
corresponds to a mode with exponential growth or decay (real part) and oscillation frequency (imaginary part), which can help characterise bifurcation types and understand complex flow transitions under stratification. In the present analysis, flow fields are sampled once per oscillation cycle, such that the interval between consecutive snapshots is equal to the forcing period, i.e.
$\lambda _j$
corresponds to a mode with exponential growth or decay (real part) and oscillation frequency (imaginary part), which can help characterise bifurcation types and understand complex flow transitions under stratification. In the present analysis, flow fields are sampled once per oscillation cycle, such that the interval between consecutive snapshots is equal to the forcing period, i.e. $\Delta t = T = 1/f_d$
. For a comprehensive overview of DMD theory, implementation strategies and applications in fluid dynamics, see Tu (Reference Tu2013) and Schmid (Reference Schmid2022).
$\Delta t = T = 1/f_d$
. For a comprehensive overview of DMD theory, implementation strategies and applications in fluid dynamics, see Tu (Reference Tu2013) and Schmid (Reference Schmid2022).
3. Numerical validation
We perform a validation study of the computational method to ensure the accuracy and reliability of the numerical simulations. This process includes a study of grid independence and comparisons with the established literature for homogeneous and stratified flows to validate key flow characteristics. The computational set-up detailed in § 2.1 consists of a circular cylinder with diameter $D$
placed at the origin of a rectangular domain of length
$D$
placed at the origin of a rectangular domain of length $L = 70D$
and height
$L = 70D$
and height $H = 50D$
, as shown in figure 1.
$H = 50D$
, as shown in figure 1.
3.1. Grid-independence study
A grid-independence study is performed to confirm that the numerical results are independent of the mesh resolution. Here, we focus on the case with the strongest stratification ( $ \textit{Fr} = 1$
) and the highest oscillation amplitude (
$ \textit{Fr} = 1$
) and the highest oscillation amplitude ( $A_D = 0.6$
) at a fixed Reynolds number
$A_D = 0.6$
) at a fixed Reynolds number $ \textit{Re} = 175$
and a driving frequency ratio
$ \textit{Re} = 175$
and a driving frequency ratio $f_d / f_{St} = 1.6$
. This combination represents the most challenging regime for numerical resolution due to pronounced buoyancy effects and vigorous oscillatory motion.
$f_d / f_{St} = 1.6$
. This combination represents the most challenging regime for numerical resolution due to pronounced buoyancy effects and vigorous oscillatory motion.
Four computational grids (grids 1–4) with progressively finer resolution are generated. Grid refinement is concentrated in the vicinity of the cylinder to resolve the viscous boundary layer and in the wake region to capture vortex shedding and stratification-induced flow features. Table 1 summarises the key characteristics of the grids, including the total cell count and the minimum cell size near the cylinder, denoted by $\varDelta _{\textrm{min}}/D$
.
$\varDelta _{\textrm{min}}/D$
.
Table 1. Details of the computational grids used in the grid-independence study. The minimum grid spacing $\varDelta _{\textrm{min}}$
is normalised by the characteristic length
$\varDelta _{\textrm{min}}$
is normalised by the characteristic length $D$
.
$D$
.

To assess convergence, we compute the time-averaged drag coefficient ( $\langle C_D \rangle$
) and the root-mean-square lift coefficient (
$\langle C_D \rangle$
) and the root-mean-square lift coefficient ( $C_{L,{rms}}$
) for each grid. These integral quantities are sensitive to the resolution of the boundary layer and wake dynamics and, thus, serve as reliable indicators of numerical convergence. The results are presented in table 2. The relative differences between successive grids are calculated as
$C_{L,{rms}}$
) for each grid. These integral quantities are sensitive to the resolution of the boundary layer and wake dynamics and, thus, serve as reliable indicators of numerical convergence. The results are presented in table 2. The relative differences between successive grids are calculated as
 \begin{align} {\rm Relative\,difference}\,(\%) = \left | \frac {\phi _{i+1} - \phi _i}{\phi _i} \right | \times 100, \end{align}
where $\phi _i$
represents either
$\phi _i$
represents either $\langle C_D \rangle$
or
$\langle C_D \rangle$
or $C_{L,{rms}}$
and
$C_{L,{rms}}$
and $i$
is the grid index.
$i$
is the grid index.
Table 2. Results of the grid-independence study for $ \textit{Re} = 175$
,
$ \textit{Re} = 175$
, $ \textit{Fr} = 1$
,
$ \textit{Fr} = 1$
, $A_D = 0.6$
and
$A_D = 0.6$
and $f_d / f_{St} = 1.6$
. The table reports the time-averaged drag coefficient
$f_d / f_{St} = 1.6$
. The table reports the time-averaged drag coefficient $\langle C_D \rangle$
and the root-mean-square lift coefficient
$\langle C_D \rangle$
and the root-mean-square lift coefficient $C_{L,{rms}}$
along with their relative differences compared with the next finer grid.
$C_{L,{rms}}$
along with their relative differences compared with the next finer grid.

The relative difference in $\langle C_D \rangle$
drops below
$\langle C_D \rangle$
drops below $0.5\,\%$
between grids 3 and 4, indicating convergence. Although the relative variation in
$0.5\,\%$
between grids 3 and 4, indicating convergence. Although the relative variation in $C_{L,{rms}}$
remains slightly higher, this is expected given the weak lift response under symmetric wake conditions. Indeed, the selected case exhibits symmetric vortex shedding about the wake centreline, resulting in minimal lift force fluctuations. These results suggest that grid 3 achieves a favourable balance between accuracy and computational cost and was therefore adopted for all subsequent simulations.
$C_{L,{rms}}$
remains slightly higher, this is expected given the weak lift response under symmetric wake conditions. Indeed, the selected case exhibits symmetric vortex shedding about the wake centreline, resulting in minimal lift force fluctuations. These results suggest that grid 3 achieves a favourable balance between accuracy and computational cost and was therefore adopted for all subsequent simulations.
In addition, the adequacy of grid 3 is confirmed by comparing the minimum cell size near the cylinder with the characteristic thicknesses of the momentum and density boundary layers. For $ \textit{Re} = 175$
and
$ \textit{Re} = 175$
and $Pr = 1$
, both the momentum and thermal boundary layers are estimated as
$Pr = 1$
, both the momentum and thermal boundary layers are estimated as
 \begin{align} l_m = l_d = \frac {D}{\sqrt {Re}} \approx 0.0756D. \end{align}
The smallest cell size for grid 3 is $\varDelta _{\textrm{min}} / D = 0.0025$
, ensuring that the boundary layers are resolved by at least 30 points across their thickness. This resolution is sufficient to accurately capture the shear and stratification effects near the cylinder. The time-step size is adaptively controlled according to two criteria. First, the Courant number, defined as
$\varDelta _{\textrm{min}} / D = 0.0025$
, ensuring that the boundary layers are resolved by at least 30 points across their thickness. This resolution is sufficient to accurately capture the shear and stratification effects near the cylinder. The time-step size is adaptively controlled according to two criteria. First, the Courant number, defined as $Co=|\boldsymbol{U}|\,\delta t/\varDelta _{\textrm{min}}$
, is maintained below unity to ensure numerical stability. Second, each oscillating cycle is resolved with at least 4000 time steps. This strategy has been demonstrated in our previous studies (Wang et al. Reference Wang, Kandel and Deng2024, Reference Wang, Kandel and Deng2025) to provide stable and convergent numerical results. Furthermore, no spurious reflections or numerical artefacts are observed near the domain boundaries, indicating that the dimensions of the computational domain (
$Co=|\boldsymbol{U}|\,\delta t/\varDelta _{\textrm{min}}$
, is maintained below unity to ensure numerical stability. Second, each oscillating cycle is resolved with at least 4000 time steps. This strategy has been demonstrated in our previous studies (Wang et al. Reference Wang, Kandel and Deng2024, Reference Wang, Kandel and Deng2025) to provide stable and convergent numerical results. Furthermore, no spurious reflections or numerical artefacts are observed near the domain boundaries, indicating that the dimensions of the computational domain ( $L = 70D$
,
$L = 70D$
, $H = 50D$
) are sufficiently large to isolate the wake from boundary effects.
$H = 50D$
) are sufficiently large to isolate the wake from boundary effects.
3.2. Validation in homogeneous flows
Following a grid-independence study, the numerical methodology is further validated by comparing the results for a homogeneous (unstratified) flow ( $ \textit{Fr} = \infty$
) with those of Leontini et al. (Reference Leontini, Lo Jacono and Thompson2013) for an oscillating cylinder at
$ \textit{Fr} = \infty$
) with those of Leontini et al. (Reference Leontini, Lo Jacono and Thompson2013) for an oscillating cylinder at $ \textit{Re} = 175$
and
$ \textit{Re} = 175$
and $f_d / f_{St} = 1.6$
. Two key metrics are considered: (i) the time-averaged drag coefficient (
$f_d / f_{St} = 1.6$
. Two key metrics are considered: (i) the time-averaged drag coefficient ( $\langle C_D \rangle$
) across a range of oscillation amplitudes (
$\langle C_D \rangle$
) across a range of oscillation amplitudes ( $A_D$
), and (ii) the dominant vortex shedding frequency (
$A_D$
), and (ii) the dominant vortex shedding frequency ( $f_{s}$
).
$f_{s}$
).
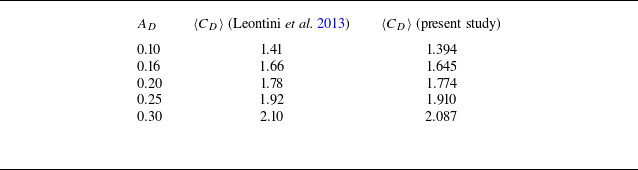
Table 3 compares the average drag coefficient $\langle C_D \rangle$
obtained in this study with that in Leontini et al. (Reference Leontini, Lo Jacono and Thompson2013) for
$\langle C_D \rangle$
obtained in this study with that in Leontini et al. (Reference Leontini, Lo Jacono and Thompson2013) for $A_D$
ranging from 0.10 to 0.30. For example, at
$A_D$
ranging from 0.10 to 0.30. For example, at $A_D = 0.10$
, this study yields
$A_D = 0.10$
, this study yields $\langle C_D \rangle =1.394$
, which differs by less than 1 % from the value of 1.41 reported by Leontini et al. (Reference Leontini, Lo Jacono and Thompson2013). Similarly, close agreement is observed for the entire range of amplitudes tested, indicating that the present solver accurately resolves the mean force response across different oscillation regimes.
$\langle C_D \rangle =1.394$
, which differs by less than 1 % from the value of 1.41 reported by Leontini et al. (Reference Leontini, Lo Jacono and Thompson2013). Similarly, close agreement is observed for the entire range of amplitudes tested, indicating that the present solver accurately resolves the mean force response across different oscillation regimes.
Table 3. Comparison of the time-averaged drag coefficient $\langle C_D \rangle$
between the results of Leontini et al. (Reference Leontini, Lo Jacono and Thompson2013) and the present numerical study for different amplitude ratios in a homogeneous flow. The comparison is conducted at
$\langle C_D \rangle$
between the results of Leontini et al. (Reference Leontini, Lo Jacono and Thompson2013) and the present numerical study for different amplitude ratios in a homogeneous flow. The comparison is conducted at $f_d / f_{St} = 1.6$
and
$f_d / f_{St} = 1.6$
and $ \textit{Re} = 175$
.
$ \textit{Re} = 175$
.

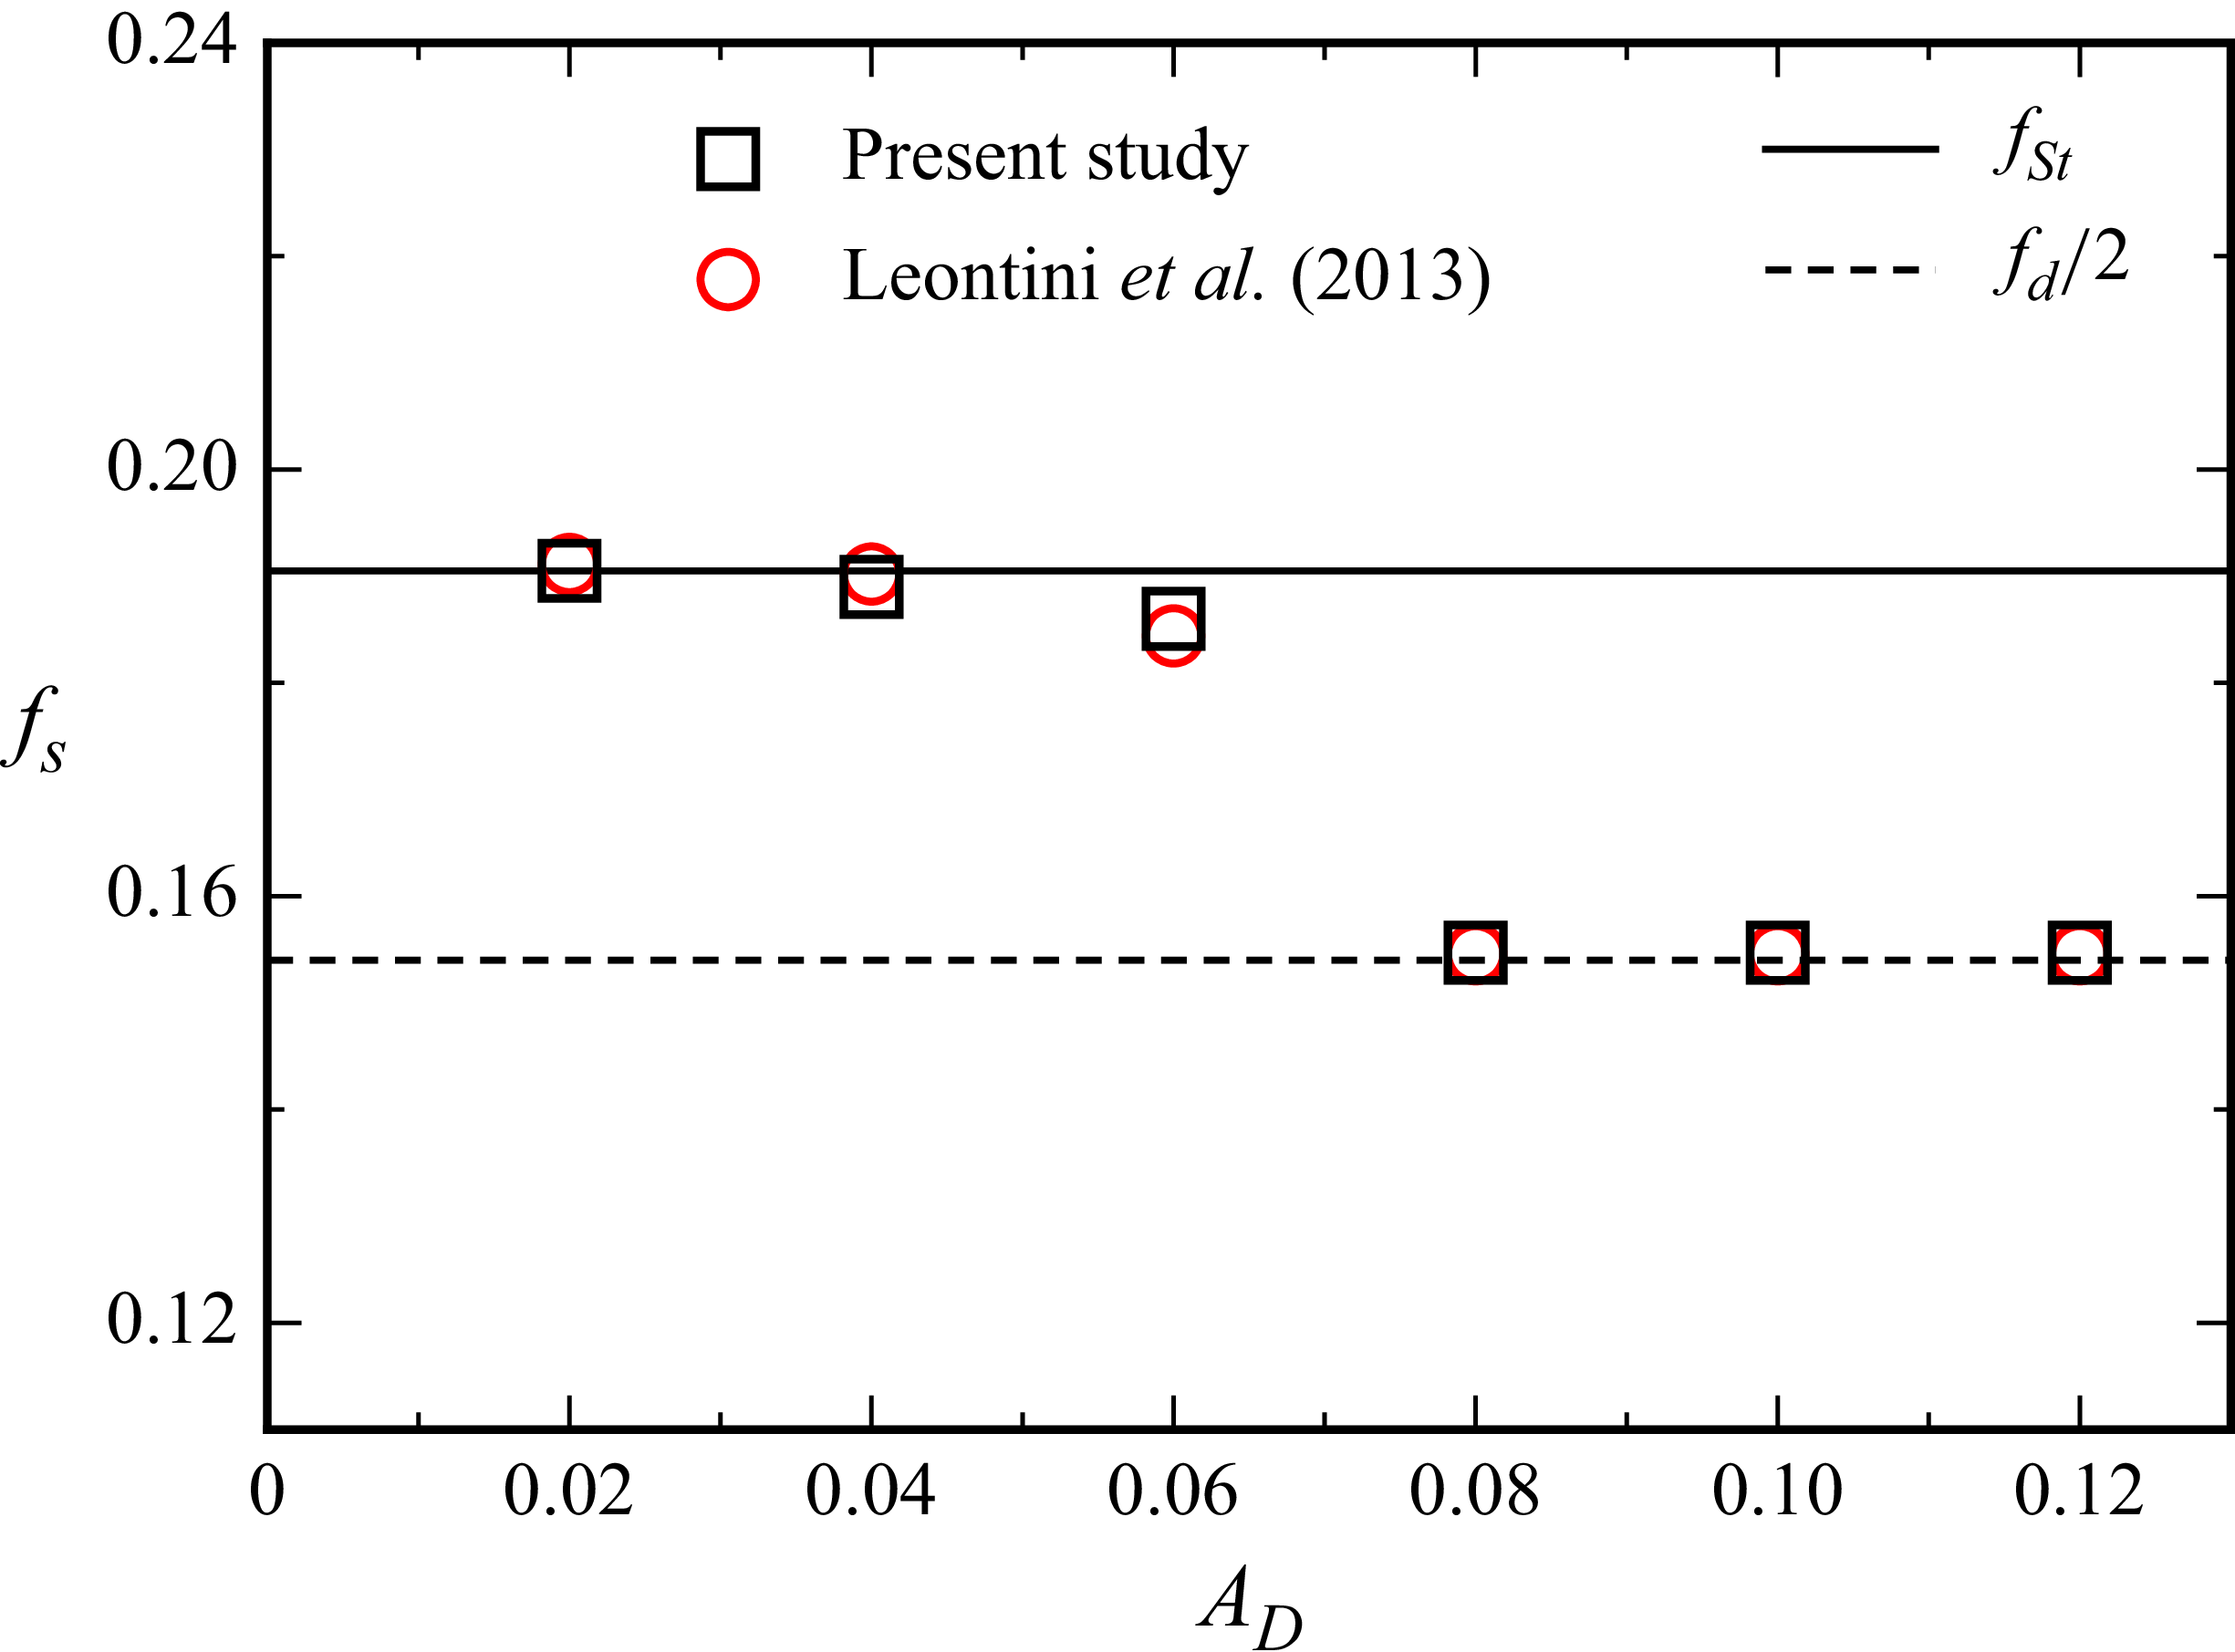
Further validation is carried out by comparing the vortex shedding frequency $f_s$
extracted from the spectral analysis of the wake velocity field. As shown in figure 2, the predicted
$f_s$
extracted from the spectral analysis of the wake velocity field. As shown in figure 2, the predicted $f_s$
values align closely with those reported by Leontini et al. (Reference Leontini, Lo Jacono and Thompson2013) for varying oscillation amplitudes. The dashed line indicates the subharmonic of the driving frequency,
$f_s$
values align closely with those reported by Leontini et al. (Reference Leontini, Lo Jacono and Thompson2013) for varying oscillation amplitudes. The dashed line indicates the subharmonic of the driving frequency, $f_d/2$
. The convergence of the measured shedding frequency
$f_d/2$
. The convergence of the measured shedding frequency $f_s$
toward this subharmonic demonstrates a synchronisation event, corresponding to the
$f_s$
toward this subharmonic demonstrates a synchronisation event, corresponding to the $P_{2}$
shedding mode, which repeats over two oscillation cycles. The consistent agreement in both force and frequency responses confirms that the numerical framework reliably reproduces the wake dynamics and nonlinear vortex interactions associated with forced oscillations in homogeneous flows.
$P_{2}$
shedding mode, which repeats over two oscillation cycles. The consistent agreement in both force and frequency responses confirms that the numerical framework reliably reproduces the wake dynamics and nonlinear vortex interactions associated with forced oscillations in homogeneous flows.

Figure 2. Comparison of shedding frequency $f_{s}$
between Leontini et al. (Reference Leontini, Lo Jacono and Thompson2013) and the present study for
$f_{s}$
between Leontini et al. (Reference Leontini, Lo Jacono and Thompson2013) and the present study for $ \textit{Re} = 175$
and
$ \textit{Re} = 175$
and $f_d / f_{St} = 1.6$
. The solid line marks the natural shedding frequency
$f_d / f_{St} = 1.6$
. The solid line marks the natural shedding frequency $f_{St}$
of a stationary cylinder, while the dashed line indicates the subharmonic of the driving frequency
$f_{St}$
of a stationary cylinder, while the dashed line indicates the subharmonic of the driving frequency $f_d/2$
.
$f_d/2$
.
3.3. Validation of internal wave generation
To validate our numerical simulation of internal waves in stratified flows, we compare the phase configurations of waves generated by a cylinder with the theoretical predictions of Stevenson & Thomas (Reference Stevenson and Thomas1969) and the experimental results of Davies et al. (Reference Davies, Boyer, Fernando and Zhang1994) for a horizontally moving cylinder with superimposed inline oscillation. We adapt the nomenclature of Stevenson & Thomas (Reference Stevenson and Thomas1969) to align with our study by redefining their Brunt–Väisälä or buoyancy frequency ( $\omega _0$
) as
$\omega _0$
) as $N$
and their angular oscillation frequency (
$N$
and their angular oscillation frequency ( $\omega _f$
) in terms of driving frequency
$\omega _f$
) in terms of driving frequency $f_d$
as
$f_d$
as $\omega _f = 2 \pi f_d$
and represent the frequency ratio (
$\omega _f = 2 \pi f_d$
and represent the frequency ratio ( $\omega _f / \omega _0$
) as
$\omega _f / \omega _0$
) as $2 \pi f_d / N$
. Similarly, we set the cylinder velocity (
$2 \pi f_d / N$
. Similarly, we set the cylinder velocity ( $W$
) equal to the mean velocity
$W$
) equal to the mean velocity $U$
. This configuration aligns with those of both studies, producing comparable relative motion and wave patterns. We consider the dispersion relation that governs internal gravity waves from Stevenson & Thomas (Reference Stevenson and Thomas1969), as
$U$
. This configuration aligns with those of both studies, producing comparable relative motion and wave patterns. We consider the dispersion relation that governs internal gravity waves from Stevenson & Thomas (Reference Stevenson and Thomas1969), as
 \begin{align} \left (2 \pi f_d + U k_1 \right )^2 \left (k_1^2 + k_2^2 \right ) - N^2 k_1^2 = 0, \end{align}
where $k_1$
and
$k_1$
and $k_2$
are the horizontal and vertical wavenumbers, respectively. The phase configuration is computed as
$k_2$
are the horizontal and vertical wavenumbers, respectively. The phase configuration is computed as
 \begin{align} (x, y) \frac {N}{A U} &= B \csc (\theta ) \big ( B \cos ^2 \theta + 1, B \sin \theta \cos \theta \big ), \end{align}
 \begin{align} \textrm{where} \quad B &= \frac {-\sin \theta }{\pm \sin \theta - 2 \pi f_d / N}, \end{align}
where $\theta$
is the angle of the wave relative to the horizontal and
$\theta$
is the angle of the wave relative to the horizontal and $A$
is the phase constant. These equations generate theoretical wave phase plots for both steady and oscillatory contributions.
$A$
is the phase constant. These equations generate theoretical wave phase plots for both steady and oscillatory contributions.
We numerically study two distinct flow regimes corresponding to the ‘Type 4’ and ‘Type 2’ patterns described in the experimental study of Davies et al. (Reference Davies, Boyer, Fernando and Zhang1994).
Panels (a) and (b) in figure 3 present, respectively, the numerical and theoretical results for the ‘Type 4’ regime in $ \textit{Fr} = 0.24$
,
$ \textit{Fr} = 0.24$
, $ \textit{Re} = 79$
and
$ \textit{Re} = 79$
and $2\pi f_d / N = 0.94$
. Similarly, figure 3(c,d) shows the numerical and theoretical comparisons for the ‘Type 2’ regime in
$2\pi f_d / N = 0.94$
. Similarly, figure 3(c,d) shows the numerical and theoretical comparisons for the ‘Type 2’ regime in $ \textit{Fr} = 0.61$
,
$ \textit{Fr} = 0.61$
, $ \textit{Re} = 159$
and
$ \textit{Re} = 159$
and $2\pi f_d / N = 0.58$
. In figure 3(b,d), solid lines depict wave systems induced by the oscillatory motion of the cylinder, whereas the dashed lines represent those from the steady-flow component. The numerical density gradient magnitude fields (
$2\pi f_d / N = 0.58$
. In figure 3(b,d), solid lines depict wave systems induced by the oscillatory motion of the cylinder, whereas the dashed lines represent those from the steady-flow component. The numerical density gradient magnitude fields ( $|\boldsymbol{\nabla }\rho |$
) in figure 3(a,c), obtained at
$|\boldsymbol{\nabla }\rho |$
) in figure 3(a,c), obtained at $t/T = 10$
(where
$t/T = 10$
(where $T = 1/f_d$
), exhibit excellent agreement with their respective theoretical wave configurations and the corresponding experimental observations of Davies et al. (Reference Davies, Boyer, Fernando and Zhang1994). Notably, the angles and orientations of the internal wave beams are well captured, as are the interference patterns arising from superimposed steady and oscillatory components.
$T = 1/f_d$
), exhibit excellent agreement with their respective theoretical wave configurations and the corresponding experimental observations of Davies et al. (Reference Davies, Boyer, Fernando and Zhang1994). Notably, the angles and orientations of the internal wave beams are well captured, as are the interference patterns arising from superimposed steady and oscillatory components.

Figure 3. Comparison of numerical and theoretical internal wave patterns generated by a horizontally oscillating cylinder in stratified flow. Left: numerical results; right: theoretical predictions. (a,b) $ \textit{Fr} = 0.24$
,
$ \textit{Fr} = 0.24$
, $ \textit{Re} = 79$
,
$ \textit{Re} = 79$
, $2\pi f_d/N = 0.94$
; (c,d)
$2\pi f_d/N = 0.94$
; (c,d) $ \textit{Fr} = 0.61$
,
$ \textit{Fr} = 0.61$
, $ \textit{Re} = 159$
,
$ \textit{Re} = 159$
, $2\pi f_d/N = 0.58$
. In the theoretical plots (b) and (d), solid lines indicate unsteady wave systems induced by oscillation, while dashed lines represent steady-state wave fields. Numerical wave patterns are visualised via density gradient magnitude
$2\pi f_d/N = 0.58$
. In the theoretical plots (b) and (d), solid lines indicate unsteady wave systems induced by oscillation, while dashed lines represent steady-state wave fields. Numerical wave patterns are visualised via density gradient magnitude $|\boldsymbol{\nabla }\rho |$
, computed with the present solver. Theoretical predictions follow analytical expressions by Stevenson & Thomas (Reference Stevenson and Thomas1969).
$|\boldsymbol{\nabla }\rho |$
, computed with the present solver. Theoretical predictions follow analytical expressions by Stevenson & Thomas (Reference Stevenson and Thomas1969).
These comparisons confirm that the present numerical solver faithfully reproduces the physical mechanisms underlying internal wave generation by an oscillating body in a stratified medium. The observed agreement with both theoretical and experimental references demonstrates the model’s capability to resolve the anisotropic propagation of internal waves and their dependence on frequency and stratification parameters.
4. Wake dynamics
4.1. Oscillating cylinder in homogeneous flow
We begin our analysis by examining the wake dynamics of an oscillating cylinder in a homogeneous fluid environment ( $ \textit{Fr} = \infty$
). Figure 4 presents the instantaneous vorticity fields at a non-dimensional time
$ \textit{Fr} = \infty$
). Figure 4 presents the instantaneous vorticity fields at a non-dimensional time $t/T = 100$
, where
$t/T = 100$
, where $T$
is the oscillation period. Our force coefficient analyses confirm that a statistically steady state can be reached after approximately 40–50 oscillation cycles for all cases considered.
$T$
is the oscillation period. Our force coefficient analyses confirm that a statistically steady state can be reached after approximately 40–50 oscillation cycles for all cases considered.

Figure 4. Instantaneous vorticity fields for homogeneous flow cases ( $ \textit{Fr}=\infty$
) at varied
$ \textit{Fr}=\infty$
) at varied $A_{D}$
with
$A_{D}$
with $ \textit{Re}=175$
and
$ \textit{Re}=175$
and $f_d/f_{St}=1.6$
.
$f_d/f_{St}=1.6$
.
Under homogeneous conditions, the wake structure exhibits a strong dependence on the oscillation amplitude $A_D$
. At small amplitudes (
$A_D$
. At small amplitudes ( $A_D = 0.1$
), vortex shedding occurs alternately from either side of the cylinder during consecutive oscillation cycles, producing one vortex shed per cycle. As the amplitude increases to
$A_D = 0.1$
), vortex shedding occurs alternately from either side of the cylinder during consecutive oscillation cycles, producing one vortex shed per cycle. As the amplitude increases to $A_D = 0.2$
, two vortices are shed per cycle, one from each side, although they differ in strength and drift obliquely away from the wake centreline. A similar shedding pattern persists at
$A_D = 0.2$
, two vortices are shed per cycle, one from each side, although they differ in strength and drift obliquely away from the wake centreline. A similar shedding pattern persists at $A_D = 0.3$
, although with diminished asymmetry.
$A_D = 0.3$
, although with diminished asymmetry.
For amplitudes $A_D \geqslant 0.4$
, the wake undergoes a transition to a nearly symmetric state, characterised by negligible lift fluctuations (
$A_D \geqslant 0.4$
, the wake undergoes a transition to a nearly symmetric state, characterised by negligible lift fluctuations ( $C_L \lt 10^{-4}$
) across most of the domain. Specifically, at
$C_L \lt 10^{-4}$
) across most of the domain. Specifically, at $A_D = 0.4$
, the wake remains symmetric in the near-to-mid-wake region, with only minor asymmetries emerging farther downstream. This behaviour is consistent with the observations of Tang et al. (Reference Tang, Cheng, Tong, Lu and Zhao2017) under similar flow conditions. This regime appears transitional, as evidenced by the
$A_D = 0.4$
, the wake remains symmetric in the near-to-mid-wake region, with only minor asymmetries emerging farther downstream. This behaviour is consistent with the observations of Tang et al. (Reference Tang, Cheng, Tong, Lu and Zhao2017) under similar flow conditions. This regime appears transitional, as evidenced by the $C_D$
–
$C_D$
– $C_L$
phase portrait in figure 5(c), which illustrates a near-symmetric trajectory. The corresponding power spectrum in figure 5(b) further confirms that the dominant frequency component is synchronised with the driving frequency
$C_L$
phase portrait in figure 5(c), which illustrates a near-symmetric trajectory. The corresponding power spectrum in figure 5(b) further confirms that the dominant frequency component is synchronised with the driving frequency $f_d$
. As
$f_d$
. As $A_D$
increases beyond 0.4, the wake symmetry becomes more pronounced and the wake broadens laterally.
$A_D$
increases beyond 0.4, the wake symmetry becomes more pronounced and the wake broadens laterally.

Figure 5. Flow characteristics in homogeneous conditions ( $ \textit{Fr} = \infty$
): (a) time histories of drag (
$ \textit{Fr} = \infty$
): (a) time histories of drag ( $C_D$
) and lift (
$C_D$
) and lift ( $C_L$
) coefficients for selected amplitude ratios
$C_L$
) coefficients for selected amplitude ratios $A_D$
; (b) corresponding power spectral densities of the lift signal; (c) phase portraits of
$A_D$
; (b) corresponding power spectral densities of the lift signal; (c) phase portraits of $C_D$
vs
$C_D$
vs $C_L$
illustrating limit-cycle behaviour.
$C_L$
illustrating limit-cycle behaviour.
Figure 5 summarises the primary wake dynamics observed in homogeneous flows. The time histories of the drag and lift coefficients, defined as $C_D = F_x / \{0.5\,\rho _0\,U^2\,b\,D\}$
and
$C_D = F_x / \{0.5\,\rho _0\,U^2\,b\,D\}$
and $C_L = F_y / \{0.5\,\rho _0\,U^2\,b\,D\}$
, respectively, are presented in figure 5(a), where
$C_L = F_y / \{0.5\,\rho _0\,U^2\,b\,D\}$
, respectively, are presented in figure 5(a), where $F_x$
and
$F_x$
and $F_y$
represent the streamwise and transverse forces on the cylinder, and
$F_y$
represent the streamwise and transverse forces on the cylinder, and $b$
denotes the (arbitrary) span length in the two-dimensional formulation. The corresponding frequency spectra (figure 5
b) obtained via fast Fourier transform of
$b$
denotes the (arbitrary) span length in the two-dimensional formulation. The corresponding frequency spectra (figure 5
b) obtained via fast Fourier transform of $C_L$
, together with the phase portraits of
$C_L$
, together with the phase portraits of $C_D$
vs
$C_D$
vs $C_L$
(figure 5
c), reveal a prominent synchronisation of the shedding frequency
$C_L$
(figure 5
c), reveal a prominent synchronisation of the shedding frequency $f_s$
to half the driving frequency (
$f_s$
to half the driving frequency ( $f_d/2$
) for
$f_d/2$
) for $A_D \lt 0.4$
. This corresponds to the
$A_D \lt 0.4$
. This corresponds to the $P_2$
mode reported by Leontini et al. (Reference Leontini, Lo Jacono and Thompson2013), wherein the vortex shedding pattern repeats every two oscillation cycles. The nearly closed loops observed in the
$P_2$
mode reported by Leontini et al. (Reference Leontini, Lo Jacono and Thompson2013), wherein the vortex shedding pattern repeats every two oscillation cycles. The nearly closed loops observed in the $C_D$
–
$C_D$
– $C_L$
portraits (figure 5
c) further confirm that the vortex shedding remains locked onto a subharmonic of the oscillation frequency of the cylinder.
$C_L$
portraits (figure 5
c) further confirm that the vortex shedding remains locked onto a subharmonic of the oscillation frequency of the cylinder.
At $A_D = 0.4$
, the wake transitions into a symmetric shedding regime. This is evidenced by the negligible lift fluctuations and the nearly single-valued trajectory in the
$A_D = 0.4$
, the wake transitions into a symmetric shedding regime. This is evidenced by the negligible lift fluctuations and the nearly single-valued trajectory in the $C_D$
–
$C_D$
– $C_L$
phase space. In this case, the spectral content is captured primarily by
$C_L$
phase space. In this case, the spectral content is captured primarily by $C_D$
, since
$C_D$
, since $C_L$
remains essentially constant and does not reflect significant unsteady behaviour. The dominant frequency peak in
$C_L$
remains essentially constant and does not reflect significant unsteady behaviour. The dominant frequency peak in $C_D$
appears at
$C_D$
appears at $f_s / f_d = 1$
, indicating that vortex shedding is now synchronised with the driving frequency. This marks the establishment of a stable and symmetric wake configuration.
$f_s / f_d = 1$
, indicating that vortex shedding is now synchronised with the driving frequency. This marks the establishment of a stable and symmetric wake configuration.
4.2. Oscillating cylinder in stratified flow
Building on the flow structure observed in homogeneous conditions, we now assess the influence of stable density stratification on the wake of an oscillating cylinder. Figure 6 presents representative vorticity fields at a non-dimensional time $t/T = 100$
for a range of Froude numbers (
$t/T = 100$
for a range of Froude numbers ( $ \textit{Fr} = 1$
, 2, 4, 10, 100) and oscillation amplitudes (
$ \textit{Fr} = 1$
, 2, 4, 10, 100) and oscillation amplitudes ( $0.1 \leqslant A_D \leqslant 0.6$
). As stratification intensifies (i.e. as
$0.1 \leqslant A_D \leqslant 0.6$
). As stratification intensifies (i.e. as $ \textit{Fr}$
decreases), vertical motions are progressively suppressed, leading to modified wake structures and the emergence of internal gravity waves.
$ \textit{Fr}$
decreases), vertical motions are progressively suppressed, leading to modified wake structures and the emergence of internal gravity waves.

Figure 6. Instantaneous vorticity fields for stratified flow cases across the $ \textit{Fr}$
–
$ \textit{Fr}$
– $A_{D}$
parameter space at
$A_{D}$
parameter space at $ \textit{Re}=175$
and
$ \textit{Re}=175$
and $f_d/f_{St}=1.6$
.
$f_d/f_{St}=1.6$
.
At the lowest Froude number ( $ \textit{Fr} = 1$
), the buoyancy forces strongly constrain the vertical motion, resulting in a compact wake and prominent internal wave emission. In this regime, vortex shedding is completely suppressed for small amplitudes (
$ \textit{Fr} = 1$
), the buoyancy forces strongly constrain the vertical motion, resulting in a compact wake and prominent internal wave emission. In this regime, vortex shedding is completely suppressed for small amplitudes ( $A_D = 0.1$
and 0.2), leading to restored wake symmetry. The cylinder acts as a wave source, with clearly defined internal wave beams radiating outward and dominating the far-field structure. It is noteworthy that for
$A_D = 0.1$
and 0.2), leading to restored wake symmetry. The cylinder acts as a wave source, with clearly defined internal wave beams radiating outward and dominating the far-field structure. It is noteworthy that for $ \textit{Fr}=1$
, the ratio between the forcing angular frequency and the buoyancy frequency is
$ \textit{Fr}=1$
, the ratio between the forcing angular frequency and the buoyancy frequency is $2 \pi f_d / N \approx 1.93$
. In this regime, where the forcing frequency is close to twice the natural buoyancy frequency, conditions are favourable for parametric resonance, which likely amplifies the formation of the observed pronounced internal wave beams. For moderate amplitudes (
$2 \pi f_d / N \approx 1.93$
. In this regime, where the forcing frequency is close to twice the natural buoyancy frequency, conditions are favourable for parametric resonance, which likely amplifies the formation of the observed pronounced internal wave beams. For moderate amplitudes ( $A_D = 0.3$
–0.5), asymmetric vortical structures appear in the near wake, although the far wake remains narrow and wave dominated due to persistent stratification effects. Interestingly, the cases that produce symmetric wake structures under homogeneous conditions (e.g.
$A_D = 0.3$
–0.5), asymmetric vortical structures appear in the near wake, although the far wake remains narrow and wave dominated due to persistent stratification effects. Interestingly, the cases that produce symmetric wake structures under homogeneous conditions (e.g. $A_D = 0.4$
–0.5) exhibit markedly different patterns when stratification is present. As stratification weakens (increasing
$A_D = 0.4$
–0.5) exhibit markedly different patterns when stratification is present. As stratification weakens (increasing $ \textit{Fr}$
to 2 or 4), the amplitude of internal waves diminishes, and the near-wake structure gradually resembles that of a homogeneous flow. For
$ \textit{Fr}$
to 2 or 4), the amplitude of internal waves diminishes, and the near-wake structure gradually resembles that of a homogeneous flow. For $ \textit{Fr} \geqslant 10$
, the influence of buoyancy is negligible and the wake morphology converges to the unstratified case.
$ \textit{Fr} \geqslant 10$
, the influence of buoyancy is negligible and the wake morphology converges to the unstratified case.
To quantitatively assess wake symmetry, figure 7 presents scatter plots of the normalised velocity magnitude ( $|\boldsymbol{U}| / |\boldsymbol{U}|_{\max }$
) for vertically mirrored locations across the centreline (
$|\boldsymbol{U}| / |\boldsymbol{U}|_{\max }$
) for vertically mirrored locations across the centreline ( $y = 0$
). Each point corresponds to a velocity pair measured at
$y = 0$
). Each point corresponds to a velocity pair measured at $(x, +y)$
and
$(x, +y)$
and $(x, -y)$
at a given instant. Perfect symmetry is indicated by alignment along the unit-slope reference line (red).
$(x, -y)$
at a given instant. Perfect symmetry is indicated by alignment along the unit-slope reference line (red).

Figure 7. Scatter plots of normalised velocity magnitude ( $|\boldsymbol{U}| / |\boldsymbol{U}|_{\max }$
) across the midplane (
$|\boldsymbol{U}| / |\boldsymbol{U}|_{\max }$
) across the midplane ( $y = 0$
) for stratified flow cases in
$y = 0$
) for stratified flow cases in $ \textit{Fr}$
–
$ \textit{Fr}$
– $A_D$
space. The red line denotes the unit-slope reference for perfect symmetry.
$A_D$
space. The red line denotes the unit-slope reference for perfect symmetry.
For strongly stratified and weakly forced cases (e.g. $ \textit{Fr} = 1$
,
$ \textit{Fr} = 1$
, $A_D = 0.1$
), the data closely follow the diagonal, reflecting high symmetry and consistent with the suppression of vortex shedding and symmetric internal wave emission. In contrast, for intermediate amplitudes (
$A_D = 0.1$
), the data closely follow the diagonal, reflecting high symmetry and consistent with the suppression of vortex shedding and symmetric internal wave emission. In contrast, for intermediate amplitudes ( $A_D = 0.3$
–0.4) and weaker stratification, a significant scatter emerges, indicating asymmetry in the wake. These observations are consistent with the qualitative flow structures shown in figure 6.
$A_D = 0.3$
–0.4) and weaker stratification, a significant scatter emerges, indicating asymmetry in the wake. These observations are consistent with the qualitative flow structures shown in figure 6.
This diagnostic approach provides a robust and sensitive measure of wake symmetry, particularly useful in transitional regimes where asymmetry is weak, localised or intermittent, such as at $ \textit{Fr} = 1$
and
$ \textit{Fr} = 1$
and $A_D {\gt} 0.4$
. It complements vorticity-based visualisations and enables more precise classification of wake states in stratified environments.
$A_D {\gt} 0.4$
. It complements vorticity-based visualisations and enables more precise classification of wake states in stratified environments.
Figure 8 characterises the dominant wake modes in the stratified flow at $ \textit{Fr} = 1$
for varying oscillation amplitudes. The temporal evolution of the drag and lift coefficients (
$ \textit{Fr} = 1$
for varying oscillation amplitudes. The temporal evolution of the drag and lift coefficients ( $C_D$
and
$C_D$
and $C_L$
) is shown in figure 8(a), while figures 8(b) and 8(c) respectively present the frequency spectra of
$C_L$
) is shown in figure 8(a), while figures 8(b) and 8(c) respectively present the frequency spectra of $C_L$
and the corresponding
$C_L$
and the corresponding $C_D$
–
$C_D$
– $C_L$
phase portraits. Collectively, these results illustrate the transition from symmetric to asymmetric wake structures as the oscillation amplitude increases.
$C_L$
phase portraits. Collectively, these results illustrate the transition from symmetric to asymmetric wake structures as the oscillation amplitude increases.

Figure 8. (a) Time histories of $C_D$
and
$C_D$
and $C_L$
for selected
$C_L$
for selected $A_D$
. (b) Power spectra of
$A_D$
. (b) Power spectra of $C_L$
. (c) Phase portraits of
$C_L$
. (c) Phase portraits of $C_D$
vs
$C_D$
vs $C_L$
. All results are for
$C_L$
. All results are for $ \textit{Fr} = 1$
. As in the homogeneous cases, the
$ \textit{Fr} = 1$
. As in the homogeneous cases, the $P_2$
mode re-emerges at moderate oscillation amplitudes, whereas lower amplitudes yield an essentially symmetric wake.
$P_2$
mode re-emerges at moderate oscillation amplitudes, whereas lower amplitudes yield an essentially symmetric wake.
At low amplitudes ( $A_D = 0.1$
and
$A_D = 0.1$
and $0.2$
), the wake remains nearly symmetric, as indicated by negligible lift fluctuations and the absence of subharmonic content in the
$0.2$
), the wake remains nearly symmetric, as indicated by negligible lift fluctuations and the absence of subharmonic content in the $C_L$
spectra. In these cases, the frequency analysis is based primarily on
$C_L$
spectra. In these cases, the frequency analysis is based primarily on $C_D$
, since
$C_D$
, since $C_L$
is effectively zero. The dominant spectral peak in
$C_L$
is effectively zero. The dominant spectral peak in $C_D$
occurs at
$C_D$
occurs at $f_s / f_d = 1$
, confirming that vortex shedding is phase locked to the driving frequency. The corresponding phase portraits are nearly single valued, further supporting the observation of symmetric shedding.
$f_s / f_d = 1$
, confirming that vortex shedding is phase locked to the driving frequency. The corresponding phase portraits are nearly single valued, further supporting the observation of symmetric shedding.
At $A_D = 0.3$
, the
$A_D = 0.3$
, the $C_L$
spectrum shows a strong subharmonic peak at
$C_L$
spectrum shows a strong subharmonic peak at $f_s / f_d = 0.5$
, signifying the emergence of the
$f_s / f_d = 0.5$
, signifying the emergence of the $P_2$
mode. This is consistent with the closed, elliptical-phase portrait and finite amplitude lift fluctuations. As the amplitude increases to
$P_2$
mode. This is consistent with the closed, elliptical-phase portrait and finite amplitude lift fluctuations. As the amplitude increases to $A_D = 0.4$
, the spectrum exhibits two comparable peaks at
$A_D = 0.4$
, the spectrum exhibits two comparable peaks at $f_s / f_d = 0.5$
and
$f_s / f_d = 0.5$
and $1.5$
, suggesting a more complex wake structure. The phase portrait becomes multilobed, spanning a wider range in the
$1.5$
, suggesting a more complex wake structure. The phase portrait becomes multilobed, spanning a wider range in the $C_L$
direction than at
$C_L$
direction than at $A_D = 0.3$
, indicating increased asymmetry. These trends align with the vorticity fields shown in figure 6, where the near wake becomes increasingly asymmetric, while the far wake remains influenced by stratification-induced damping.
$A_D = 0.3$
, indicating increased asymmetry. These trends align with the vorticity fields shown in figure 6, where the near wake becomes increasingly asymmetric, while the far wake remains influenced by stratification-induced damping.
4.3. Influence of oscillation amplitude and stratification on mean forces
The cycle-averaged drag coefficient $\langle C_D \rangle$
provides a measure of the net streamwise momentum exchange between the oscillating body and the fluid, incorporating contributions from vortex-induced unsteadiness, flow separation and internal wave radiation. Figure 9 illustrates the variation of
$\langle C_D \rangle$
provides a measure of the net streamwise momentum exchange between the oscillating body and the fluid, incorporating contributions from vortex-induced unsteadiness, flow separation and internal wave radiation. Figure 9 illustrates the variation of $\langle C_D \rangle$
with the oscillation amplitude
$\langle C_D \rangle$
with the oscillation amplitude $A_D$
across a wide range of Froude numbers (
$A_D$
across a wide range of Froude numbers ( $ \textit{Fr}$
), thus capturing the influence of stable stratification on the wake–force dynamics.
$ \textit{Fr}$
), thus capturing the influence of stable stratification on the wake–force dynamics.

Figure 9. Mean drag coefficients $\langle C_D \rangle$
as a function of oscillation amplitude
$\langle C_D \rangle$
as a function of oscillation amplitude $A_D$
for flow past a streamwise oscillating cylinder in homogeneous and stratified fluids at
$A_D$
for flow past a streamwise oscillating cylinder in homogeneous and stratified fluids at $ \textit{Re} = 175$
and
$ \textit{Re} = 175$
and $f_d / f_{St} = 1.6$
.
$f_d / f_{St} = 1.6$
.
In the homogeneous limit ( $ \textit{Fr} = \infty$
),
$ \textit{Fr} = \infty$
), $\langle C_D \rangle$
exhibits a non-monotonic dependence on
$\langle C_D \rangle$
exhibits a non-monotonic dependence on $A_D$
. As
$A_D$
. As $A_D$
increases from
$A_D$
increases from $0.1$
to
$0.1$
to $0.3$
, the mean drag increases from 1.33 to a peak of 2.05, followed by a sharp decline to 1.06 at
$0.3$
, the mean drag increases from 1.33 to a peak of 2.05, followed by a sharp decline to 1.06 at $A_D = 0.6$
. This trend reflects the underlying changes in wake structure: at small to moderate amplitudes, unsteady vortex shedding leads to increased pressure deficits in the wake, thereby amplifying form drag. However, beyond
$A_D = 0.6$
. This trend reflects the underlying changes in wake structure: at small to moderate amplitudes, unsteady vortex shedding leads to increased pressure deficits in the wake, thereby amplifying form drag. However, beyond $A_D \approx 0.3$
, the wake becomes more symmetric and less energetic, resulting in diminished rear-surface suction and a consequent reduction in drag. This transition coincides with the emergence of symmetric shedding regimes (as described in § 4.1).
$A_D \approx 0.3$
, the wake becomes more symmetric and less energetic, resulting in diminished rear-surface suction and a consequent reduction in drag. This transition coincides with the emergence of symmetric shedding regimes (as described in § 4.1).
For very weak stratification ( $ \textit{Fr} = 100$
), the drag response remains nearly identical to the homogeneous case, with discrepancies of less than
$ \textit{Fr} = 100$
), the drag response remains nearly identical to the homogeneous case, with discrepancies of less than $0.1\,\%$
across all amplitudes. As stratification becomes moderately strong (
$0.1\,\%$
across all amplitudes. As stratification becomes moderately strong ( $ \textit{Fr} = 10$
, and especially
$ \textit{Fr} = 10$
, and especially $ \textit{Fr} = 4$
), significant reductions in
$ \textit{Fr} = 4$
), significant reductions in $\langle C_D \rangle$
appear. For example, at
$\langle C_D \rangle$
appear. For example, at $A_D = 0.3$
,
$A_D = 0.3$
, $\langle C_D \rangle$
drops from 2.05 (
$\langle C_D \rangle$
drops from 2.05 ( $ \textit{Fr} = \infty$
) to 1.86 (
$ \textit{Fr} = \infty$
) to 1.86 ( $ \textit{Fr} = 10$
) and further to 1.11 (
$ \textit{Fr} = 10$
) and further to 1.11 ( $ \textit{Fr} = 4$
), indicating that stratification begins to influence drag once
$ \textit{Fr} = 4$
), indicating that stratification begins to influence drag once $ \textit{Fr} \lesssim 10$
.
$ \textit{Fr} \lesssim 10$
.
The most pronounced effects are observed at $ \textit{Fr} = 2$
and
$ \textit{Fr} = 2$
and $ \textit{Fr} = 1$
. At
$ \textit{Fr} = 1$
. At $ \textit{Fr} = 2$
, drag is suppressed across the entire amplitude range, increasing slightly from 0.77 at
$ \textit{Fr} = 2$
, drag is suppressed across the entire amplitude range, increasing slightly from 0.77 at $A_D = 0.1$
to a peak of 0.89 at
$A_D = 0.1$
to a peak of 0.89 at $A_D = 0.3$
, before decreasing to 0.71 at
$A_D = 0.3$
, before decreasing to 0.71 at $A_D = 0.6$
. This represents up to a
$A_D = 0.6$
. This represents up to a $33\,\%$
reduction in mean drag compared with homogeneous flow. Interestingly, for
$33\,\%$
reduction in mean drag compared with homogeneous flow. Interestingly, for $ \textit{Fr} = 1$
, the drag shows a non-monotonic trend:
$ \textit{Fr} = 1$
, the drag shows a non-monotonic trend: $\langle C_D \rangle$
rises from 0.96 to a maximum of 1.36 at
$\langle C_D \rangle$
rises from 0.96 to a maximum of 1.36 at $A_D = 0.4$
and then decreases for higher amplitudes. Notably, unlike the
$A_D = 0.4$
and then decreases for higher amplitudes. Notably, unlike the $ \textit{Fr} = 2$
case, the drag at
$ \textit{Fr} = 2$
case, the drag at $ \textit{Fr} = 1$
remains marginally higher than the homogeneous value at
$ \textit{Fr} = 1$
remains marginally higher than the homogeneous value at $A_D = 0.6$
(
$A_D = 0.6$
( $\langle C_D \rangle = 1.12$
vs 1.06), suggesting that drag enhancement can re-emerge under strong stratification at sufficiently large amplitudes.
$\langle C_D \rangle = 1.12$
vs 1.06), suggesting that drag enhancement can re-emerge under strong stratification at sufficiently large amplitudes.
To elucidate the mechanisms underlying these drag trends, figure 10 presents the corresponding cycle-averaged surface pressure distributions, $C_p(\theta )$
, for representative cases at
$C_p(\theta )$
, for representative cases at $A_D = 0.3$
and
$A_D = 0.3$
and $A_D = 0.6$
. At
$A_D = 0.6$
. At $A_D = 0.3$
(figure 10
a), all cases exhibit nearly identical pressure recovery at the front stagnation point, with negligible differences in
$A_D = 0.3$
(figure 10
a), all cases exhibit nearly identical pressure recovery at the front stagnation point, with negligible differences in $C_p$
. However, significant stratification effects emerge at the rear stagnation point. The homogeneous case (
$C_p$
. However, significant stratification effects emerge at the rear stagnation point. The homogeneous case ( $ \textit{Fr}=\infty$
) exhibits the strongest rear suction (lowest
$ \textit{Fr}=\infty$
) exhibits the strongest rear suction (lowest $C_{p}$
), consistent with a broad wake and large pressure deficit. Stratification at
$C_{p}$
), consistent with a broad wake and large pressure deficit. Stratification at $ \textit{Fr}=2$
weakens rear suction, indicating enhanced pressure recovery and a narrower wake. This explains the drag reduction observed for
$ \textit{Fr}=2$
weakens rear suction, indicating enhanced pressure recovery and a narrower wake. This explains the drag reduction observed for $ \textit{Fr}=2$
compared with
$ \textit{Fr}=2$
compared with $ \textit{Fr}=\infty$
. The
$ \textit{Fr}=\infty$
. The $ \textit{Fr}=1$
case exhibits intermediate rear suction, with
$ \textit{Fr}=1$
case exhibits intermediate rear suction, with $C_p$
values slightly lower than
$C_p$
values slightly lower than $ \textit{Fr}=2$
but higher than
$ \textit{Fr}=2$
but higher than $ \textit{Fr}=\infty$
.
$ \textit{Fr}=\infty$
.

Figure 10. Cycle-averaged pressure coefficient ( $C_{p}$
) distributions, around a cylinder for (a)
$C_{p}$
) distributions, around a cylinder for (a) $A_{D}=0.3$
and (b)
$A_{D}=0.3$
and (b) $A_{D}=0.6$
at Froude numbers
$A_{D}=0.6$
at Froude numbers $ \textit{Fr}=1$
,
$ \textit{Fr}=1$
, $ \textit{Fr}=2$
and
$ \textit{Fr}=2$
and $ \textit{Fr}= \infty$
. Here
$ \textit{Fr}= \infty$
. Here $\theta =0^\circ$
corresponds to the rear stagnation point of the cylinder.
$\theta =0^\circ$
corresponds to the rear stagnation point of the cylinder.
At a higher oscillation amplitude ( $A_D = 0.6$
), the
$A_D = 0.6$
), the $C_p$
distributions (figure 10
b) exhibit increased complexity. The strongly stratified case (
$C_p$
distributions (figure 10
b) exhibit increased complexity. The strongly stratified case ( $ \textit{Fr}=1$
) demonstrates the highest
$ \textit{Fr}=1$
) demonstrates the highest $C_{p}$
at the front stagnation point, indicating the most substantial pressure recovery, followed by the homogeneous case (
$C_{p}$
at the front stagnation point, indicating the most substantial pressure recovery, followed by the homogeneous case ( $ \textit{Fr}=\infty$
), with
$ \textit{Fr}=\infty$
), with $ \textit{Fr}=2$
showing slightly weaker front pressure. Conversely, at the rear stagnation point,
$ \textit{Fr}=2$
showing slightly weaker front pressure. Conversely, at the rear stagnation point, $ \textit{Fr}=2$
achieves the weakest suction (highest
$ \textit{Fr}=2$
achieves the weakest suction (highest $C_{p}$
), reflecting effective pressure recovery, whereas
$C_{p}$
), reflecting effective pressure recovery, whereas $ \textit{Fr}=1$
experiences the strongest suction, and
$ \textit{Fr}=1$
experiences the strongest suction, and $ \textit{Fr}=\infty$
lies between the two. This interaction creates distinct pressure differentials, where
$ \textit{Fr}=\infty$
lies between the two. This interaction creates distinct pressure differentials, where $ \textit{Fr}=1$
combines a strong front pressure with intense rear suction, resulting in the largest pressure differential and highest drag. Similarly,
$ \textit{Fr}=1$
combines a strong front pressure with intense rear suction, resulting in the largest pressure differential and highest drag. Similarly, $ \textit{Fr}=2$
balances the moderate front pressure with optimal rear pressure recovery, minimising the differential and yielding the lowest drag, whereas
$ \textit{Fr}=2$
balances the moderate front pressure with optimal rear pressure recovery, minimising the differential and yielding the lowest drag, whereas $ \textit{Fr}=\infty$
exhibits intermediate behaviour, with weaker front pressure and stronger rear suction than
$ \textit{Fr}=\infty$
exhibits intermediate behaviour, with weaker front pressure and stronger rear suction than $ \textit{Fr}=2$
, leading to a higher drag. Collectively, these observations indicate that at large amplitudes, the combined effects of the front pressure recovery and rear-surface suction are critical for determining the drag response under stratified flow conditions. The non-monotonic drag trend at
$ \textit{Fr}=2$
, leading to a higher drag. Collectively, these observations indicate that at large amplitudes, the combined effects of the front pressure recovery and rear-surface suction are critical for determining the drag response under stratified flow conditions. The non-monotonic drag trend at $A_{D}=0.6$
arises from the dual role of stratification:
$A_{D}=0.6$
arises from the dual role of stratification: $ \textit{Fr}=1$
amplifies the front-rear pressure differences, whereas
$ \textit{Fr}=1$
amplifies the front-rear pressure differences, whereas $ \textit{Fr}=2$
optimises the pressure recovery on both sides.
$ \textit{Fr}=2$
optimises the pressure recovery on both sides.
5. Linear stability analysis
We investigate the linear stability of the time-periodic wake of an oscillating cylinder using Floquet analysis, with corroboration from full-domain numerical simulations and DMD. This multipronged approach allows us to determine the conditions for symmetry breaking and to elucidate the associated spatio-temporal structures of unstable modes. Three canonical regimes are examined: (i) homogeneous flow ( $ \textit{Fr} = \infty$
) with varying oscillation amplitude
$ \textit{Fr} = \infty$
) with varying oscillation amplitude $A_D$
, (ii) strongly stratified flow (
$A_D$
, (ii) strongly stratified flow ( $ \textit{Fr} = 1$
) with varying
$ \textit{Fr} = 1$
) with varying $A_D$
, and (iii) fixed amplitude
$A_D$
, and (iii) fixed amplitude $A_D = 0.1$
with varying stratification strength (
$A_D = 0.1$
with varying stratification strength ( $1 \leqslant \textit{Fr} \leqslant \infty$
). We identify the critical thresholds and physical mechanisms that govern wake transitions in these regimes.
$1 \leqslant \textit{Fr} \leqslant \infty$
). We identify the critical thresholds and physical mechanisms that govern wake transitions in these regimes.
5.1. Homogeneous flow: critical oscillation amplitude
In the homogeneous limit ( $ \textit{Fr} = \infty$
), we perform a Floquet stability analysis for a range of oscillation amplitudes
$ \textit{Fr} = \infty$
), we perform a Floquet stability analysis for a range of oscillation amplitudes $A_D$
at
$A_D$
at $ \textit{Re} = 175$
and forcing frequency ratio
$ \textit{Re} = 175$
and forcing frequency ratio $f_d/f_{St} = 1.6$
. The computed Floquet multiplier
$f_d/f_{St} = 1.6$
. The computed Floquet multiplier $|\bar {\mu }|$
increases approximately linearly with
$|\bar {\mu }|$
increases approximately linearly with $A_D$
near the stability threshold (figure 11). By linear extrapolating to
$A_D$
near the stability threshold (figure 11). By linear extrapolating to $|\bar {\mu }| = 1$
, we estimate a critical oscillation amplitude of
$|\bar {\mu }| = 1$
, we estimate a critical oscillation amplitude of $A_D \approx 0.455$
, beyond which the symmetric time-periodic base flow remains stable. This linear behaviour near threshold is characteristic of classical Hopf or Neimark–Sacker bifurcations in parametrically forced systems.
$A_D \approx 0.455$
, beyond which the symmetric time-periodic base flow remains stable. This linear behaviour near threshold is characteristic of classical Hopf or Neimark–Sacker bifurcations in parametrically forced systems.

Figure 11. Floquet multiplier $|\bar {\mu }|$
as a function of oscillation amplitude
$|\bar {\mu }|$
as a function of oscillation amplitude $A_D$
in homogeneous flow (
$A_D$
in homogeneous flow ( $ \textit{Fr} = \infty$
). The dashed line represents a linear fit extrapolated to
$ \textit{Fr} = \infty$
). The dashed line represents a linear fit extrapolated to $|\bar {\mu }|=1$
, yielding a critical amplitude of
$|\bar {\mu }|=1$
, yielding a critical amplitude of $A_{D} = 0.455$
. The hollow markers at
$A_{D} = 0.455$
. The hollow markers at $A_D = 0.44$
show the multipliers for computational domains with downstream lengths of
$A_D = 0.44$
show the multipliers for computational domains with downstream lengths of $35D$
,
$35D$
, $40D$
and
$40D$
and $50D$
(measured from the cylinder centre to the outlet).
$50D$
(measured from the cylinder centre to the outlet).
To verify that the critical threshold is not influenced by the length of the domain, we perform an extended stability analysis on longer computational domains. For instance, for $A_{D}=0.44$
, the leading Floquet multiplier remains essentially unchanged, with variations less than 1 % between the downstream domain lengths of
$A_{D}=0.44$
, the leading Floquet multiplier remains essentially unchanged, with variations less than 1 % between the downstream domain lengths of $35D$
,
$35D$
, $40D$
and
$40D$
and $50D$
, as shown in figure 11. The Floquet-predicted critical amplitude and its robustness to domain length are further assessed using snapshots from the full-domain numerical simulations, as shown in figure 12. In contrast, for the subcritical case (
$50D$
, as shown in figure 11. The Floquet-predicted critical amplitude and its robustness to domain length are further assessed using snapshots from the full-domain numerical simulations, as shown in figure 12. In contrast, for the subcritical case ( $A_{D}=0.46$
, bottom row), the wake remains fully symmetric. At the critical amplitude of
$A_{D}=0.46$
, bottom row), the wake remains fully symmetric. At the critical amplitude of $A_{D}=0.455$
(middle row), the wake is largely symmetric, though a slight low-amplitude waviness appears in the far wake. This waviness is less pronounced in the longer
$A_{D}=0.455$
(middle row), the wake is largely symmetric, though a slight low-amplitude waviness appears in the far wake. This waviness is less pronounced in the longer $50D$
domain, consistent with the Floquet prediction of a marginally stable mode (
$50D$
domain, consistent with the Floquet prediction of a marginally stable mode ( $|\mu | \approx 1$
) that decays over an extended convective distance. These results confirm that the onset of sustained asymmetry occurs for
$|\mu | \approx 1$
) that decays over an extended convective distance. These results confirm that the onset of sustained asymmetry occurs for $A_{D}\lt 0.455$
, and that this transition is a genuine physical phenomenon, independent of the size of the computational domain.
$A_{D}\lt 0.455$
, and that this transition is a genuine physical phenomenon, independent of the size of the computational domain.

Figure 12. Normalised vorticity fields, $\omega _z D / U_\infty$
, from full-domain numerical simulations in homogeneous flow (
$\omega _z D / U_\infty$
, from full-domain numerical simulations in homogeneous flow ( $ \textit{Fr} = \infty$
). Panels in (a, left column) and (b, right column) correspond to computational domains with downstream lengths of
$ \textit{Fr} = \infty$
). Panels in (a, left column) and (b, right column) correspond to computational domains with downstream lengths of $35D$
and
$35D$
and $50D$
(measured from the cylinder centre to the outlet), respectively. Rows correspond to
$50D$
(measured from the cylinder centre to the outlet), respectively. Rows correspond to $A_D = 0.44$
,
$A_D = 0.44$
, $0.455$
and
$0.455$
and $0.46$
(top to bottom).
$0.46$
(top to bottom).
The spatial structure of the unstable mode is illustrated in figure 13, which shows the normalised velocity perturbation components for the subcritical case $A_D = 0.44$
. The streamwise perturbation
$A_D = 0.44$
. The streamwise perturbation $u^{\prime}_x$
(figure 13
a) displays antisymmetry about the midplane, with staggered positive and negative lobes primarily in the far wake. This structure reflects a sinuous instability that amplifies perturbations between the shear layers of counter-rotating vortex pairs. In contrast, the transverse perturbation
$u^{\prime}_x$
(figure 13
a) displays antisymmetry about the midplane, with staggered positive and negative lobes primarily in the far wake. This structure reflects a sinuous instability that amplifies perturbations between the shear layers of counter-rotating vortex pairs. In contrast, the transverse perturbation $u^{\prime}_y$
(figure 13
b) retains symmetry about the midplane, consistent with the imposed streamwise forcing. These results indicate that the symmetry breaking is driven primarily by the growth of antisymmetric streamwise modes, whereas the vertical perturbations remain slaved to the base-state symmetry.
$u^{\prime}_y$
(figure 13
b) retains symmetry about the midplane, consistent with the imposed streamwise forcing. These results indicate that the symmetry breaking is driven primarily by the growth of antisymmetric streamwise modes, whereas the vertical perturbations remain slaved to the base-state symmetry.

Figure 13. Contours of normalised velocity perturbation components for homogeneous flow ( $ \textit{Fr}=\infty$
) and
$ \textit{Fr}=\infty$
) and $A_D=0.44$
: (a) streamwise component
$A_D=0.44$
: (a) streamwise component $u_x^\prime / |u_x^\prime |_{\textrm{max}}$
and (b) transverse component
$u_x^\prime / |u_x^\prime |_{\textrm{max}}$
and (b) transverse component $u_y^\prime / |u_y^\prime |_{\textrm{max}}$
.
$u_y^\prime / |u_y^\prime |_{\textrm{max}}$
.
Further insight is obtained via DMD of the velocity perturbation field, yielding the eigenspectra shown in figure 14. The continuous-time spectrum (figure 14
a) exhibits a conjugate pair of unstable eigenvalues with real part $\lambda _r = 0.013\,\rm {rad\,s^{-1}}$
and imaginary part
$\lambda _r = 0.013\,\rm {rad\,s^{-1}}$
and imaginary part $\lambda _i = \pm 0.76\,\rm {rad\,s^{-1}}$
, confirming exponential growth and temporal modulation. These map to discrete-time eigenvalues
$\lambda _i = \pm 0.76\,\rm {rad\,s^{-1}}$
, confirming exponential growth and temporal modulation. These map to discrete-time eigenvalues $\mu _j = -0.81 \pm 0.66i$
(figure 14
b), which lie just outside the unit circle (
$\mu _j = -0.81 \pm 0.66i$
(figure 14
b), which lie just outside the unit circle ( $|\mu _j| = 1.04$
), corroborating the marginal instability predicted by the Floquet analysis. The corresponding DMD frequency
$|\mu _j| = 1.04$
), corroborating the marginal instability predicted by the Floquet analysis. The corresponding DMD frequency $f_{{DMD}} = \lambda _i / 2\pi \approx 0.121$
Hz does not match a rational subharmonic of the imposed oscillation frequency
$f_{{DMD}} = \lambda _i / 2\pi \approx 0.121$
Hz does not match a rational subharmonic of the imposed oscillation frequency $f_d$
, and thus, indicates the onset of quasiperiodicity via a Neimark–Sacker bifurcation. Moreover, the negative real part of
$f_d$
, and thus, indicates the onset of quasiperiodicity via a Neimark–Sacker bifurcation. Moreover, the negative real part of $\mu _j$
implies a phase shift of
$\mu _j$
implies a phase shift of $\pi$
between cycles, consistent with a phase-inverting antisymmetric structure with perturbations alternating in sign between successive forcing cycles. This behaviour is consistent with previous studies of symmetry-breaking bifurcations in oscillatory wakes.
$\pi$
between cycles, consistent with a phase-inverting antisymmetric structure with perturbations alternating in sign between successive forcing cycles. This behaviour is consistent with previous studies of symmetry-breaking bifurcations in oscillatory wakes.

Figure 14. Eigenspectra obtained from DMD for the homogeneous case ( $ \textit{Fr} = \infty$
,
$ \textit{Fr} = \infty$
, $A_D = 0.44$
), as described in § 2.3. (a) Continuous-time eigenvalues
$A_D = 0.44$
), as described in § 2.3. (a) Continuous-time eigenvalues $\lambda _j = \ln (\mu _j)/\Delta t$
plotted in the complex plane with real (
$\lambda _j = \ln (\mu _j)/\Delta t$
plotted in the complex plane with real ( $\lambda _r$
) and imaginary (
$\lambda _r$
) and imaginary ( $\lambda _i$
) components. The vertical line at
$\lambda _i$
) components. The vertical line at $\lambda _r = 0$
separates stable (light blue,
$\lambda _r = 0$
separates stable (light blue, $\lambda _r \lt 0$
) and unstable (light pink,
$\lambda _r \lt 0$
) and unstable (light pink, $\lambda _r {\gt} 0$
) regions. (b) Discrete-time eigenvalues
$\lambda _r {\gt} 0$
) regions. (b) Discrete-time eigenvalues $\mu _j$
in the complex plane with real (
$\mu _j$
in the complex plane with real ( $\mu _r$
) and imaginary (
$\mu _r$
) and imaginary ( $\mu _i$
) parts. The dashed unit circle marks the stability boundary: modes outside are unstable, inside are stable and on the circle are neutrally stable. The dominant mode is indicated with a
$\mu _i$
) parts. The dashed unit circle marks the stability boundary: modes outside are unstable, inside are stable and on the circle are neutrally stable. The dominant mode is indicated with a $\circ$
in both panels.
$\circ$
in both panels.
In summary, the transition from a symmetric to an asymmetric wake in homogeneous flow is governed by the linear amplification of a far-wake sinuous mode, which arises through a secondary instability of the time-periodic base flow. The bifurcation occurs at a well-defined critical amplitude and is associated with the emergence of a non-harmonically locked temporal frequency and antisymmetric spatial structure.
5.2. Stratified flow: critical oscillation amplitude at
$ \textit{Fr}=1$

To assess the role of buoyancy in the stability of the oscillatory wake, we set the Froude number to $ \textit{Fr} = 1$
and systematically vary the oscillation amplitude
$ \textit{Fr} = 1$
and systematically vary the oscillation amplitude $A_D$
. As shown in the first column of figure 7, the wake asymmetry arises only within a bounded interval of amplitudes, in contrast to the single critical threshold found in homogeneous flows. The corresponding variation of the Floquet multiplier
$A_D$
. As shown in the first column of figure 7, the wake asymmetry arises only within a bounded interval of amplitudes, in contrast to the single critical threshold found in homogeneous flows. The corresponding variation of the Floquet multiplier $|\bar {\mu }|$
with
$|\bar {\mu }|$
with $A_D$
is presented in figure 15.
$A_D$
is presented in figure 15.

Figure 15. Floquet multiplier $|\bar {\mu }|$
as a function of oscillation amplitude
$|\bar {\mu }|$
as a function of oscillation amplitude $A_D$
for stratified flow at
$A_D$
for stratified flow at $ \textit{Fr} = 1$
. (a) Low-amplitude range
$ \textit{Fr} = 1$
. (a) Low-amplitude range $0.20$
–
$0.20$
– $0.30$
, where the linear fit (dashed) extrapolates to the critical amplitude
$0.30$
, where the linear fit (dashed) extrapolates to the critical amplitude $A_D = 0.246$
; (b) high-amplitude range
$A_D = 0.246$
; (b) high-amplitude range $0.50$
–
$0.50$
– $0.60$
, where the linear fit extrapolates to the critical amplitude
$0.60$
, where the linear fit extrapolates to the critical amplitude $A_D = 0.560$
.
$A_D = 0.560$
.
We first examine the upper amplitude range. Figure 15(b) shows that, compared with the homogeneous case ( $A_D^{{crit}} \approx 0.455$
, see figure 11), the wake restabilises to a symmetric state at the higher amplitude of
$A_D^{{crit}} \approx 0.455$
, see figure 11), the wake restabilises to a symmetric state at the higher amplitude of $A_D=0.560$
. This indicates that stratification weakens the symmetry-restoring effect of oscillatory forcing. At the lower end of the amplitude range, however, a different behaviour emerges: when the oscillation amplitude decreases below
$A_D=0.560$
. This indicates that stratification weakens the symmetry-restoring effect of oscillatory forcing. At the lower end of the amplitude range, however, a different behaviour emerges: when the oscillation amplitude decreases below $A_D = 0.246$
, the wake also regains symmetry, as shown in figure 15(a). This stabilisation is a hallmark of stratified flows, where buoyancy acts as a restoring force that damps transverse motions and suppresses asymmetry.
$A_D = 0.246$
, the wake also regains symmetry, as shown in figure 15(a). This stabilisation is a hallmark of stratified flows, where buoyancy acts as a restoring force that damps transverse motions and suppresses asymmetry.
The appearance of two distinct stabilisation thresholds, one at low amplitude and another at high amplitude, highlights the subtle interplay between oscillatory forcing and buoyancy. This dual behaviour renders the symmetry-breaking transition at low Froude numbers particularly rich and fundamentally different from that in homogeneous wakes.
Figure 16 shows the vorticity fields from full-domain numerical simulations at amplitudes just below, at and above the predicted threshold. At $A_D = 0.24$
and
$A_D = 0.24$
and $0.246$
, the wake retains symmetry, and the vortex shedding occurs in synchrony with the imposed oscillation (figure 16
a,b). However, at
$0.246$
, the wake retains symmetry, and the vortex shedding occurs in synchrony with the imposed oscillation (figure 16
a,b). However, at $A_D = 0.25$
, the antisymmetric vortex shedding is initiated near the cylinder, as seen in figure 16(c).
$A_D = 0.25$
, the antisymmetric vortex shedding is initiated near the cylinder, as seen in figure 16(c).

Figure 16. Normalised vorticity fields, $\omega _z D / U_\infty$
, from the full-domain numerical simulation for stratified flow at
$\omega _z D / U_\infty$
, from the full-domain numerical simulation for stratified flow at $ \textit{Fr} = 1$
: (a)
$ \textit{Fr} = 1$
: (a) $A_D = 0.24$
(subcritical), (b)
$A_D = 0.24$
(subcritical), (b) $A_D = 0.246$
(critical) and (c)
$A_D = 0.246$
(critical) and (c) $A_D = 0.25$
(supercritical).
$A_D = 0.25$
(supercritical).
The temporal dynamics of the hydrodynamic forces are shown in figure 17. The lift coefficient $C_L$
oscillates periodically with a finite amplitude (figure 17
a), consistent with the antisymmetric shedding observed in the wake. The power spectral density of
$C_L$
oscillates periodically with a finite amplitude (figure 17
a), consistent with the antisymmetric shedding observed in the wake. The power spectral density of $C_L$
(figure 17
b) features a dominant subharmonic peak at
$C_L$
(figure 17
b) features a dominant subharmonic peak at $f_s/f_d = 0.5$
, characteristic of the
$f_s/f_d = 0.5$
, characteristic of the $P_2$
mode. The corresponding
$P_2$
mode. The corresponding $C_D$
–
$C_D$
– $C_L$
phase portrait forms a nearly closed loop (figure 17
c), indicating coherent periodic dynamics locked to a subharmonic of the driving frequency.
$C_L$
phase portrait forms a nearly closed loop (figure 17
c), indicating coherent periodic dynamics locked to a subharmonic of the driving frequency.

Figure 17. For $ \textit{Fr} = 1$
and
$ \textit{Fr} = 1$
and $A_D = 0.25$
: (a) time series of
$A_D = 0.25$
: (a) time series of $C_D$
and
$C_D$
and $C_L$
, (b) power spectra of
$C_L$
, (b) power spectra of $C_L$
, and (c) phase portrait of
$C_L$
, and (c) phase portrait of $C_D$
vs
$C_D$
vs $C_L$
.
$C_L$
.
The spatial structure of the dominant instability mode, shown in figure 18, offers further insight into the symmetry-breaking mechanism. The streamwise perturbation component $u_x^\prime$
exhibits a strong antisymmetric distribution about the midplane, with alternating high- and low-speed regions concentrated in the near wake (figure 18
a). The localisation of these features close to the body, in contrast to the more downstream-biased patterns seen in homogeneous flow (cf. Figure 13), is indicative of enhanced confinement due to stratification. The transverse perturbation
$u_x^\prime$
exhibits a strong antisymmetric distribution about the midplane, with alternating high- and low-speed regions concentrated in the near wake (figure 18
a). The localisation of these features close to the body, in contrast to the more downstream-biased patterns seen in homogeneous flow (cf. Figure 13), is indicative of enhanced confinement due to stratification. The transverse perturbation $u_y^\prime$
remains symmetric and weaker in magnitude, consistent with the nature of the base flow. For brevity, the corresponding fields at the upper transition (
$u_y^\prime$
remains symmetric and weaker in magnitude, consistent with the nature of the base flow. For brevity, the corresponding fields at the upper transition ( $A_D = 0.560$
) are not shown, as they exhibit qualitatively similar characteristics.
$A_D = 0.560$
) are not shown, as they exhibit qualitatively similar characteristics.

Figure 18. Contours of normalised velocity perturbation components for $ \textit{Fr}=1$
and
$ \textit{Fr}=1$
and $A_D=0.25$
: (a) streamwise component
$A_D=0.25$
: (a) streamwise component $u_x^\prime / |u_x^\prime |_{\textrm{max}}$
and (b) transverse component
$u_x^\prime / |u_x^\prime |_{\textrm{max}}$
and (b) transverse component $u_y^\prime / |u_y^\prime |_{\textrm{max}}$
.
$u_y^\prime / |u_y^\prime |_{\textrm{max}}$
.
The DMD analysis provides further insight into the dynamics underlying these transitions. For the low-amplitude case ( $A_D=0.25$
), the eigenspectrum shown in figure 19(a) reveals a dominant mode with the real part
$A_D=0.25$
), the eigenspectrum shown in figure 19(a) reveals a dominant mode with the real part $\lambda _r \approx 0.0135\,\rm {rad\,s^{-1}}$
and the imaginary part
$\lambda _r \approx 0.0135\,\rm {rad\,s^{-1}}$
and the imaginary part $\lambda _i \approx 0.97\,\rm {rad\,s^{-1}}$
, corresponding to a discrete-time eigenvalue of
$\lambda _i \approx 0.97\,\rm {rad\,s^{-1}}$
, corresponding to a discrete-time eigenvalue of $\mu _j \approx -1.05$
. Near the upper amplitude threshold (
$\mu _j \approx -1.05$
. Near the upper amplitude threshold ( $A_D=0.55$
), figure 19(b) identifies a dominant mode with
$A_D=0.55$
), figure 19(b) identifies a dominant mode with $\lambda _r \approx 0.0286\,\rm {rad\,s^{-1}}$
and
$\lambda _r \approx 0.0286\,\rm {rad\,s^{-1}}$
and $\lambda _i \approx 0.97\,\rm {rad\,s^{-1}}$
, and
$\lambda _i \approx 0.97\,\rm {rad\,s^{-1}}$
, and $\mu _j \approx -1.09$
. In both cases, the leading eigenvalue lies on the negative real axis with a magnitude slightly greater than unity, a spectral signature characteristic of a period-doubling bifurcation. This confirms that both the onset of asymmetry at intermediate amplitudes and the subsequent restabilisation at higher amplitudes proceed via the same bifurcation mechanism, highlighting the robustness of this nonlinear transition in stratified flows. Moreover, the relatively small real part of the eigenvalue near the lower threshold suggests a slow growth rate of instability, consistent with the observation that the wake remains predominantly symmetric until perturbations accumulate over multiple oscillation cycles.
$\mu _j \approx -1.09$
. In both cases, the leading eigenvalue lies on the negative real axis with a magnitude slightly greater than unity, a spectral signature characteristic of a period-doubling bifurcation. This confirms that both the onset of asymmetry at intermediate amplitudes and the subsequent restabilisation at higher amplitudes proceed via the same bifurcation mechanism, highlighting the robustness of this nonlinear transition in stratified flows. Moreover, the relatively small real part of the eigenvalue near the lower threshold suggests a slow growth rate of instability, consistent with the observation that the wake remains predominantly symmetric until perturbations accumulate over multiple oscillation cycles.

Figure 19. Dynamic mode decomposition eigenspectra for stratified flows at $ \textit{Fr} = 1$
. Results are shown for (a)
$ \textit{Fr} = 1$
. Results are shown for (a) $A_D = 0.25$
and (b)
$A_D = 0.25$
and (b) $A_D = 0.55$
. Plot details are as in figure 14.
$A_D = 0.55$
. Plot details are as in figure 14.
Unlike the homogeneous case, which exhibits a Neimark-Sacker bifurcation with complex-conjugate modes (see figure 14), the current spectrum contains a single unstable eigenvalue. This is a direct consequence of the logarithmic transformation: $\lambda _j = \ln (\mu _j)/{\Delta t}$
, where
$\lambda _j = \ln (\mu _j)/{\Delta t}$
, where $\mu _j \lt 0$
leads to
$\mu _j \lt 0$
leads to $\lambda _j = \ln (|\mu _j|)/{\Delta t} + i\pi /\Delta t$
. The resulting imaginary component is fixed by the phase inversion and gives rise to a unique subharmonic response, absent a conjugate pair. This reflects the asymmetric nature of period doubling and is corroborated by the wake structure, body force signatures and perturbation fields.
$\lambda _j = \ln (|\mu _j|)/{\Delta t} + i\pi /\Delta t$
. The resulting imaginary component is fixed by the phase inversion and gives rise to a unique subharmonic response, absent a conjugate pair. This reflects the asymmetric nature of period doubling and is corroborated by the wake structure, body force signatures and perturbation fields.
Together, these results show that stratification modifies both the receptivity and spatial growth of wake perturbations, thereby altering the conditions under which antisymmetric instabilities develop. Stratification changes the bifurcation structure, favouring a subharmonic (period-doubling) response and confining instability to a finite amplitude window, $0.246\lt A_D \lt 0.560$
. The appearance of a second critical amplitude at
$0.246\lt A_D \lt 0.560$
. The appearance of a second critical amplitude at $A_D=0.560$
demonstrates that the destabilisation influence is bounded; beyond this point, the wake restabilises into a symmetric state. This highlights the delicate interplay between internal wave dynamics, vortex shedding and symmetry breaking in stratified bluff-body flows. Compared with the homogeneous case, buoyancy exerts a dual effect: it stabilises the wake at low amplitudes while partially destabilising it at higher amplitudes. Specifically, buoyancy promotes symmetry at small
$A_D=0.560$
demonstrates that the destabilisation influence is bounded; beyond this point, the wake restabilises into a symmetric state. This highlights the delicate interplay between internal wave dynamics, vortex shedding and symmetry breaking in stratified bluff-body flows. Compared with the homogeneous case, buoyancy exerts a dual effect: it stabilises the wake at low amplitudes while partially destabilising it at higher amplitudes. Specifically, buoyancy promotes symmetry at small $A_D$
, while shifting the high-amplitude restabilisation threshold from
$A_D$
, while shifting the high-amplitude restabilisation threshold from $A_D \approx 0.455$
in the homogeneous case to
$A_D \approx 0.455$
in the homogeneous case to $A_D \approx 0.560$
at
$A_D \approx 0.560$
at $ \textit{Fr} = 1$
. This dual role underscores the complex and non-monotonic influence of stratification on wake stability.
$ \textit{Fr} = 1$
. This dual role underscores the complex and non-monotonic influence of stratification on wake stability.
5.3. Stratified flow: critical Froude number at
$A_D = 0.1$

To isolate the influence of stratification on wake stability, we fix the oscillation amplitude at $A_D = 0.1$
and vary the Froude number
$A_D = 0.1$
and vary the Froude number $ \textit{Fr}$
. As shown in figure 20, the leading Floquet multiplier
$ \textit{Fr}$
. As shown in figure 20, the leading Floquet multiplier $|\bar {\mu }|$
increases linearly with decreasing stratification strength (increasing
$|\bar {\mu }|$
increases linearly with decreasing stratification strength (increasing $ \textit{Fr}$
), after deviating from the marginal value
$ \textit{Fr}$
), after deviating from the marginal value $|\bar {\mu }| = 1$
. The critical
$|\bar {\mu }| = 1$
. The critical $ \textit{Fr}$
is determined as
$ \textit{Fr}$
is determined as $ \textit{Fr}=1.52$
, by linear extrapolation. This defines the threshold beyond which the symmetric base state becomes linearly unstable. It clearly demonstrates that increasing
$ \textit{Fr}=1.52$
, by linear extrapolation. This defines the threshold beyond which the symmetric base state becomes linearly unstable. It clearly demonstrates that increasing $ \textit{Fr}$
(that is, weakening stratification) promotes early symmetry breaking, reinforcing the role of buoyancy in delaying the onset of instability.
$ \textit{Fr}$
(that is, weakening stratification) promotes early symmetry breaking, reinforcing the role of buoyancy in delaying the onset of instability.

Figure 20. Floquet multiplier $|\bar {\mu }|$
versus Froude number
$|\bar {\mu }|$
versus Froude number $ \textit{Fr}$
for stratified flow at fixed oscillation amplitude
$ \textit{Fr}$
for stratified flow at fixed oscillation amplitude $A_D = 0.1$
. The dashed line indicates a linear fit, which extrapolates to a critical Froude number
$A_D = 0.1$
. The dashed line indicates a linear fit, which extrapolates to a critical Froude number $ \textit{Fr}=1.52$
.
$ \textit{Fr}=1.52$
.
Numerical simulations (figure 21) validate the critical Froude number predicted by the Floquet analysis. For $ \textit{Fr}=1.51$
and
$ \textit{Fr}=1.51$
and $ \textit{Fr}=1.52$
, the wake retains its mirror symmetry, with in-phase vortex shedding and vertically propagating internal waves (figure 21
a,b). Once
$ \textit{Fr}=1.52$
, the wake retains its mirror symmetry, with in-phase vortex shedding and vertically propagating internal waves (figure 21
a,b). Once $ \textit{Fr}$
exceeds the critical value, antisymmetric vortex shedding emerges in the near wake (figure 21
c), leading to a deflected vortex street and an oscillating lift force. This behaviour reflects a symmetry-breaking bifurcation modulated by the stratification intensity.
$ \textit{Fr}$
exceeds the critical value, antisymmetric vortex shedding emerges in the near wake (figure 21
c), leading to a deflected vortex street and an oscillating lift force. This behaviour reflects a symmetry-breaking bifurcation modulated by the stratification intensity.

Figure 21. Normalised vorticity fields, $\omega _z D / U_\infty$
, from the full-domain numerical simulation for stratified flow at
$\omega _z D / U_\infty$
, from the full-domain numerical simulation for stratified flow at $A_D = 0.1$
: (a)
$A_D = 0.1$
: (a) $ \textit{Fr} = 1.51$
, (b)
$ \textit{Fr} = 1.51$
, (b) $ \textit{Fr} = 1.52$
and (c)
$ \textit{Fr} = 1.52$
and (c) $ \textit{Fr} = 1.53$
.
$ \textit{Fr} = 1.53$
.
The velocity perturbation fields are shown in figure 22. The streamwise component $u_x^\prime$
exhibits a clear antisymmetry distribution about the midplane (see figure 22
a), with alternating positive and negative maxima concentrated in the near wake. This mode structure is indicative of a sinuous instability, and its proximity to the body suggests enhanced receptivity due to buoyancy-constrained shear layers. The transverse component
$u_x^\prime$
exhibits a clear antisymmetry distribution about the midplane (see figure 22
a), with alternating positive and negative maxima concentrated in the near wake. This mode structure is indicative of a sinuous instability, and its proximity to the body suggests enhanced receptivity due to buoyancy-constrained shear layers. The transverse component $u_y^\prime$
(see figure 22
b) remains symmetric, consistent with the base flow symmetry and periodic forcing. Stratification inhibits vertical motion, constraining perturbations to horizontal shear instabilities, with buoyancy-induced asymmetry triggering the onset of instability in the near wake.
$u_y^\prime$
(see figure 22
b) remains symmetric, consistent with the base flow symmetry and periodic forcing. Stratification inhibits vertical motion, constraining perturbations to horizontal shear instabilities, with buoyancy-induced asymmetry triggering the onset of instability in the near wake.

Figure 22. Contours of normalised velocity perturbation components for $A_D = 0.1$
and
$A_D = 0.1$
and $ \textit{Fr} = 1.53$
: (a) streamwise component
$ \textit{Fr} = 1.53$
: (a) streamwise component $u_x^\prime / |u_x^\prime |_{\textrm{max}}$
and (b) transverse component
$u_x^\prime / |u_x^\prime |_{\textrm{max}}$
and (b) transverse component $u_y^\prime / |u_y^\prime |_{\textrm{max}}$
.
$u_y^\prime / |u_y^\prime |_{\textrm{max}}$
.
Dynamic mode decomposition clarifies the unstable modes driving the wake dynamics, as illustrated in figure 23. The continuous-time eigenvalue spectrum (see figure 23
a) identifies a dominant mode with real and imaginary components ${Re}(\lambda _j) \approx 0.0352\,\rm {rad\,s^{-1}}$
and
${Re}(\lambda _j) \approx 0.0352\,\rm {rad\,s^{-1}}$
and ${Im}(\lambda _j) \approx 0.9451\,\rm {rad\,s^{-1}}$
, respectively. The positive real part confirms the exponential amplification of the perturbations. The corresponding discrete-time eigenvalue
${Im}(\lambda _j) \approx 0.9451\,\rm {rad\,s^{-1}}$
, respectively. The positive real part confirms the exponential amplification of the perturbations. The corresponding discrete-time eigenvalue $\mu _j \approx -1.1172 + 0.0889i$
(see figure 23
b) lies outside the unit circle (
$\mu _j \approx -1.1172 + 0.0889i$
(see figure 23
b) lies outside the unit circle ( $|\mu _j| \approx 1.12 {\gt} 1$
), which is computed as
$|\mu _j| \approx 1.12 {\gt} 1$
), which is computed as $f_{{DMD}} = \lambda _i / 2\pi \approx 0.1504\,\rm {Hz}$
and corresponds to
$f_{{DMD}} = \lambda _i / 2\pi \approx 0.1504\,\rm {Hz}$
and corresponds to $f_{{DMD}} / f_d = 0.48$
, which is close to a
$f_{{DMD}} / f_d = 0.48$
, which is close to a $1/2$
resonance. Unlike pure period-doubling bifurcations characterised by real negative eigenvalues and exact
$1/2$
resonance. Unlike pure period-doubling bifurcations characterised by real negative eigenvalues and exact $f_d/2$
locking, this mode arises from a pair of complex-conjugate discrete-time eigenvalues with a non-zero imaginary part, which is indicative of a Neimark–Sacker bifurcation. The observed frequency ratio near
$f_d/2$
locking, this mode arises from a pair of complex-conjugate discrete-time eigenvalues with a non-zero imaginary part, which is indicative of a Neimark–Sacker bifurcation. The observed frequency ratio near $0.5$
suggests that this bifurcation lies close to secondary resonance, where modulation occurs around a subharmonic base frequency. Dynamically, this reflects a quasiperiodic transition, where stratification modifies the phase evolution of the perturbation cycles without imposing strict period doubling. The proximity of the dominant eigenvalue pair to the negative real axis in the discrete-time plane (see figure 23
b) indicates a near-resonant Neimark–Sacker bifurcation, where the system exhibits a slow amplitude and phase modulation. This dynamic leads to quasiperiodic wake patterns with intermittent symmetry breaking, which is a characteristic of the wavy vortex regime.
$0.5$
suggests that this bifurcation lies close to secondary resonance, where modulation occurs around a subharmonic base frequency. Dynamically, this reflects a quasiperiodic transition, where stratification modifies the phase evolution of the perturbation cycles without imposing strict period doubling. The proximity of the dominant eigenvalue pair to the negative real axis in the discrete-time plane (see figure 23
b) indicates a near-resonant Neimark–Sacker bifurcation, where the system exhibits a slow amplitude and phase modulation. This dynamic leads to quasiperiodic wake patterns with intermittent symmetry breaking, which is a characteristic of the wavy vortex regime.

Figure 23. Eigenspectra from DMD for $A_D = 0.1$
and
$A_D = 0.1$
and $ \textit{Fr} = 1.53$
. Plot conventions follow figure 14.
$ \textit{Fr} = 1.53$
. Plot conventions follow figure 14.
These results indicate that the interplay between buoyancy and shear promotes an instability that smoothly transitions from symmetric shedding to a modulated antisymmetric state. Unlike sharp period-doubling bifurcations, this transition reflects a continuous unfolding of quasiperiodicity as $ \textit{Fr}$
increases. The emergence of a near-subharmonic Neimark–Sacker mode provides a dynamical pathway to more complex wake behaviours, including frequency modulation and intermittent symmetry breaking, often observed in stratified wake experiments and geophysical flows.
$ \textit{Fr}$
increases. The emergence of a near-subharmonic Neimark–Sacker mode provides a dynamical pathway to more complex wake behaviours, including frequency modulation and intermittent symmetry breaking, often observed in stratified wake experiments and geophysical flows.
6. Conclusions
In this study we investigate the wake dynamics and stability of a streamwise oscillating circular cylinder in a linearly stratified fluid flow using full-domain numerical simulations, Floquet stability analysis and DMD. By varying the oscillation amplitude ( $0.1 \leqslant A_{D} \leqslant 0.6$
) and stratification strength (
$0.1 \leqslant A_{D} \leqslant 0.6$
) and stratification strength ( $1 \leqslant Fr \leqslant \infty$
) at a fixed Reynolds number (
$1 \leqslant Fr \leqslant \infty$
) at a fixed Reynolds number ( $ \textit{Re}=175$
) and frequency ratio (
$ \textit{Re}=175$
) and frequency ratio ( $f_d/f_{St}=1.6$
), we uncover the interplay between oscillatory forcing and buoyancy in shaping wake symmetry and vortex shedding mechanisms.
$f_d/f_{St}=1.6$
), we uncover the interplay between oscillatory forcing and buoyancy in shaping wake symmetry and vortex shedding mechanisms.
In a homogeneous flow ( $ \textit{Fr} = \infty$
), the wake transitions from an asymmetric vortex street, characterised by subharmonic vortex shedding (
$ \textit{Fr} = \infty$
), the wake transitions from an asymmetric vortex street, characterised by subharmonic vortex shedding ( $P_2$
mode), at low oscillation amplitudes (
$P_2$
mode), at low oscillation amplitudes ( $0.1 \leqslant A_D \leqslant 0.3$
) to a symmetric state as
$0.1 \leqslant A_D \leqslant 0.3$
) to a symmetric state as $A_D$
increases. Floquet analysis identifies a critical amplitude of
$A_D$
increases. Floquet analysis identifies a critical amplitude of $A_D = 0.455$
, beyond which the symmetry is restored. For
$A_D = 0.455$
, beyond which the symmetry is restored. For $A_D \lt 0.455$
, antisymmetric shedding prevails, characterised by a subharmonic response, as confirmed by DMD, which reveals antisymmetric perturbation modes amplified in the far wake. The corresponding DMD eigenspectra display a conjugate pair of unstable eigenvalues with non-integer subharmonic frequencies, consistent with a Neimark–Sacker bifurcation.
$A_D \lt 0.455$
, antisymmetric shedding prevails, characterised by a subharmonic response, as confirmed by DMD, which reveals antisymmetric perturbation modes amplified in the far wake. The corresponding DMD eigenspectra display a conjugate pair of unstable eigenvalues with non-integer subharmonic frequencies, consistent with a Neimark–Sacker bifurcation.
In stratified flows, buoyancy modifies wake dynamics. At a low $ \textit{Fr}$
(
$ \textit{Fr}$
( $ \textit{Fr} = 1$
), stratification suppresses vortex shedding for small
$ \textit{Fr} = 1$
), stratification suppresses vortex shedding for small $A_D$
values (e.g. 0.1 and 0.2), resulting in symmetric wakes with internal gravity wave emissions. As
$A_D$
values (e.g. 0.1 and 0.2), resulting in symmetric wakes with internal gravity wave emissions. As $A_{D}$
increases, antisymmetric perturbations emerge in the wake, but only within a finite amplitude interval. Floquet analysis identifies the instability window as
$A_{D}$
increases, antisymmetric perturbations emerge in the wake, but only within a finite amplitude interval. Floquet analysis identifies the instability window as $0.246\lt A_{D}\lt 0.56$
, with the flow remaining symmetric for amplitudes below or above this range. Full-domain numerical simulation confirms that antisymmetric shedding emerges slightly above this value at
$0.246\lt A_{D}\lt 0.56$
, with the flow remaining symmetric for amplitudes below or above this range. Full-domain numerical simulation confirms that antisymmetric shedding emerges slightly above this value at $A_D = 0.25$
, manifesting as subharmonic lift oscillations and alternating streamwise perturbations near the cylinder. This is consistent with the period-doubling bifurcation identified by the DMD, in which the discrete-time eigenvalue is real and negative.
$A_D = 0.25$
, manifesting as subharmonic lift oscillations and alternating streamwise perturbations near the cylinder. This is consistent with the period-doubling bifurcation identified by the DMD, in which the discrete-time eigenvalue is real and negative.
At a fixed amplitude ( $A_D = 0.1$
), we vary the Froude number to assess the onset of instability due to weakened stratification. The Floquet multiplier indicates a critical Froude number of
$A_D = 0.1$
), we vary the Froude number to assess the onset of instability due to weakened stratification. The Floquet multiplier indicates a critical Froude number of $ \textit{Fr} = 1.52$
, beyond which the wake symmetry is lost. A full-domain numerical simulation at
$ \textit{Fr} = 1.52$
, beyond which the wake symmetry is lost. A full-domain numerical simulation at $ \textit{Fr} = 1.53$
reveals antisymmetric shedding and lateral deflections. The DMD spectrum identifies a pair of unstable complex-conjugate eigenvalues with a frequency ratio
$ \textit{Fr} = 1.53$
reveals antisymmetric shedding and lateral deflections. The DMD spectrum identifies a pair of unstable complex-conjugate eigenvalues with a frequency ratio $f_{\textit{DMD}} / f_d = 0.48$
, suggesting a near-resonant Neimark–Sacker bifurcation. Unlike pure period doubling, this transition reflects quasiperiodic dynamics in which buoyancy modulates both the phase and amplitude of perturbations, producing intermittent symmetry breaking characteristic of the wavy vortex regime.
$f_{\textit{DMD}} / f_d = 0.48$
, suggesting a near-resonant Neimark–Sacker bifurcation. Unlike pure period doubling, this transition reflects quasiperiodic dynamics in which buoyancy modulates both the phase and amplitude of perturbations, producing intermittent symmetry breaking characteristic of the wavy vortex regime.
Beyond stability transitions, stratification also affects net hydrodynamic forces. The cycle-averaged drag coefficients exhibit non-monotonic behaviour with respect to both $A_D$
and
$A_D$
and $ \textit{Fr}$
. The minimum drag is observed at intermediate stratification (
$ \textit{Fr}$
. The minimum drag is observed at intermediate stratification ( $ \textit{Fr} \approx 2$
), attributed to improved pressure recovery in the wake and suppressed asymmetry. At larger oscillation amplitudes, the drag is governed by a delicate balance between rear-surface suction and stagnation pressure, both of which are strongly influenced by stratification.
$ \textit{Fr} \approx 2$
), attributed to improved pressure recovery in the wake and suppressed asymmetry. At larger oscillation amplitudes, the drag is governed by a delicate balance between rear-surface suction and stagnation pressure, both of which are strongly influenced by stratification.
Overall, this study highlights the dual role of stratification: it acts as a stabilising influence at low oscillation amplitudes while facilitating instability at moderate forcing levels. The combined application of full-domain numerical simulation, Floquet theory and DMD yields a robust framework for predicting symmetry-breaking thresholds and characterising the associated wake structures. This framework can be readily extended to investigate broader parameter spaces, including other frequency ratios, Reynolds numbers and geometries. In future work, we aim to explore the onset of three-dimensional instabilities and the influence of more complex stratification profiles, with a view toward understanding stratified unsteady wakes in both natural and engineered systems.
Funding
This research has been supported by the Zhejiang Provincial Natural Science Foundation of China under Grant No. LZ25A020003 and the National Natural Science Foundation of China (Grant No. 92252102).
Declaration of interests
The authors declare that they have no conflict of interest.