

The brain is the most complex organ in the human body. It contains approximately 100 billion neurons, with each being connected by synapses to several thousands of other neurons. The brain controls physiological functions including, but not limited to, the sleep/wake cycle, arousal/attention, perception, mood, motivation, emotion, appetite/satiety, reward, learning/memory, speech, planning/executive processes and voluntary movements. The brain is a metabolically highly active organ that utilises a relatively large proportion of total nutrient and energy intake throughout the lifespan. Furthermore, the development and repair of neural tissue depends on the proper intake of essential nutrients, minerals and vitamins. Therefore, what we eat, or refrain from eating, may have an important impact on our cognitive ability and mental performance. There are two key areas in which diet plays an important role: supporting motor and cognitive neurodevelopment in children and preventing neurodegeneration and cognitive decline during ageing.
Neuronal and behavioural responses to nutrients are complex and their relationships to each other are often unclear. Nevertheless, there are several well-described routes by which diet may affect neurochemistry and brain function. Food and nutrient intake can modulate the availability of precursors or act as enzyme cofactors required for the synthesis and function of neurotransmitters, neurotrophic factors and psychoactive hormones. Dietary precursors participate in the formation and composition of neural membranes and synapses. Nutrients also affect cerebral blood flow (CBF), with a direct influence on energy and nutrient availability in the brain(Reference Gomez-Pinilla1). Some of the nutritional effects on brain function (e.g. changes related to cell signalling and energy supply) may be short lasting. For example, acute tryptophan depletion in women vulnerable to depressive symptoms has been shown to provoke a short-term relapse of clinically significant depressive symptoms(Reference Smith, Fairburn and Cowen2). On the other hand, supplementation of nutrients might have long-term effects on brain structure and function. For example, nutrient enrichment in preterm infants can affect neurodevelopmental outcomes and brain structure years, and even decades, after a short-term intervention(Reference Isaacs, Morley and Lucas3). During the last few decades, the body of evidence from both observational and intervention human studies investigating the modulation of brain function by nutrients has grown dramatically. We now have a solid basis for translation into hypothesis-driven intervention studies and, ultimately, into evidence-based practices.
The magnitude of the economic and societal burden related to brain dysfunction is becoming increasingly evident. A recent study by the European College of Neuropsychopharmacology has indicated that 38·2 % of the European Union population, or 168 million people, suffer from a mental disorder(Reference Wittchen, Jacobi and Rehm4). This was estimated to cost €798 billion in 2010(Reference Olesen, Gustavsson and Svensson5). The potential of nutrition to reduce the burden of impaired brain function has been illustrated by many studies reporting links between either poor nutrient intake or nutrient enrichment and brain function across the lifespan, from (pre)term infants to the elderly, and in various neurodevelopmental, neurological and psychiatric conditions(Reference Gomez-Pinilla1, Reference Fotuhi, Mohassel and Yaffe6–Reference Gesch, Hammond and Hampson10).
Despite great progress in the fields of neuroscience, neuropsychology and nutritional science in terms of understanding the relationships between brain function and nutrition, research assessing these long-term relationships, as well as human data regarding mechanisms of action, is hindered by practical feasibility or methodological constraints. In 2009, the Nutrition and Mental Performance Task Force of the European Branch of the International Life Sciences Institute (ILSI Europe) convened a workshop to evaluate the methodological challenges and opportunities related to studying the long-term effects of nutrition(Reference Schmitt11). One recommendation from the workshop was to include brain imaging biomarkers as secondary endpoints in future intervention studies to produce study outcomes that supplement clinical or cognitive measures. Brain imaging biomarkers might improve our understanding of mechanisms of action and may potentially provide more sensitive measures that predict long-term effects earlier, thereby shortening the required trial duration(Reference de Jager and Kovatcheva12).
The aim of the present review was to provide a comprehensive overview of brain imaging techniques and the existing knowledge regarding the quality of imaging markers commonly used to assess brain structure and functions in human subjects. Specifically, we describe MRI and its multimodal assessment capacity, electroencephalography (EEG)/magnetoencephalography (MEG), near-IR spectroscopy (NIRS), positron emission tomography (PET) and single-photon emission computerised tomography (SPECT) from the perspective of how they could have a place in nutritional intervention studies (Table 1). We have included a description of the aforementioned brain imaging techniques, the biological relevance of their measures, their practical feasibility, their sensitivity to age and in specific populations, and their recommended use in nutritional intervention studies. Such descriptions are expected to contribute to the identification of an appropriate set of relevant imaging measures with two main features. On the one hand, these techniques may allow the measurement of neurostructural, neurophysiological and neurochemical changes occurring over the lifespan and after nutritional interventions. On the other hand, they may elucidate the specific biological processes implicated in the changes in brain function during development and ageing and the means by which a nutritional intervention can modulate these changes. Of particular note, we have focused on the general population, especially those age groups that may be particularly sensitive to factors influential in periods of rapid brain development or to deteriorating brain function (e.g. infants and elderly).
Summary of the key features of imaging measurements
fMRI, functional MRI; MRS, magnetic resonance spectroscopy; 3D, three dimensional; DTI, diffusion tensor imaging; ADC, apparent diffusion coefficient; FA, fractional anisotropy; H-MRS, proton spectroscopy; P-MRS, phosphorus spectroscopy; EEG/MEG, electroencephalography/magnetoencephalography; ERP, event-related potential; ERF, event-related magnetic field; NIRS, near-IR spectroscopy; FDG, [18F]fluoro-2-deoxy-d-glucose; PET, positron emission tomography; 5-HT2A, 5-hydroxytryptamine receptor 2A; rCBF, regional cerebral blood flow; SPECT, single-photon emission computerised tomography; HMPAO, [99mTc]hexamethylpropyleneamine; ECD, [99mTc]ethyl cysteinate dimer; IMP, [123I]isopropyl iodoamphetamine.
* Lowest possible age depends on the paradigm. In principle, MRI can be used with all age groups, but it may be practically difficult. The subject may need training.
MRI: brain structural, metabolic and functional assessments for nutritional research
MRI techniques as a multimodal approach
The advent of non-invasive MRI was a breakthrough to assess the human brain in vivo, greatly expanding the possibilities of investigating brain structure and function. It was originally developed as a medical imaging tool to provide detailed scans of the structures of internal organs, using magnetic fields and radiofrequency pulses. The MRI scanner uses a very powerful magnetic field to align atoms in the body. Radiofrequency pulses are then applied to disturb this alignment; as the nuclei return to alignment, they rotate and produce an electrical field that the scanner detects and uses to produce images. In the case of the brain, MRI scans provide detailed pictures of grey and white matter, vessels, cerebrospinal fluid and bone. Clinically, neuroradiologists usually interpret scans by visual inspection; however, in order to reveal more subtle features, other techniques that depend on post-acquisition processing of the scans have been developed. The combination of MRI as a multimodal tool with post-acquisition processing techniques provides a powerful technology for the study of the effects of nutrition on brain development and ageing. Within the broad divisions of macro- and microstructural, metabolic and functional imaging, a variety of techniques have emerged from magnetic resonance (MR), leading to a multimodal assessment of the brain.
For the examination of overall brain structure, a three-dimensional anatomical dataset of T1- and T2-weighted images, basic scans that provide a good contrast between grey matter and white matter, is collected, allowing reconstruction of the brain in three planes. Diffusion-weighted imaging and diffusion tensor imaging (DTI) datasets provide measures of water diffusion properties within the tissue and determine the microstructural characteristics of white and grey matter. In addition, magnetic resonance spectroscopy (MRS) based on proton (1H-MRS) and 31P (31P-MRS) magnetic properties measures the levels of different metabolites in body tissues, and functional MRI (fMRI) can be used to reveal brain structures and processes associated with perception, thought and action in response to sensory stimuli. The neural activity of the brain is closely linked to changes in blood flow and blood oxygenation in the brain (known as haemodynamics). Additional details on these measurements are given in Table 1.
Costs of MRI may vary regionally but are relatively high, not only due to the scanning time (depending on the number of MR sequences needed) and the cost of the equipment, but also in terms of image post-processing and analysis.
MRI acquisition, post-processing and MRI-derived measures
In human subjects, MRI scans are most commonly obtained using a scanner with a magnetic field strength of 1·5 or 3 T. All studies begin with the acquisition of scans using an imaging protocol designed to provide the information best suited to the chosen method of analysis. In order to compare different groups of a clinical/research study, the image signal and its properties need further post-processing operations to gather useful, reliable and comparable data. Different types of data are provided by the different methods. Some of the most widely used protocols and their respective post-processing considerations are described in the following sections.
Structural MRI
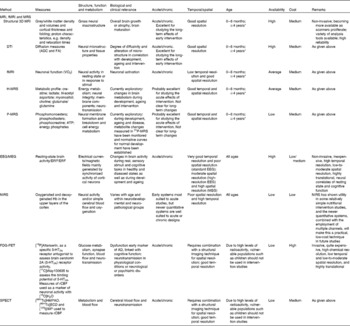
Morphometry and volumetrics refer to the measurement of physical form characteristics such as volumes of brain structures or thickness of cortices. Originally, these could only be measured manually by drawing about the perimeter of a structure on a series of T1–T2 conventional scans and then calculating the volume. Because it was time consuming and prone to error in some instances, its use was also restricted to structures that were clearly delineated (e.g. the hippocampus) rather than to those with less clear boundaries (e.g. some frontal lobe areas). Semi-automated and fully automated methods that label the neuroanatomical structures on the basis of probability information obtained from a training set of images that have been manually labelled have now become available(Reference Fischl, Salat and Busa13). The volumes of these structures (Fig. 2) are calculated and can then be used in statistical analyses. Cortical thickness can be estimated by means of an automated surface reconstruction scheme(Reference Dale, Fischl and Sereno14–Reference Dale and Sereno20), and scans from different time points or individuals can be compared at each vertex across the entire cortical mantle and may be related to other variables of interest. These techniques have been validated via histological(Reference Rosas, Liu and Hersch21) and manual measurements(Reference Kuperberg, Broome and McGuire22). The cortical surface can also be parcellated into a number of different regions of interest, for which information on surface area, thickness and volume can be estimated(Reference Desikan, Segonne and Fischl23).
1H-MRS and 31P-MRS at 1·5 T. (a) Normal typical spectrum of proton spectroscopy of grey matter and changes during brain development. (a1) Normal preterm infant born at 29 weeks of gestation (scan at 35 weeks), (a2) normal-term newborn, (a3) normal infant of 6 months and (a4) normal adult. (b) Normal typical spectrum of 31P spectroscopy of grey matter and changes during brain development. (b1) Normal preterm infant born at 29 weeks of gestation (scan at 35 weeks), (b2) normal-term newborn, (b3) normal infant of 6 months and (b4) normal adult. Cho, choline; Cr, creatine; NAA, N-acetylaspartate; Lac, lactate; PME, phosphomonoesters; Pi, inorganic phosphates; PCr, phosphocreatine; PDE, phosphodiesters; NTP, nucleotide triphosphate. Reproduced from Robertson & Cox(Reference Robertson, Cox and Rutherford254).

Whole-brain segmentation of a T1-weighted scan as implemented in FreeSurfer (a brain imaging software package)(Reference Ashburner and Friston24). The segmentation is shown in (a) coronal, (b) horizontal and (c) sagittal views. Each image element (voxel) of the brain volume is labelled as belonging to different structures. For instance, the hippocampus is labelled in yellow.
Voxel-based morphometry (VBM)(Reference Ashburner and Friston24) was designed to investigate local differences in the distribution of grey and white matter in the brain. The scans are segmented into separate grey and white matter images and entered into the VBM analysis; for analytical purposes, the brain is divided into small cubic elements called voxels. Most commonly, groups of scans are compared on a voxel-by-voxel basis to determine where significant differences in the concentration, volume and/or density of grey or white matter occur between groups. Voxel-by-voxel correlations with other variables (e.g. behavioural) can also be determined. These analyses produce statistical parameter maps showing where differences between groups (if any) and significant relationships with other variables occur.
Sulcation and gyrification index analysis can be used to assess cortical folding in vivo and to define a sulcation index during development or disease. The analysis uses the white matter and cortical grey matter contrast intensity interface(Reference Dubois, Benders and Cachia25). A dramatic increase in the sulcation index, corresponding to brain maturation from an unfolded state to its gyrificated mature state near term, has been demonstrated between 26 and 36 weeks of gestation(Reference Dubois, Benders and Cachia25).
Diffusion-weighted imaging/DTI captures microstructural characteristics not apparent in standard anatomical images by utilising the restricted water diffusion in biological brain tissues. Depending on microscopic tissue characteristics (e.g. properties of cell membranes, tissue orientation and myelination), water diffusion will differ by degree and direction. In DTI, a first pulse introduced to the magnetic field determines the initial position of the protons carried by water, while a second pulse detects how far they have moved in space and in which specific direction(Reference Le26). In this way, we obtain a metric of water diffusion, sensitive to structural characteristics. The number of directions of diffusion measured varies from a minimum of 6 to >100.
Several DTI metrics can be applied. Fractional anisotropy (FA) is an intra-voxel index of the degree of diffusion anisotropy (i.e. directionality of diffusion). Several features contribute to FA, including myelin and axonal integrity(Reference Mori and Zhang27, Reference Wozniak and Lim28), and also complex structural features such as the degree of fibre crossing(Reference Douaud, Jbabdi and Behrens29). The constituents of FA are diffusion measured parallel/axial to, and perpendicular/radial to, the principal diffusion direction. In white matter, axial diffusion usually means diffusion along the length of the axon. Any neurobiological inference based on DTI measures must be made with caution, since multiple features influence the metrics(Reference Concha, Livy and Beaulieu30). However, some hypotheses may be made, depending on the group studied. For instance, to the extent that a nutrient facilitates myelin or axon membrane integrity, one might expect higher FA and lower diffusion measured perpendicular/radial in selected regions in a nutrient-facilitated group. Another commonly used metric is the mean diffusivity, reflecting the degree of diffusivity in any direction. This is an illustration of the tissue microstructure and water content.
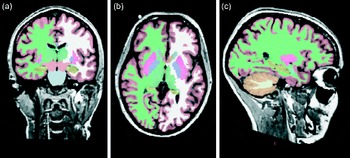
There are various ways of evaluating metrics and analysing DTI data. One can delineate tracts of interest or define regions of interest manually, or use automated tools, to conduct voxel-wise statistical analyses of FA, diffusion measured perpendicular/radial, diffusion measured parallel/axial or mean diffusivity data. This can, for example, be done within a white matter skeleton containing only voxels common to groups of participants by using tract-based spatial statistics(Reference Smith, Jenkinson and Johansen-Berg31), part of the FMRIB Software Library(Reference Smith, Jenkinson and Woolrich32) (see Fig. 3 for an example).
From diffusion tensor imaging, measures of fractional anisotropy (FA) can be derived. Areas of higher diffusion directionality, or FA, are shown in a lighter colour (a) coronally and (b) horizontally. The white matter skeleton created by tract-based spatial statistics as implemented in FSL(Reference Chang, Jiang and Ernst41) contains only tract voxels common to all participants in a study and is shown here in green imposed on the FA volume. To the right (c), the direction of diffusion in different parts of the brain is shown colour coded. Red colour denotes diffusion along the medial–lateral axis (such as in the corpus callosum connecting the hemispheres). Green colour denotes diffusion along the posterior–anterior axis, while blue colour denotes diffusion along the inferior–superior axis.
MRS proton spectroscopy and phosphorus spectroscopy
The MRS signal produces a spectrum of resonances that correspond to different molecular arrangements of the 1H-proton and 31P being excited. 1H-MRS and 31P-MRS measure different metabolites that are respectively linked to specific brain composition and metabolism (Table 1). Because 31P is in lower concentrations in the body than 1H, it has a lower signal:noise ratio and therefore a higher magnetic field is required to achieve a better spectral resolution (Fig. 1; Tables 2 and 3). Furthermore, these techniques do require specific hardware. It must be noted that with an increasing magnetic field, spectral resolution is increased, allowing more precise measurements of the targeted metabolites. Both can be used to follow normal metabolic development and to detect disorder-linked metabolic change. 1H-MRS allows neural measurements of absolute metabolite concentrations during development, such as choline, creatine, glutamine/glutamate, lactate, myoinositol, macromolecular contributions, N-acetylaspartate (NAA) and taurine(Reference Huppi, Posse and Lazeyras33–Reference Ross and Bluml35). As gestational age increases, significant increases in NAA, glutamate and glutamine, creatine, taurine levels, with decreases in lactate, myoinositol and phosphoethanolamine levels, have been shown(Reference Huppi, Posse and Lazeyras33, Reference Huppi, Fusch and Boesch34, Reference Kreis, Hofmann and Kuhlmann36). Regional differences are also present: subcortical areas such as the thalamus showed early high levels of total creatine and NAA, but, by contrast, periventricular white matter showed very little NAA and lactate resonance(Reference Huppi, Posse and Lazeyras33, Reference Huppi, Fusch and Boesch34, Reference Kreis, Hofmann and Kuhlmann36). In the adult and ageing normal brain, MRS has also been able to characterise MRS-measured metabolite changes with age and region. Mainly, NAA, NAA:choline and NAA:creatine ratios are decreased in the hippocampus as well as in the semioval, temporal and frontal regions in ageing brains(Reference Angelie, Bonmartin and Boudraa37, Reference Brooks, Roberts and Kemp38). Furthermore, altered neuronal and glial mitochondrial functions are also present in ageing brains and could be in part linked to brain function decline(Reference Boumezbeur, Mason and de Graaf39, Reference Forester, Berlow and Harper40). Glutamate, an important neurotransmitter, is reduced in the grey matter of the ageing brain(Reference Chang, Jiang and Ernst41, Reference Kaiser42). White matter tracts also show altered NAA:choline and NAA:creatine ratios for the corpus callosum and splenium(Reference Bozgeyik, Burakgazi and Sen43, Reference Charlton, McIntyre and Howe44). These changes in grey and white matter metabolism appear to be linked to the reduction of cognition seen in normal ageing(Reference Charlton, McIntyre and Howe44–Reference Harada, Miyoshi and Otsuka46).
Absolute concentrations of brain metabolites in individuals of different age groups in mmol/kg brain tissue and significance tests for differences found* (Mean values with their standard errors)

ROI, region of interest; GA, gestational age; pn, postnatal age; NAA, N-acetylaspartate; Cr, creatine; Cho, choline.
* Reproduced from Ross & Bluml(Reference Ross and Bluml35).
Concentrations of 31P metabolites in healthy brains of human neonates, infants and adults† (Mean values and standard deviations)

PME, phosphomonoesters; Pi, inorganic phosphates; PDE, phosphodiesters; PCr, phosphocreatine.
Mean values are significantly different: ** P< 0·01, *** P< 0·001.
† Reproduced from Buchli et al. (Reference Buchli, Martin and Boesiger255).
31P-MRS specifically evaluates energy and phospholipid metabolism by using phosphocreatine, ATP, inorganic phosphate, phosphocholine and phosphoethanolamine measurements(Reference Ross and Bluml35). In addition, the chemical shift of inorganic phosphate is dependent on intracellular pH, allowing tissue pH calculation. During development, ageing and disease metabolite changes measured in 31P-MRS have been monitored and normative curves for normal development have been established(Reference Ross and Bluml35, Reference van der Knaap, van der Grond and van Rijen47–Reference Pettegrew, Keshavan and Minshew51).
Functional MRI
Active neurons consume energy for the duration of ongoing processing, resulting in a higher oxygen need and a higher blood flow. This haemodynamic response rises to a peak over 4–5 s, after which it normalises, leading to local changes in the relative concentration of oxygenated Hb (oxy-Hb) and deoxygenated Hb (deoxy-Hb) and changes in local cerebral blood volume in addition to this change in local CBF(Reference Laureys, Boly, Tononi, Laureys and Tononi52–Reference Roy and Sherrington54). fMRI measures these changes in blood oxygen concentration by recording changes in blood oxygen level-dependent (BOLD) signal. Oxy-Hb is a diamagnetic molecule and becomes paramagnetic when deoxygenated. The MR signal of blood is therefore slightly different depending on the level of oxygenation in the local capillaries. These differential signals can be detected using an appropriate MR pulse sequence (i.e. the BOLD signal mentioned previously). Higher BOLD signal intensities arise from decreases in the concentration of deoxy-Hb. These changes can be either positive or negative depending on the relative changes in both CBF and VO2. Increases in CBF that exceed changes in VO2 will lead to an increased BOLD signal. In contrast, decreases in CBF that outstrip changes in VO2 will cause decreased BOLD signal intensity(Reference Ogawa, Lee and Nayak55).
Eligibility for an MRI examination
MRI is a non-invasive technique involving the use of magnetic fields and radiofrequency pulses and, hence, no ionising radiation. No clinical side effects have been noted after more than two decades of relatively broad use. As well as making its use in research viable, this also means that scanning can be repeated several times with the same persons, which is important in studying the effects of nutrition on development, ageing or the prevention of disease-related changes.
Although it can be widely used in the population, there are some contraindications to scanning. People with ferro-magnetic implants are often unsuitable for scanning as the images would be distorted, and pacemakers will be disturbed by the magnetic field, making scanning not an option for some groups. Dental braces in children may also result in distorted images. Furthermore, persons with claustrophobia or fear of narrow spaces often do not tolerate the typically rather narrow space in the scanner. The ability of a person to avoid moving in the scanner is critical for any type of MR image to be obtained.
An important consideration when using imaging in infants and children is the age at scan acquisition. Until a few months after birth, MRI scanning is fairly accessible and can be performed under natural sleep after feeding. In naturally sleeping infants, fMRI can be performed and resting-state activity, as well as response to light, auditive and smell stimulation, can be measured. For older children, the sequences used in structural imaging and DTI can be made quite short, often less than 10 min. However, this may still be a long time for young children to keep still and the option of sedation is only warranted in the case of clinical scans. The success rate may increase in school-aged children. Some centres use pre-scan training in a mocked-up scanner to reduce the age limit of viability. To enhance cooperation, audio books/music can be played at the time of scan, and if the equipment allows, cartoons may be projected or viewed in special goggles. For fMRI studies, stimuli–response paradigms have to be adapted to the age of the children and their ability to understand the task. Using MRI in the early years of childhood is difficult but important due to the fact that great brain development is ongoing during childhood and MRI could thus provide crucial information on the effects of nutrition during brain development. The plasticity of the brain during this period indicates that it may be a likely time for nutrition to influence structural changes. Studies that have followed up subjects after early dietary intervention, however, have shown that the effects tend to persist over time(Reference Isaacs, Morley and Lucas3, Reference Wharton, Morley and Isaacs56); thus, brain scans obtained later in childhood may still be informative.
From a broader point of view, due to reasons described above, neuroimaging studies should include uniform samples with regard to the age or, if subjects who vary widely in age are included, age at the scan should be used as a covariate in analyses. This is particularly true in childhood, in which the development occurs over a relatively short time span.
Use of MRI in nutritional studies
Past nutritional studies that have used MRI techniques
If we discount studies in clinical populations, the number of nutritional intervention studies using imaging measures is minimal. This is not surprising since it has been unusual in the past for research centres to collect both the nutritional and MRI data necessary to conduct these studies, but a few reports have started to appear. Nutritional studies tend to concentrate on the two extremes of the age spectrum, infancy and old age, periods in life with relatively large changes in brain morphology and functionality. There is, however, a difference in emphasis between the two. While studies in children have investigated whether different nutrition regimens can enhance brain development, studies in adults have tended to focus on whether diet and nutrients may act to protect the brain from age-associated atrophy or disease. It is important to keep in mind that structural changes may not correspond directly to changes in function and that such structural changes may bias the results. Grey matter atrophy and sulcal expansion in older adults may be responsible for a great anatomical variability between the brains of younger and older adults and within a single random sample of older individuals(Reference Raz, Lindenberger and Rodrigue57, Reference Raz, Rodrigue and Haacke58). Therefore, it is important to define structure–function relationships. Some examples of studies are presented below.
MRI studies of altered nutrition during fetal life: effects on the brain during intrauterine growth retardation
Three-dimensional MRI has been used to evaluate the effects of intrauterine growth retardation (IUGR) on brain development. IUGR can be considered as inadequate nutritional supply during pregnancy. Preterm IUGR infants show altered brain development with reduced cortical grey volumes(Reference Tolsa, Zimine and Warfield59), hippocampal volumes(Reference Lodygensky, Seghier and Warfield60) and sulcation index(Reference Dubois, Benders and Borradori-Tolsa61) compared with normally grown preterm infants. These changes are correlated with altered neurodevelopmental scores. Thus, early cortical development seems to be modified by altered intrauterine nutritional environment(Reference Dubois, Benders and Borradori-Tolsa61).
DTI has also been used to assess the effects of IUGR on the microstructural development of the brain. Results have shown a higher apparent diffusion coefficient value in the internal capsule of IUGR infants at birth compared with that of non-IUGR infants. This change persists at term, indicating reduced maturation in this area, which represents a major white matter fibre tract that normally myelinates between 34 and 40 weeks of gestational age. Further results have indicated reduced relative anisotropy with a less well-developed fibre tract system at birth in the corpus callosum, the main interhemispheric connection system(Reference Huppi, Murphy and Maier62). VBM has verified these findings by revealing similar regions of microstructural changes in IUGR preterm infants when compared with control groups(63, Reference Sizonenko, Borradori-Tolsa and Bauthay64). 1H-MRS has shown altered metabolites in grey and white matter in preterm infants with IUGR(Reference Sizonenko, Borradori-Tolsa and Bauthay64, Reference Borradori65). In grey matter, NAA and myoinositol levels were reduced in the compromised group and energy supply alteration with increased creatine levels could also be measured. In white matter, similar alterations were present in infants with IUGR; in addition, an increased level of lactate was found, indicating altered metabolism, possibly due to astrocyte metabolism changes.
MRI studies of nutritional effects on the brain in children
Very few reports exist, but a study by Taki et al. (Reference Taki, Hashizume and Sassa66) has illustrated how MRI could be used. The authors divided 290 healthy 11-year-old children into three groups, depending on their breakfast staple (rice, bread or both), and used VBM to look for differences in grey and white matter and also compared intelligence quotient (IQ) measures among the groups, incorporating covariates such as socio-economic class and age. Differences in both overall and regional grey and white matter volumes among the groups have been reported as well as a significant advantage for the rice group in the Perceptual Organisation Index Score of the IQ test. The glycaemic index has been suggested as a possible explanatory mechanism.
The best evidence for nutritional effects on the brain would be to obtain MR images as an outcome measure for children who had taken part in an earlier randomised controlled trial of a nutritional intervention. For instance, two studies have reported structural and cognitive outcomes at adolescence in a subgroup of a cohort of preterm infants (all neurologically normal) who had taken part in a randomised feeding trial perinatally(Reference Lucas, Gore and Cole67). In one study, a high-nutrient diet was associated with larger volumes of the caudate nuclei and a higher verbal IQ, but only in boys(Reference Isaacs, Gadian and Sabatini68). In a later report, the percentage of maternal breast milk in the infant diet was associated with a greater white matter volume and a higher verbal IQ; again, the effects were stronger in boys(Reference Isaacs, Fischl and Quinn69).
VBM has been used to demonstrate relationships between regional brain volumes and IQ(Reference Shaw, Greenstein and Lerch70) as well as more specific cognitive functions such as reading(Reference Steinbrink, Vogt and Kastrup71), calculation(Reference Rykhlevskaia, Uddin and Kondos72) and executive function(Reference Blakemore and Choudhury73). Likewise, other techniques, both whole-brain segmentation and surface reconstruction, yielding volumetric and cortical thickness measures, have also shown sensitivity to differences in cognitive and behavioural functions. These techniques could therefore be used to explore whether a nutritional intervention affects such outcomes.
MRI studies of nutritional effects on the brain in adults
There are multiple mechanisms by which nutrients or supplements may serve to protect the ageing brain(Reference Gu, Luchsinger and Stern74, Reference Scarmeas, Luchsinger and Stern75), including by lowering cerebrovascular disease, inflammation and/or oxidation. A recent, large study of elderly subjects has shown associations between image measures of brain health and cognitive function, on the one hand, and plasma biomarkers of vitamin and fatty acid status and trans-fat, on the other hand(Reference Bowman, Silbert and Howieson76).
There is much literature showing that elevated homocysteine levels are negatively related to cognitive function in ageing(Reference Feng, Ng and Chuah77–Reference Elias, Sullivan and D'Agostino80) with good indications from MRI studies that the cognitive effects may be mediated through brain atrophy, hyperintensities and/or subclinical infarcts(Reference Seshadri, Wolf and Beiser79, Reference Chee, Chen and Zheng81–Reference Sachdev, Parslow and Salonikas83). Still, it may be that elevated homocysteine levels are not a causal mechanism for brain atrophy and cognitive deterioration, but rather a by-product. However, this possibility has recently been weakened by a large well-controlled intervention study(Reference Smith, Smith and de Jager84). The study was a randomised double-blind controlled trial using high-dose folic acid and B vitamins in persons aged >70 years and categorised as having mild cognitive impairment. MRI scans were performed at the start and end of the study after 2 years. The mean rate of brain atrophy per year was significantly lower in the treatment group than in the placebo group and the treatment response was related to baseline homocysteine levels. The greater rate of atrophy in the placebo group, primarily seen in the images as an enlargement of the ventricles, was associated with a lower final cognitive test score (Mini-Mental State Examination and Telephone Interview of Cognitive Status).
A recent study on long-chain PUFA (LC-PUFA) has shown that among older adults, dietary intake of fish with a higher EPA and DHA content was associated with a lower prevalence of subclinical infarcts and white matter abnormalities on MRI examinations(Reference Bowman, Silbert and Howieson76, Reference Virtanen, Siscovick and Longstreth85, Reference Quinn, Raman and Thomas86). This finding was extended by the observation that in middle-aged adults, DHA, but not EPA or α-linolenic acid, in serum, was associated with improved non-verbal reasoning, working memory and vocabulary(Reference Quinn, Raman and Thomas86).
Choline, a precursor of acetylcholine and phosphatidylcholine, is important for brain metabolism and is largely obtained from the diet. Cohen et al. (Reference Cohen, Renshaw and Stoll87) measured plasma and brain choline levels with 1H-MRS after a single choline supplement in young and aged healthy subjects. The results showed that despite a similar choline increase in plasma in both groups, the brain levels of choline measured by 1H-MRS were lower in the aged group, indicating a decrease in choline uptake into the brain with age(Reference Cohen, Renshaw and Stoll87). Given the role of choline in cholinergic neuronal function, the reduced uptake of choline may be involved in altered brain function in the elderly and in neurodegeneration. Similarly, in a study on healthy adults using 31P-MRS, administration of uridine appeared to increase brain membrane precursors (phosphomonoesters: phosphocholine and phosphoethanolamine)(Reference Agarwal, Sung and Jensen88). Furthermore, studies have shown altered membrane phospholipids and fatty acid metabolisms in psychiatric or epileptic diseases using 1H-MRS and31P-MRS(Reference Puri89, Reference Puri, Koepp and Holmes90). It has also been reported that citicoline improves frontal lobe bioenergetics and alters phospholipid membrane turnover. It may therefore help to mitigate cognitive declines associated with ageing by increasing energy reserves and utilisation, as well as increasing the amount of essential phospholipid membrane components needed to synthesise and maintain cell membranes(Reference Silveri, Dikan and Ross91). In psychotic adults, ethyl-EPA supplementation appears to improve symptoms in relation to an increase in brain glutathione levels and glutamate:glutamine ratio measured by 1H-MRS, which can be linked to improved antioxidative defence through astrocyte metabolism(Reference Berger, Wood and Wellard92).
In the last few years, fMRI has been used to investigate the mechanisms related to the physiological or pathological regulation of food intake, as well as the cognitive/affective processing of food-related stimuli(Reference van der Laan, de Ridder and Viergever93). These studies have identified a food-related functional recruitment in both sensory processing and emotion-related structures, including prefrontal, orbitofrontal temporal and cingulate regions, amygdala and insula. Nonetheless, few fMRI studies have tried to determine the role of nutrition in brain function. Recently, fMRI has been used to examine the effect of nutrition in young healthy volunteers who had a breakfast including various nutrients (i.e. food containing proteins, lipids, vitamins and minerals as well as carbohydrates) when compared with when they skipped breakfast or had only sugar for breakfast(Reference Akitsuki, Nakawaga and Sugiura94). When participants were performing memory and attention tasks, significantly higher brain activation was observed in the medial prefrontal areas, but only following the nutritionally balanced breakfast.
Methodological limitations and recommendations of relevance to intervention studies
Any effects of nutrition found by MRI studies will need to be interpreted with care. Ideally, all of the scans for one study should be obtained using the same scanner and the same imaging protocol, because variations can complicate the interpretation of results. However, this is often not feasible in large-scale studies, and therefore standardised protocols across sites and scanner platforms allow data to be pooled. This can greatly increase the number of subjects and hence possible analyses. In recognition of this, multi-site initiatives, such as the Alzheimer's Disease Neuroimaging Study (http://www.adni-info.org/), have been launched in recent years, indicating that consistent and valuable results can be obtained across sites and platforms(Reference Burton95). With standardisation criteria carefully being tested and employed, multi-site initiatives can be highly powerful.
Findings from structural studies can be used to illustrate the complexities of linking structure to function. It is well known that a reduction of MRI-derived volume is often observed along with diminished cognitive function in injury or central nervous system (CNS) disorders, such as Alzheimer's disease (AD). However, while a ‘bigger is better’ view has sometimes been supported in the study of relationships between normal brain structures and cognitive abilities, this is not likely to hold independently of groups studied(Reference Van Petten96). For instance, a decrease in cortical thickness is seen with increased cognitive function in school-aged children(Reference Tamnes, Ostby and Walhovd97, Reference Tamnes, Ostby and Fjell98), yielding a negative correlation of cortical thickness and cognitive performance scores, whereas a shift in the direction of this relationship is seen during ageing(Reference Fjell, Westlye and Amlien99–Reference Walhovd, Westlye and Amlien101), with thinner cortices usually being accompanied by some reduction of cognitive speed performance scores. This probably occurs because in children, cognitive development is enhanced by pruning or fine-tuning of synaptic connection, along with intracortical myelination, processes that would make the cortex appear thinner in MR images. On the other hand, during ageing, loss of synaptic spines and synapses, as well as neuronal shrinkage and possible neuronal loss, would decrease both cortical thickness and cognitive function. Thus, the relationship between volumetric/cortical surface characteristics and cognitive outcome is not constant throughout life.
Due to the high sensitivity of MRI to blood flow, it is crucial to recognise that not all interventions leading to a change in the BOLD signal may necessarily also lead to a perceivable behavioural change in examined subjects(Reference Gusnard, Raichle and Raichle102). Nonetheless, several studies have identified an association between blood flow and metabolic rate, suggesting that the blood supply is tightly regulated in space and time to provide the nutrients for brain metabolism(Reference Magistretti and Pellerin103). Importantly, structure–function relationships need to be defined to better understand disease- or nutrition-induced changes. This can be done using a stimulus–response paradigm and correlation with structural changes.
Furthermore, alterations in cognitive function due to ageing may depend on the specific task or function explored and may vary from one brain region to another. It is known, for example, that brain activity may be reduced in older persons when compared with younger individuals in prefrontal cortex(Reference Cabeza, Grady and Nyberg104) or medial temporal areas(Reference Grady, McIntosh and Horwitz105) during different memory tasks. On the other hand, an over-recruitment of the prefrontal cortex has often been described in older healthy subjects during execution of various cognitive tasks(Reference Cabeza, Anderson and Locantore106). Therefore, participant selection and screening may be fundamental in cross-section evaluations(Reference Nyberg, Salami and Andersson107). For instance, the inclusion of relatively high-functioning elderly individuals may bias the cross-sectional results in such a way that the cross-sectional analyses indicate an over-recruitment of the dorsal frontal cortex, while the longitudinal analysis reveals an age-related activity reduction in the same frontal regions(Reference Nyberg, Salami and Andersson107).
Structural and functional data transformations should be carefully verified and, when available, population-specific templates should be used to optimise alignment and reduce distortions(Reference Buckner, Head and Parker108). However, it is important that the variability between standard templates and the study group is not too great. For example, it is necessary to take age into account, especially when studying infant brains, which differ a great deal in terms of gross morphometric features from those of older children and adults. Intracranial volume and brain size undergo dramatic changes in the first few years of life, and slight changes are also seen throughout the teens, but the overall intracranial and brain volume in school-age years is very similar to that of adults(Reference Sgouros, Goldin and Hockley109) and standard templates may be used. Moreover, some classification, averaging and matching techniques used employ procedures shown to be well suited to account for varying anatomies(Reference Fischl, van der Kouwe and Destrieux110).
When fMRI is used to study brain functional organisation in individuals of different ages, it is important to take into consideration that methods for fMRI data analysis are exquisitely sensitive to blood flow. This means that cerebrovascular changes associated with ageing could alter one or more parameters of the vascular regulation(Reference Nielson, Langenecker and Ross111) and hence the results. For instance, studies that evaluated the visual cortex response during passive stimulation have reported a decreased fMRI signal in older adults when compared with younger individuals(Reference Huettel, Singerman and McCarthy112, Reference Ross, Yurgelun-Todd and Renshaw113), and this was not caused by reduced neural activity, but rather by differences in neurovascular local properties(Reference Ances, Liang and Leontiev114). One or more valid control tasks should be used as age-related differences in neurovascular response should influence all conditions equally. Thus, an evaluation of the size of the within-group effect should be safer than a direct comparison of the BOLD signal change in two age groups(Reference Samanez-Larkin and D'Esposito115). Other possible solution is the normalisation of the task-related signal change by the use of breath-holding to produce global changes in BOLD signal(Reference Handwerker, Gazzaley and Inglis116) or with a simple sensory or motor task to estimate the haemodynamic response function for each individual included in the study(Reference Handwerker, Ollinger and D'Esposito117).
We discuss here some of the issues pertinent to the consumption of supplements (Reference Smith, Smith and de Jager84), mostly using examples on homocysteine. While the literature linking homocysteine levels to brain measures is impressive, some inconsistencies and nuances of general relevance to possible nutritional intervention studies should be mentioned.
Age at intervention
First, since relationships between neuroimaging markers and nutrition indicators in adulthood have mostly been studied in middle-aged and older individuals, it is unknown whether relationships exist throughout the adult lifespan or at which point they may occur. The relationship between homocysteine levels and cognitive function was confined to adults aged ≥ 60 years in a large-scale study(Reference Elias, Sullivan and D'Agostino80). To the extent that nutrients are tested for a protective effect, they should be studied at an age span in which negative influences come into play (i.e. at a stage where age-associated atrophy has accumulated or become more marked or disease-related changes are more likely to set in).
Sex effects
There is some indication that relationships may be stronger in men(Reference Sachdev, Parslow and Salonikas83). This is not established enough to justify targeting only men for nutritional interventions, but intervention studies need to be sufficiently powered to analyse sex effects. Since evidence for sex effects has also been found in early intervention studies(Reference Isaacs, Gadian and Sabatini68, Reference Isaacs, Fischl and Quinn69), it is probably informative to include planned analyses by sex in all nutritional studies.
Use of multimodal imaging markers
While many studies have found effects of nutrition indicators on the brain, the particular measures that show effects may vary and are not always consistent across studies. For instance, while many studies on homocysteine levels have found effects on atrophy, one study has found no effect on atrophy, but only an effect on white matter hyperintensities(Reference Sachdev, Parslow and Salonikas83). Similarly, a recent study has reported associations between total cerebral brain volume and biomarkers of vitamin (positive) and trans-fat (negative), while fatty acid biomarkers have been reported to be related only to white matter hyperintensities(Reference Bowman, Silbert and Howieson76). This points to the importance of including multiple imaging measures. In addition, in line with recent studies pointing to the unique explanatory power of different imaging modalities relative to each other(Reference Walhovd, Fjell and Dale118), one should include several types of scans with respect to outcome measures (e.g. T1 weighted, T2 weighted, DTI and MRS).
Regional neuroanatomical specificity of effects
To the extent that hypotheses can be made a priori, studies should use analysis techniques that allow for testing effects located in specific brain systems. For instance, if fatty acids are hypothesised to affect the fibre integrity or myelination of major white matter tracts, DTI measures sensitive to this may be employed. It has been suggested that some discrepancies in the literature regarding the effects of B6 and B12 vitamins and folic acid, and by implication, homocysteine levels, may stem from differences in the sensitivity of image analysis techniques, where global measures of brain volumes will not necessarily capture regionally specific effects(Reference Erickson, Suever and Prakash119). In a small study using diet diaries, evidence has been found for medial volumetric effects, including anterior cingulate and parietal areas, as well as temporal and superior frontal effects of B6 and B12 vitamin and folic acid supplement intake. Hence, studies should include analyses sensitive to localised neuroanatomical effects(Reference Erickson, Suever and Prakash119).
Electroencephalography and magnetoencephalography: measuring brain electrical and magnetic activities
Electroencephalography and magnetoencephalography techniques and electroencephalography/magnetoencephalography-derived measures
EEG and MEG measure brain electrical and magnetic activities recorded from scalp electrodes and extracranial sensors, respectively. Scalp EEG activity is recorded as a voltage difference; thus, different reference derivations provide diverse voltage values at exploring electrodes. The general procedure for the recording of scalp EEG activity involves the positioning of an elastic cap with cabled cup electrodes or single-cup electrodes in standardised locations of the scalp. EEG procedures are especially suitable for multicentric studies, since EEG systems are always present in neurological departments and the EEG data of different recording systems can be harmonised using calibration signals of a defined voltage amplitude (i.e. 100 μV).
MEG activity is a reference-free measure recorded by superconducting quantum interference devices, which are sensors able to transform very small magnetic fields into recordable currents. The general procedure for the recording of extracranial MEG activity involves the demagnetisation of the subject and positioning of his or her head under a helmet with superconducting quantum interference devices. As a main merit, EEG and MEG signals have the highest temporal resolution compared with all the current brain imaging techniques (i.e. they can measure the amplitude of brain electromagnetic activity with a sampling < 1 ms).
From a physiological point of view, EEG and MEG signals derive from the post-synaptic ionic currents of synchronously active pyramidal neurons over extended cortical regions (cm) and reflect the integrative information processing of signals originating in the thalamus, brainstem and other cortical modules. In these extended cortical regions, both tangentially and radially oriented sources produce most of the scalp EEG signals, whereas only tangential sources produce MEG signals. It is noteworthy that EEG is characterised by a low spatial resolution (i.e. the ability to localise the cortical source of scalp EEG activity within several centimetres), since different conductivities of head tissues (brain, meninges, skull and scalp) attenuate and blur the spatial distribution of neural currents from brain sources to scalp electrodes. To minimise these weakness points, EEG activity can be recorded from 48 to 128 electrodes and can be processed to obtain reference-free and spatially deblurred EEG activity. This can enhance the spatial resolution of EEG to a few centimetres and eliminate the need for a reference. With respect to EEG, the spatial resolution of MEG is higher (several millimetres in the best experimental conditions, namely simple evoked magnetic fields), since magnetic fields are not affected by different conductivities of brain, skull and scalp tissues.
The high temporal resolution of EEG and MEG signals is ideal for investigating the emerging features of brain physiology, namely awake resting-state brain rhythms. In this condition, the subjects are minimally affected by anxiety, fatigue and issues related to their cognitive–motor performance (task difficulty, meta-learning, etc.). It is also ideal for investigating immediate brain responses to sensory, cognitive or motor events in short-term (acute) and long-term (chronic) intervention studies. Spectral analysis methods allow the estimation of EEG and MEG dynamics in terms of the dominant frequencies, power (or amplitude), phase and coherence of EEG rhythms. The background spontaneous oscillatory activity of brain neurons at about 10 Hz generates the dominant alpha rhythm of resting-state EEG and MEG activities(Reference Berger120). Oscillations in other frequency bands, such as δ (1–4 Hz), θ (4–7 Hz) and γ (30–70 Hz) bands, also exhibit complex patterns of power that are modulated by cognitive processes such as attention, perceptual binding and working memory(Reference Srinivasan, Winter and Nunez121). On the other hand, EEG and MEG techniques can be used to study the fine timing (millisecond scale) of event-related or evoked cortical responses to external stimuli, mental operations or movements (Fig. 4). Functional connectivity between brain areas is crucial for perceptual and cognitive processes that are intrinsically based on the integration of information represented in several cortical and subcortical areas in the human brain. Both resting-state and the mentioned event-related EEG/MEG measures can be used as input for the evaluation of functional connectivity of brain networks. Spectral coherence (linear), directed transfer function (linear) and synchronisation likelihood (linear and nonlinear) techniques are typically used to do so from EEG/MEG rhythms recorded during resting-state conditions, while event-related covariance can be used from event-related potentials (ERP)/event-related fields(Reference Nunez, Wingeier and Silberstein122). The choice between EEG and MEG techniques depends on the importance of spatial resolution for testing the working hypothesis (effects of the intervention on specific cortical regions).
Analysis in the time and frequency domains of electroencephalographic (EEG) data related to a motor event (i.e. voluntary self-paced right middle finger extensions). (a) A schematic representation of ongoing EEG rhythms at α frequencies (about 10 Hz) before, during and after the onset of the electromyographic (EMGo) activity associated with voluntary self-paced middle finger extensions. It can be seen that the amplitude of alpha rhythms is reduced during the preparation and execution of the movement, the so-called alpha event-related desynchronisation (ERD) and is enhanced after the EMGo, the so-called event-related synchronisation (ERS). In the same dataset, a slow negative shift is hidden in the EEG oscillations, namely the movement event-related potentials (MRP). The example shows that the same EEG dataset can be analysed in the frequency domain to compute the alpha ERD and in the time domain to produce MRP. (b) A topographic map showing cortical sources of the MRP as computed by a weighted, minimum-norm linear inverse estimation. It can be noted that the maximum source amplitude (red hot spot) is represented in the Rolandic region of the left hemisphere contralateral to the movement side. (c, d) Topographic maps showing cortical sources of the ERD at α (about 10 Hz) and β (about 20 Hz) frequencies. With respect to the MRP, alpha and beta ERD were characterised by maximum source amplitude (red hot spots) in the Rolandic regions of both hemispheres. It is concluded that quantitative EEG techniques can reveal parallel physiological processes underlying the activation of sensorimotor cortical regions related to voluntary movements.

Eligibility for an electroencephalography/magnetoencephalography examination
EEG/MEG recordings are fully non-invasive and technically easy procedures that can be easily repeated several times in human subjects of any age (i.e. from newborns to elderly people) and clinical status (i.e. patients in a coma or a vegetative state) without ‘repetition’ effects. It has been shown that EEG variables correlate with individual subjects' cognitive state and specific intellectual abilities (e.g. reading) during child development, including individuals with Down syndrome(Reference Babiloni, Albertini and Onorati123); overweight or underweight adults(Reference Babiloni, Del Percio and Valenzano124, Reference Babiloni, Del Percio and Triggiani125); and patients with disorders of vigilance, consciousness and communication(Reference Babiloni, Sara and Vecchio126, Reference Babiloni, Pistoia and Sara127); as well as elderly subjects with intact cognitive status or cognitive decline progressing to overt dementia(Reference Babiloni, Ferri and Moretti128–Reference Rossini, Rossi and Babiloni134). Such a correlation is typically moderate and emerges with relatively large populations (n>30) and a fine clinical and neuropsychological assessment. Furthermore, sex differences in ERP topography and amplitude have been reported in children and adults(Reference Koles, Lind and Flor-Henry135, Reference Spironelli, Penolazzi and Angrilli136).
EEG/MEG can be used for testing the neurophysiological effects of pharmacological, rehabilitation or nutritional interventions immediately after an acute dose administration or after long-term programmes. EEG/MEG recordings are suitable for studying the group differences in between-group and within-group designs. Both techniques can be used in multicentric trials since the hardware of different brands can be easily calibrated and harmonised, although the availability of EEG is much wider than that of MEG, largely due to the much higher costs of MEG.
Use of electroencephalography/magnetoencephalography in nutritional studies
In the following, we highlight a selection of EEG and MEG papers to illustrate the resting-state, evoked potential (EP)/evoked field and ERP/event-related field markers that capture the short-term (acute) and long-term (chronic) effects of nutrients on brain activity in healthy infants, children and adults. Specifically, with regard to acute effects, we focus on caffeine, and for the long-term effects of food interventions on brain function, we focus on studies that have investigated the effects of LC-PUFA as these nutrients have been repeatedly used to supplement milk formulas for infants and children during the developmental time course. Practically, no MEG studies on the effects of caffeine and LC-PUFA have been found. In the following paragraph, we summarise the main results and conclusions (Babiloni et al., unpublished results, 2012).
Caffeine has evident psychoactive effects at doses comparable to one to ten servings of tea or cola(Reference Ruxton137) as assessed with the behavioural measures of cognitive function. A series of EEG and ERP studies have tested the effects of caffeine on brain activity during wakeful resting, mainly in adults and also in children and during ageing(Reference Dimpfel, Schober and Spuler138–Reference Tieges, Snel and Kok144) (see Lorist & Tops(Reference Lorist and Tops145) for a review). In these studies, resting-state EEG markers have been frequently used to study the psychoactive effects of caffeine, mostly at relatively high doses (200–500 mg) in adults. Generally, caffeine decreases α power, which indicates increased alertness or arousal(Reference Pfurtscheller146) consistent with the behavioural literature (see Ruxton(Reference Ruxton137) for a review). Both behavioural and EEG studies struggle with the same fundamental questions such as how to correct for habitual caffeine use and body weight and to what extent caffeine effects can be attributed to the relief of withdrawal effects. Therefore, traditional background EEG measures may not add significant insights into the behavioural measures of caffeine effects, but it could be speculated that statistical functional coupling of resting-state EEG rhythms at electrode pairs as revealed by additional mathematical techniques, such as spectral coherence (linear), directed transfer function (linear) and synchronisation likelihood, might provide more informative markers about the caffeine effects(Reference Nunez, Wingeier and Silberstein122). These variables have been successfully used to disentangle abnormal changes of functional connectivity in the resting-state condition in elderly subjects suffering from preclinical or earlier stages of AD(Reference Babiloni, Ferri and Moretti128–Reference Babiloni, Frisoni and Vecchio132) as well as after acute administration of nicotine, cocaine, marihuana, alcohol or medications(Reference Galati, Stanzione and D'Angelo147–Reference Struve, Manno and Kemp151). The changes in functional connectivity measures in mild AD have been the target of a recent multi-country randomised controlled trial with a medical food. The studied product provides the nutritional precursors and cofactors for the formation of neuronal membranes, aiming to improve synapse formation and function in AD; hence, the study included EEG measures as secondary outcomes as markers for synaptic connectivity(Reference Scheltens, Twisk and Blesa152). Findings included significant amelioration in peak frequency and functional connectivity in the δ band over the 24-week intervention period in the experimental group compared with the control, suggesting preserved and even increased synaptic function resulting from the intervention(Reference Scheltens, Twisk and Blesa152). In addition to resting-state EEG, several ERP studies have investigated the effects of caffeine on the brain using simple (e.g. rapid visual information processing and oddball) or more complex (e.g. switch task) attention tasks. ERP studies have added more detailed insights into what aspects of attention are improved by caffeine (generally processes following simple stimulus processing) and at which level of information processing (complex tasks seem to show more benefits).
With regard to the effects of long-term food interventions, LC-PUFA have been the subject of many studies, particularly those on infant development. Several studies using ERP and resting-state EEG measures have investigated diet-related effects of n-3 and n-6 fatty acids in mothers and infants, as well as in healthy adults(Reference Birch, Birch and Hoffman153–Reference Hoffman, Theuer and Castaneda164). In summary, diets with n-3 and n-6 fatty acids can influence resting-state EEG, not only in infants and children during development but also in adults, suggesting increased plasticity of neuronal membranes and synaptogenesis. The large majority of ERP studies have focused on EP, especially visual EP have been used as functional markers of the maturation of the visual system of infants fed with a LC-PUFA-supplemented formula or a control formula for 12 months(Reference Birch, Castaneda and Wheaton165, Reference Birch, Garfield and Hoffman166). In the same vein, auditory EP or brainstem auditory EP have similarly been used as functional markers of the auditory system(Reference Bougle, Denise and Vimard167, Reference Parra-Cabrera, Moreno-Macias and Mendez-Ramirez168). Indeed, from a neurodevelopmental perspective, visual EP and brainstem auditory EP are the measures of choice for probing the maturation of the visual and auditory systems during development in infants and children before the acquisition of the verbal skills required for behavioural tests. Compared with the control group, preterm infants with low birth weights ( < 1500 g) receiving n-3 and n-6 supplementation for 9 weeks showed a significantly lower amplitude of ERP in response to frequently presented pictures, a possible reflection of a better short-term recognition memory of these frequent pictures(Reference Henriksen, Haugholt and Lindgren169). In school-aged children and adults, ERP during oddball tasks (measuring sustaining attention to a continuous stream of stimuli and responding to pre-specified infrequent target stimuli) and Go–Nogo paradigms (assessing sustaining attention to a continuous stream of stimuli and responding to all stimuli except to predefined infrequent target stimuli) demonstrated some effects of n-3 and n-6 fatty acids on visual and auditory attention and motor processes. Sparse use of resting-state EEG markers can be explained by the large variability of these markers during development. Finally, the literature on the effects of n-3 and n-6 fatty acids on resting-state MEG and event-related fields is practically non-existent.
Methodological limitations and recommendations of relevance to intervention studies
In the previous section, we had highlighted a selection of EEG studies in healthy subjects on the effects of caffeine as an example of short-term psychostimulant effects (having acute effects on brain function) as well as LC-PUFA as examples of nutrients that have a long-term effect on brain structure and thus on function (chronic effects). Both resting-state EEG and EP/ERP markers have been successfully used for this purpose. For caffeine, the results are in line with the behavioural literature, confirming that caffeine improves attention. The majority of EEG studies on caffeine have used relatively basic attention tasks with a large perceptual component; the lack of use of more ‘cognitive’ attention paradigms such as the Posner attention task(Reference Capotosto, Babiloni and Romani170) is striking in caffeine research, but it is in fact present in other nutritional research. There seems to be a disconnection between advances in behavioural measure of attention and the development of EEG/ERP tasks. The brain imaging area could benefit from the monitoring of developments in the behavioural area.
For n-3 and n-6 fatty acids, visual EP and brainstem auditory EP are even considered the gold standard for the assessment of the maturity of the nervous system(Reference Parra-Cabrera, Moreno-Macias and Mendez-Ramirez168, Reference Hou, Good and Norcia171). In this age group, adapted and validated behavioural measures of development exist (e.g. the Bayley scales) and are the preferred measures of neurodevelopment, especially in premature infants.
Moreover, we think that resting-state EEG and EP/ERP markers could be greatly enhanced using advanced high-resolution EEG techniques rather than simple computation of power density spectra or amplitude/latency of EP/ERP peaks at a few scalp electrodes. Another promising perspective is the development of EEG markers probing the functional coupling of EEG rhythms as revealed by spectral coherence, directed transfer function and synchronisation likelihood(Reference Babiloni, Ferri and Moretti128–Reference Babiloni, Frisoni and Vecchio132, Reference Galati, Stanzione and D'Angelo147–Reference Struve, Manno and Kemp151). Finally, it is expected that MEG techniques could greatly contribute to an accurate modelling of functional topography of the cortical sources of the recorded MEG data in the near future, thanks to the increasing availability of MEG systems worldwide.
Near-IR spectroscopy: measuring cerebral blood flow and haemodynamic responses
Near-IR spectroscopy techniques and near-IR spectroscopy-derived measures
NIRS involves the introduction of two or more wavelengths of near-IR laser or light-emitting diode light through the intact skull with subsequent measurement of light absorption following diffusion through the upper layers of the cortex by optodes positioned at a set distance from the emitter. The differential intrinsic oxygenated and deoxygenated Hb in the surface of the cortex give measures of oxy-Hb and deoxy-Hb and their sum (total Hb), which represent proxy measures of blood volume or blood flow in the interrogated neuronal tissue; therefore, NIRS serves as a marker for neural activation. Activity and blood flow in the brain are inextricably linked by the neurovascular coupling of local neuronal activity to blood flow, whereby a number of signalling molecules and physiological mechanisms serve to increase the delivery of blood-borne metabolic substrates to active tissues(Reference Del Parigi, Chen and Gautier172, Reference Girouard and Iadecola173). When assessed by NIRS, the haemodynamic response to local neural activity will be seen as an increase in CBF, which in turn will be evident as an increase in the concentrations of both oxy-Hb and total Hb and a corresponding comparative decrease in deoxy-Hb level(Reference Steinbrink, Villringer and Kempf174). NIRS outcomes can therefore be taken to infer local neural activation or, alternatively, can be interpreted more directly as simple changes in blood flow/volume in the underlying cortical tissue. The latter is particularly pertinent as both CBF and the magnitude of the haemodynamic response to neural activity decrease with normal ageing and in neurological disease(Reference Girouard and Iadecola173). A large and expanding literature has described the use of NIRS as a tool for multiple-channel imaging of the haemodynamic correlates of neural activation across the lifespan in healthy cohorts. As an example, in groups of neonates, children and infants, NIRS has been used to investigate neuronal activation across diverse cortical brain regions as a consequence of auditory, visual and olfactory stimuli(Reference Lloyd-Fox, Blasi and Elwell175). In adults, NIRS has been widely adopted to investigate the location and extent of cortical responses during diverse motor tasks(Reference Leff, Orihuela-Espina and Elwell176), haemodynamic responses to sensory stimuli(Reference Okamoto and Dan177) and during cognitive tasks(Reference Schecklmann, Ehlis and Plichta178). Across these areas, NIRS has shown itself to be sensitive enough to reliably illuminate age-related changes in CBF. For instance, it has been used to demonstrate an inverse correlation between age and haemodynamic response in non-elderly adults during verbal fluency tasks(Reference Kameyama, Fukuda and Uehara179) and hypoxia(Reference Safonova, Michalos and Wolf180). Similarly, it has been utilised to show reduced haemodynamic responses in older adults in comparison with younger adults during verbal fluency(Reference Herrmann, Walter and Ehlis181) and executive function(Reference Schroeter, Zysset and Kruggel182) tasks, as well as during postural changes(Reference Kim, Bogert and Immink183) and simulated driving(Reference Harada, Nashihara and Morozumi184).
NIRS systems vary in complexity from single or dual channels to ‘whole-head’ arrays of several dozen channels and fall into several categories depending on the measurement technique that they employ: ‘continuous-wave’ systems emit light continuously at constant amplitudes, and only the amplitude decay is measured; ‘time-domain’ systems emit short bursts of photons, with the temporal distribution providing information about tissue absorption and scattering; ‘frequency-domain’ systems emit amplitude-modulated light and record amplitude decay and phase shift(Reference Strangman, Boas and Sutton185). Within these categories, there is a plethora of variants, and a number of new techniques are in the process of development(Reference Pellicer and Bravo186, Reference Wolf, Ferrari and Quaresima187). Each of these systems has its own advantages and disadvantages. As an example, the most widely used system for brain imaging and clinical applications to date has been the continuous-wave system, which provides continuous, extended recording with a high temporal resolution, is easy to apply, allows movement during measurement and is comparatively cheap and portable and of very low running costs. However, its major disadvantages include its limited depth of penetration and its use of an arbitrary value for the (unknown) path length of light in its calculation of Hb concentrations (using a modified Beer–Lambert formula), therefore only providing ‘change in concentration’ measurements rather than quantifying the absolute levels of oxy-Hb and deoxy-Hb(Reference Hoshi188). It is therefore only suited to measuring the haemodynamic responses to task-related neural activation or the acute and chronic effects of an intervention in terms of how it modulates the haemodynamic response to task performance. It is also ideal for continuous measurement of the very short-term (maximum of several hours) effects of acute interventions. Recent ‘quantitative’ systems resolve this measurement issue by collecting light at several increasing distances from the light source, allowing the exact calculation of the path length and thereby the absolute quantity of Hb in the underlying tissue. These systems, which have advantages in terms of cost and practical considerations similar to those of earlier continuous-wave systems, will be ideally suited to studies of either the acute or chronic effects of an intervention in terms of both absolute quantities and haemodynamic responses. While NIRS parameters have been shown to correspond strongly with the fMRI BOLD signal(Reference Steinbrink, Villringer and Kempf174, Reference Cui, Bray and Bryant189, Reference Huppert, Hoge and Diamond190), there are advantages and disadvantages associated with the two imaging techniques. NIRS has a high temporal resolution (up to 250 Hz) and is certainly comparatively cheap, easy to use and suitable for measuring during most tasks for long periods. It also generates data that can be analysed using standard statistical methods. However, it does not have the comparatively high spatial resolution of fMRI, and it only provides information about blood flow parameters in the upper layers of the cortex.
Eligibility for a near-IR spectroscopy examination
NIRS originated as a clinical tool(Reference Jobsis191) and continues to be widely used across the lifespan in this context. For example, its uses include the monitoring of cerebral haemodynamics and oxygenation across critical illnesses in neonates, infants and children(Reference Ghanayem, Wernovsky and Hoffman192). It is also used during anaesthesia(Reference Kasman and Brady193) and in clinical research into neurological conditions, including perinatal asphyxia, epilepsy and brain development(Reference Franceschini, Thaker and Themelis194, Reference Wallois, Patil and Heberle195). Similar applications in adults include use during surgery, resuscitation and cardiac failure(Reference Cohn196, Reference La, David and Gaeta197) and the identification and rehabilitation of brain injury(Reference Leff, Orihuela-Espina and Elwell176, Reference Cohn196, Reference Len and Neary198). NIRS has also been used to demonstrate reduced CBF or haemodynamic responses during cognitive tasks in groups suffering from a number of neurological or neurodevelopmental conditions, including age-associated cognitive impairment and dementia(Reference Arai, Takano and Miyakawa199), schizophrenia(Reference Ohi, Hashimoto and Yasuda200) and attention-deficit hyperactivity disorder (ADHD)(Reference Takeshi, Nemoto and Fumoto201).
NIRS has also proven itself to be a sensitive research technique for assessing the modulation of CBF across the lifespan, from neonates(Reference Lloyd-Fox, Blasi and Elwell175) to older adults(Reference Okamoto and Dan177, Reference Herrmann, Walter and Ehlis181), in diseased and healthy subjects, and it reliably illuminates age-related changes in CBF elicited by sensory stimuli or cognitive task performance(Reference Kameyama, Fukuda and Uehara179, Reference Safonova, Michalos and Wolf180, Reference Schroeter, Zysset and Kruggel182–Reference Harada, Nashihara and Morozumi184). In general, NIRS research has been conducted in mixed-sex groups.
NIRS has rarely been employed in pharmacological trials in adult samples. Beyond a number of drug trials related to its clinical use in anaesthesia(Reference Vanderhaegen, Naulaers and van Huffel202), it has been used to demonstrate a reduced haemodynamic response in the prefrontal cortex during cognitive tasks following methylphenidate use in children with ADHD(Reference Weber, Lutschg and Fahnenstich203) and following sedating antihistamine use in children(Reference Tsujii, Masuda and Yamamoto204). Similarly, it has been used to show decreased frontal lobe oxygenation following the administration of sumatriptan(Reference Watanabe, Tanaka and Dan205) and phenylephrine(Reference Brassard, Seifert and Wissenberg206) and increased oxygenation following the use of the vasodilator vinpocetine(Reference Bonoczk, Panczel and Nagy207).
Use of near-IR spectroscopy in nutritional studies
NIRS provides an accessible measure of the CBF effects of the many nutritional factors and dietary components that may modulate blood flow either over the short term or indeed across the lifespan. However, to date, only a handful of studies have utilised NIRS to assess the cerebral haemodynamic effects of nutrients and food components. The only such study in infants(Reference Tracy, Klimek and Hinder208) has demonstrated reduced CBF (tissue oxygenation index representing the ratio of oxy-Hb:deoxy-Hb) in the temporo-parietal region following the administration of a single dose of caffeine, administered primarily as a respiratory stimulant, to forty preterm infants. A number of double-blind, placebo-controlled trials have also assessed the effects of nutritional interventions on CBF/neural activity in adults as measured by one or two channels positioned over the frontal cortex during tasks that activate this brain region. For instance, Kennedy & Haskell(Reference Kennedy and Haskell209) confirmed the vasoconstricting properties of caffeine in healthy adults (total Hb, n 20, cross-over design). NIRS has also been used to demonstrate a dose-related increase in CBF (total Hb) and deoxy-Hb level in the frontal cortex during task performance following the administration of single doses of the polyphenol resveratrol (n 22, cross-over design(Reference Kennedy, Wightman and Reay210)) and a decrease in CBF (total Hb) during tasks following the administration of two single doses of the tea polyphenol epigallocatechin gallate (n 27, cross-over design(Reference Wightman, Haskell and Forster211)). The above-mentioned findings mirror those from studies using a variety of other imaging techniques in the case of caffeine and animal models in the case of the polyphenols. Several controlled trials have also investigated longer intervention periods. For instance, Watanabe et al. (Reference Watanabe, Kato and Kato212) demonstrated modulated haemodynamic responses in terms of decreased oxy-Hb and increased deoxy-Hb levels during cognitive tasks following 5 d administration of creatine to a small sample of adults (n 24, parallel groups). In two investigations of the effects of n-3 fatty acids, Jackson et al. (Reference Jackson, Reay and Scholey213) demonstrated that 12-week administration of DHA-rich fish oil, but not of EPA-rich fish oil, increased the frontal cortex haemodynamic response in terms of total Hb and oxy-Hb during ‘frontal’ task performance in a small sample of twenty-two healthy young adults. Jackson et al. (Reference Jackson, Reay and Scholey214) subsequently confirmed the dose-dependent nature of the effects of the DHA-rich fish oil in a larger sample of sixty-five adults.
Methodological limitations and recommendations of relevance to intervention studies
Taken together, these studies suggest that NIRS is adequately sensitive to detect the CBF effects of nutrients and food components. However, although NIRS can be used to reliably demonstrate CBF and haemodynamic responses to cognitive task performance, there is little evidence to date of a direct relationship between changes in CBF inculcated by nutritional interventions and corresponding benefits in terms of the speed or accuracy of cognitive performance per se. This collection of studies also highlights the constraints associated with much of the NIRS research to date. The first of these is that the studies have generally only employed either one or two channels, typically covering the prefrontal cortex, rather than the distributed network of channels across the frontal cortex or head that the technique can accommodate. The second is that the most commonly used continuous-wave NIRS systems can only measure changes in concentrations during the period of recording, rather than providing data reflecting the absolute levels of oxy/deoxy-Hb. This makes them well suited to assessing the acute effects of an intervention, such as caffeine or resveratrol (with uninterrupted recording from pre-dose), or suitable for assessing the effects of a chronic treatment in terms of the magnitude of the increase from a resting baseline in blood flow/volume during task performance (i.e. the haemodynamic response). The latter measure is undoubtedly of interest, but it alone is unlikely to constitute the main outcome of any study assessing the effects of long-term administration of nutrients or indeed the cross-sectional/prospective relationships between nutrients and brain function.
It is also necessary to note that the more recently introduced quantitative NIRS systems combine the ease and mobility of measurement, portability and low costs of the continuous-wave systems and generate data representing the absolute quantity of oxy/deoxy-Hb in the interrogated cortical tissue. This step change in measurement technology, in concert with increased sophistication in terms of the number and location of channels across the head, should make NIRS a particularly useful and cost-effective imaging technique in nutrition-related studies in the future, especially as NIRS can be combined successfully with most other imaging techniques and can be used across ages and in concert with complex cognitive or physical movement paradigms.
Positron emission tomography imaging: anatomical, metabolic and functional assessments for nutritional research
Positron emission tomography techniques and positron emission tomography-derived measures
Functional neuroimaging procedures, such as PET and SPECT, measure the metabolic and physiological processes of the CNS. When combined with structural imaging techniques, PET and SPECT determine the exact anatomical location and the physiological and metabolic effects of a nutrient on the brain.
To perform PET, a radiotracer is produced by attaching a radioactive atom to a molecule or a compound of biological interest. Directly following its synthesis, the radiotracer begins to decay and release positively charged positrons from the nucleus. A positron has the kinetic energy to travel a few millimetres within the tissue. When almost at rest, the positron interacts with an unbound electron. Since the two particles have an opposite charge, they annihilate each other, resulting in two γ-ray photons of 511 keV energy being emitted at 180° from each other(Reference Horwitz, Friston and Taylor215). In a PET scanner, rings of radiation detectors that surround an individual's head for brain studies or another body part of interest detect the γ-ray photons. Pairs of these radiation detectors are oriented to face each other at 180° and are connected by an electronic coincidence circuit that detects the photons emitted during the annihilation event when the positron meets an electron and that converts light energy into electrical energy to measure the number of photon pairs originating from all angles in the brain. Through a computer reconstruction algorithm, it is possible to determine both the amount and location of the γ-ray photons on a regional basis throughout the brain and to produce a three-dimensional image or picture. Due to the distance of few millimetres travelled by the positron before the annihilation event occurs, PET has an intrinsic limitation in spatial resolution. The number of positron/electron collisions at each site in the brain is proportional to the amount of the radiotracer present at the site. Hence, the relative amount of relevant activity being evaluated with respect to activity at other brain sites can be determined.
PET enables in vivo visualisation by tracking radioactive compounds (i.e. radiotracers) that are of potential biological importance in the body(Reference Wong and Brasic216). PET tracers typically are identical or similar in structure (i.e. they are analogues) to naturally occurring molecules that act in particular brain areas. Depending on the radiotracer, PET can provide measures of regional cerebral glucose metabolism, blood flow and neurotransmitter metabolism in a variety of physiological conditions and in neurological or psychiatric disorders(Reference Holcomb, Links, Smith and Andreasen217).
The best-known example of a PET tracer is [18F]fluoro-2-deoxy-d-glucose (FDG). FDG is an analogue of glucose that is labelled with 18F and has a radioactive half-life of 110 min. Glucose serves as the source of energy in active brain cells. Thus, regional cerebral metabolic rates for glucose, as determined using PET with this tracer, represent a reliable index of functional synaptic activity in the human CNS(Reference Reivich, Kuhl and Wolf218, Reference Sokoloff, Reivich and Kennedy219). After an intravenous bolus injection, FDG reaches the brain via blood flow and, similar to glucose, can be transported across the cerebral capillary bed into the neurons by a monosaccharide transport system. Once inside brain cells, FDG is phosphorylated to FDG-6-phosphate, but unlike glucose-6-P, FDG-6-phosphate is not further metabolised by glycolytic pathway enzymes and remains essentially trapped inside brain cells during the duration of the scan(Reference Sokoloff, Reivich and Kennedy219). Therefore, the quantity of FDG-6-phosphate that has accumulated in a brain region during 45 min of uptake after FDG intravenous injection is measured by PET, and it reflects the rate of phosphorylation of glucose to glucose-6-P and the plasma integral of FDG to which the brain is exposed(Reference Sokoloff, Agranoff and Aprison220). Using an operational equation(Reference Sokoloff, Reivich and Kennedy219), regional cerebral metabolic rates for glucose are calculated from the quantity of FDG-6-phosphate within the brain, the ratio of the integrated plasma activity of FDG to non-radiolabelled plasma glucose concentration during 45 min of uptake and a ‘lumped constant’ that corrects for the use of FDG in place of unlabelled glucose.
By binding the radioactive compound to specific proteins (e.g. transporters, receptors or enzymes), PET can be used to evaluate the state of neurotransmitter systems, revealing, for instance, the activity of enzymes involved in the synthesis and metabolism of a given neurotransmitter, such as serotonin or dopamine, or the number of receptors present(Reference Paus221). PET may also reveal the variety of physiological processes mediated by the receptor system. In general, the dose of the radiotracer for a routine PET scan is approximately 1000 times lower than that required to produce a pharmacological effect(Reference Wong, van der Westhuizen and Coleman222). Hence, the radiotracer does not interfere with the ongoing conditions under study.
In addition to fluorine, other radioactive atoms used in PET studies are carbon (11C) and oxygen (15O). As a freely diffusible tracer, H215O quickly equilibrates between brain and blood and provides an excellent indicator of regional CBF (rCBF), another reliable index of neuronal activity. Immediately following an intravenous injection of a bolus of H215O, a PET scan that can last from 1 to 4 min is acquired to measure local radioactivity in the distinct cortical and subcortical brain regions. Radioactivity can be concurrently measured in the blood by sampling from an indwelling arterial line that is connected to an automatic counter. Using a mathematical model, it is possible to determine absolute rCBF values in terms of ml/100 g tissue per min.
Since the radioactivity of 15O has a rapid decay (half-life 2·05 min), multiple scans can be performed sequentially in the same individual, ranging from 6 to 12 min apart. This makes it possible to evaluate rCBF repeatedly in a single PET session, while the subject is in the ‘resting state’ with no sensory stimulation or engaged in performing a variety of tasks. By subtracting a baseline rCBF scan from a task rCBF scan, regions where activity is specifically altered during the task can be identified. In such rCBF studies, arterial blood PaCO2 is monitored so that global CBF can be corrected when differences in PaCO2 occur. Over the last few years, fMRI has largely been replaced with PET to study changes in regional brain activity by measuring blood flow-related phenomena, because of the greater space and time resolution and the lack of any radioactive exposure.
Due to its methodological features and radionuclide specificities, PET is adapted to measure neural activations during specific tasks and the acute and chronic effects of an intervention in terms of how it modulates both the neural response to task performance and the metabolism of different neurotransmitters.
Eligibility for an examination with positron emission tomography
PET scanning is useful for understanding adult brain function, but the use of short-life radioactive compounds poses a strict limitation to the number of PET scan examinations that an individual may undergo within a given period of time. It is also considered impractical to use this approach in healthy children and adolescents for radiation safety reasons. Hence, in the young, the technology is only used for diagnosis in which the risk is outweighed by the benefit.
Use of positron emission tomography in nutritional studies
The number of nutritional studies using PET techniques is limited. This is not surprising due to the high cost of the technology, its limited availability and the short half-life of radiotracers. Due to radiation, most of the studies available either have examined the effect of nutrition in the adult brain or are clinical studies in children. Past studies have leveraged PET analysis as a tool for identifying the effects of various stimuli on neurotransmission, blood flow and glucose uptake. The technique can map potential CNS mechanisms mediating whole-body energy balance by regulating energy intake and expenditure in healthy men and women and in those deviating from ‘healthy’. These data show that inter-individual and sex differences in behaviour may have neurobiological correlates. In several studies(Reference Del Parigi, Chen and Gautier172, Reference Gautier, Chen and Salbe223–Reference Le, Chen and Pannacciulli225), PET has been used to measure rCBF, a marker of neuronal–synaptic activity, to investigate the functional neuroanatomy of sex differences and differences between lean and obese individuals in hunger and satiation. Hunger was associated with significantly increased neuronal activity in the vicinity of the hypothalamus and thalamus, which are areas described previously as important in the regulation of feeding behaviour in animals. Hunger was also associated with increased activation in the vicinity of the limbic and paralimbic areas, regions involved in affect and motivation. In contrast, satiation was associated with increased activity in prefrontal cortical areas implicated in aspects of response inhibition. The changes in activity in the putamen and cerebellum associated with hunger suggested the involvement of brain regions not previously associated with the regulation of food intake. PET has also demonstrated extensive similarities, as well as some differences, between the sexes. In response to hunger, men tended to have greater activity in the frontotemporal and paralimbic systems than did women(Reference Del Parigi, Chen and Gautier172). In response to satiation, women tended to have greater activity in the occipital and parietal sensory association areas and in the dorsolateral prefrontal cortex than did men, and men tended to have greater activation in the prefrontal cortex than did women(Reference Del Parigi, Chen and Gautier172). Sex-specific responses indicate possible neurobiologically based differences in men and women in cognitive and emotional processing of hunger and satiation.
Only a few neuroimaging studies have explored the effects of modifications in nutritional lifestyle on the brain functional and anatomical correlates. Small et al. (Reference Small, Silverman and Siddarth226) have recently used PET with cognitive and memory tests to assess brain metabolic and functional correlates of a 14 d healthy longevity programme. Volunteers in the intervention programme were requested to follow a diet plan and to practise relaxation exercises, cardiovascular conditioning and mental exercise (brain teasers and verbal memory training). The diet plan used in this study included five daily meals and emphasised antioxidant-rich fruits and vegetables, n-3 fats and low-glycaemic index carbohydrates. FDG-PET scans and cognitive tests were performed before and after the intervention, and the results were compared with those obtained from a group of control subjects, who continued with their usual lifestyle routine. Individuals in the intervention group showed improved performance in a word fluency test, while the PET scans identified a 5 % decrease in cerebral glucose metabolism in the dorsolateral prefrontal cortex. The authors interpreted these results as signs of increased cognitive efficiency consequent to the temporary modification in lifestyle.
Another neuroimaging study has investigated brain functional correlates of dietary restraints and successful dieting. Del Parigi et al. (Reference Del Parigi, Chen and Salbe227) used an H215O radiotracer to evaluate brain response to the sensory experience of food consumption comparing a group of successful female dieters (i.e. successful weight loss maintainers) with a group of non-dieters. The authors observed that after meal consumption, successful dieters showed greater brain activation in the dorsal prefrontal cortex, dorsal striatum and anterior cerebellar lobes when compared with non-dieters. Vice versa, the orbitofrontal cortex showed greater activation in non-dieters when compared with successful dieters. In addition, dietary restraint, assessed using the Three-Factor Eating Questionnaire(Reference Stunkard and Messick228), correlated positively with the response in the dorsal prefrontal cortex and negatively with the response in the orbitofrontal cortex. Finally, a negative correlation was observed between the response in the dorsal prefrontal cortex and that in the orbitofrontal cortex. Given these results and the role recognised for these two brain regions in cognitive control of behaviour(Reference Miller229) and codification of the reward value of stimuli(Reference Rolls230), respectively, the authors hypothesised that an inhibitory loop may exist between these two areas in successful dieters. In other words, cognitive control of food intake may be achieved, thanks to a modulatory signal generated in the dorsal prefrontal cortex, and directed to regions involved in food reward such as the orbitofrontal cortex(Reference Hinton, Parkinson and Holland231).
Nugent et al. (Reference Nugent, Croteau and Pifferi232) questioned whether cerebral glucose hypometabolism mediates changes in cognitive function during healthy ageing. Based on epidemiological studies suggesting that dietary n-3 PUFA ingestion from weekly consumption of a fatty fishmeal protects cognitive function in the elderly, the study sought to determine whether fish oil supplementation rich in n-3 PUFA increases cerebral glucose metabolism. PET analyses utilising [18F]FDG were used to assess cerebral glucose metabolism in young and elderly adults. Healthy young and elderly subjects received fish oil capsules daily for 3 weeks (DHA and EPA). Both brain 18FDG-PET analysis and an oral glucose tolerance test were performed at baseline and at the end of the treatment. The results failed to differentiate age or n-3 PUFA supplementation effects on glucose metabolism in any of the brain regions evaluated.
Because of the limited number of existing reports, we describe types of studies that could usefully employ PET analyses to examine the effects of a nutritional intervention on brain function. Published study protocols for children with Tourette's syndrome or ADHD illustrate how PET imaging can be used with regard to a nutritional intervention to modulate brain function. Tourette's syndrome is a neurological condition presenting with chronic motor and phonic tics during childhood that persists into maturity. Current standard treatment achieves partial control of the condition and provokes significant adverse effects. In 2002, Grimaldi(Reference Grimaldi233) hypothesised that Mg and vitamin B6 deficiencies may be the precipitating factors in the neurochemical pathways mediating Tourette's syndrome symptomatology. To confirm this hypothesis, Garcia-Lopez et al. (Reference Garcia-Lopez, Perea-Milla and Garcia234) reported on a study protocol designed to assess the effects of a combination of Mg and vitamin B6 supplementation v. placebo on metabolic changes measured by PET in the brain in conjunction with a reduction in motor and phonic tics and incapacity, as well as in quality of life, in children aged 7–14 years with exacerbated Tourette's syndrome(Reference Garcia-Lopez, Perea-Milla and Garcia234). PET imaging will be performed before and after the treatment, in order to ascertain treatment effects on dopaminergic activity within the basal nuclei and in the prefrontal cortex. Thus, PET imaging can be employed as a tool to evaluate alternative hypotheses of nutritional effects on brain function under clinical conditions.
PET has been used to examine brain metabolism in children with ADHD(Reference Frank and Pavlakis235). ADHD is a very common and heterogeneous disorder with an onset in children. The key features include persistent symptoms of inattention, hyperactivity and impulsive behaviour. Approximately 15 % of patients appear refractory to the standard of care with psychostimulants. Dysfunction of the dopamine transporter is known to be involved in its pathogenesis. Because the dopamine transporter is regulated by Zn, Zn deficiency may contribute to the dysfunction of the dopamine receptor and its supplementation may be required for treatment and/or as an adjunct to the psychostimulants(Reference Lepping and Huber236). Lepping & Huber(Reference Lepping and Huber236) have proposed to test their hypothesis by recruiting Zn-deficient ADHD patients who will undergo PET with the [11C]raclopride displacement method to investigate whether Zn increases extracellular dopamine levels.
Later in life, PET could be used to study the effects on brain functioning and metabolism of nutrients thought to be efficacious in maintaining, preventing or reversing cognitive decline among the elderly. The ability to avert, or at least reduce, the rate of cognitive decline in the elderly would be enormously beneficial to public health. The most common form of cognitive decline in the elderly is AD. The global presence of this condition is expected to increase considerably over the next few decades, resulting in overwhelming demands for socio-economic and medical resources(Reference Ferri, Prince and Brayne237). Although various forms of therapeutic interventions have been used in AD, no treatment has proven capable of curing or remitting the progression of the disease. The clinical demonstration of potential treatments is arduous since it necessitates large study populations and long-term follow-up. PET analyses may offer cost–benefit options to evaluate alternative therapies. For example, emerging science has indicated that regional cerebral glucose hypometabolism as measured by 18FDG-PET reflects cognitive decline associated with ageing(Reference Cunnane, Nugent and Roy238, Reference Pietrini, Rapoport, Coffey and Cumming239) and dementia, such as AD(Reference Pietrini, Alexander and Furey240). Hence, treatments that attempt to reverse or retard the course of illness by enhancing glucose utilisation of neurons, which can be assessed by PET with the FDG radiotracer, may prove efficacious.
In the future, PET analyses may represent an important tool in evaluating the effects of nutrient deficiencies and supplementation on neurotransmission, glucose uptake and blood flow underlying the pathological conditions.
Methodological limitations and recommendations of relevance to intervention studies
Developing models for interpreting findings of positron emission tomography analyses
Most of the radiotracers used for PET have relatively short half-lives. For example, the half-lives for radiotracers of carbon and oxygen are 20 and 2 min, respectively(Reference Wong, van der Westhuizen and Coleman222). As a result, PET radiotracers must typically be produced at the same site as the PET scan activities in order to avoid losing most of the radioactivity. Radiotracers are produced by cyclotrons, machines that are extremely expensive and bulky, and require radioactive shielding. Hence, PET scans are also limited in availability. In contrast, recent developments in radiotracers have provided products with longer half-lives that permit the possibility of PET scan usage in facilities without cyclotrons.
Data obtained with PET are typically subjected to a set of processing steps to yield useful information. PET follows the progress of the tracer by measuring the amounts of radioactivity in different areas of the brain as well as the tracer concentrations in the blood. These dual datasets are subjected to mathematical or statistical modelling methods for interpretation. For example, mathematical representations of physiological processes such as the metabolism of neurotransmitters are used to develop mathematical equations describing the tissue response curve expected in the measurements. The tissue response curve plots the radioactivity of specific parts of the brain before, during and after the radiotracer injections. By identifying those variables in the model that give the best agreement between the expected and measured values, the physiological processes can be quantified.
Correcting for partial volume errors
Compared with structural imaging (e.g. MRI), PET images are blurred due to the limited resolution of the scanners (i.e. inability to distinguish between closely spaced regions of small dimensions). This may result in two consequences: (1) an apparent loss or spill-out of radioactivity signals from a small region of interest into the adjacent tissues due to the size of the small brain region compared with the spatial resolution of the scanner, or (2) spill-in of radioactive signals into the regions of interest from adjacent brain areas with different radioactivity tracer concentrations. The latter are known as partial volume errors. Corrections for partial volume errors involve computer simulations to mimic the effect of limited spatial resolution in order to characterise the partial volume effects for each brain region. This information allows the application of correction factors to obtain more accurate estimates of the actual regional activity.
PET scans are increasingly read alongside a computed tomography or MRI scan. The combination gives anatomical and metabolic information (what the structure is and what it is doing biochemically). However, the MRI–PET procedure is time consuming, technically demanding and expensive. Hence, it is not widely available and is used in limited research settings.
Single-photon emission computerised tomography imaging: anatomical, metabolic and functional assessments for nutritional research
Single-photon emission computerised tomography techniques and single-photon emission computerised tomography-derived measures
Similarly to PET, SPECT is a tomographic imaging methodology that employs γ-ray-emitting radioisotopes that are attached to ligands of interest. In SPECT imaging, however, isotopes that emit a single γ-ray photon are used. This fundamental difference from the radiotracers used in PET, which emit two photons, accounts for the principal differences in instrumentation and capabilities to measure functional brain activity. SPECT visualises the physiological or metabolic functioning of living human subjects, and it is mainly used to measure blood perfusion and neurotransmitter distribution in a variety of physiological conditions and in neuropsychiatric disorders.
The principal radiotracers currently used in SPECT assess neural activity by measuring rCBF, although radiotracers to assess the characteristics of several neuroreceptor systems, including the cholinergic, dopaminergic and serotoninergic systems, have also been developed(Reference Eckelman, Grissom and Conklin241, Reference Kung, Ohmomo and Kung242). The most commonly used radiotracers to measure rCBF in SPECT include [99mTc]hexamethylpropyleneamine and [99mTc]ethyl cysteinate dimer. The radiotracer [123I]isopropyl iodoamphetamine has also been widely used to measure rCBF with SPECT. Although employed initially in non-tomographic imaging, the use of Xe-133 has continued with SPECT. With a relatively fast clearance, this particular radiotracer allows for multiple scans in the same SPECT session, but offers a relatively low spatial resolution(Reference Newberg, Alavi and Payer243). With the implementation of multiple-head SPECT cameras, sensitivity and spatial resolution have significantly improved. However, SPECT continues to have a lower spatial resolution than PET and has a greater difficulty in identifying deep brain structures.
In general, compared with positron-emitting tracers in PET, the radioisotopes in SPECT emit lower-energy photons (i.e. 80–159 keV). These are more susceptible to attenuation as the photons travel through tissue, especially in deeper brain structures. Thus, brain structures similar to the basal ganglia, which are farther from the detector surface, have a poorer resolution than cortical brain regions. This, in combination with the complexities in modelling tracer behaviour, makes full regional quantification of absolute rCBF difficult in SPECT. In practice, which is also often the case with PET, regional tissue counts in the cortex are typically referenced to global tissue counts or relatively preserved brain regions (e.g. cerebellum) to provide a semi-quantitative measure of cerebral perfusion.
As with PET, SPECT imaging of the brain involves two essential steps: (1) the administration of a radiotracer and (2) the use of a tomographic scanner to measure the regional distribution of the radiotracer in the brain. In SPECT, as in PET, scintillation crystals are used to detect the radioactivity emitted from the tracers. Since the emitted photons travel in all directions, SPECT depends on the use of collimators to determine the point of origin of the emitted photons and to localise the regional brain activity. These collimators are in the form of lead septa that are positioned in front of the scintillation crystal detectors. The apertures created between the septa serve to limit the exposure of the crystals to γ-ray photons that are arriving at a nearly perpendicular angle to the crystal surface. In PET, such septa are employed for two-dimensional image acquisition, but can be retracted in the new three-dimensional image scanners.
Furthermore, the radioactive half-lives of 6 h for 99mTc and 13 h for 123I, as well as the relatively slow washout of the high-resolution tracers, such as [99mTc]hexamethylpropyleneamine and [123I]isopropyl iodoamphetamine, significantly limit the ability to perform multiple scans to assess rCBF under different test conditions during the same scanning session.
Importantly, the greater ease of production and the potential for longer storage of these radiotracers, compared with the positron-emitting radiotracers used in PET, provide the advantage of eliminating the need for an on-site cyclotron. Despite the technical limitations of SPECT relative to PET, the wide availability and lower cost, combined with the ability to detect regional reductions in cortical perfusion with a spatial resolution that can approach that of PET, have made its use more popular in clinical assessments of neurodegenerative diseases in recent years. For detailed reviews of the procedures and technical considerations for SPECT, see the works of Devous et al. (Reference Devous, Stokely, Bonte and Holman244), Juni et al. (Reference Juni, Waxman and Devous245), Masdeu et al. (Reference Masdeu, Brass and Holman246) and Van Heertum & Tikofsky(Reference Van Heertum and Tikofsky247).
Eligibility for a single-photon emission computerised tomography examination
SPECT scanning is mostly used for clinical purposes only, mainly in adult patients. It is considered impractical to use this approach in healthy children and adolescents primarily for reasons of radiation safety.
Use of single-photon emission computerised tomography in nutritional studies
SPECT shares clinical and research applications, limitations and methodological aspects with PET. Indeed, SPECT scanning has been mainly exploited for the possibility of assessing cerebral perfusion changes related to nutritional abnormalities. For instance, [99mTc]ethyl cysteinate dimer brain SPECT studies have revealed significant decreases in frontal perfusion in a group of patients with coeliac disease, similarly to what has been described previously in other autoimmune diseases but improvable by a gluten-free diet(Reference Usai, Serra and Marini248). Similarly to what has been described previously, SPECT has also been used for evaluating changes in neurotransmitter metabolism in patients with eating disorders or obesity(Reference Karhunen, Vanninen and Kuikka249, Reference de Weijer, van de Giessen and van Amelsvoort250) or to determine the effects of creatine nutritional supplementation in Parkinson's disease(Reference Bender, Koch and Elstner251) or vitamin B12 deficiency(Reference Bender, Koch and Elstner251, Reference Blundo, Marin and Ricci252) on brain functioning.
Methodological limitations and recommendations of relevance to intervention studies
The limitations and consideration relative to the methodological, experimental and data processing aspects that have been highlighted for PET are also valid for SPECT. As for PET protocols, but often with a lower spatial resolution and an ill-defined quantification of the activity distribution, SPECT use faces the issues of specificity and the intrinsic properties of radiotracers, the limited availability of scanners and the elaborate processing of images.
General considerations
The present review describes existing brain imaging technologies and how these have the potential to assess the effects of a nutritional intervention in human subjects. From early development to ageing, brain imaging can detect structural, functional and metabolic changes in human subjects. In addition, modifications due to altered nutrition or to additional nutritional supplementation have recently been evaluated with some of these techniques. There are two things that seem clear: first, the use of brain imaging in nutritional studies is not widespread; second, brain imaging techniques offer the promise of providing important and useful information about the effects that nutrition has on brain metabolism, structure and function. The literature reviewed here suggests that, on the whole, the brain imaging markers described can reliably reflect neurostructural, neurophysiological, neurochemical and functional cerebral changes occurring during the lifespan and potentially after nutritional interventions. Furthermore, these markers may increase our understanding of changes in brain and cognitive function associated with nutritional interventions(Reference Taki, Hashizume and Sassa66, Reference Lucas, Gore and Cole67, Reference Isaacs, Fischl and Quinn69, Reference Bowman, Silbert and Howieson76, Reference Smith, Smith and de Jager84, Reference Akitsuki, Nakawaga and Sugiura94, Reference Ruxton137, Reference Lorist and Tops145, Reference Kennedy and Haskell209, Reference Wightman, Haskell and Forster211–Reference Jackson, Reay and Scholey213, Reference Hinton, Parkinson and Holland231, Reference Nugent, Croteau and Pifferi232, Reference Usai, Serra and Marini248, Reference Bender, Koch and Elstner251, Reference Blundo, Marin and Ricci252). Significant effects of a short-term intervention with foods and nutrients have been demonstrated using MRI, EEG, NIRS and PET in adults, including sex effects, and special populations such as athletes(Reference Fontani, Lodi and Migliorini156, Reference Del Parigi, Chen and Gautier172, Reference Gautier, Chen and Salbe223–Reference Small, Silverman and Siddarth226). Moreover, significant effects of a long-term intervention (i.e. months) with foods and nutrients have been demonstrated by these techniques in infants and children, as well as in elderly subjects(Reference Isaacs, Morley and Lucas3, Reference de Jager and Kovatcheva12, Reference Birch, Birch and Hoffman153–Reference Birch, Garfield and Hoffman166). Due to the relative infancy of most of these technologies, for the vast majority of imaging measures, little information is available regarding their correlation with functional endpoints in healthy subjects. Therefore, in the general healthy population, the use of imaging markers as surrogates for functional endpoints is not well developed and for most markers it is inappropriate. The key added value of these measures for human nutritional intervention studies is their opportunity to provide unique in vivo information on the working mechanism of the intervention.
Although imaging techniques are capable of providing new and reliable information on brain structure and function, it must be remembered that they have their limitations and caution must be exercised, particularly when interpreting negative results. Finding no imaging changes may indicate that the intervention has had no effect on brain structure and/or function. An equally valid conclusion, however, may be that the imaging methodology is not sensitive enough to reveal changes that have in fact occurred. In addition, while behavioural measures of cognitive function in longitudinal studies are often subject to, for instance, relatively large practice effects that may complicate the interpretation of results, many imaging measures are not. Finally, functional brain imaging techniques provide parametric continuous variables with a high resolution of values, whereas behavioural tests provide only non-parametric ranking variables that might be incapable of discriminating slight effects of the intervention. However, the computerised psychophysical tests of attention, memory, etc. provide continuous variables of cognitive performance (reaction time, response time and accuracy). It should also be stressed that these studies tend to show a large inter-individual and inter-group variance and that the brain imaging markers are acceptable for use at a group level but not yet at an individual level. This conclusion suggests the need for further investment to develop more precise and effective guidelines for the standardisation, harmonisation and qualification of data collection and its analysis in nutritional intervention studies. This may shorten the time for obtaining final conclusions about the effects of the intervention.
Hypothesis tested regarding the mechanism of action of the intervention
Because of the limited number of existing reports, we describe the types of studies that could usefully employ the imaging methods described above to examine the effects of a nutritional intervention on the brain. The choice for most appropriate measures depends on the hypothesis regarding the mode of action of a nutritional intervention on brain function (i.e. on which neurostructural, neurophysiological and neurochemical changes are expected due to the intervention). Combination of various imaging measures of different phenomena of the hypothesised working mechanism can provide complementary information and strengthen hypothesis testing. For example, de Wilde et al. (Reference de Wilde, Kamphuis and Sijben253) reviewed the potential of imaging modalities to test the hypothesis that a nutritional intervention increased the formation of new neuronal membranes and therewith synapse formation and function in AD. To test this specific hypothesis, MRS can be employed to study membrane-related compounds, cerebral metabolic rate of glucose by FDG-PET can provide insights into synaptic functioning and density, and structural MRI can be used to study long-term effects on atrophy rate, while EEG and MEG might be useful to study functional connectivity.
Level (structural, metabolic or functional) and anticipated timescale of the intervention's effects
In this regard, the intrinsic temporal and spatial resolution of the different brain imaging techniques will determine the choice of technique. For example, structural MRI would not be appropriate in an acute intervention context (i.e. single-dose administration or few days of administration). However, these techniques could be included in the general assessment of the experimental subjects if the experimental purposes imply the exclusion of elderly people with preclinical neuropathological processes as indexed by abnormal cortical grey matter, white substance, hippocampus volume, vascular load and so forth. Furthermore, validation of a nutritional intervention in terms of structural MRI effects may yield especially strong evidence in favour of a nutrient, as structural effects may be expected to have long-term consequences on CNS function.
Target population and ethical restrictions
Most of these imaging techniques are non-invasive and are ethically suitable for use in almost any population throughout the lifespan. However, some can be limited in their use, and this should be addressed during study design to seek alternative imaging markers. For example, PET techniques can be extremely useful in examining the effects of nutritional interventions on brain metabolism and CBF in human subjects. However, there are ethical restrictions for their use in healthy subjects and these techniques are not suitable for infants and children.
Availability and costs of the techniques
Some promising procedures might not be viable due to the lack of current availability (i.e. MEG, NIRS or PET) or relatively high costs of their use (i.e. PET and MRI). These aspects may be relevant in the case in which the study plan implies the recruitment of a large number of control and experimental subjects.
Conclusion
In the present review, we have provided a comprehensive overview of brain imaging markers that have potential utility in nutritional intervention studies examining CNS and cognitive function in healthy human subjects. We have described multimodal MRI, as well as EEG/MEG, NIRS, PET and SPECT techniques, with a focus on the biological relevance of their outcome measures, the practical use and feasibility of the techniques, and the recommended use in terms of acute v. chronic nutritional intervention studies. In general, brain imaging markers for nutritional intervention studies can be considered as specific for one or several brain processes and as surrogate instrumental endpoints. They are also suitable to build up translational models to be used in both animals and human subjects to validate preclinical research. However, these markers cannot be considered as a substitute of clinical endpoints in terms of cognitive or behavioural response to a task or challenge. Furthermore, some brain imaging markers can be linked to a broader functional outcome, such as cognition, behaviour or wake–sleep cycle, but they certainly do not replace the overall capacity of the brain to behaviourally respond to a specific situation and stimuli that should remain the essential endpoints. The best way to evaluate the effects of food and nutrients on the CNS is to use a proper panel of structural and functional brain imaging markers and of behavioural, psychophysical and clinical (if any) endpoints, in line with the specific working hypotheses on the neural mechanism of action of the intervention. In this framework, the correlation between brain imaging markers and behavioural/psychophysical measurements represents an important aspect of the data analysis design to probe the sensitivity of these neuroimaging markers to the effects of the intervention at an individual level. An ideal view is that international consensus guidelines will be developed in the near future for the use of the appropriate brain imaging techniques for nutritional intervention studies in healthy human subjects. This would be a very promising platform for increasing the use of these markers in future nutritional intervention studies.
Acknowledgements
The present study was conducted by an expert group of the European Branch of the ILSI (ILSI Europe). The expert group received funding from the ILSI Europe Nutrition and Mental Performance Task Force. Industry members of this task force are listed on the ILSI Europe website at http://www.ilsi.eu. For further information about ILSI Europe, email info@ilsieurope.be or call +32 2 771 00 14. The opinions expressed herein and the conclusions of this publication are those of the authors and do not necessarily represent the views of ILSI Europe or those of its member companies. Declaration of interest statement: E. A. d. B. is an employee of Unilever; M. H. M. and R. J. W. are employees of DSM; J. M. is an employee of Pfizer Consumer Healthcare; J. W. S. is an employee of Danone Research, Centre for Specialised Nutrition. C. B., E. B. I., D. O. K., P. P., S. V. S. and K. B. W. received an honorarium from ILSI Europe for their participation in this publication and/or reimbursement of their travel and accommodation costs for attending the related meetings. M. E. L. is employed by ILSI Europe. L. S. J. was formerly employed by ILSI Europe. All authors contributed to the discussions, gave inputs for writing the paper and reviewed and approved the content of the final manuscript.
This paper was published as a supplement to British Journal of Nutrition, publication of which was supported by ILSI Europe. The paper has undergone the standard journal formal review process and may be cited.


 Open access