


1. INTRODUCTION
The correct interpretation of microstructure and crystallographic preferred orientations (CPOs) in terms of deformation mechanisms and flow properties is critical in understanding the bulk behaviour of polycrystalline ice in glaciers and ice sheets. This relies on the patterns and strength of the CPO together with grain size and distribution of impurities (Hooke and others, Reference Hooke, Dahlin and Kauper1972; Moore, Reference Moore2014). In pure ice, a commonly accepted view is that it behaves like a non-Newtonian fluid, dominantly controlled by ‘grain-size insensitive’ creep mechanisms, such as dislocation glide and climb (de Bresser and others, Reference De Bresser, Peach, Reijs and Spiers1998). However, this simplification discounts the complex stress and strain partitioning processes that may occur within ice containing included debris and micro-particle content (Alley and others, Reference Alley, Perepezko and Bentley1986; Fisher and Koerner, Reference Fisher and Koerner1986; Li and others, Reference Li, Jacka and Morgan1998; Eichler and others, Reference Eichler2017), or dust and soluble-ion concentrations (Thorsteinsson and others, Reference Thorsteinsson, Waddington, Taylor, Alley and Blankenship1999; Durand and others, Reference Durand2006). The microstructural complexities associated with interpreting ice with solid inclusions is due primarily to the coupled roles of extrinsic (stress and temperature) and intrinsic (physical components within the ice mass), which lead to heterogeneous strain accommodation across ice masses (Thorsteinsson and others, Reference Thorsteinsson, Kipfstuhl and Miller1997). In impure ice containing rheologically differing phases, extrinsic and intrinsic factors (e.g. proportion of and stress portioning into second phase, phase connectivity, ductility) are coupled (Alley and others, Reference Alley, Perepezko and Bentley1986). This means that deformation will be recorded differently between pure and impure ice forms, which Shoji and Langway (Reference Shoji and Langway1988) argue is primarily controlled by the orientation strength of [c]-axes. In nature, this may be further complicated where variable strain rates are superimposed on a pre-existing grain structure by faster flowing portions of a glacier or ice sheet.
In most of today's large-scale ice-sheet numerical models, ice is treated as a single constituent or homogeneous material where the flow laws are employed throughout the entire ice sheet (e.g. Alley, Reference Alley1992; Gagliardini and others, Reference Gagliardini2013; Martin and others, Reference Martin, Gudmundsson and King2014). However, this simplification is not confirmed by observations, as borehole closures and tilt measurements in many ice sheets can be correlated with second-phase content (Fisher and Koerner, Reference Fisher and Koerner1986), and also to changes in CPOs (Shoji and Langway, Reference Shoji and Langway1984; Tison and others, Reference Tison, Thorsteinsson, Lorrain and Kipfstuhl1994). CPOs have also been included in some glacier or ice-sheet numerical models relating strain and fabric evolution (e.g. Castelnau and others, Reference Castelnau1998; Gillet-Chaulet and others, Reference Gillet-Chaulet, Gagliardini, Meyssonnier, Zwinger and Ruokolainen2006; Pettit and others, Reference Pettit, Thorsteinsson, Jacobson and Waddington2007; Martin and others, Reference Martin, Gudmundsson, Pritchard and Gagliardini2009); although plausible these have been incompletely verified by experimental observations. It is known that ice sheets are complex as they have high strain rates at the lateral and basal margins, which may contain entrained debris, formed under stress conditions much different than the fairly well-studied ones near ice divides (Thorsteinsson and others, Reference Thorsteinsson, Kipfstuhl and Miller1997; Tison and others, Reference Tison, Thorsteinsson, Lorrain and Kipfstuhl1994). Therefore, there are significant challenges remaining as there are few experimental studies that offer direct information about rheology, microstructure and CPO changes across a strain gradient and particularly if the ice contains a dispersed second phase. There are also conflicting views on the role played by particulate second phases on the creep behaviour of ice (Table 1). This leads to major uncertainties as to the validity of microstructural interpretations of particulate distributions within ice cores.
Examples of some previous laboratory observations on the role of particulate second phases on ice creep behaviour
The variations in creep rates in many of these earlier studies are the result of particulate grain size or compositional differences between samples and variable inclusion concentrations.
Cyclic or non-steady state deformation involving changing differential stresses or oscillations in the strain rate gradients are also likely to be common in nature (Kamb and Engelhardt, Reference Kamb and Engelhardt1987; Joughin and others, Reference Joughin, Smith, Howat, Scambos and Moon2010), even though most ice experimental studies have involved constant load or strain rate experiments (e.g. Durham and others, Reference Durham, Kirby, Heard, Stern and Boro1988; Dahl-Jensen and others, Reference Dahl-Jensen, Thorsteinsson, Alley and Shoji1997; Jacka and Li, Reference Jacka, Li and Hondoh2000; Piazolo and others, Reference Piazolo, Wilson, Luzin, Brouzet and Peternell2013). To date there are few experimental comparisons (e.g. Peternell and Wilson, Reference Peternell and Wilson2016) involving fluctuations in strain rate, in which the instantaneous strain rate may exceed the average strain rate. These experiments give some insight into more complicated histories (Bindschadler and others, Reference Bindschadler2013). Similarly the effect of strain rate and initial grain size in pure ice may influence primary creep rates, whereas subsequent tertiary creep appears to be unaffected by the initial grain size (Duval and Le Gac, Reference Duval and Le Gac1980). However, there is still a lack of data on grain size effects in ice containing dispersed phases, which can be explained by arguments related to the operation of dislocation mechanisms rather than from elastic anisotropy (Schulson and Duval, Reference Schulson and Duval2009).
To investigate the effect of coupling a second phase to variations in strain rate, we will compare a series of 3-D and 2-D in situ experiments (Fig. 1) involving pure ice and ice containing rheologically soft and rigid particles. In the 2-D experiments, a comparison will also be made between ice flowing at a constant strain rate to short-term cycling events and their feedback into grain size and CPO development. In all experiments, we have synchronously and continuously recorded strain distributions, CPO and grain size evolution at incremental strains up to 20% shortening.
Schematic illustrations showing the deformation set-up in the 3-D and 2-D experiments. (a) The Kowari instrument configuration for 3-D neutron diffraction and CPO analysis. Insets show deformed ice sample, from an initial sample that had a diameter ~2.5 cm, length ~3.2–4.0 cm and ice diffraction pattern. (b) Sketch of G50 fabric analyser. (c) Sketch of 2-D deformation press with outer covers and upper halves of anvils removed for clarity.

2. METHODS
All experiments (Table 2) have used a matrix of deuterated ice (D2O), as this allows quantitative in situ neutron diffraction and grain size analysis during deformation. D2O has the same crystal structure, similar mechanical properties, and deformation behaviour as H2O ice (Petrenko and Whitworth, Reference Petrenko and Whitworth1999; McDaniel and others, Reference McDaniel, Bennett, Durham and Waddington2006; Wilson and others, Reference Wilson, Peternell, Piazolo and Luzin2014; Middleton and others, Reference Middleton, Grindrod and Sammonds2017). Undeformed samples of deuterated ice were prepared by crushing and mixing 180–250 µm sieved ice particles with liquid D2O at −10 to −5°C within moulds. Air bubbles are mechanically expelled by stirring the mixture and excess water removed by lightly compressing the sample prior to freezing and annealing for a month at −10°C. The microstructure in the pure ice is dominated by polygonal grains with straight grain boundaries, a low porosity, mean grain size ~400–300 µm (Fig. 2a). Fabric analysis revealed [c]-axis fabrics of the undeformed ice (e.g. Figs 2a, 3a, 4a) was close to random with minimal intracrystalline distortion within the grains.
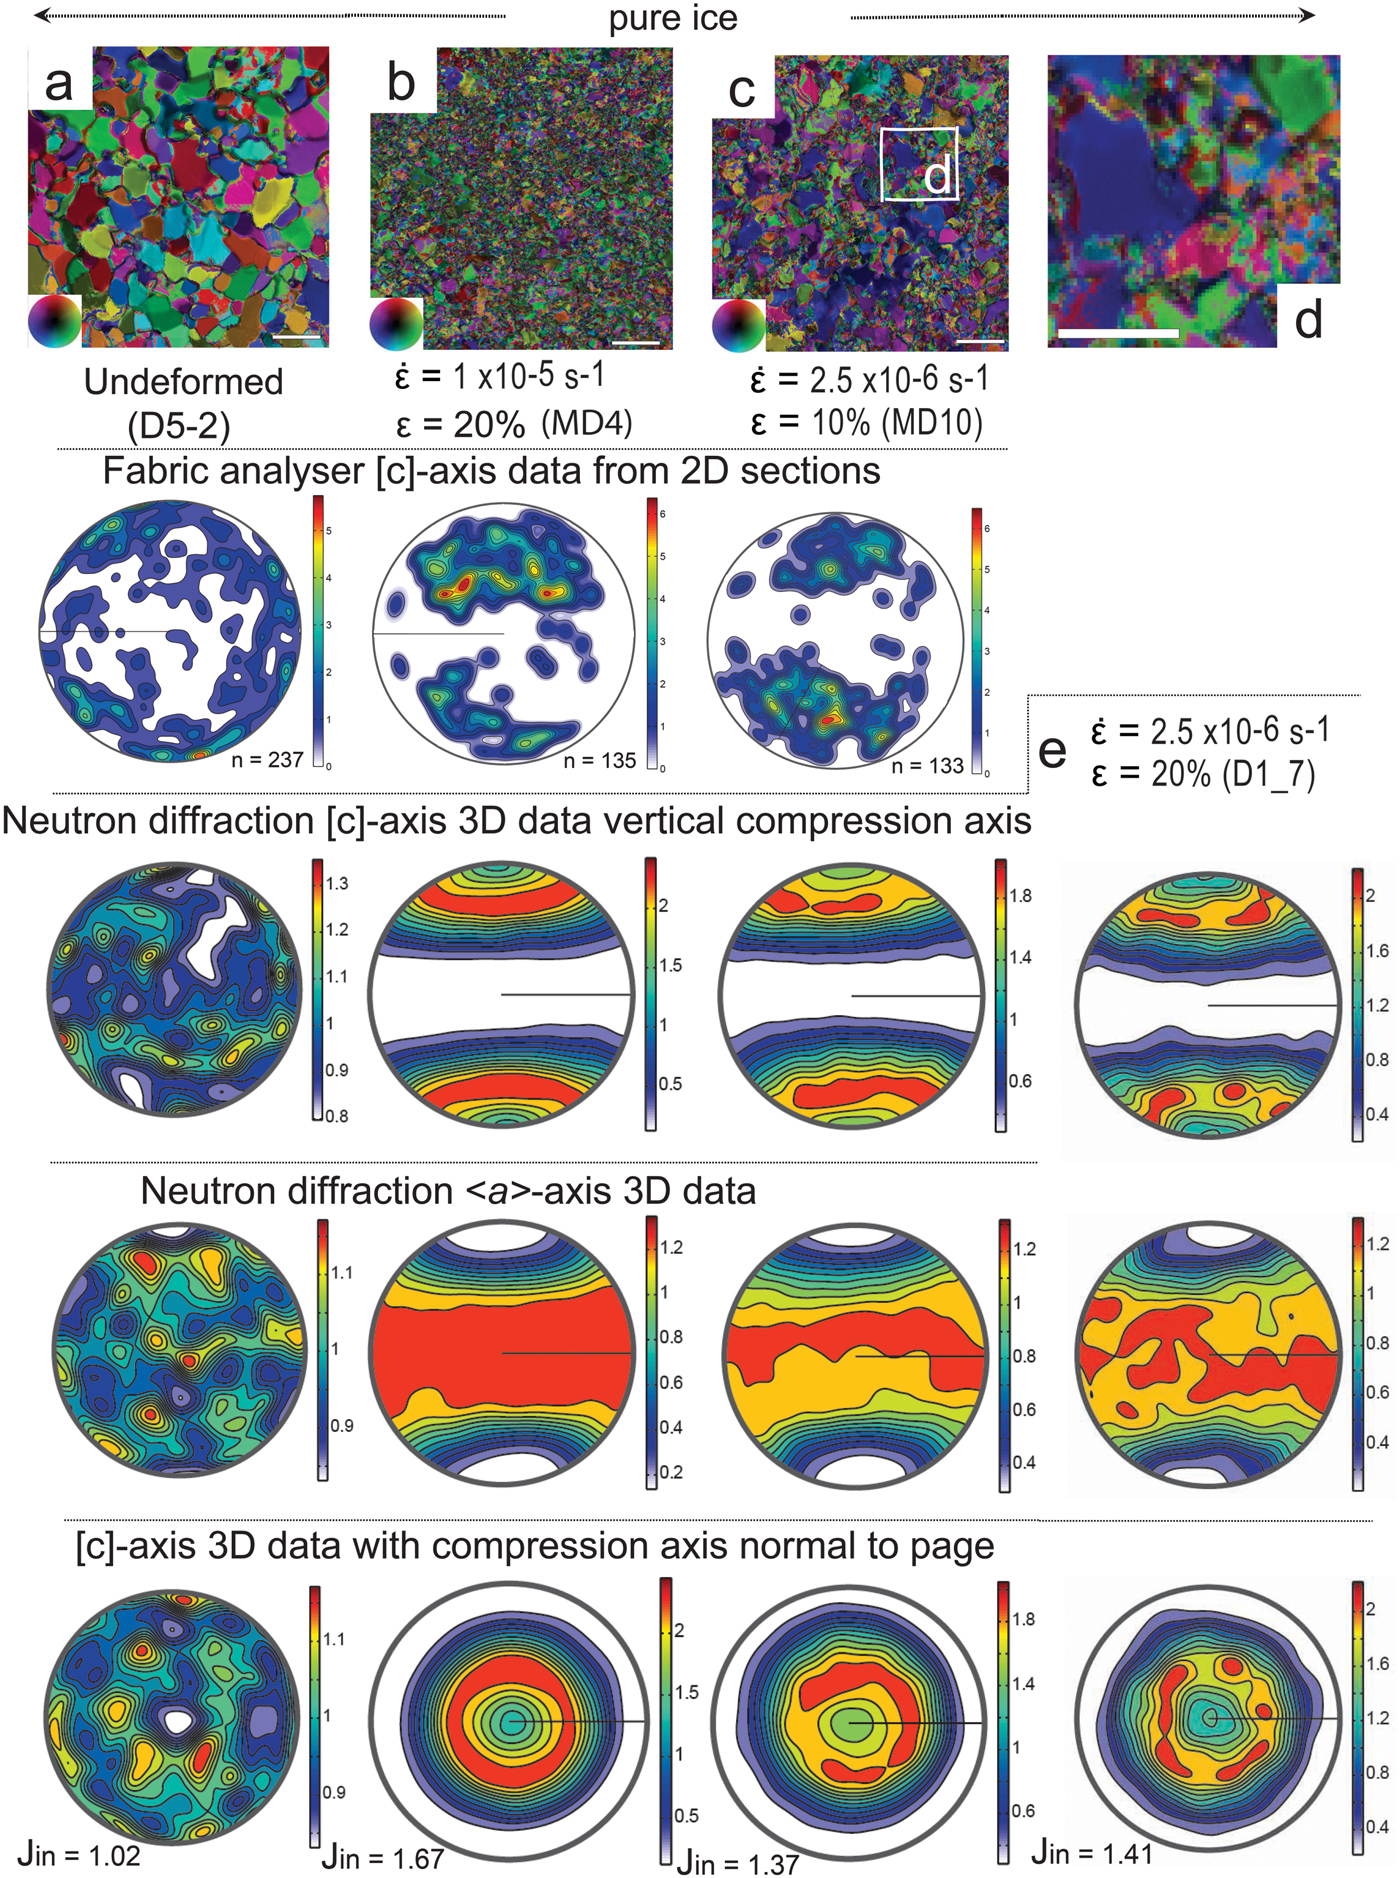
The starting and final microstructures and CPO characteristics in deuterated ice samples deformed at −7°C. (a–c) Axial distribution analysis (AVA) images showing microstructures before (undeformed) and after a vertical shortening (ε) of 20%, at strain rates ( $\dot{\varepsilon} $) of 1 × 10⁻⁵ s−1 (fast) and 2.5 × 10⁻⁶ s−1 (medium). Bar scale = 1 mm = 1000 µm. Inset shows different colours indicating [c]-axis orientation with respect to vertical compression axis. The vertical columns show the [c]-axis patterns obtained from the corresponding sample using a G50 fabric analyser, where n is the number of measurements from individual grains plotted as equal-area lower hemisphere projections. Under the fabric analysis, data are the corresponding neutron diffraction [c]- and <a>-axis distributions in relationship to a vertical compression direction. The neutron diffraction data are contoured to multiples of uniform distribution. Minima and maxima of density are indicated to the right of each pole figure with the J-index indicated for the overall textures (based on ODF). (d) Enlargement of region in (c) illustrating bimodal grain size distribution. Bar scale = 0.5 mm. (e) Neutron diffraction data obtained from D1_7, no fabric or microstructural data are shown as sample was annealed after texture analysis.
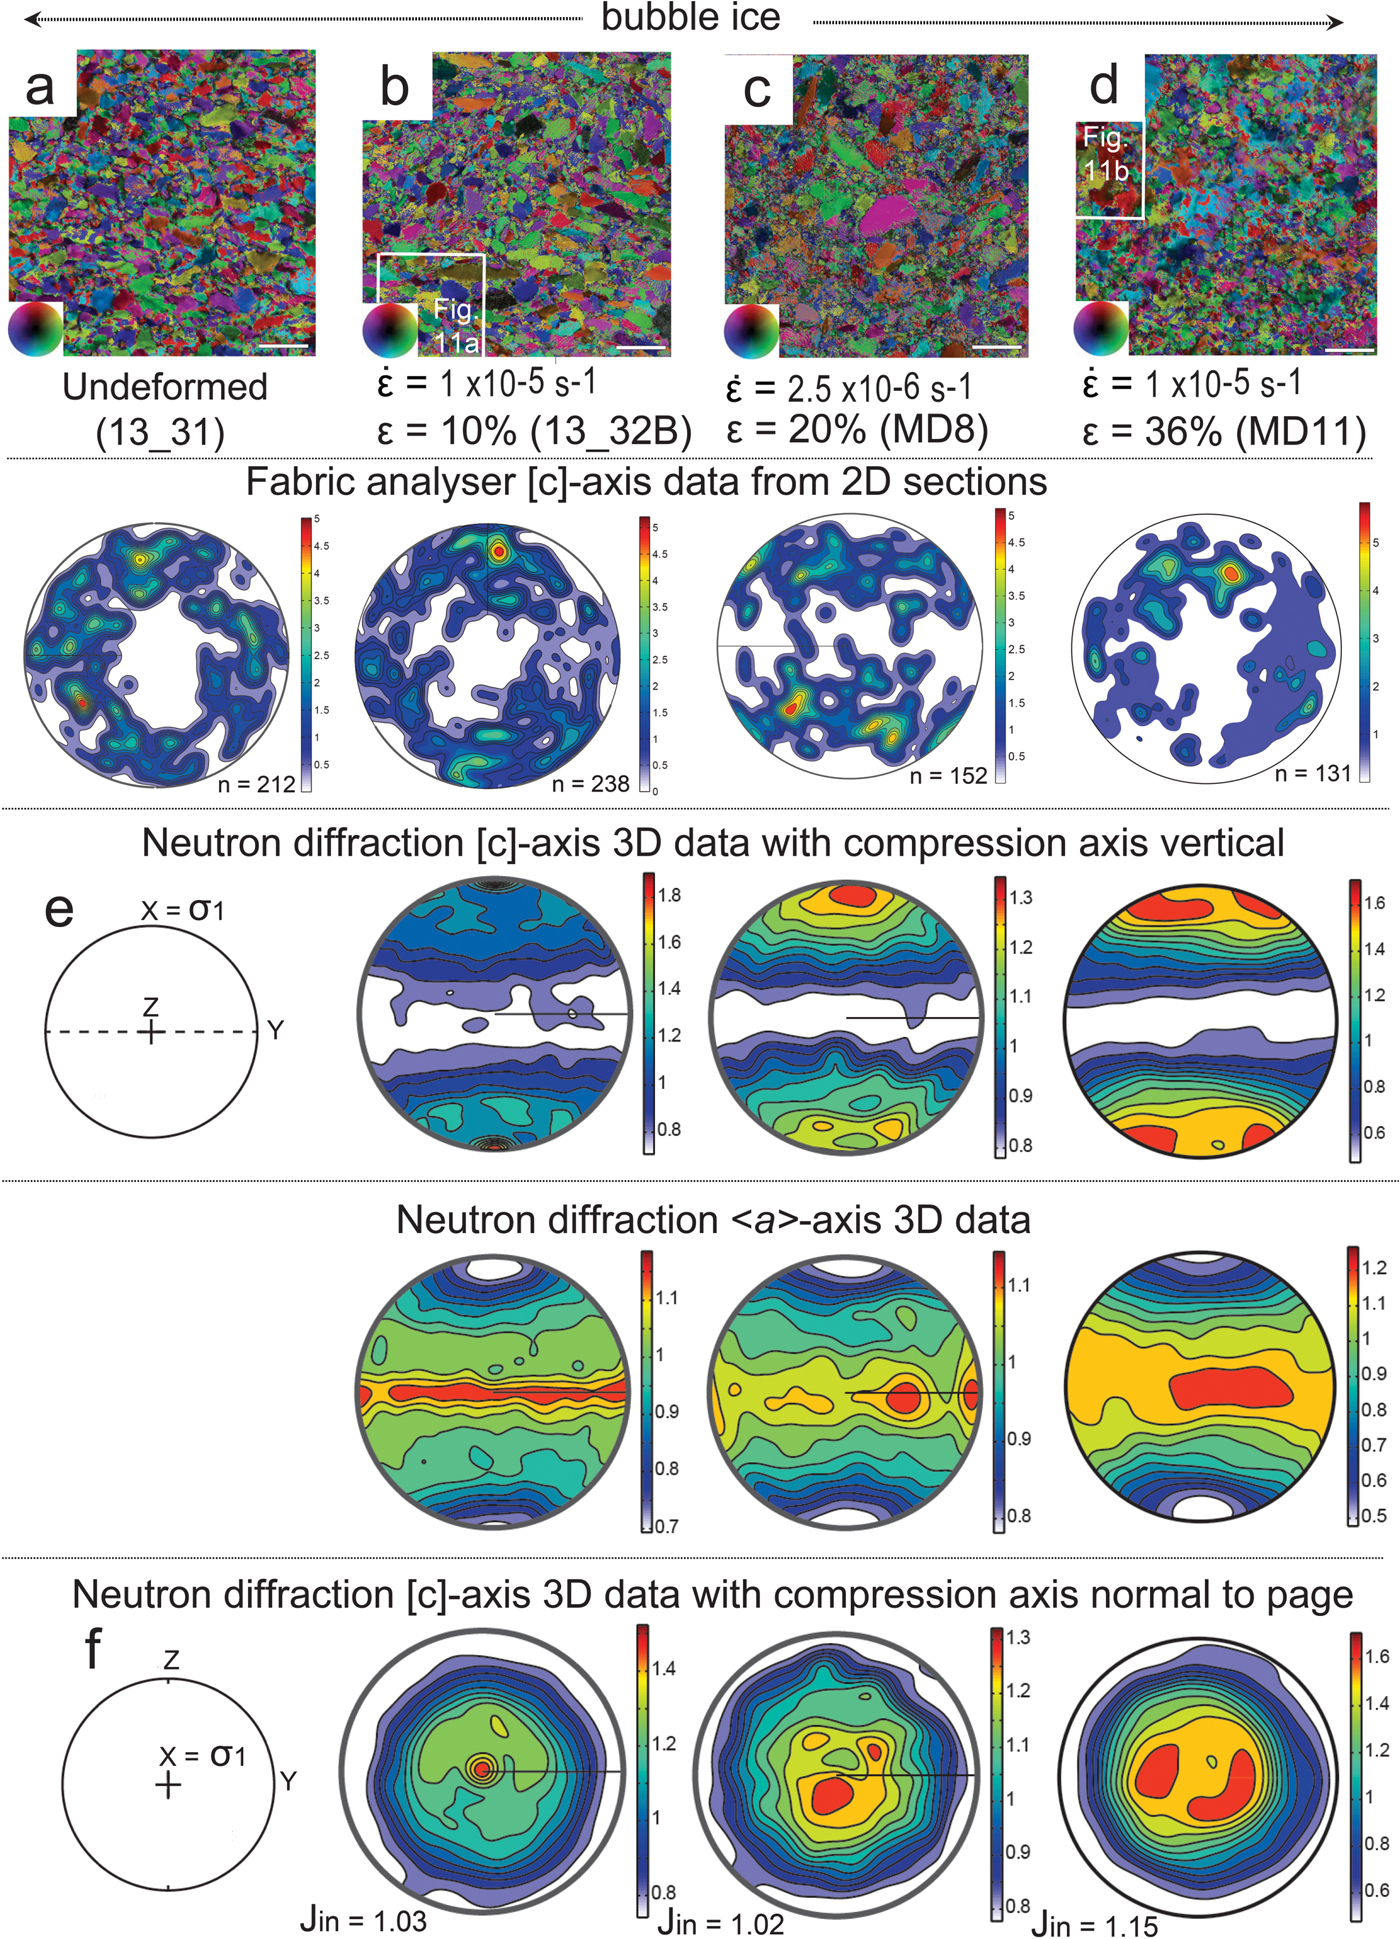
The starting and final microstructures and CPO characteristics in deuterated bubble ice samples deformed at −7°C. (a–d) Bubble ice samples. (e–f) Geometric coordinates for deformation X (compression axis), Y = Z (lode plane normal directions). (a–d) Axial distribution analysis (AVA) images showing microstructures before (undeformed; a) and after a vertical shortening (ε) of 10% (b, c) and 35% (d), at strain rates ( $\dot{\varepsilon} $) of 1 × 10⁻⁵ s−1 (fast) and 2.5 × 10⁻⁶ s−1 (medium). Bar scale = 1 mm = 1000 µm. Inset shows different colours indicating [c]-axis orientation with respect to vertical compression axis. The vertical columns show the [c]-axis patterns obtained from the corresponding sample using a G50 fabric analyser, where n is the number of individual grain measurements plotted as equal-area lower hemisphere projections. Under the fabric analysis data are the corresponding neutron diffraction [c]- and <a>-axes distributions in relationship to a vertical compression direction. The neutron diffraction data are contoured to multiples of uniform distribution. Minima and maxima of density are indicated to the right of each pole figure with the J-index indicated for the overall textures (based on ODF). The box in (b) indicates location of Figure 11a.The box outline in (d) indicates location of bottom portion of 11b.
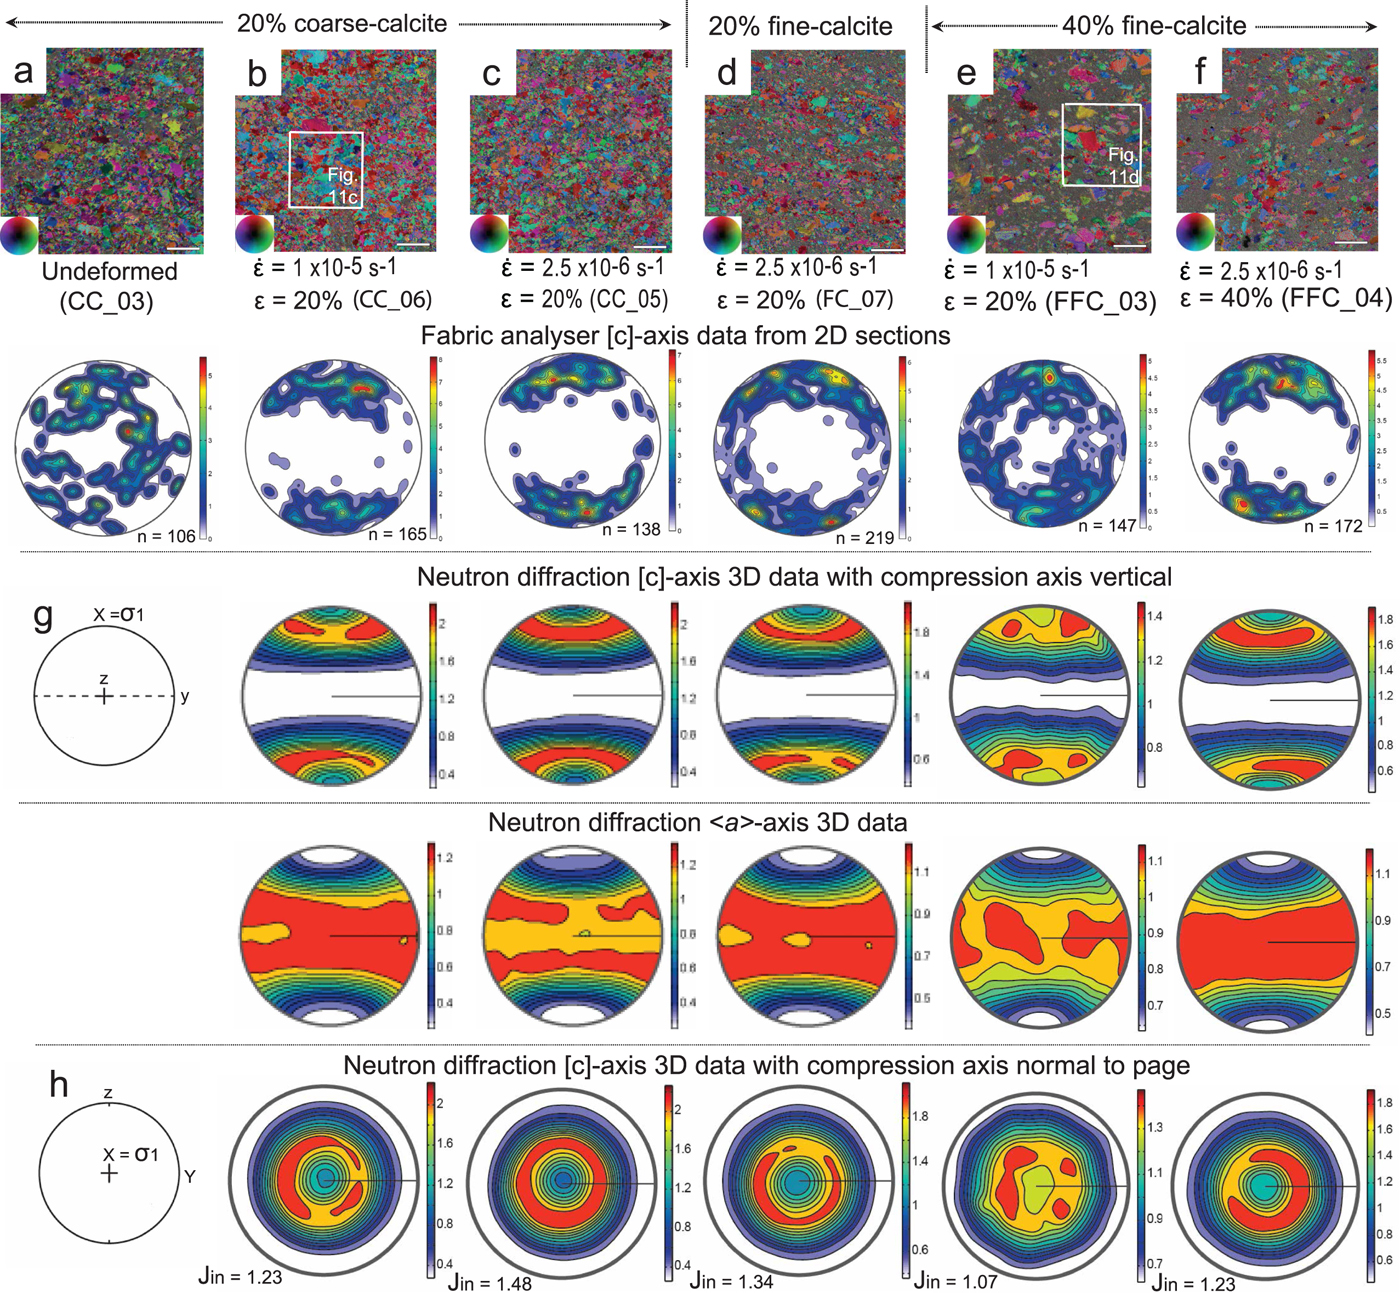
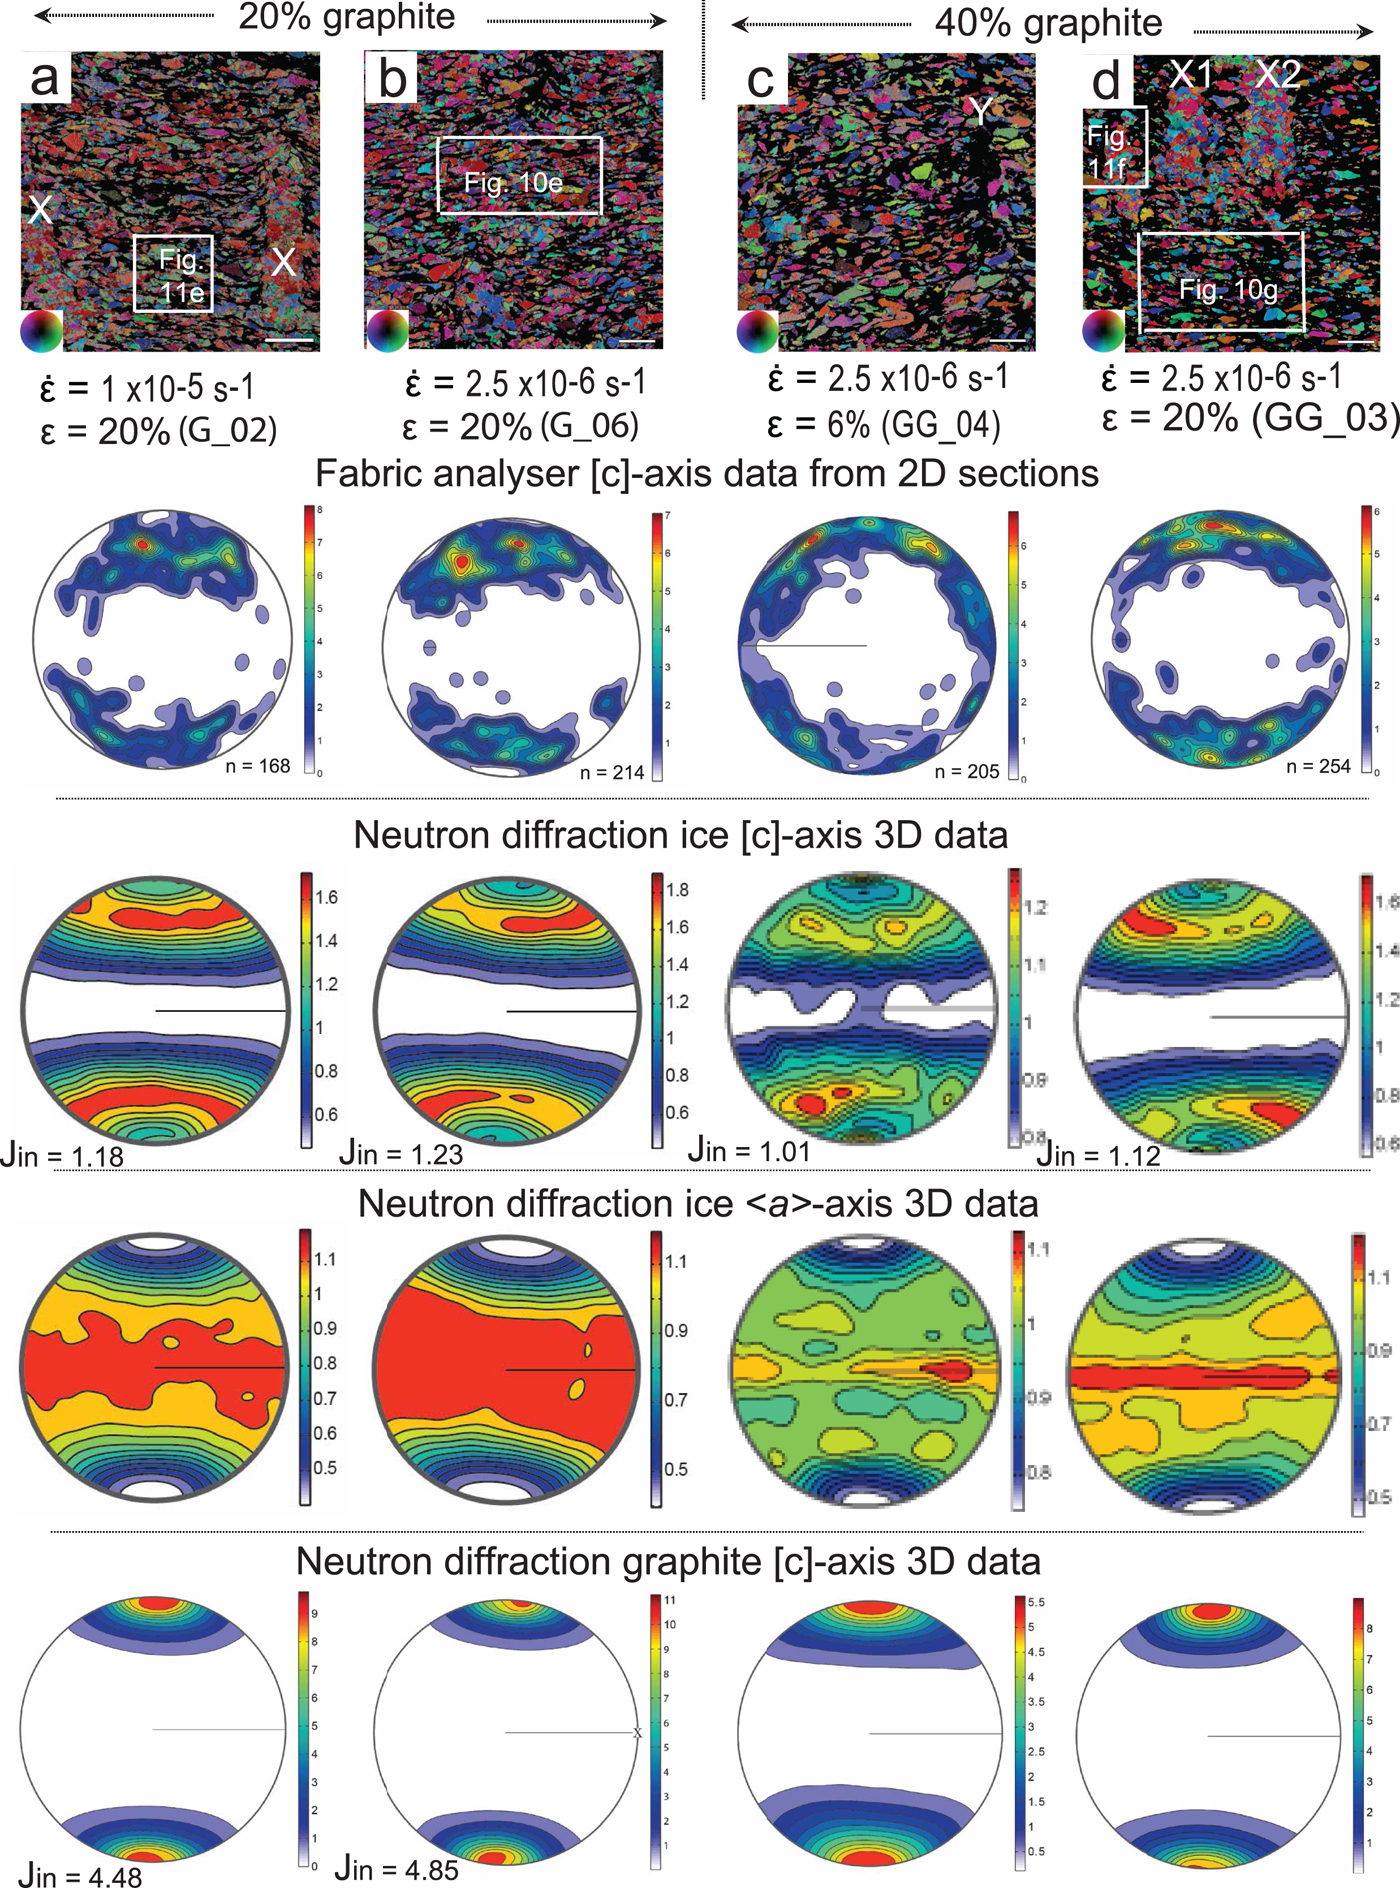
Microstructure and CPOs obtained from deformed ice–calcite mixtures. (a–f) Axial distribution analysis (AVA) images showing microstructures before (undeformed) and from samples vertically shortened (ε). Starting material contained 20 and 40 vol.% calcite in an ice matrix and were deformed at strain rates ( $\dot{\varepsilon} $) of 1 × 10⁻⁵ s−1 (fast) and 2.5 × 10⁻⁶ s−1 (medium) at −7°C. Bar scale = 1 mm = 1000 µm. Inset shows different colours indicating [c]-axis orientation with respect to vertical compression axis. The vertical columns show the [c]-axis patterns obtained from the corresponding sample using a G50 fabric analyser, where n is the number of measured grains. Under the fabric analysis, data are the corresponding neutron diffraction [c]- and <a>-axes distributions with the J-index. Minima and maxima of density are indicated to the right of each pole figure. (g–h) Geometric coordinates for deformation X (compression axis), Y = Z (lode plane normal directions). The boxes in (b) and (e) indicate location of Figs 11c and d.
Summary of experiments on deuterated (D2O) ice showing sample characteristics and deformation conditions
All experiments were conducted at −7C, which is a direct analogue for deforming H2O ice at −10C (experiment H1_1; illustrated in Fig. 7). The neutron diffraction starting grain size was calculated at 0.3% strain and changes in strain and grain sizes (Fig. 12) were obtained at specific time (minutes) intervals during an experiment. The range of optically measured grain sizes were measured from fabric analyser images.
* Grain size measured from optical image.
† Grain size measured from digitized image.
‡ Sample annealed after deformation.
For the second-phase material, we used: (1) insoluble rhombohedral-calcite powder (Fig. 4) representing a rheologically hard second phase with isotropic shape, grain diameters of >150–355 and <150 µm (most ~20 µm); and (2) graphite (Fig. 5) representing a soft, anisotropic second phase with a grain size of 355 and 150 µm. We also tested dry compacted crushed ice particles forced together within a cylindrical mould; herein known as ‘bubble’ ice (Fig. 3a). The bubble ice contained ~15 vol.% porosity defined by air bubbles; as a result of not saturating the pore spaces of crushed and sieved ice particles with liquefied D2O, prior to annealing the sample. The ice with the insoluble impurity was prepared by dispersing 20 or 40 vol.% calcite or graphite powder (Table 2), within a crushed and sieved deuterated ice fraction prior to adding D2O water. During sample preparation, it was impossible to obtain a completely uniform dispersion of the calcite or graphite between the ice particles with some areas of pure ice preserved during the stirring of the mixture and de-aeration process. In the calcite–ice mixtures, the microstructure is dominated by a bimodal population of irregular-shaped pure ice grains in a matrix of finer irregularly shaped grains (Fig. 4a). In the undeformed fine-calcite–ice samples, there is ±20 vol.% of calcite grains (grain diameter <20 µm) and the matrix ice is dominated by fine irregular grains with a grain size of ~50 µm (Fig. 4d).
Final microstructures and [c]-axis preferred orientations in ice–graphite samples. The distribution of graphite can be identified as the black areas in the micrographs. (a–d) Sample shortened 20% at fast strain rate 1 × 10⁻⁵ s−1 (fast) and of 2.5 × 10⁻⁶ s−1 (medium) at −7°C. Bar scale = 1 mm = 1000 µm. X and Y are concentrations of ice and graphite, respectively, left behind during the sample preparation process. The vertical columns show the [c]-axis patterns obtained from the corresponding sample using a G50 fabric analyser, where n is the number of measured grains. The corresponding neutron diffraction <a>-axes and [c]-axes distribution in ice and [c] distributions in graphite with the J-index, viewed with the compression axis parallel to the edge of the page. Minima and maxima of density are indicated to the right of each pole figure. The boxes in (a), (b) and (d) indicate location of Figs 11e, 10e, 11f, 10g.
Two types of in situ experiments were performed:
(1) Cylindrical samples of pure ice and ice with the second phase were deformed in an Instron 100 kN load frame while in situ neutron diffraction measurements were being performed on KOWARI at the Australian Nuclear Science and Technology Organisation (ANSTO; Kirstein and others, Reference Kirstein, Luzin and Garbe2009). The average length and diameter was ~3.2–4 × 2.5 cm, respectively, for a length to diameter ratio of ~1.5 to 1. Results from four series of deformation experiments with constant displacement rates and starting strain rates of 1 × 10⁻⁵ s−1 (named ‘fast’ experiments) and 2.5 × 10⁻⁶ s−1 (named ‘medium’ experiments) to strains of 10 and 20% (Table 2). These constant strain rate experiments are part of a series first described by Piazolo and others (Reference Piazolo, Wilson, Luzin, Brouzet and Peternell2013). Experimental temperature was set to −7°C, which is 10°C below the melting point for D2O ice. These temperature and strain rates, accessible in the laboratory, are close to the rates identified in natural ice (10−5 to −10−10 s−1; Paterson, Reference Paterson1977; Vaughan, Reference Vaughan1993). In fact, the medium strain rate used in the current set of experiments is close to the high-closure rates observed in Antarctic drill holes of 1–1.5 × 10⁻⁶ s−1 described by Thwaites and others (Reference Thwaites, Wilson and McCray1984).
Diffraction peaks of the selected materials were sufficiently different to the D2O ice allowing reliable diffraction data analysis (Fig. 1a). Using the intensity of three ice diffraction peaks (002), (100) and (101), we are able to calculate the strength of the CPO, change in grain numbers (Fig. 6) and average grain size at small strain intervals (Fig. 7). Partial pole figures from the ice grains were acquired during an experiment, over a range of different directions with respect to the sample by rotating the load frame and sample away from the compression axis (ω in Fig. 1a). The range over which ω was varied was ±35°. In this way, we could continuously monitor the textural and grain size characteristics (Matthies and others, Reference Matthies, Vinel and Helming1987). The full crystallographic orientation data were acquired after the experiment using two-circle Eurelian goniometer for the same three diffraction peaks of ice and (002) peak of graphite. We have reconstructed the orientation distribution function (ODF) from the (002), (100) and (101) ice reflections using the open source toolbox MTEX (http://mtex-toolbox.github.io/; Hielscher and Schaeben, Reference Hielscher and Schaeben2008). Calculated pole figures were constructed using a ‘de la Vallée Poussin’ kernel (half-width = 5°). The final CPO strength of ice was quantified using the J-index (Sturcken and Croach, Reference Sturcken and Croach1963; Bunge, Reference Bunge1982; Mainprice and others, Reference Mainprice, Bachmann, Hielscher and Schaeben2014). Before and during data acquisition, samples were kept at temperatures below −80°C to prevent melting and/or annealing.
Examples of grain number evaluation at different stages during the −7°C deformation of the ice samples. These numbers account for volume changes during deformation with an error in the grain number determination of approximately ±400 (see ‘Methods’ and ‘Grain size evolution’ sections for further descriptions).

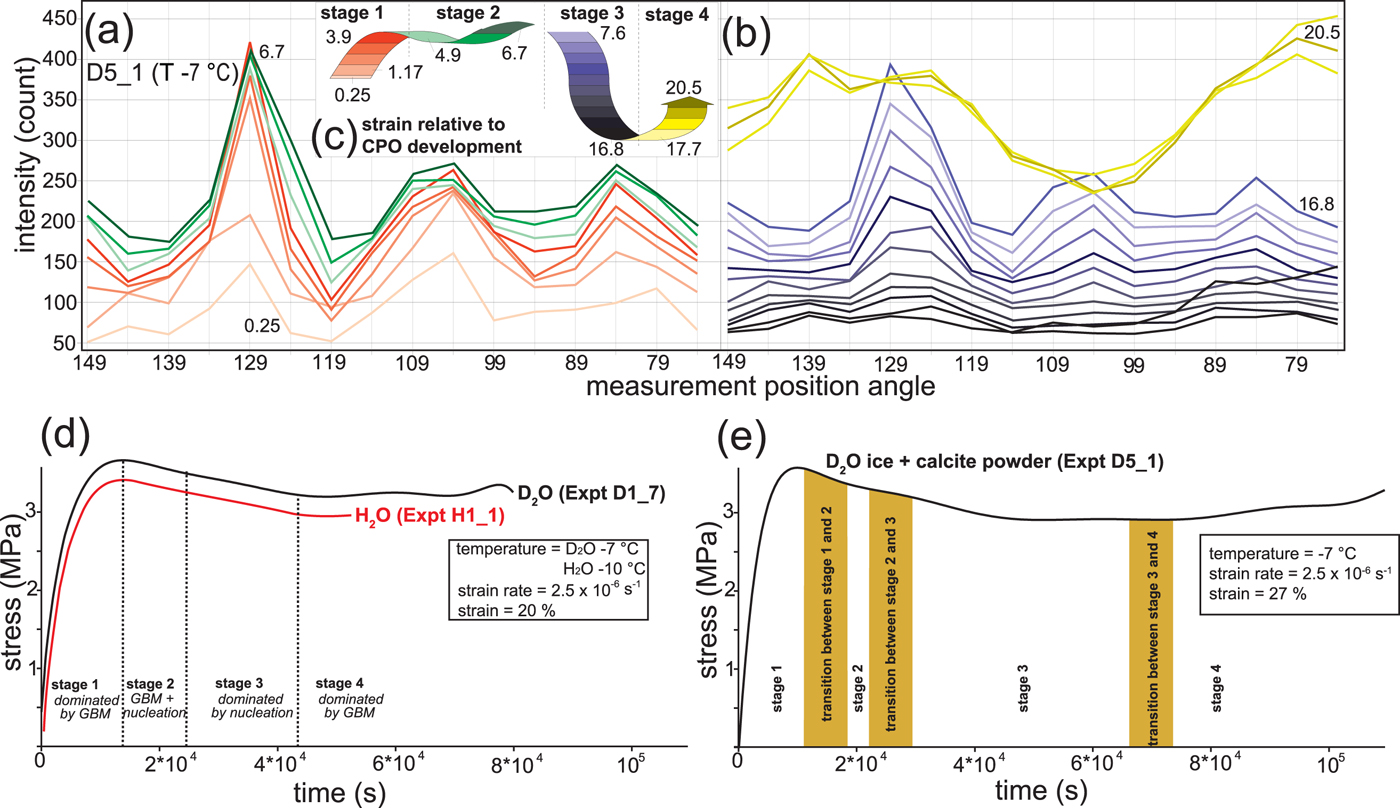
Interpretation of microstructural evolution from pole figure measurements derived from neutron diffraction measurements during a 3-D uniaxial deformation at −7 °C and a medium strain rate of 2.5 × 10⁻⁶ s−1 (modified from Wilson and others, Reference Wilson, Peternell, Piazolo and Luzin2014). (a–b) Successive intensity profiles in an ice–calcite sample (D5_1) scaled by counts for the [002] axis relative to position angle, or the number of neutrons reflected off the (002) crystallographic plane at different finite strains. Colour code shows intensity with respect to increasing strain from (a) 0.25–3.9% shortening (light red-reddish to brown colours) and 4.9–6.7% shortening (light green to dark green); (b) 7.6–16.8% shortening (light blue to grey-blue to black) and 17.7–20.5% shortening (light yellow to yellow-green). The inset (c) shows relative slope of the finite strain path with change in the intensity profile with positive slope = increase and negative slope = decrease. The relative height differences in the finite strain path represent the magnitude of the strain increments for each stage. (d) Creep curves that compare pure D2O (Experiment D1_7) with H2O ice (Experiment H1_1; after Wilson and others, Reference Wilson, Peternell, Piazolo and Luzin2014). (e) Creep curve for D2O ice and coarse calcite (D5_1). The microstructural stages are distinguished on the basis of intensity changes during neutron diffraction and optical observations from comparable 2-D and 3-D experiments.
The average grain size in a sample at different stages during the deformation was obtained from the intensity oscillation of the measured diffraction pattern. An infinite number of grains produce perfect diffraction peaks without any fluctuations, while a small number of grains (N) will give large statistical fluctuations in comparison. The observed diffraction-integrated intensity is a statistical quantity proportional to the neutron beam flux and number of crystallites which are in reflection condition, i.e. comply with Bragg's Law. The number of crystallites n is a random quantity and it is characterized statistically by the expectation n = Np and the std dev. σ 2 = Np(1 − p), where N is the total number of crystallites in the sample (or gauge volume) and p is a probability to find a crystallite in the reflection orientation. This probability is determined by neutron optical properties of the instrument, the multiplicity factor of a certain hkl-reflection and pole figure density for a given direction and hkl, p = dΩ/;4π · M hkl · pfd. Using the relative std dev.,  $\displaystyle{\sigma \over n} = (1/\sqrt N )\sqrt {1-p/p} $, eliminates a factor of the neutron flux, and can be used for estimation of the number of grains in the volume provided that the probability is evaluated accurately.
Technically, this approach was realized by (a) dividing the detector in five horizontal slices, (b) integrating of the intensity in each slice, (c) fitting the diffraction peak intensities and (d) finding the average and extracting the std dev. In this way, it was possible to determine N through estimation of the relative std dev. at each of the 1° steps and for each diffraction peak. Moreover, the number of grains was corrected by taking into account the developing texture based on information in the partial pole figure. At the end, individual grain number evaluated for particular angular position and hkl reflections were averaged to produce an estimate of the numbers of grains in a sample and consequently the mean grain size. Statistical analysis showed that mean grain size estimate is accurate within 5% std dev. By using this technique, we can establish the number of grains in a given volume of ice at any stage during the deformation. For example, in the initial pure ice samples MD10 and MD04 (Fig. 6), the number of grains were 46 300 ± 400 and 53 200 ± 400, respectively, a comparable result, as the samples were produced under almost identical initial conditions. As the deformation proceeds, this number increases as new grains are nucleated, depending on deformation conditions (temperature, strain and strain rate). A strain rate dependence is weakly pronounced, the grain number evolution as a function of the compressive deformation is more apparent; with the number of grains stabilizing after 10% shortening reaching a steady-state condition (Fig. 6). This is valid for pure ice samples (e.g. MD04 or MD10) and two-phase samples (e.g. D5_1).
In addition, we examined the starting and final microstructures in ≤250 µm-thick thin sections for all the sample types using a G50 fabric analyser (Wilson and others, Reference Wilson, Russell-Head and Sim2003; Wilson and Peternell, Reference Wilson and Peternell2011). Thin sections were cut parallel to the compression direction, and all fabric analysis data are represented with the compression direction oriented in a horizontal north-south orientation (Figs 3e, f). We used FAME software (Fabric Analyser Microstructural Evaluation; Hammes and Peternell, Reference Hammes and Peternell2016) to process the fabric analyser data and crossed-polarized photographs to determine the position of calcite and graphite grains.
(2) The second set of experiments involved in situ co-axial plane strain 2-D experiments (Figs 1b, c) with time-lapse observations through thin wafers cut from the cylindrical samples. A 250 µm-thick ~15 × 25 mm sized wafer was placed in a plane strain, pure shear deformation press under an automatic fabric analyser (Wilson and others, Reference Wilson, Russell-Head and Sim2003; Peternell and others, Reference Peternell, Russel-Head and Wilson2011 for further discussion). Differential strain rates were achieved by changing the rate at which the piston was advanced into the sample (Table 2). An area containing equiaxed ice grains, 5 × 5 mm or 1000 × 1000 pixels, was located within the 250 µm-thick wafer and a record of microstructural evolution with a spatial resolution of 5 µm/pixel was recorded every 4 min (Peternell and Wilson, Reference Peternell and Wilson2016). The single-frame measurements from the fabric analyser were combined with results from a FAME analysis (Hammes and Peternell, Reference Hammes and Peternell2016).
During this investigation, the accuracy of some individual [c]-axis measurements in the two-phase ice, obtained while using ‘Investigator’ software (Wilson and others, Reference Wilson, Russell-Head, Kunze and Viola2007), was generally interfered with by the presence of either fine calcite or a non-uniformity in the optical continuity of the ice (e.g. undulose extinction and/or subgrains). Such data were rejected on the basis of their geometrical and retardation quality values (Peternell and others, Reference Peternell2009), which meant [c]-axis determinations in pole figure diagrams (Figs 2–5) are <200 points, even though up to ~500 grains were selected (see explanation in Appendix).
3. MECHANICAL DATA
The nature of the creep and stress–strain paths is illustrated in Figures 7d, e, 8. In the 2-D experiments (Fig. 8a), three strain rate scenarios were used, namely: (1) constant displacement rates with starting strain rates of 2.5 × 10⁻⁶ s−1, which is the same as the corresponding medium 3-D experiments (Table 2; Fig. 8c); (2) short interval strain rate cycles where strain rates varied from ~1.9 × 10⁻⁶ to 3.1 × 10⁻⁶ s−1, accompanied by incremental strain variations of 0.14–0.21%. Overall the average path was identical to a medium, 2.5 × 10⁻⁶ s−1 strain rate; (3) long interval strain rate cycles of ~2.5 × 10⁻⁶ to 3.1 × 10⁻⁶ s−1 and strains varied between 2.9 and 5.5%. The fast 3-D experiments (Fig. 8b) have starting strain rates of 1 × 10⁻⁵ s−1.
Nature of the creep and stress–strain relationships for a sub-set of the pure ice and ice mixture experiments. (a) Four creep curves showing strain against time under particular strain rates in 2-D fabric analyser experiments. Lines A = 1 × 10⁻⁵ s−1 represents a fast strain rate; Line B = long interval strain rate cycle from 1.02 × 10⁻⁵ to 1.45 × 10⁻⁶ s−1 (see Peternell and Wilson, Reference Peternell and Wilson2016). The sigmoidal shape of line B represents long interval strain rate cycles where strain rates were ~2.5 × 10⁻⁶ to 3.1 × 10⁻⁶ s−1 and strains varied between 2.9 and 5.5%. Line C = short interval strain rate cycles where strain rates varied from ~1.9 × 10⁻⁶ to 3.1 × 10⁻⁶ s−1, accompanied by strain variations of 0.14–0.21%. Line D = 2.5 × 10⁻⁶ s−1 representing a medium strain rate. (b–c) Instantaneous stress plotted against strain for 3-D experiments conducted at constant strain rates of (b) 1 × 10⁻⁵ s−1 (fast), (c) 2.5 × 10⁻⁶ s−1 (medium) (modified after Cyprych and others, Reference Cyprych, Piazolo, Wilson and Luzin2016). The variation in stress for each curve is <±0.40 MPa.

In the 3-D experiments, the load (F) was measured at small time steps (<2 s) on a fixed grip (Fig. 1a) and then recalculated to stress (σ) using the relationship:
 $$\sigma = (F-f)/A\;, $$
where f is the friction, and A is the increasing area of the cylinder, assuming the uniform strain and near constant sample volume. Sublimation of ice on both grips is considered to be minimal with a friction (f) of ~0.1 kN between the grips and the aluminium cooler (Fig. 1a). The volume change by extrusion of air in the dry compacted or ‘bubble’ ice could not be calculated. The calculated sample diameter was identical to the sample diameter measured after the experiment. As axial strain rate increases with strain, strain rate was separately calculated for each time step together with the average grain size in a sample at different stages during the deformation.
A subset of our stress–strain data obtained in the 3-D experiments is plotted in Figures 8b, c. The pure ice and calcite-bearing ice show similar stress–strain relationships throughout the experiment (Figs 8b, c). They first undergo strain hardening, reaching the peak stress at ~2% strain, which is then followed by strain weakening, and a period of nominal constant stress interpreted as mechanical steady state. The mechanical steady state or flow stress values (σ ss) and peak stress values of ice with calcite are greater than those of the pure and bubble-rich ice (Figs 8b, c). The bubble ice is the weakest material, first undergoing strain hardening then slowly hardens at a steady state well below the flow stress of the pure ice.
The samples with fine-grained calcite exhibit a higher peak (3.5 MPa at  $\dot{\varepsilon} $ = 1 × 10⁻⁵ s−1; 2.8 MPa at $\dot{\varepsilon} $ = 2.5 × 10⁻⁶ s−1) and steady-state stresses than the coarse-grained calcite sample. Also, ice with calcite reaches mechanical steady state at higher strains than the pure material (Figs 8b, c) and may progressively harden (Fig. 7e). The effects of adding fine-grained calcite vs coarse calcite not only increases the hardening of the ice but provides additional nucleation points for recrystallization (Figs 4d–f). The stress–strain relationship of graphite-bearing ice does not show a distinct stress drop after the peak stress is reached. After ~3% strain, stresses decrease steadily throughout the experiment (Fig. 8). The peak stress is comparable to that of pure ice at a strain rate of 2.5 × 10⁻⁶ s−1. At a strain rate of 1 × 10⁻⁵ s−1, the peak stress is lower than that of pure ice.
A subset of our experimental results were analysed by Cyprych and others (Reference Cyprych, Piazolo, Wilson and Luzin2016) in terms of a constitutive equation related to a dislocation creep flow law in the form:
 $$\dot{\varepsilon} _{{\rm ss}} = A\sigma _{{\rm ss}}^n {\rm e}^{-\left( {\displaystyle{Q \over {RT}}} \right)},$$
where  $\dot{\varepsilon} _{{\rm ss}}$ – calculated steady-state strain rate, A – material constant, σ ss – steady-state stress, n – stress exponent, Q – activation energy, R – gas constant and T – temperature (Durham and others, Reference Durham, Kirby and Stern1992). The calculated n for the pure ice is close to 3.3, while for calcite- and graphite-bearing ice equals 5–5.6 and 6.6, respectively. These values are comparable to the values reported by Middleton and others (Reference Middleton, Grindrod and Sammonds2017) in fluorite–ice mixtures. There were insignificant data to obtain a steady state and record the significant volume changes during the deformation of the bubble ice and no representative flow law was obtained.
4. MICROSTRUCTURAL EVOLUTION
4.1. Pure and dry compacted ice
The pure ice, after a fast 3-D deformation (Fig. 2b), displays prominent intracrystalline deformation features such as wavy (0001) undulose extinction and subgrain boundaries (<10°) in the majority of grains. The matrix is dominated by small grains (~50 µm) between which are larger grains (~200 µm) with undulose extinction and deformation bands. Similar microstructures (Fig. 9) have also been observed in the final stages of 2-D in situ short-interval experiments involving fast vs medium strain rates (Peternell and Wilson, Reference Peternell and Wilson2016).
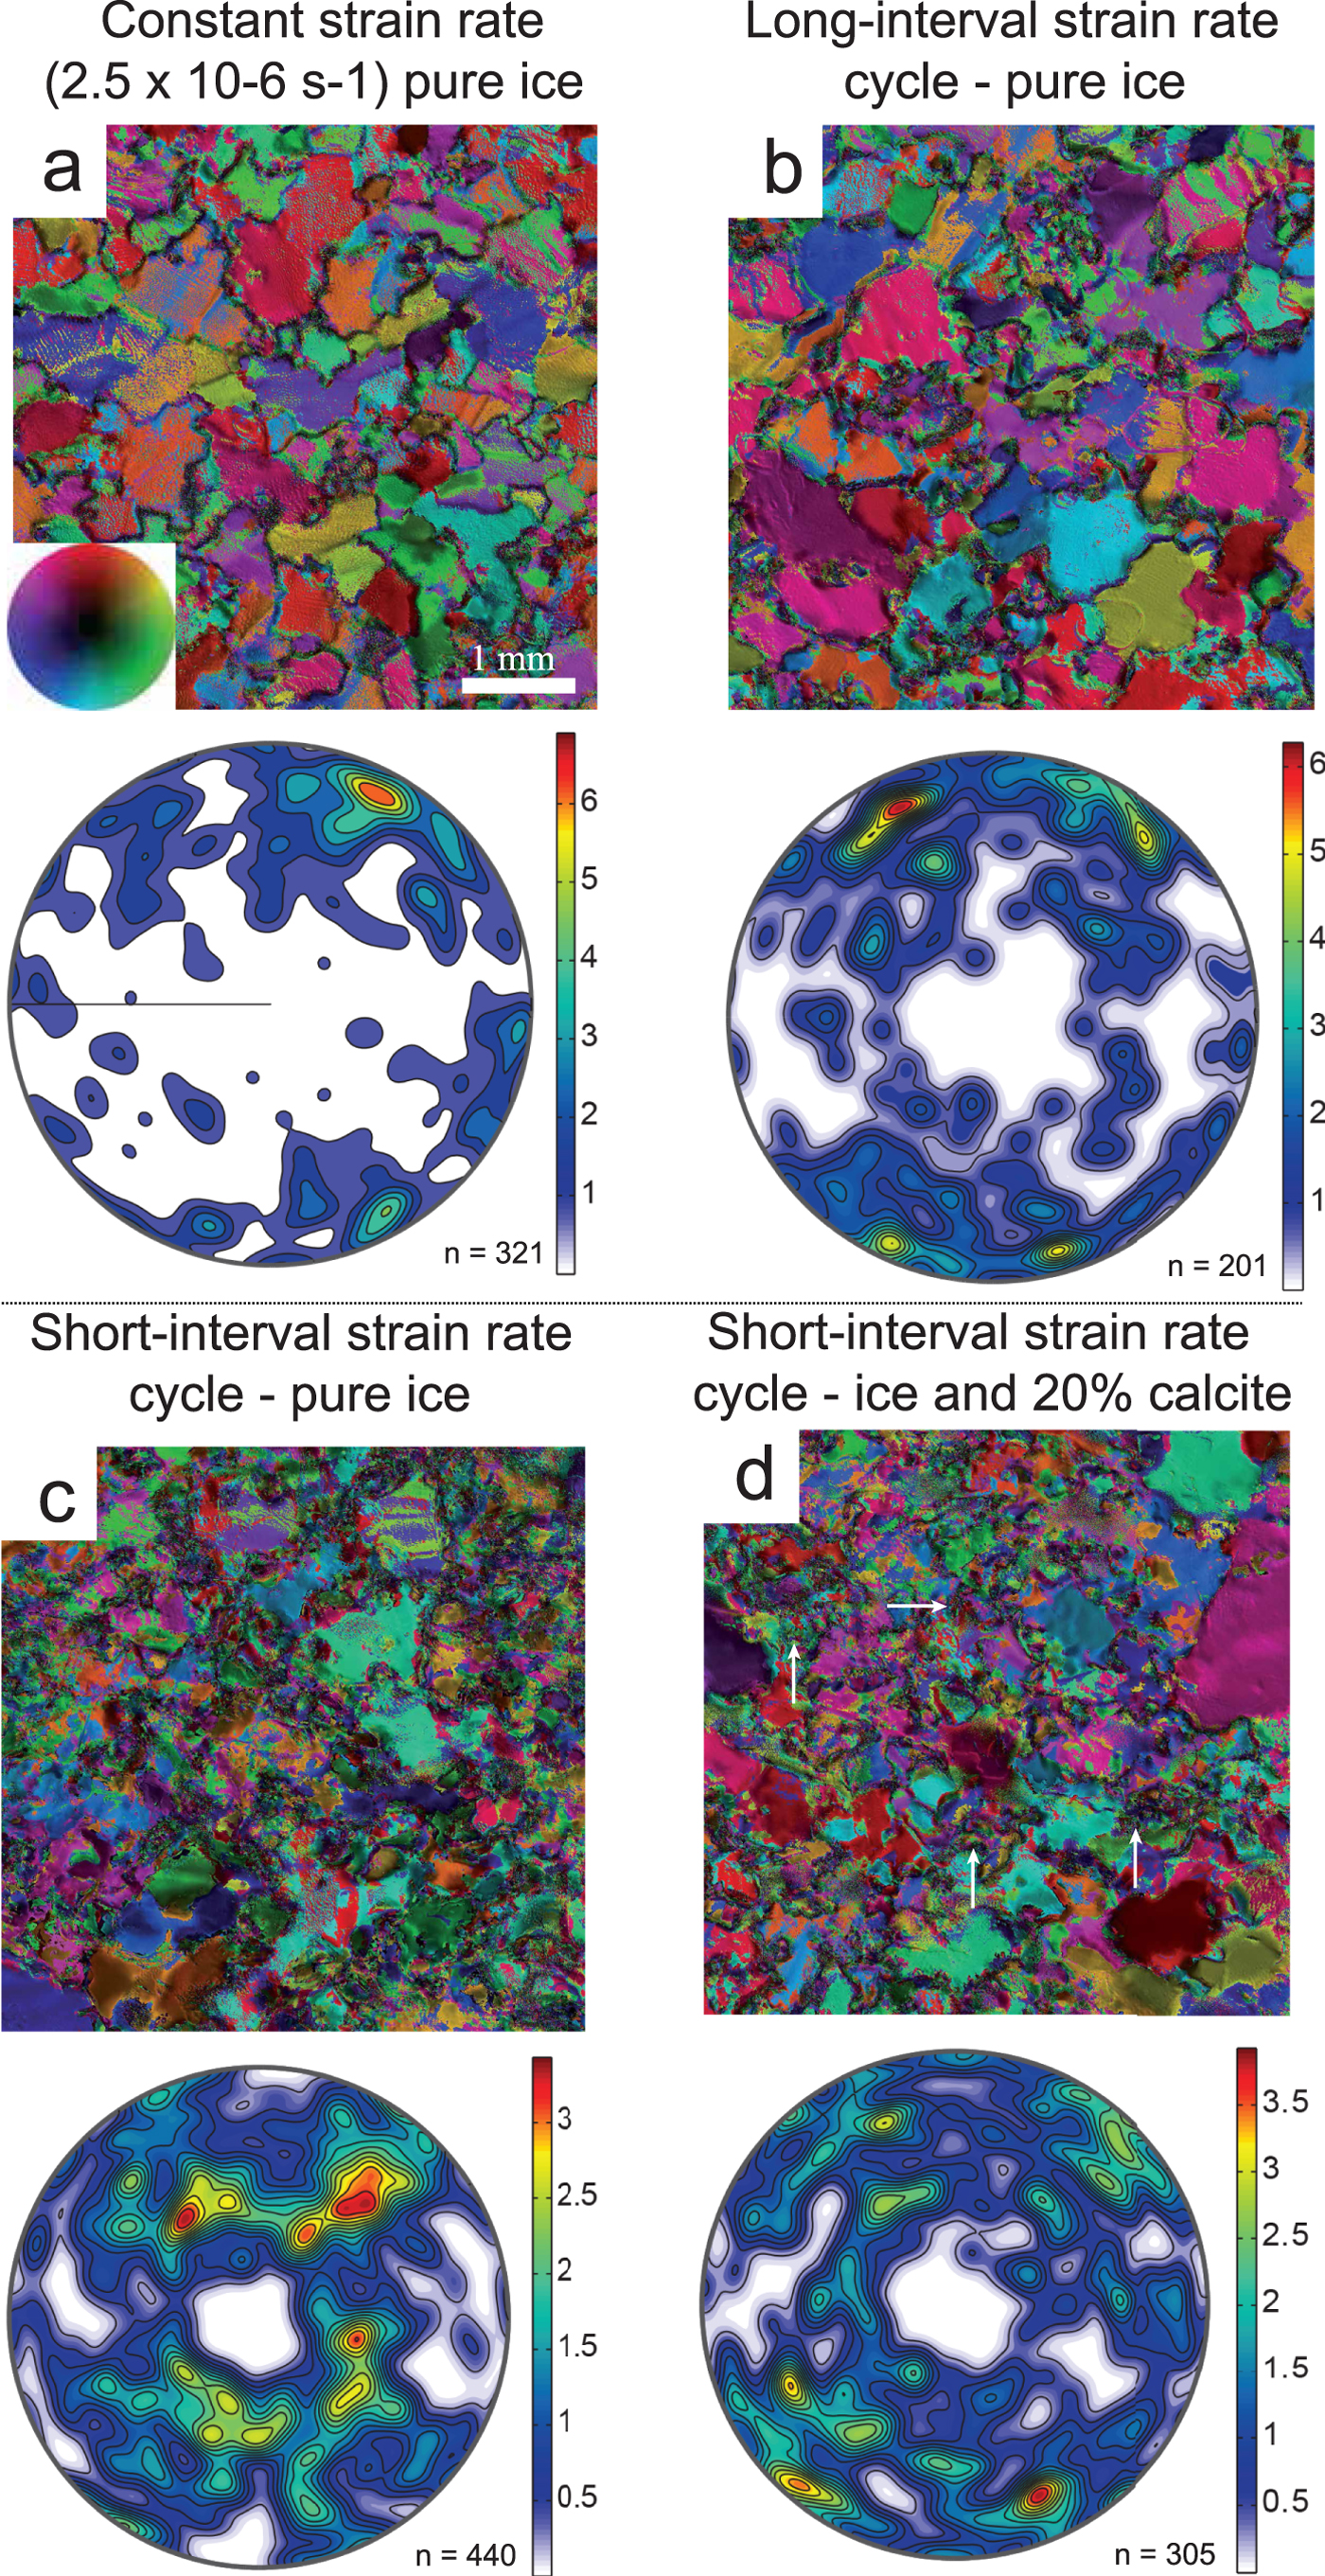
Microstructure and CPOs obtained after 20% shortening in 2-D fabric analyser experiments with variable strain rates ( $\dot{\varepsilon} $) at −7C. Minima and maxima of density are indicated to the right of each pole figure. (a) Pure ice after a constant $\dot{\varepsilon} $ = 2.5 × 10⁻⁶ s−1 deformation. Bar scale = 1 mm and inset shows different colours indicating [c]-axis orientation with respect to vertical compression axis that applies to all images. (b) Pure ice deformed as cycles of fast ( $\dot{\varepsilon} $ = 10.2 × 10⁻⁶ s−1) involving increments of 0.3% shortening, followed by relatively slower cycle ( $\dot{\varepsilon} $ = 1.45 × 10⁻⁶ s−1) involving 0.04% shortening increments. (c) Deformed pure ice and (d) ice with coarse calcite after numerous short cycles of ‘fast’ ( $\dot{\varepsilon} $ = 2.8 × 10⁻⁶ s−1) involving 0.07% shortening followed by slow ( $\dot{\varepsilon} $ = 1.9 × 10⁻⁶ s−1) involving 0.005% shortening increments. In (c) the highly irregular grains display strong undulose extinction and in (d) many grain boundaries are pinned by the calcite as highlighted by white arrows.
Following a medium strain rate deformation of pure ice (Fig. 2c), there was a bimodal population of small (~100 µm) irregular-shaped new grains between larger (200–300 µm) grains (Figs 2d, 10c). All of the larger grains have interlobate shapes, irregular boundaries and minor distortions in the form of gentle undulose extinction, which transition into subgrains and new grains (Figs 2c, d, 10b, c). These observations are comparable to the 2-D in situ constant medium strain rate experiments (Fig. 9a) described by Peternell and Wilson (Reference Peternell and Wilson2016); where the same (Fig. 2a) starting material was used, with a grain size of ~300 µm and a CPO very close to random. After deformation, the ice had its mean grain size of ~230 ± 12 µm, during a stage of new grain nucleation accompanied by grain boundary migration. If strain rate is varied (Fig. 8a), over long intervals (Fig. 9b), grain size reduction is achieved by a combination of intracrystalline deformation followed by grain boundary migration to produce microstructures (Fig. 9b) identical to the 3-D experiments (Figs 2c, d).
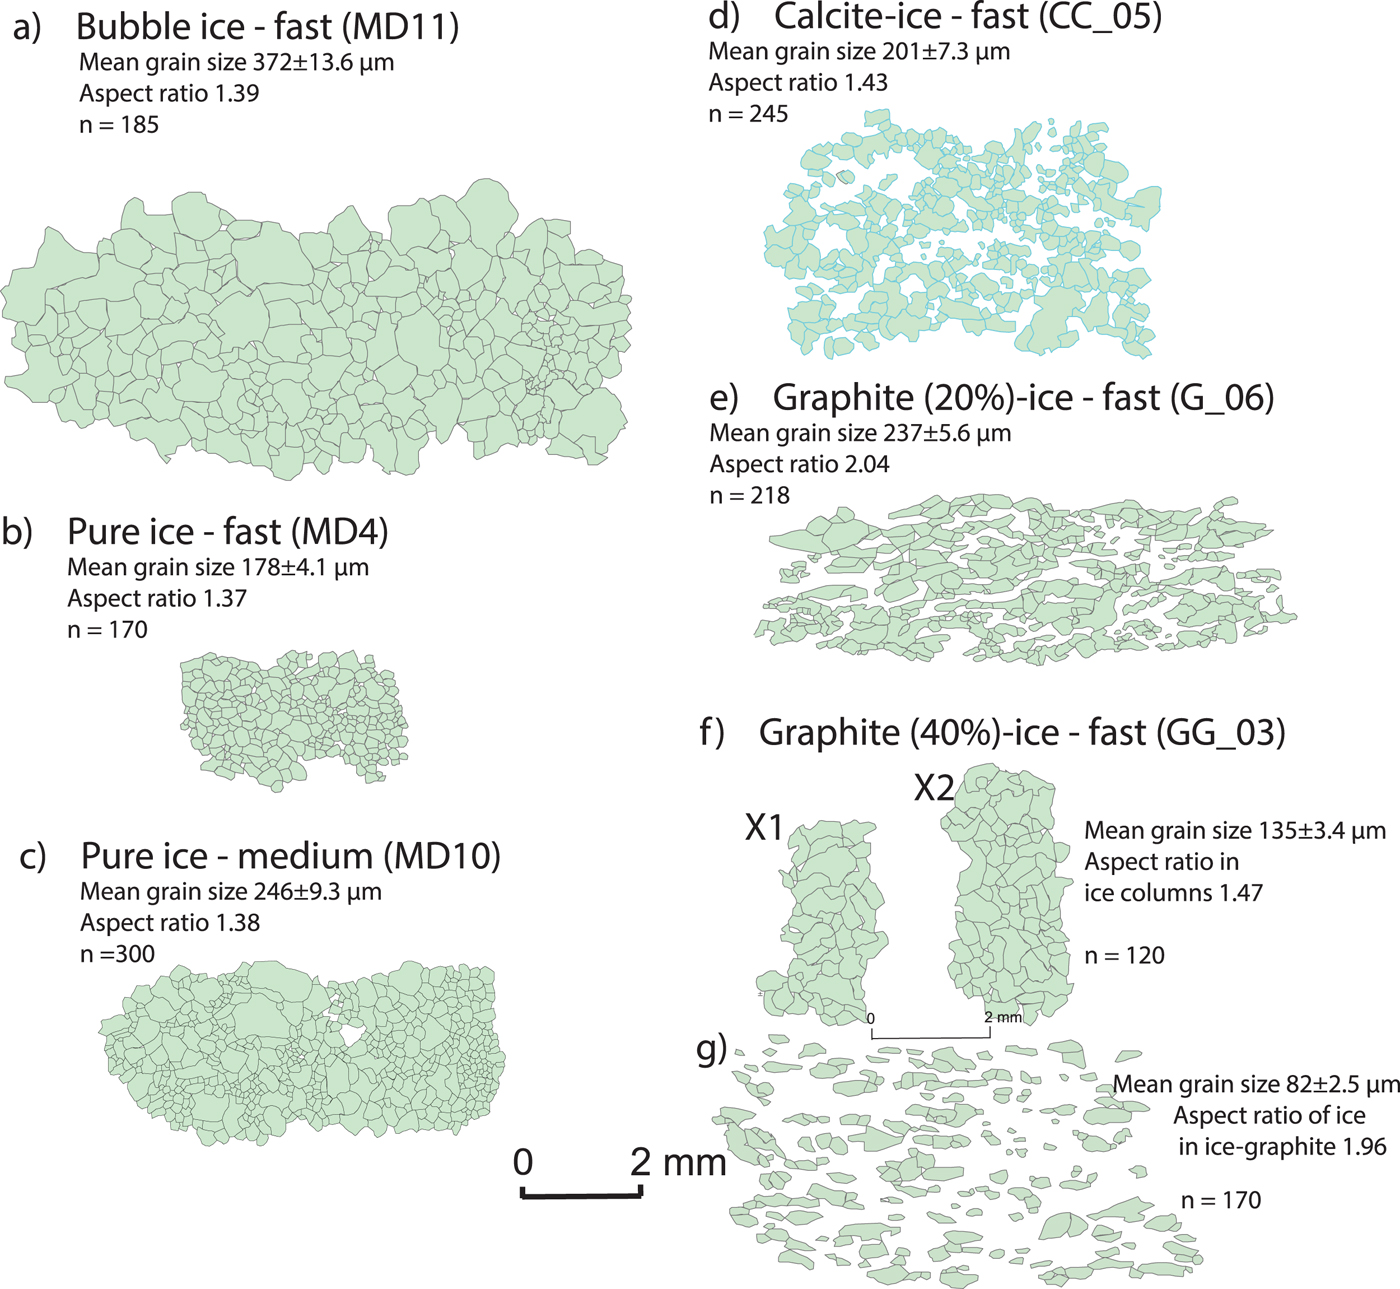
Digitized images comparing grain sizes and aspect ratio for ice domains in bubble, pure ice and where there was a dispersed second phase. The background in (d) is fine calcite with grain size <150 µm. The background in (e) and (g) is graphite. n = number of grains digitized using ArcGIS from fabric analyser images. Bar scale of 2 mm applies to all images.
During a fast deformation of the bubble ice (Fig. 3b), the pores disappear producing a more coherent matrix dominated by irregular-shaped grains, and displaying significant undulose extinction and subgrain development. The grains are markedly elongate perpendicular to the shortening direction with highly serrated and wavy grain boundaries (Fig. 11a). The smallest air bubbles are located on grain boundaries and remain spherical. After 10% shortening during a medium strain rate deformation (Fig. 3c), the grain size distribution is bimodal, dominated by small equant grains and larger elongate grains with undulose extinction (Fig. 10a). Bubbles have a pinning effect and appear to restrict the onset of grain boundary migration. A fast deformation with 35% shortening produces irregular grains with a lobate interlocking grain microstructure (Fig. 11b).
Enlargements of key areas within representative deformed samples from orientation images described in the text. (a) Bimodal grain size distribution in bubble ice (Fig. 3b), with large tabular-shaped undulose grains and smaller recrystallized grains. (b) Lobate interlocking grains in bubble ice (Fig. 3d) displaying undulose extinction. (c) Ice with coarse calcite (Fig. 4b) dominated by irregular-shaped grains that can be related to pinning of grain boundaries by the calcite as indicated by the white arrows. (d) Isolated irregular ice grains displaying intracrystalline distortions within fine ice–calcite matrix (Fig. 4e). (e) Isolated ice within graphite matrix (Fig. 5a) exhibit undulose extinction and subgrain development. (f) Larger irregular recrystallized grains with undulose extinction (Fig. 5d) within the ice only channels in the graphite-ice mixtures (Fig. 5d). Bar scale for all micrographs is 0.1 mm.

4.2. Calcite–ice mixtures
After 20% shortening in the fast 3-D experiments, the grain size of ice containing the coarser calcite fraction decreases (Table 2; Fig. 4b). The ice is dominated by irregular large (~200 µm) and small (100 µm) grains with highly lobate grain boundaries that are pinned by films of calcite (e.g. see white arrows in Fig. 11c). Intracrystalline distortion, undulose extinction and subgrains occur in all samples with 20 vol.% calcite (Figs 4b, c). During a slower strain rate (Fig. 4c), grain boundaries are smoother and the presence of intracrystalline deformation features is considerably reduced. In the fine-calcite mixtures (Fig. 4d), the final grain sizes are significantly reduced (~50–250 µm); there is a heterogeneous distribution of larger single crystals and significant pinning of grain boundaries is observed. As the volume of fine calcite is increased (40 vol.%), the fraction of smaller grains with highly curved or lobate grain boundaries increases and dominates the matrix (Figs 4e, f, 11d). If the initial dispersion of calcite is uneven, then there may be isolated ice grains with diameters of ~500 µm (Figs 4e, f).
In the 2-D short-interval strain rate experiments, the final microstructure in the pure ice (Fig. 9c) and ice with calcite (Fig. 9d) is similar to the 3-D medium strain rate experiments (Figs 4c, d); with irregular-shaped ice grains embedded in a matrix of finer (~120 µm) ice (Fig. 9c) or interspersed between and pinned by the calcite (Fig. 9d). The initial ice in both the 2-D and 3-D experiments had a close to random CPO; however, there were contrasting CPOs at the end of the experiments (see discussion on preferred orientation development).
4.3. Graphite–ice mixtures
During sample preparation, which involves compaction to expel excess water, a weak preferred alignment of the graphite basal planes developed perpendicular to the compression direction. Locally, graphite platelets were congealing to form larger aggregates. Irregular-shaped ice crystals with variable grain sizes (<1000 µm) were located between these graphite grains and aggregates. At the conclusion of a fast strain rate experiment involving 20% shortening (Fig. 5a), with 20 vol.% graphite, the graphite flakes and aggregates were flattened around ovoid-shaped ice particles. Many of the ice crystals in the matrix displayed optical evidence of intracrystalline deformation features such as undulose extinction and deformation band development (Fig. 11e). Whereas, in the localized channels of pure ice (area marked X1, X2 in Fig. 10f), there are lobate-shaped coarser ice grains.
After 6% shortening at a medium strain rate (Fig. 5c), with 40 vol.% of graphite flakes, there was the development of a clear shape alignment of the isolated ovoid-shaped ice particles within an aligned matrix of graphite flakes. All ice particles displayed marked intracrystalline deformation features (Fig. 5c). At the conclusion of 20% shortening (Fig. 5d), the ice microstructure was dominated by a wavy pattern of the graphite (001) basal planes around lensoidal-shaped recrystallized ice aggregates. The graphite then defines interconnected layers of a weak material (Figs 10f, g) between the harder ice aggregates.
Within the graphite-bearing samples, there were also inherited channels of pure ice (X in Figs 5a, d) and graphite (Y in Fig. 5c), which were artefacts developed during sample preparation. These were produced during the removal of a mixing needle, which left a 1 mm-wide void that became infilled by fine grains of either graphite or D2O ice. These channels were aligned at a high angle to the initially weak graphite CPO and sub-parallel to the subsequent compression direction. During deformation, these dark seams of graphite (Y in Fig. 5c) allow the collapse of the adjacent dispersed ice–graphite mixtures producing undulations within the sample. Similarly, the ice channels, now infilled with larger recrystallized ice grains (Figs 5a, d, 10f) are more robust and the matrix flows around these to produce undulations in the shape distribution of the adjacent ice lenses and graphite alignment. Hence the internal geometry in these mechanically anisotropic materials when compressed depended upon the degree of anisotropy of the material and the orientation to the principle compression direction. The mineral migration observed in response to stress gradients established during the development of these structures results in discrete zones of weaknesses and hence the deformation in these samples is locally inhomogeneous.
5. GRAIN SIZE EVOLUTION
Comparisons of optically derived grain sizes, analysed after the termination of deformation (Table 2), are comparable to those obtained using the neutron diffraction analysis method. This is reflected in the correlation between average grain size evolution and strain during progressive deformation (Fig. 11) and is indicative that we are in a grain size-insensitive regime (De Bresser and others, Reference De Bresser, Peach, Reijs and Spiers1998). All materials of differing initial grain sizes (Table 2) show a clear tendency to decrease with increasing strain with the establishment of a stabilized grain size (Fig. 12). This decrease in grain size is particularly marked after ~3% strain which corresponds with a drop in peak stress (Fig. 8c). During the initial 5% shortening in all two-phase samples, particle pinning leads to an increase of intracrystalline distortions within the ice (Fig. 11) and restricts grain boundary migration.
The evolution of the average grain size of ice at small strain steps at strain rate 2.5 × 10⁻⁶ s−1 (medium) obtained by neutron diffraction(ND) analysis and during in situ experiments on the fabric analyser (FA) and deformed at −7C. The average grain size is defined as a 3-D equivalent diameter. The error bars are between 15 and 20%.

The microstructure produced in pure ice and calcite-bearing ice during a medium strain rate neutron diffraction experiment has a similar grain size evolution (ND in Fig. 12). In pure ice, there is a small decrease in grain size in the first 1% strain, followed by further grain size reduction between 1 and 3% strain. Between 3 and 10% strain, grain size decreases gradually with minor fluctuations and between 10 and 15% strain stays the same. After 15% strain, grain size again decreases gradually. Grain size of ice in the coarse-grained calcite-bearing sample increases in the first 1% strain then decreases by ~40% between 1 and 5% strain, and after 5% strain stays the same. In the sample with fine-grained calcite, ice grain size decreases by ~30% reaching 5% strain and then stays the same.
Graphite-bearing ice shows a different behaviour, with a steady 30% decrease in ice grain size in first 12% strain, and little changes thereafter (Fig. 12). Bulk grain size reduction is more pronounced in the pure ice sample, where the starting grain size is reduced by half (Fig. 12; Table 2). The final grain size of coarse-grained calcite-bearing ice is smaller than that of pure ice (170 ± 13 and 272 ± 30 µm, respectively), and samples with fine-grained calcite and graphite show even smaller final average grain sizes (147 ± 14 and 146 ± 17 µm, respectively; Fig. 12).
At a medium strain rate (Fig. 12), there are well-defined trends in grain size evolution of ice with different initial grain sizes. In the pure ice, 3-D experiments, the mean grain size (~270 µm) after 20% shortening (Table 2) has stabilized. The development of this stabilized grain size is independent of initial variations in grain size and appears to be dependent of strain rate as also pointed out by Peternell and Wilson (Reference Peternell and Wilson2016). However, the rates of grain size change are perturbed by localized fluctuations, which can be accounted for by grain nucleation with grain growth. These fluctuations stabilize with the development of the bimodal grain size distributions observed in the final microstructure (Figs 10b, 11b). Initial ice grain sizes also do not control the final mean grain size in the two-phase samples. Instead the ice grain size is controlled by the size and distribution of particles. In the 2-D observations (FA in Fig. 12) of the constant and long-cycle strain rate deformation of pure ice produce comparable grain sizes (~320 µm) at the termination of an experiment. This is slightly larger than the 3-D average grain size (~270 µm). In the short-cycle experiments, there is a reversal with the average grain size less (~215 µm) than the other pure ice experiments.
Grain size is not the only measurable property in the 3-D neutron deformation experiments, we can also extend our observations to quantify the nucleation of new grains (Fig. 6). The seeding rate for new grain nucleation progressively increases during deformation and stabilizes after ~10% strain in both the pure ice and in the ice with dispersed second phases (Fig. 7). However, the general fluctuations in grain size (Fig. 11) and observation of bimodal grain distributions (e.g. Fig. 11b) is an indication that nucleation of new grains vs grain boundary migration has not reached steady state with ongoing deformation. Therefore, recrystallization is increasing with the progress of deformation, dislocations are removed until the rates of dislocation generation and removal are equal, and the seeding rate for grain nucleation is balanced as indicated by the constant nucleation rate of new grains (Figs 7d, e, 8).
6. PREFERRED ORIENTATION DEVELOPMENT
It is well known that the strength and position of the [c]-axis distributions in ice depend on the amount of strain (e.g. Wilson and Russell-Head, Reference Wilson and Russell-Head1982; Piazolo and others, Reference Piazolo, Wilson, Luzin, Brouzet and Peternell2013; Qi and others, Reference Qi, Goldsby and Prior2017). To quantitatively assess the final [c]-axis fabric development at different strain rates in the 3-D experiments, data were evaluated from partial and full pole figures and compared with results obtained via optical means. The optical evaluation was from vertical sections (~300 µm-thick), cut parallel to the compression direction, after full textural analysis was undertaken. Individual [c]-axis orientations and quality values (Peternell and others, Reference Peternell2009) were analysed in axial distribution diagrams (AVA – ‘Achsenverteilungsanalyse’) using the software ‘Investigator’ (Wilson and others, Reference Wilson, Russell-Head, Kunze and Viola2007). The [c]-axis orientation measurement for each grain was evaluated in the AVA image, following the principles outlined in Wilson and others (Reference Wilson, Russell-Head, Kunze and Viola2007) and Hammes and Peternell, (Reference Hammes and Peternell2016). Such an analysis was also applied to the continuous and synchronous recording of microstructure and crystal [c]-axis orientations recorded during the 2-D experiments.
As neutron diffraction derives the combined bulk CPO of all phases in the sample, their individual diffraction reflections must be resolved or separated through diffraction peak fitting analysis. For ice, the experimental data from (002), (100) and (101) reflections were plotted using MTEX texture analysis (Hielscher and Schaeben, Reference Hielscher and Schaeben2008), and a 5° Gaussian smoothing function, as [c] and <a>-axis pole figures (Figs 2–5) using ODF reconstructions (e.g. Wenk, Reference Wenk2006). The (002) poles obtained from the graphite represent the [c]-axis distribution of the graphite flakes after deformation (Fig. 5). All pole figure density distributions of the deformed ice confirm an axial symmetry, with [c]-axis poles preferentially aligned with respect to the compression direction. However, there are significant differences between samples deformed under different strain rate conditions, which will be discussed below.
6.1. Fabrics in bubble and pure ice samples
The distribution of [c]-axes in the starting material for the pure (Fig. 2a) and bubble ice (Fig. 3a) is very close to random. By the end of these experiments (Figs 2, 3), the optically determined [c]-axis pattern (fabric analyser data in Fig. 3) was variably recognizable. When compared with the distinct small-circle girdle patterns around the compression axis (σ 1) recognized in the bulk neutron diffraction results. In the pure ice fast experiment (Fig. 2b), the optically determined [c]-axis pattern contains distinctly different geometries and intensities compared with the cones (small circles) parallel to the compression axis in the neutron diffraction data. This is attributed to the poor geometrical quality obtained by the fabric analyser, as the grains have strong intracrystalline distortion and no indication of grain boundary migration (see Appendix). In the medium strain rate experiment (Fig. 2c), where there was notable grain boundary migration, there was a better correspondence between the optical and neutron diffraction data. The <a>-axes are distributed in a broad swath along the plane perpendicular to the compression axis.
In the bubble ice experiments (Figs 3a–d), the [c]-axis distributions are markedly different to the pure ice with lower J-index values. In the fast experiment, where sample was shortened 11% (Fig. 3b), the CPO consists of a strong concentration parallel to the compression axis. The optically derived results are comparable to the neutron diffraction data, with a small number of large tabular grains related to the strong maxima parallel to the compression axis. The [c]-axis of the smaller grains differ from those of the larger grains in that the [c]-axis positions are more dispersed in a wide zone across the entire girdle that surrounds the compression axis (Fig. 2b). In contrast, a comparable medium experiment (Fig. 3c) produced a stronger CPO with [c]-axes preferentially clustered or at a small angle around the compression axis. The corresponding <a>-axes are concentrated in the broad swath girdle perpendicular to the compression axis. With <a>-axes in the medium strain rate experiment having distinct sub-maxima at 45 and 90° to the compression axis. In a higher strain (ε = 36%) fast experiment (Fig. 3d), the J-index, which is a measure of the degree of preferred orientation or ‘sharpness’ in the ODF (Sturcken and Croach, Reference Sturcken and Croach1963), marginally increases with initiation of two concentrations of [c]-axes symmetric and a low angle to the compression axis.
In the medium strain rate 2-D fabric analyser experiments (Fig. 9a) and long-interval strain rates cycle experiments (Fig. 8b), the CPO forms an intermediate girdle-cluster pattern symmetrically related to the compression axis. The short-interval strain rate cycle experiments (Figs 9c, d) show a fine grained, bimodal grain size distribution, with crystal orientations almost unchanged and close to random.
6.2. Fabrics in ice–calcite samples
All deformed ice–calcite samples analysed by neutron diffraction have non-random CPOs with [c]-axes concentrated in cones about the compression axis (Fig. 4). The fast experiments (Figs 4b, e) exhibit [c]-axis maxima within the cones, which are aligned ~45° to the compression axis. In contrast, with a medium strain rate and 20 vol.% calcite (Figs 4c, d), most grains are strongly aligned in a cone about the compression axis with no sub-maxima. However, where there is 40 vol.% calcite, this cone-like distribution and J-index is weaker. Elements of these patterns are seen in the optical data obtained from the fabric analyser.
The <a>-axes lie in a broad girdle perpendicular to the compression axis (σ 1) with discrete concentrations only in the fast experiment (Fig. 4e). These concentrations reflect the four dominant [c]-axis distributions about the compression axis. With increasing fine calcite (40 vol.%), the [c]-axis distributions and the J-index are weaker.
In order to investigate the character of CPO development with progressive strain, we have used fluctuations in [002] intensities. Figure 7 shows the large variability of intensities with progressive deformation from a random initial [c]-axis preferred orientation (at 0.25% shortening). At a finite strain of 6.7% shortening, the intensity then decreases at 16.8% shortening. This decrease suggests the nucleation of new recrystallized grains, which progressively grow to produce the increased intensity by the end of deformation at 20.5% shortening. The final [c]-axis pattern of the ice crystals is a strong small-circle concentration about the deformation axis (Fig. 4).
6.3. Fabrics in ice–graphite samples
Non-random CPOs with ice [c]-axes concentrated in cones about the compression axis (Fig. 5) are a feature in all ice–graphite samples. There is a reasonable degree of correspondence between neutron diffraction and fabric analysis data for samples with 20% graphite, but not with the fabric analysis measurements in the 40% graphite. In a medium strain rate experiment stopped at 6% strain (Fig. 5c), there is a noticeable alignment of [c]-axes at ~45° to the compression axis. Shortenings of 20% during a medium deformation, with 20 vol.% graphite (Fig. 5b), produce higher J-indices than the corresponding fast experiment (Fig. 5a) or where there is 40 vol.% graphite (Fig. 5d).
Graphite fabric intensities, expressed as multiples of random orientation, reach 6.5 at strains of 6% shortening (Fig. 5c) and increase to 11 during the medium strain rate experiments (Fig. 5b). These higher intensity values also reflect higher degrees of preferred orientation and as seen in the J-index. With increasing strain graphite CPOs in samples with 40 vol.% graphite, the radius of cone angles decreases from 55° (Fig. 5c) to 30° (Fig. 5d). Comparing fast (Fig. 5a) vs medium (Fig. 5b) strain rates also reflect increasing higher degrees of preferred orientation. The effect of increasing graphite content from 20 vol.% (Figs 5a, b) to 40 vol.% (Figs 5c, d) makes little difference in the radius of the cone angle (42°); however, the graphite intensity decreases from 11 to ~8 reflecting a lower degree of preferred orientation.
6.4. The evolution of the [c]-axis CPO
CPO neutron diffraction data are presented in terms of XY intensity plots (Fig. 13a) of orientations at a given angle (χ) to σ 1 along cross-sections in complete (Fig. 13) and incomplete (0001) pole figures (Figs 13a–d). The absence of significant CPO in the undeformed pure ice (D5_2, Fig. 13a) is confirmed by the very low-intensity troughs at χ ~ 25° and uniform intensities across the higher angles in the cross-section. Fast deformation of pure ice (MD4) to 20% shortening develops a well-defined high-intensity peak at χ ~ 35° (Fig. 13a), which is higher than the comparable medium strain rate experiment (MD10). This peak is accompanied by low intensities at low and high χ angles. The bubble ice (Fig. 13b), deformed to 20%, at both fast (13_32B) and medium (MD8) strain rates, displays similar flat intensities that decrease towards high χ angles. It is only after 36% shortening (MD11) that the CPO intensity starts to increase.
Summary of crystal orientation data from neutron diffraction uniaxial compression experiments. Inset in (c) shows results in a CPO with circular symmetry around the X-direction of the pole figure, the area of measurement for final pole figures and representative cross-section (N-S line), χ – vertical azimuth of [c]-axis orientation in respect to σ 1. (a–f) Cross-sections of pole figures showing final CPO of (0001); the strength of the CPO is defined by J-index of the ODFs that are calculated with half-width and resolution of 5°. All cross-sections are calculated after 20% shortening except for MD11 (ε = 36%) and GG_04 (ε = 6%). cc, fc and g represent vol.% of coarse calcite, fine calcite and graphite, respectively.
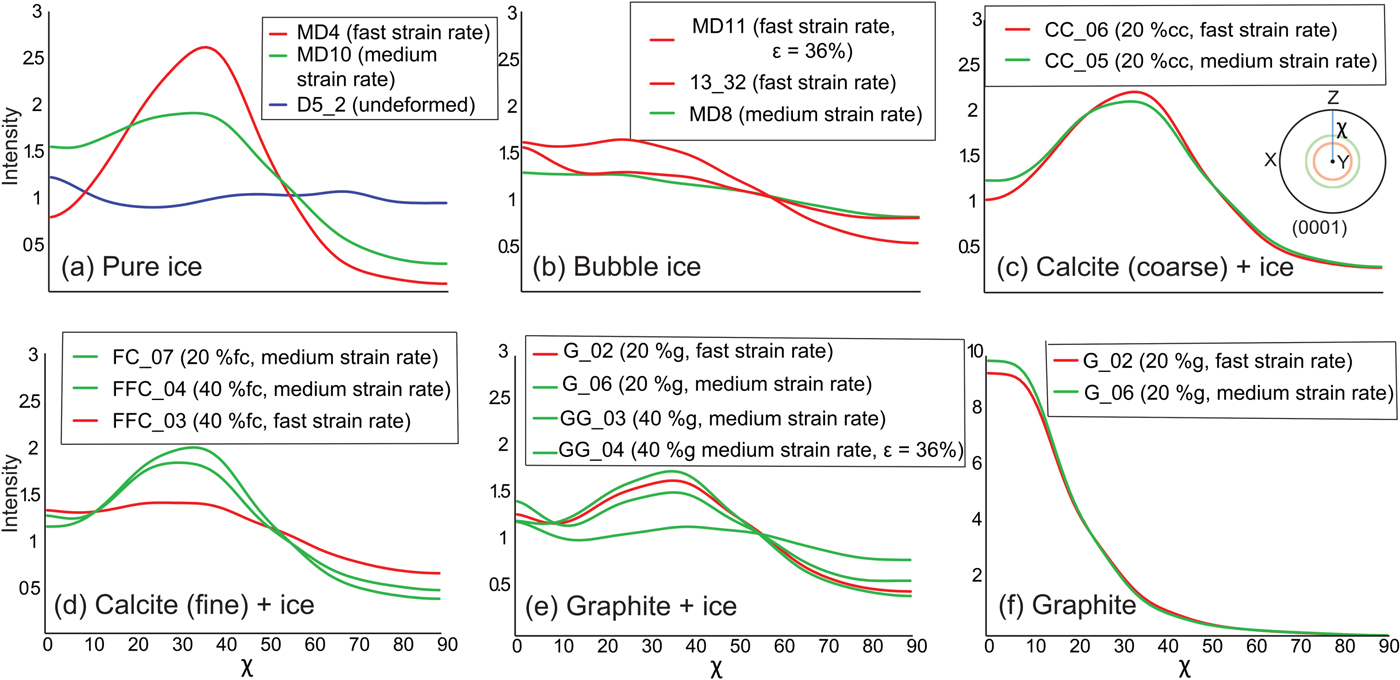
In the calcite–ice samples, the intensity (Figs 13c, d) of the peak of (0001) at χ ~ 35° is lower than in pure ice, and the number of orientations at χ ~ 80° is higher. In ice with coarser calcite deformed to 20% (Fig. 13c), the CPO develops a well-defined high-intensity peak at χ ~ 35° under both fast (CC_06) and medium (CC_05) strain rates. This is similar to fine ice deformed at the medium strain rate (FC_07, Fig. 13d). In contrast, the intensity of the ice with a finer calcite powder is distinctly lower and broader when the calcite content is increased to 40 vol.% (FFC_03, FFC_04; Fig. 13d).
In the graphite–ice samples (Fig. 13e), with 20 vol.% graphite as second phase, it is the medium strain rate (G_06) that produces a slightly higher intensity at χ ~ 40° than the fast (G_02) deformation. These are well-defined peaks in comparison to the lower intensities and off-set peaks observed with only 6% strain (G_04). Because the graphite is reoriented due to its tabular grain shape, this may explain why the intensity peak is offset (χ = ~5°) from that of pure ice. The (001) pole figures for graphite after deformation (Fig. 13f) are all characterized by a high-intensity axial symmetric distribution in the direction of σ 1.
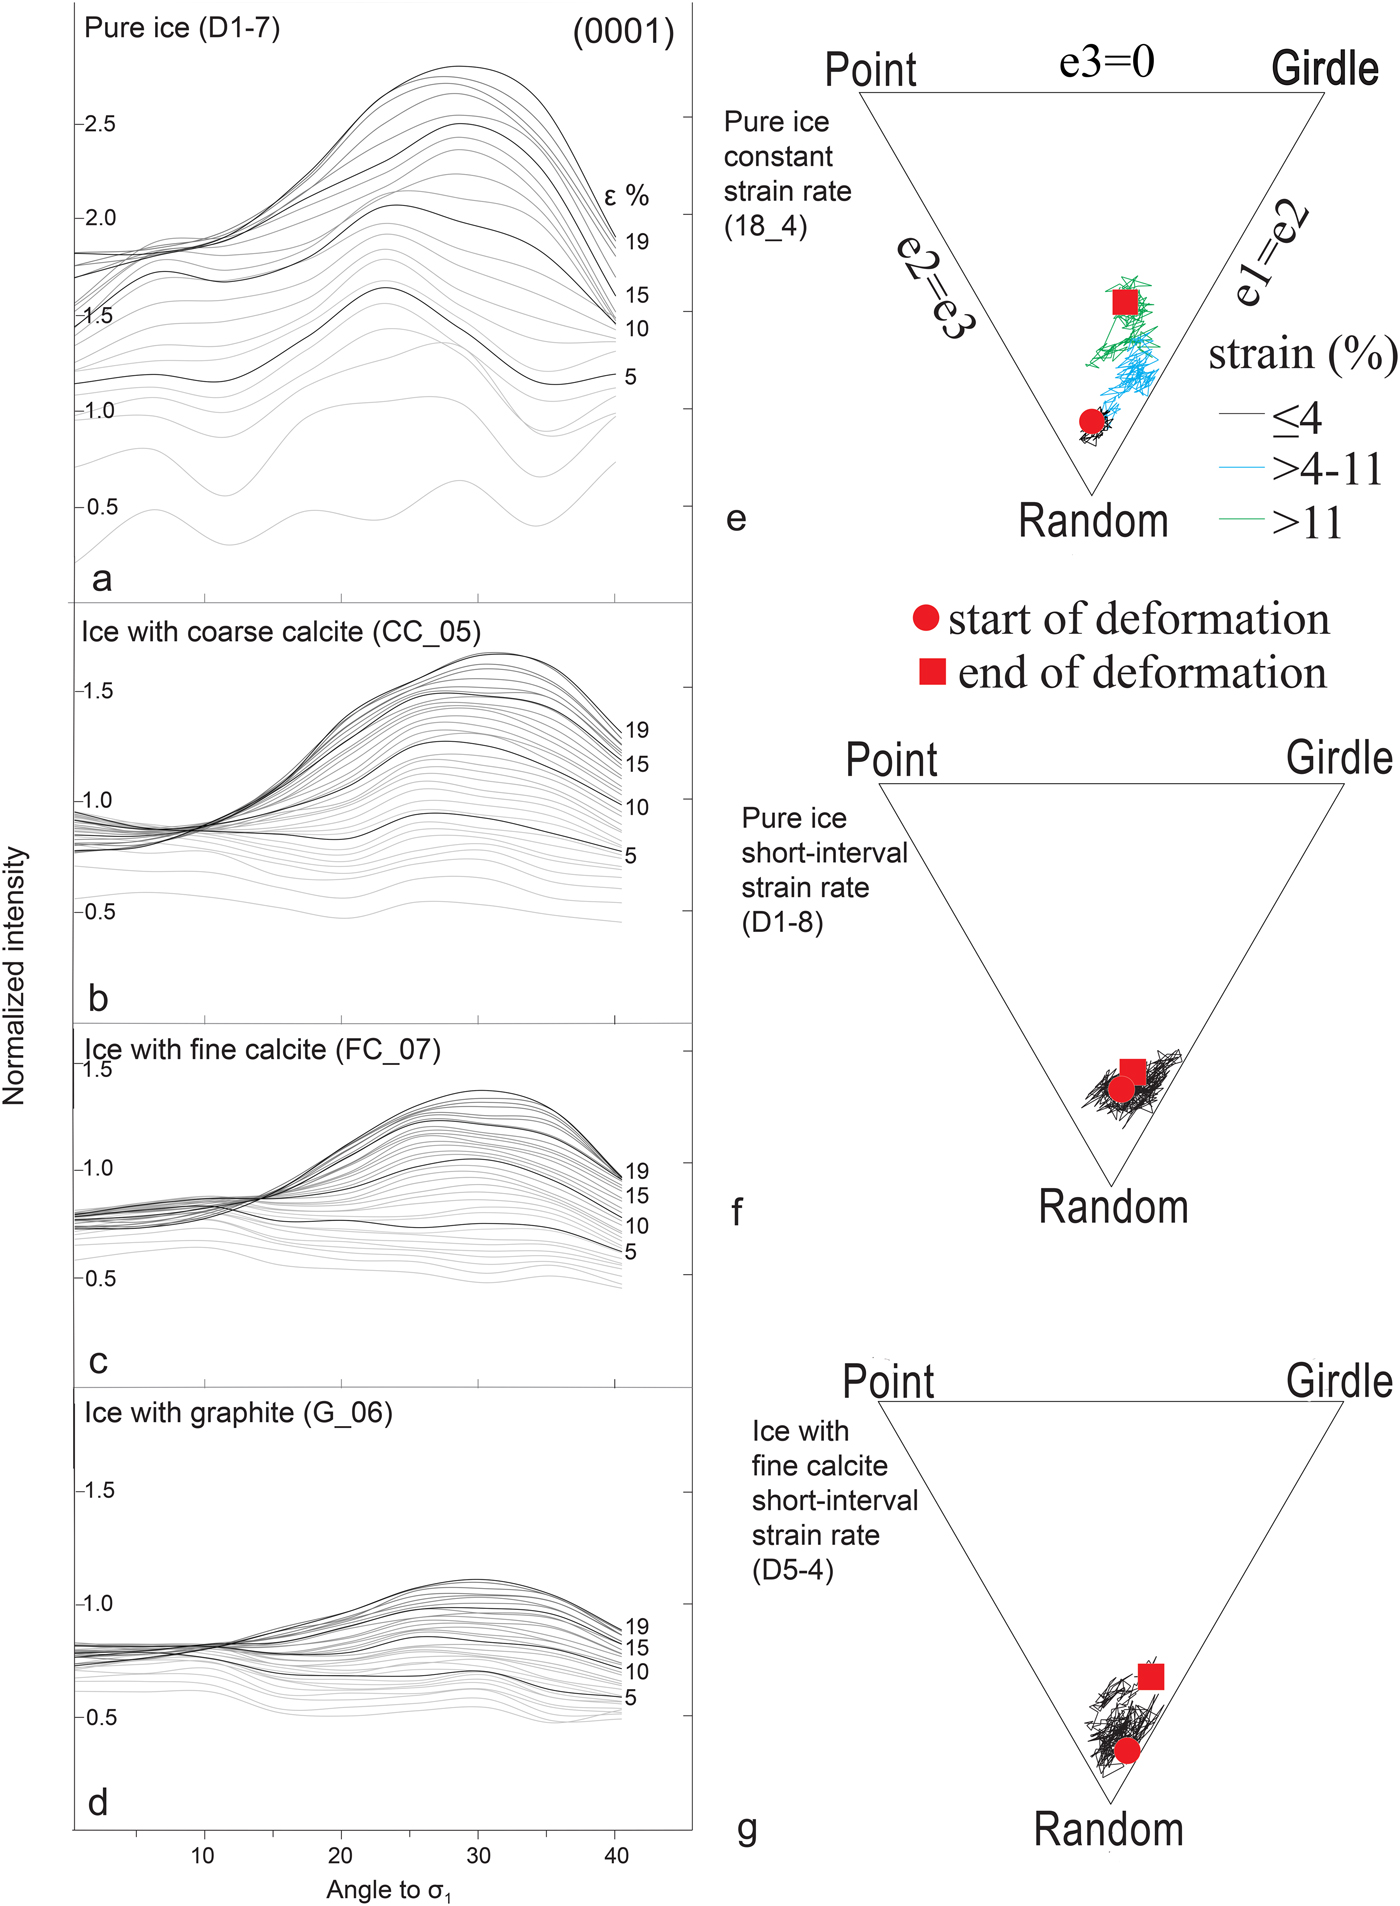
The evolution of the CPO development in the 3-D experiments can be derived from measurements taken from partial pole figures (Figs 14a–d). The partial pole figure is measured from χ = 0° to χ = 40°, at selected time intervals (Table 2) and used to obtain the neutron diffraction grain size (Fig. 11) and textural evolution (Figs 14a–d). As the maximum intensity of (0001) orientations lies at χ < 40°, we are able to characterize the developing CPO. The incomplete pole figures show the increasing intensity of the (0001) maximum at χ ~ 30–35°, with progressive deformation. In the ice-only sample (Fig. 14a) and sample with coarse-grained calcite (Fig. 14b), this peak becomes visible at ~5% shortening, whereas in ice with fine-grained calcite (Fig. 14c) and graphite (Fig. 14d) the peak forms at strains of ~10 and 15%, respectively. In the 2-D experiments, CPO development was derived using the eigenvectors of the orientation tensor (Scheidegger, Reference Scheidegger1965; Woodcock, Reference Woodcock1977) at each increment of strain (Peternell and Wilson, Reference Peternell and Wilson2016) and plotted on a ternary PGR diagram (Point-Girdle-Random diagram, Vollmer, Reference Vollmer1990; Fig. 14e). In the constant strain rate experiments on pure ice, the E1 eigenvector vector shifts from a random orientation towards a girdle after >4% shortening (Fig. 14e). Where there are short-interval changes in strain rate (Fig. 14f) and/or the presence of calcite (Fig. 14g), there are only minor changes in the nature of the CPO.
Partial pole figures of (0001) obtained during the 3-D and PGR (point, girdle, random) ternary diagrams (Vollmer, Reference Vollmer1990) from 2-D experiments illustrating the evolution of the (0001) CPO with increasing strain. (a–d) Neutron diffraction data as a function of strain and second-phase composition (modified after Cyprych and others, Reference Cyprych, Piazolo, Wilson and Luzin2016). (e–g) PGR diagrams, based on [c]-axis pole figures in (Fig. 9) and calculated from the normalized eigenvalues of the orientation tensor (Vollmer, Reference Vollmer1990), and estimating the degree to which [c]-axes define a point (P), girdle (G) or random (R) distribution. A characteristic ‘CPO path’ defining the systematic change of CPO from start to termination of deformation at ~20% shortening.
The J-index correlates well with the above observed changes, in other words the overall intensity and sharpness of the CPO peak is strongest for pure ice and weakest for the bubble ice and graphite-bearing ice (Fig. 15). Fast strain rates are the major contributor to the CPO strength in both the pure and bubble ices. In contrast, medium strain rates contribute to the higher J-index values observed in ice with a dispersed second phase. Dispersion of 20 vol.% fine calcite or graphite in ice has a greater effect than coarser calcite. As the volume proportion of second phase is increased to 40%, this obviously restricts CPO development. This is more obvious where there are interconnected layers of a weak material such as graphite (Fig. 15).
Plot of J-index variation for ice from neutron diffraction data as a function of strain rate and second-phase composition. (a) Comparative plot of data for strains (ε) of 20% except for one sample of bubble ice (MD11; ε = 36%) and a sample containing 40 vol.% graphite (GG_04; 6%). (b) Plot of J-index intensity vs strain rate for samples deformed 20%. Strain rate sensitivity is seen in the pure ice where a fast strain rare has the highest J-index. A decrease in strain rate produces the highest intensities where there is a second phase.

7. DISCUSSION
7.1 Deformation and recrystallization mechanisms in the D2O ice
The microstructure of the pure ice at a fast strain rate shows evidence for operation of dislocation creep processes and the production of CPOs with the highest J-index (Fig. 15). The results in the pure ice are also representative of what is happening in the matrix of samples containing dispersed calcite and graphite. There is a widespread formation of optically visible subgrain substructures, wavy extinction and grain boundary migration in all investigated samples (Fig. 11). Analyses of these microstructures by EBSD (Cyprych and others, Reference Cyprych, Piazolo, Wilson and Luzin2016) indicates that most of the strain is produced by dislocation creep occurring as a glide on the easy basal <a> slip system.
In the medium strain rate experiments, grain boundary migration has been observed to accommodate basal <a> slip, but produces a weaker CPO (Figs 13, 15). Grain boundary migration is particularly obvious when deformation proceeds beyond the peak stress. This involves processes competing between grain size increase due to surface energy reduction, internal energy reduction and grain size reduction due to strain-induced nucleation. During a mechanical steady state, grain growth and grain size reduction processes balance, involving nucleation of new grains, and yields a constant flow stress (Figs 7d, e, 8). We believe that the grain size evolution is not steady state (Fig. 7), but represents an equilibrium between grain size reduction and grain growth processes, involving subgrain boundary rotation and grain boundary migration. There may also be the influence of either lattice strain energy or surface energy (e.g. Urai and others, Reference Urai, Means, Lister, Heard and Hobbs1986; Derby and Ashby, Reference Derby and Ashby1987; De Bresser and others, Reference De Bresser, Peach, Reijs and Spiers1998) in the deformed material. However, we do not recognize the temperature-dependent static grain growth described by Alley and others (Reference Alley, Perepezko and Bentley1986).
In the fast deformation of the bubble ice, during the first 10% of shortening, a different microstructural evolution (Fig. 2b) occurs before reaching a peak stress. There is a lack of strong intracrystalline distortions and pronounced clustering of [c]-axes parallel to the compression axis (σ 1), which may reflect the role of the pore spaces attributed to the bubbles. These pores probably accommodated external rotation and the formation of elongate grains, exhibiting wavy grain boundaries (Fig. 2b), with a dominant activity of [c] as a slip direction, before the onset of normal crystal plastic mechanisms. Initially some processes, such as surface or volume diffusion, would rapidly accommodate the pores or crystal overlaps. This strong single maxima CPO development seen in the bubble ice is remarkably similar to what has been observed in the initial stages of deformation of pure ice, where there is also removal of voids. From partial pole figure data obtained in the first 1.5% shortening in the pure ice, there is a consistent weak but dominant component of [c]-axes parallel to the compression axis (e.g. Piazolo and others, Reference Piazolo, Wilson, Luzin, Brouzet and Peternell2013).
The microstructures in the bubble ice, and the accompanying strong single maxima CPO (Figs 2b, c), are comparable to features developed in ‘polar firn’ (Kipfstuhl and others, Reference Kipfstuhl2009) or from dissolution–precipitation creep in quartz (den Brok, Reference den Brok1996). This raises the question of what driving forces dominate during the initial stages of deformation in the bubble ice. Is it possible that differences in elastic deformation (stress) between the grains in the bubble ice are controlled by dissolution or growth rate (cf. Kamb, Reference Kamb1959) similar to processes of precipitation and dissolution? Den Brok (Reference den Brok1996) pointed out that if stress is important then it will be grains with a small angle between [c]-axis and the Z-axis of shortening that exhibit the least amount of dissolution, whereas grains ~50°, to Z manifest the highest degree of dissolution. An alternative model has been proposed by Kipfstuhl and others (Reference Kipfstuhl2009) for ‘firn’ that dynamic recrystallization is achieved by strain-induced boundary migration, where the largest grains (e.g. Fig. 3b) steadily increase their cross-sectional area by rapid migration of old grain boundaries through a build-up of dislocation densities. However, as pointed out by Brumberg and others (Reference Brumberg2017) at the solid–vapour interface of a bubble, surface energies are the fundamental connection between macroscopic shape and molecular configuration. Such a connection in ice is dominated primarily by prism and basal faces (Brumberg and others, Reference Brumberg2017) with mechanical stresses strongly impacting the shape (Handel and others, Reference Handel, Davidchack, Anwar and Brukhno2008). This may explain the initial shape and CPO structure in the bubble ice.
A marked change in microstructure occurs in the bubble ice deformed to higher strains (e.g. ε = 36%; Fig. 3d) with the nucleation of new grains. This appears to be driven by lattice strain energy and grain boundary surface energy. The grains are interlocking, substructures are abundant, and grain boundaries have irregular shapes, without any memory to its former structure and developing a CPO comparable to that of the pure ice. It is important to appreciate that at T = −7°C the generation/build-up of dislocations by dislocation climb and glide and elimination of dislocations by new low dislocation nuclei and their subsequent growth are competing as mechanisms, but the relative contribution from each changes as external conditions change. As pointed out by Piazolo and others (Reference Piazolo, Wilson, Luzin, Brouzet and Peternell2013), more than one mechanism or process will dominate at different stages in the rheology (Fig. 7d) and these are dependent on the strain rate and can be identified in intensity profiles (Figs 7a–c). In Stage 1, there is a grain boundary migration with relatively little change in grain size. During Stage 2, there is a general grain size reduction. Stage 3 is characterized by a decrease in the rate of grain size reduction. During Stage 4, grain size shows a general stabilization with some fluctuations and slight grain size increases as there is a competition between grain nucleation and grain growth.
7.2. Microstructural differences in relationship to second-phase content
Even though the overall behaviour of the ice involves the onset of intracrystalline plasticity, involving dislocation glide, the rheology (Fig. 8) is markedly sensitive to composition and volume fraction of a second phase. Compared with pure ice, with volume fraction of >20 vol.% or change from coarse to fine calcite, there was mechanical hardening (cf. Table 1). This has been attributed to viscous drag in the ice as it flowed around particles (Durham and others, Reference Durham, Kirby and Stern1992). In such a situation, impurities can become localized at grain boundaries (e.g. Fig. 11c) and impede boundary movement if driving forces are not sufficient to allow the boundaries to move past them. These dispersed phases produce localized rheological instabilities that commences with dislocation creep but deformation is rapidly accommodated by diffusion creep.
Due to the pinning effects of secondary particles, grain growth is effectively prohibited and the matrix grain size is kept relatively fine (e.g. Figs 10d, 11d). Pinning by secondary particles also suppresses the flow and makes the ice stiffer. For instance, the ice–graphite samples initially exhibited strain hardening, but the stress–strain curve stabilized (Figs 8b, c) and there was a little weakening in comparison to the pure ice. In ice–calcite samples deformed at finite strains >20% shortening, there is also further hardening (Fig. 7e). The application of in situ textural analysis (Figs 7a–c) also allows one to correlate CPO development with progressive strain and microstructural processes. Fluctuations in textural intensities and character from a random initial [c]-axis preferred orientation (at 0.25% shortening) occur with progressive deformation. At a finite strain of 6.7% shortening, intensity increased then decreased at 16.8% shortening. This decrease suggests nucleation of new recrystallized grains, which progressively grow to produce an increased intensity by 20.5% shortening. Even though the stress–strain relationship is steady state after ~10% strain, the presence of calcite extends the process of new grain nucleation (stage 3; Fig 7e) in comparison to pure D2O (Fig. 7d).
Our study and that of Peternell and Wilson (Reference Peternell and Wilson2016) indicate that pinning by second-phase inclusions does significantly restrict grain boundary migration and CPO development during deformation. This is supported by observations in many ice core studies (e.g. Gow and Williamson, Reference Gow and Williamson1976; Gow and others, Reference Gow1997; Durand and others, Reference Durand2006). However, these observations are contrary to the microstructural conclusions reached by Eichler and others (Reference Eichler2017) in a study of four polar ice cores. They suggested that there is no significant correlation between grain boundaries and inclusion distributions. Unfortunately, Eichler and others (Reference Eichler2017) fail to consider the difficulties of preserving deformation microstructures in ice cores because of stress and temperature differences post-deformation. It is probably for this reason that natural ice grains overgrow inclusions, by a process of static annealing as described by Alley and others (Reference Alley, Perepezko and Bentley1986).
Measurements of the changes in shapes of the bubble ice and pure ice are approximately the same (aspect ratios ~1.38; Figs 10a–c). However, there is a notable increase in grain boundary migration and the production of larger grains during the slower deformation experiments (Fig. 10c). Increased second-phase content inhibits effective grain growth by pinning of grain boundaries and this leads to weaker ice CPOs with original distributions of calcite producing a dispersed distribution of single ice grains (Fig. 10d).
Ice with soft particulates, such as graphite (Fig. 5), has microstructures and localized CPOs that depend on the distribution of the harder ice phase. Exclusive ice regions (X1 and X2 in Fig. 10f) are recrystallized and their boundaries indicate extensive grain boundary migration (Fig. 11f). In the graphite–ice matrix, the ice occurs as either elongate aggregates (Figs 10e, 11e) or as dispersed isolated grains with undulose extinction with aspect ratios of ~2. Interparticle distance between the ice grains increases with 40 vol.% graphite with a marked grain size reduction and grain shape variation (Fig. 10g). The graphite pins the ice grain boundaries and there are variations in grain shape as a result of increasing contact with graphite grains. As the abundance of graphite decreases, the rate of grain boundary migration and localization increases (Figs 10e, g) and the CPO increases (Fig. 5b). The weak CPOs in the 40 vol.% sample can be explained by Zener drag forces (Herwegh and Berger, Reference Herwegh and Berger2004) from the second phase and lack of strain accommodation in the ice grains may suggest that strain was more easily accommodated in the adjacent graphite.
7.3. CPO development in relationship to strain rate conditions
Considerations of combined strain rate and different dispersed phases in ice have several implications, first for the interpretation of CPOs and second for the rheology in natural ice masses and rocks. The behaviour of the two-phase materials at a constant temperature is strongly dependent on strain rate, mineral volume proportion and stiffness of the second phase. In a monomineralic aggregate (e.g. pure or bubble ice), the greatest degree of CPO development (Fig. 15) occurs during the fast strain rate regime. In contrast, after a second phase is added, the highest CPO intensities are recorded in the slower strain rate experiments (Fig. 15). These CPO intensities diminish with reduction in grain size of the second-phase particles (e.g. coarse vs fine calcite; Fig. 14b vs Fig. 14c) or with an increase in volume fraction of second phase (20 vs 40 vol.%). At a constant strain rate, this probably reflects a switch from fully viscous and fast flow in the mono-mineralic material, facilitated by dislocation glide plus climb, to the onset of slower processes accommodated by diffusion and/or by the nucleation and growth of new grains, which may be hampered by the second phase. If there is a short-term cycling of strain rate, then identifiable CPO pattern development, in both pure ice (Fig. 9c) and calcite-rich ice (Fig. 9d), is impeded by the rate of grain boundary migration.
The 3-D samples with fine calcite exhibit a distinct strain hardening even at low strains (Figs 8b, c). This is also reflected in lower rates of CPO evolution (Fig. 14c) and CPO intensities particularly at fast strain rates (Fig. 13d). The accompanying grain size evolution in the 3-D sample (FC_11, Fig. 12) is also less than average grain sizes from the 2-D short-interval changes of strain rate (D5_4, Fig. 12), where CPO patterns are comparable with the initial random distribution (Figs 14f, g). The results from graphite–ice samples reflect a less pronounced CPO development (Figs 13e, 14d) and a distinct rheological hardening at higher strains (Fig. 12), particularly if the graphite content is increased (Fig. 13e).
The CPO development is directly related to cumulative strain, crystal slip, disappearance of unfavourable orientations and sum of strain, strain rate, stress, bulk or rigid body rotation. The degree to which individual [c]-axes rotate is also governed by the distribution and nature of the particulate. With deformation, each ice crystal is initially accommodated by dislocation glide by basal slip plus climb and grain boundary migration. In the presence of a rigid particulate, the slip systems in individual grain can only accommodate a limited amount of rotation out of easy glide orientations before being consumed by neighbouring grains during grain boundary migration. In fact, grain boundary migration plays a central role in maintaining strain compatibility. Grains with high dislocation densities do not survive if grain boundaries can migrate. Whereas, if grain boundaries do not migrate and they survive, then the CPO is weaker.
7.4. Strain partitioning processes in the ice
The proportion and grain size of calcite and graphite particles have a pronounced effect on the deformation-induced grain size (Fig. 12), CPO evolution (Figs 13, 14a–d) as well as localizing strain in the ice matrix. It is the dissimilar rheologies of the constituent phases that gave rise to stress differences and strain incompatibilities within the ice aggregate. The bulk stress identified after each strain increment (Fig. 8) in these materials reflects the effects of domainal structural heterogeneities (Figs 10e, g) on stress and strain portioning within the aggregate. It is the second phases that hinder grain boundary migration by dragging or pinning the grain boundaries in the ice matrix (Herwegh and Berger, Reference Herwegh and Berger2004). This then results in the stabilization of specific energetically favourable orientations and will enhance grain elongation parallel to the shape-preferred orientation of platy second phases (e.g. graphite, Figs 10e, g) to produce a foliation.
In the ice–calcite samples, there is a load-bearing framework of stronger calcite, particularly where there is a greater volume of fine particles, which produces isolated pockets in the weak ice phase (Fig. 10d). The stress dependence on strain rate in this strong phase significantly exceeds that in pure ice, so the bulk strain rate is concentrated into the weaker ice. The coalescence into pockets of fine calcite is enhanced by dynamic recrystallization in the weaker ice phase where stress concentrations become sufficiently large to induce unstable flow and elongation of the ice in the plane of flattening.
In the graphite-bearing ice, there are interconnected layers of weaker platy graphite grains deforming faster than the stronger ice phase (Figs 10e, g) and this is reflected in the higher stress exponent (Cyprych and others, Reference Cyprych, Piazolo, Wilson and Luzin2016) than observed in the ice–calcite samples. Graphite deforms easily via basal slip, even at low temperatures and stresses (Soule and Nezbeda, Reference Soule and Nezbeda1968) and rotates to orientations perpendicular to σ 1 while the plastic strain accommodated by the ice is reduced. In the graphite-bearing samples, it also appears that strain compatibility is predominantly along incoherent phase boundaries and this leads to a higher stress in the ice and low nucleation rates in the stronger ice phase. Anisotropic grain boundary migration results in a high shape-preferred orientation of ice grains (Fig. 10e). As a result, a strong foliation and CPO (Fig. 5) defined by graphite develop. Local deviations from homogeneous strain occur in the immediate vicinity of inherited aggregates of ice (X in Fig. 5a) or graphite (Y in Fig. 5c), probably reflecting localized differential stresses that are relaxed as the phases deform with respect to each other.
8. CONCLUSION
Our results indicate that, at a given temperature, the grain size distribution and the CPO development, as indicated by the J-index, are sensitive to strain rate, via a competition between grain growth and grain size reduction processes in a dislocation creep regime. The flow of ice with particulates may be much more heterogeneous than generally assumed, as neither the CPO nor the optical microstructure clearly reveals the cause of the sensitivity to strain rate. This is only revealed when CPO intensities and rheologies are compared, in pure vs ice-carrying particulates, deformed under equivalent strain rates. Fast strain rates are the major contributor to CPO intensity and the weakening in pure ice, with weaker CPO intensities produced in pure ice under slower deformation conditions. In contrast, lower strain rates in materials with a second phase produce higher CPO intensities. These CPO intensities are reduced, while rheological strength of an aggregate increases, as the vol.% of the second phase is increased or if there is a cycling of strain rate.
The presence of volume fractions with >20% particulate phase is accompanied by a strength increase relative to that of pure ice. Inclusion of finer grained phases causes the ice to become more creep resistant with higher stresses necessary to achieve the onset of strain weakening. The strain-hardening behaviour described here is reduced as the applied strain rate is reduced. With relatively slower strain rates, there are more bimodal grain size distributions only developed in the final grain microstructure of the pure ice. Where there are finer particulates and platy phases, such as graphite, there is a greater restriction on grain growth and a greater development of deformation features such as subgrains within the enclosing ice. This may have implications for the prediction of the rheology of natural ice, which may be either weakened, in the case of bubble ice or firn, or strengthened by the presence of second phases.
Therefore, once constant physical conditions are identified, it is straight forward to obtain insights into the flow conditions of ice by evaluating the nature of the J-index. Lower values in a system containing a dispersed phase are thus ideal natural strain rate gauges, in combination with ice radar or seismic reflection data, for the identification of palaeo-deformation conditions in an ice sheet. We have further provided indications of transient conditions between diffusion processes during compaction of ‘firn’ (bubble ice) and the dislocation creep processes that operate in pure ice. Furthermore, the concepts presented here could provide new insights into the development of layering developed in glaciers and ice sheets that contain high particulate concentrations.
ACKNOWLEDGEMENTS
This work was supported by the Australian Nuclear Science and Technology Organisation through projects 1702, 2178 and 2910 and undertaken at Lucas Heights, Australia. The technical support and discussions with ANSTO staff and Daria Cyprych are gratefully acknowledged. SP acknowledges support from the Australian Research Council Future Fellowship (Project FT1100070). CJLW, MP and NH acknowledge support from the bilateral DAAD-Australia-Germany Joint Research Co-operation Scheme (Project 57316937). Bill Durham and an anonymous referee made valuable comments that resulted in improvements in the paper.
APPENDIX
EVALUATION OF EXPERIMENTAL TECHNIQUES
Complementary fabric analyser and neutron diffraction data were obtained from most samples to: (1) compare [c]-axis CPOs; and (2) understand microstructural evolution from optical observations and undertake grain size analysis. Comparative analyses of [c]-axis patterns (Figs 2–5) show that the best qualitative and quantitative means of establishing the CPO was by neutron diffraction (Fig. 6), as it has 3-D data acquisition and larger sample volume (Hunter and others, Reference Hunter, Wilson and Luzin2017). Whereas, the fabric analyser technique was suited for grain-scale analyses, where individual orientations could be linked to their source grains. However, the fabric analyser's efficiency for gathering orientation data from highly undulose grains is limited by geometrical and retardation quality values (Peternell and others, Reference Peternell2009) and some caution needed to be undertaken. This was particularly the case with ice–graphite samples, where graphite can underlie the ice crystals inhibiting geometrical and retardation quality. In contrast, the fabric analyser was an excellent tool in capturing thin-section images made from the deformed sample.
In undertaking the 2-D experiments, using optical techniques (Wilson and others, Reference Wilson, Russell-Head, Kunze and Viola2007), the field of view (5 × 5 mm) was limited to only a portion of the sample which is 1.5 cm × 3 cm and 250–300 µm thick. The optical data had a resolution of 5 µm/pixel and produced excellent grain maps so that microstructural features could be coupled to orientations. As these were plane strain experiments, with the sample constrained by two glass plates, some grains will have a high Schmid factor (Azuma, Reference Azuma1995), with a hardening component that depends on the angle between the grains [c]-axis orientation and the glass plate. For this reason, many grains undergo inhomogeneous stress distributions on the inter-grain and intra-grain scales (Wilson and Zhang, Reference Wilson and Zhang1994) and this may partially explain the bimodal grain sizes and more random CPOs (Figs 8c, d). As pointed out by Wilson and Zhang (Reference Wilson and Zhang1994), the triple-point junction in a grain with an easy-glide orientation is often migrating at the expense of grains in hard-glide orientations and this may explain the weaker CPOs.
A problem pointed out by Woodcock (Reference Woodcock1977) is that when representing changes in CPO evolution for 2-D data using the eigenvector method on PGR diagrams (Vollmer, Reference Vollmer1990), we cannot adequately represent certain types of multimodal data. For this reason, the evolution of small-circle cones (Figs 13a–d) seen in an equal-area stereonet plots would wrongly return a random result from similar data sets if plotted on a PGR diagram (Figs 14e–g). For this reason, we recommend inspecting the form of the data on an equal-area plot before accepting the PGR results.

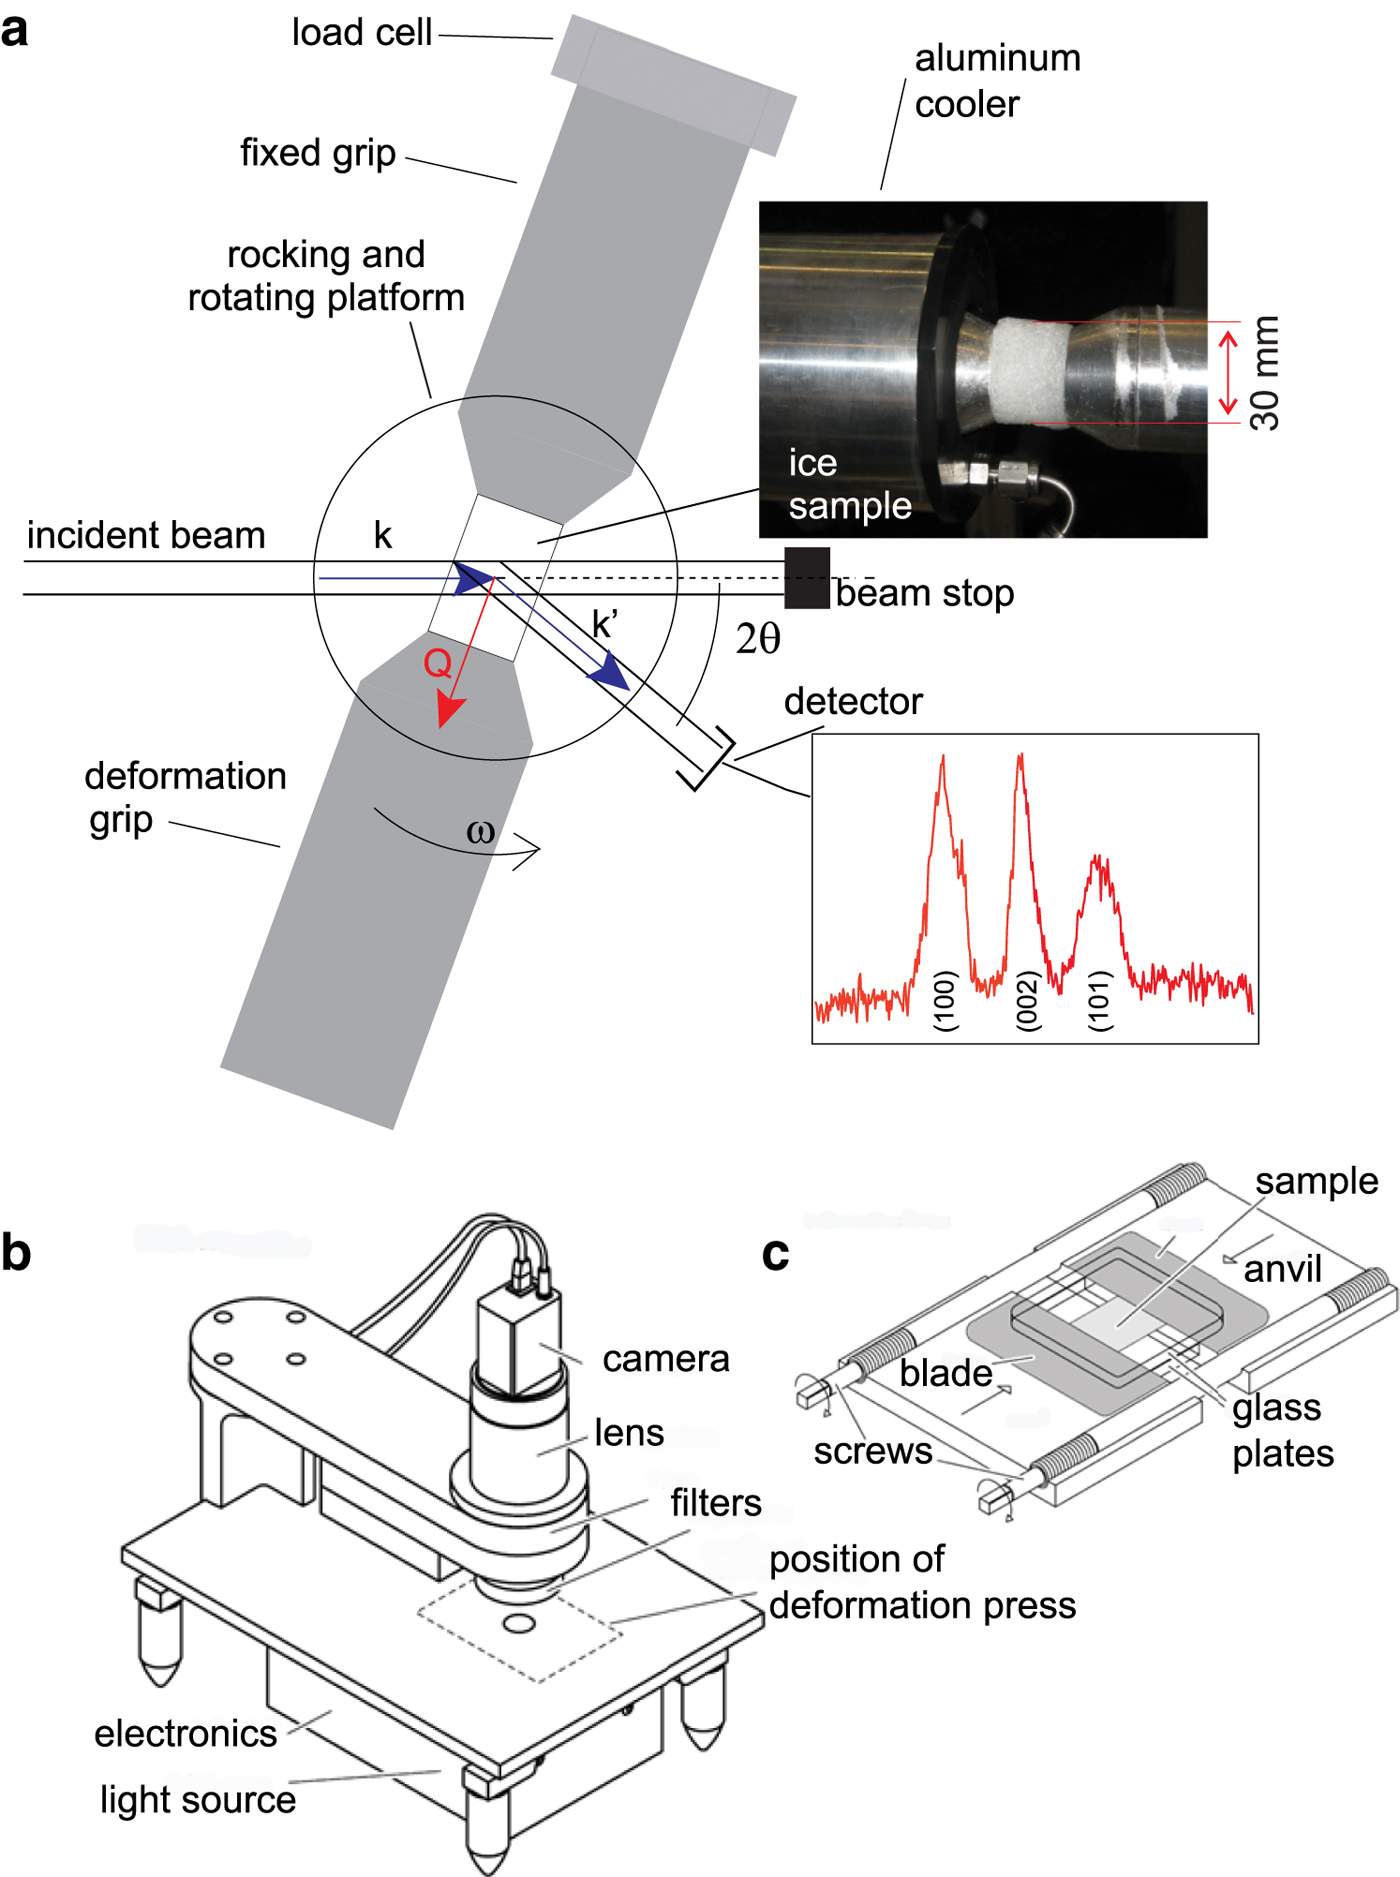
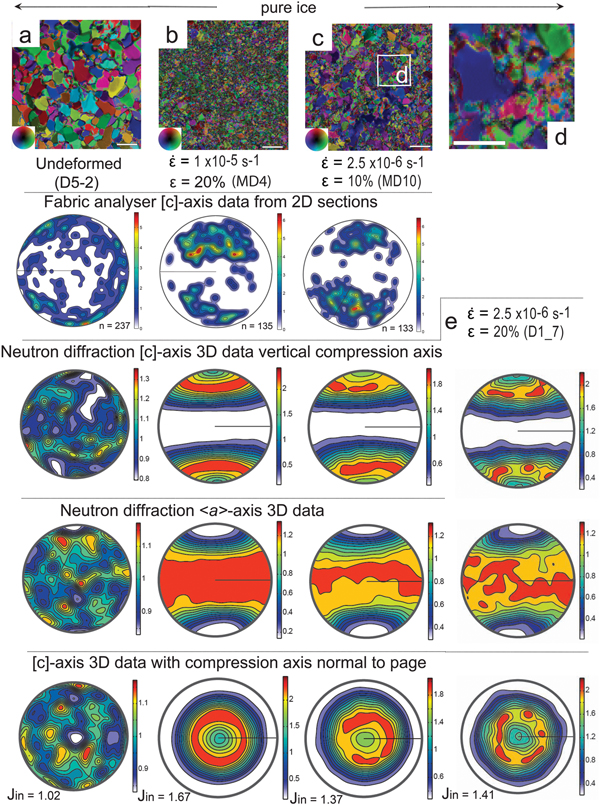


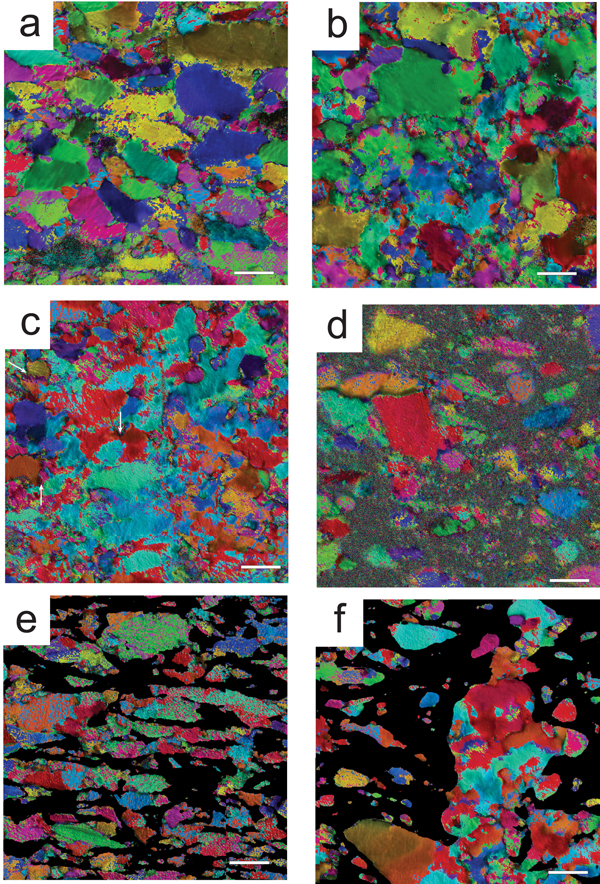

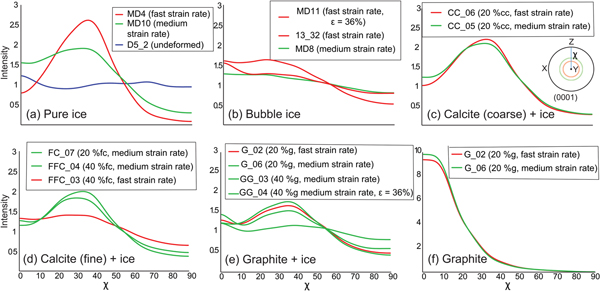


 Open access