

I. INTRODUCTION
As scientific efforts continue to focus on materials with ever finer structural length scales, chemical effects at interfaces in nanostructured materials have attracted the attention of researchers across different disciplines. Reference Zhao, He, Daemen, Shen, Schwarz, Zhu, Bish, Huang, Zhang, Shen, Qian and Zerda1–Reference Bechtle, Kumar, Somerday, Launey and Ritchie7 Preferential segregation of minority atoms to grain boundaries (GBs) has often been observed and can either be beneficial or detrimental to material performance. Reference Bechtle, Kumar, Somerday, Launey and Ritchie7–Reference Luo, Cheng, Asl, Kiely and Harmer11 Recent studies have revealed numerous cases where chemical distribution in nanostructured materials is affected by the prominence of interfaces, some to the extent that the observed structure is entirely different from expectations in bulk systems. Reference Li, Choi, Goto, Borchers, Raabe and Kirchheim12–Reference Chookajorn and Schuh15 These generally include segregation of certain atoms at grain boundaries and unusual chemical distributions associated with intergranular or amorphous phases. Reference Detor and Schuh16–Reference Ruan, Torres, Thompson and Schuh18 Whereas the design of topological characteristics and crystallography of interfaces is a common approach to GB engineering, Reference Bechtle, Kumar, Somerday, Launey and Ritchie7,Reference Watanabe and Tsurekawa8,Reference Schuh, Kumar and King19–Reference Beyerlein, Zhang and Misra23 the above effects allude to a generalizable chemical approach of GB segregation engineering. Reference Weissmüller24–Reference Raabe, Herbig, Sandlöbes, Li, Tytko, Kuzmina, Ponge and Choi33 The overlap between chemical and topological considerations opens a unique avenue for structural design. Reference Tang, Carter and Cannon34–Reference Cantwell, Tang, Dillon, Luo, Rohrer and Harmer39
In addition to GB solute segregation in nanocrystalline materials, multiphase nanocrystalline structures may also have interesting properties. Nanoscale minority phases are regularly found in microstructures with a tendency for phase separation but with inadequate diffusion to fully reach the preferred bulk state. On the other hand, in nanostructured materials, formation of nanoscale phases does not necessarily rely on kinetic strategies. Reference Chookajorn and Schuh15,Reference Baletto and Ferrando40–Reference Chookajorn, Murdoch and Schuh43 Refinement in grain size is accompanied by a significant increase in volume fraction of grain boundaries, which consequently facilitates the development of interface-associated second phases. States that are unavailable in bulk systems can be accessed and thus open up a more extensive design space for new alloy configurations. In some cases, the resulting configurations can be lower in energy compared to the original bulk states and ultimately result in a possibility of energetically preferred nanophases. Reference Weissmüller24–Reference Weissmüller26,Reference Chookajorn, Murdoch and Schuh43–Reference Chookajorn and Schuh45
It has been the subject of some of our group's recent work
Reference Chookajorn and Schuh45
to explore alloy systems with a minor tendency for solute precipitation, outweighed by their tendency to exhibit solute segregation at grain boundaries. These kinds of systems can, in principle, exhibit enthalpic stabilization of the grain boundaries by the solute, and indeed GB segregation of solute is the most preferred bonding state in them. We call these “classical” stabilized nanocrystalline systems, since the polycrystalline state is lower in internal energy compared to any bulk alternatives. In these systems, alloying promotes a higher fraction of grain boundaries to accommodate the solute in the form of GB segregants, and thus finer grain sizes are achieved by adding more solute. The equilibrium grain size occurs at a minimum in Gibbs free energy with respect to the change in GB area $\left( {{{{\mathop{\rm d}\nolimits} G} \over {{\mathop{\rm d}\nolimits} A}} = 0} \right)$
, and at similar minima in internal energy and enthalpy as well.
Reference Chookajorn and Schuh45
$\left( {{{{\mathop{\rm d}\nolimits} G} \over {{\mathop{\rm d}\nolimits} A}} = 0} \right)$
, and at similar minima in internal energy and enthalpy as well.
Reference Chookajorn and Schuh45
In the present paper, the thermodynamics of bulk structures and stable nanostructures with GB segregation will be overviewed with a focus on nanostructures where the balance between second phase precipitation and GB solute segregation is somewhat different from that in the “classical” nanocrystalline alloys described above. Specifically, we will focus on systems where enthalpy favors second phase formation, while entropy can stabilize solute-segregated grain boundaries. In such systems, a “duplex nanostructured” state can be found, Reference Chookajorn and Schuh45 although we are not aware of prior work systematically exploring such materials. In this paper, we present a simulation-based analysis of their behavior and characteristics, as well as a first experimental study on one alloy in which such a duplex nanostructure might be expected.
II. ENTROPICALLY SUPPORTED GB SEGREGATION
In our previous work (Refs. Reference Chookajorn and Schuh15, Reference Chookajorn and Schuh45, and Reference Chookajorn46), we introduced a nearest-neighbor Monte Carlo (MC) simulation for nanostructured binary alloys and demonstrated its application to several alloy systems. The model simulates an alloy's equilibrium structure through a sequence of switches on a fixed lattice at constant volume. Each lattice site is assigned a chemical identity of a solvent (A) or solute (B) atom and a grain number that identifies the grain allegiance. There are therefore six nearest-neighbor bond types in the system, i.e., $E_{\rm{c}}^{{\rm{AA}}}$
,
$E_{\rm{c}}^{{\rm{AA}}}$
, $E_{\rm{c}}^{{\rm{BB}}}$
, and
$E_{\rm{c}}^{{\rm{BB}}}$
, and $E_{\rm{c}}^{{\rm{AB}}}$
in the crystal (c) and
$E_{\rm{c}}^{{\rm{AB}}}$
in the crystal (c) and $E_{{\rm{gb}}}^{{\rm{AA}}}$
,
$E_{{\rm{gb}}}^{{\rm{AA}}}$
, $E_{{\rm{gb}}}^{{\rm{BB}}}$
, and
$E_{{\rm{gb}}}^{{\rm{BB}}}$
, and $E_{{\rm{gb}}}^{{\rm{AB}}}$
in the GB. For the simulations in this paper, we assign
$E_{{\rm{gb}}}^{{\rm{AB}}}$
in the GB. For the simulations in this paper, we assign $E_{\rm{c}}^{{\rm{AA}}} = E_{\rm{c}}^{{\rm{BB}}} = 1.26\;{\rm{eV}}$
and
$E_{\rm{c}}^{{\rm{AA}}} = E_{\rm{c}}^{{\rm{BB}}} = 1.26\;{\rm{eV}}$
and $E_{{\rm{gb}}}^{{\rm{AA}}} = E_{{\rm{gb}}}^{{\rm{BB}}} = 1.21\;{\rm{eV}}$
. We vary the other bond energies to effect different values of the regular solution grain interaction energy,
$E_{{\rm{gb}}}^{{\rm{AA}}} = E_{{\rm{gb}}}^{{\rm{BB}}} = 1.21\;{\rm{eV}}$
. We vary the other bond energies to effect different values of the regular solution grain interaction energy, ${\omega _{\rm{c}}} = E_{\rm{c}}^{{\rm{AB}}} - {{E_{\rm{c}}^{{\rm{AA}}} + E_{\rm{c}}^{{\rm{BB}}}} \over 2}$
, and GB interaction energy,
${\omega _{\rm{c}}} = E_{\rm{c}}^{{\rm{AB}}} - {{E_{\rm{c}}^{{\rm{AA}}} + E_{\rm{c}}^{{\rm{BB}}}} \over 2}$
, and GB interaction energy, ${\omega _{{\rm{gb}}}} = E_{{\rm{gb}}}^{{\rm{AB}}} - {{E_{{\rm{gb}}}^{{\rm{AA}}} + E_{{\rm{gb}}}^{{\rm{BB}}}} \over 2}$
, as described in more detail in Ref. Reference Chookajorn and Schuh45. All of the simulations employ a body-centered cubic (BCC) lattice.
${\omega _{{\rm{gb}}}} = E_{{\rm{gb}}}^{{\rm{AB}}} - {{E_{{\rm{gb}}}^{{\rm{AA}}} + E_{{\rm{gb}}}^{{\rm{BB}}}} \over 2}$
, as described in more detail in Ref. Reference Chookajorn and Schuh45. All of the simulations employ a body-centered cubic (BCC) lattice.
The chemical distribution is equilibrated through atom switches, which select two lattice sites at random and exchange their chemical types. The grain structure is equilibrated by grain switches, by which an atom at a GB site can change its grain allegiance to that of its neighbor's across a GB or nucleate a new grain with a unique grain number. Triple junctions were allowed to form and evolve naturally with no unique additional physics beyond that of the grain boundaries themselves. Other defects and their interactions with solute atoms are also neglected here for simplicity, including point defects (vacancies) and dislocations. A type of switch is first selected at random and the switch is always executed if it results in lower internal system energy (found by summing all the bond energies). On the other hand, a switch that results in higher internal system energy E
2, compared to the initial internal system energy E
1, is accepted at a probability ${e^{{{ - \left( {{E_2} - {E_1}} \right)} \over {{k_{\rm{B}}}T}}}}$
, where k
B is the Boltzmann constant and T is the absolute temperature of the system. The system is initialized at 10,000 K, where a randomized state in both chemical distribution and grain structure is favored. After every MC step, during which an average of one switch per atom is attempted at temperature T
step across the whole system, the system is slowly cooled down at a rate
${e^{{{ - \left( {{E_2} - {E_1}} \right)} \over {{k_{\rm{B}}}T}}}}$
, where k
B is the Boltzmann constant and T is the absolute temperature of the system. The system is initialized at 10,000 K, where a randomized state in both chemical distribution and grain structure is favored. After every MC step, during which an average of one switch per atom is attempted at temperature T
step across the whole system, the system is slowly cooled down at a rate ${{-\left( {{T_{{\rm{step}}}} - {T_{{\rm{final}}}}} \right)} \over {1000}}$
until the target temperature T
final is reached. Simulations are performed until 100,000 MC steps are completed, which achieves an equilibrated condition for the simulations here.
${{-\left( {{T_{{\rm{step}}}} - {T_{{\rm{final}}}}} \right)} \over {1000}}$
until the target temperature T
final is reached. Simulations are performed until 100,000 MC steps are completed, which achieves an equilibrated condition for the simulations here.
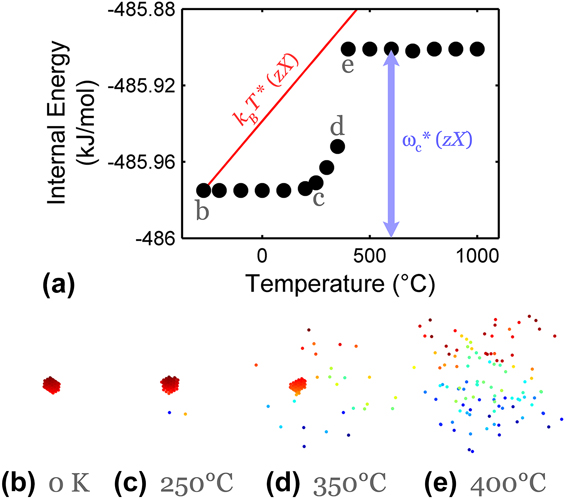
An important theme in the present work is entropically stabilized equilibria in nanostructured systems. With the canonical ensemble approach of the present MC model, the system is equilibrated not only on the basis of enthalpy by a minimization of total internal energy, but also comprises configurational entropy via thermal excitation; the model is suited to the study of entropic stabilization, although this issue has not been explored in detail in our prior work. An intuitive baseline of an entropically stabilized condition is provided by using the model in a single crystal alloy condition, as shown in Fig. 1. Here, the change in internal energy of the system is presented relative to the bulk like-bond energy $E_{\rm{c}}^{{\rm{AA}}}$
of 486 kJ/mol or 1.26 eV/bond. At low temperatures, the enthalpically favored configuration is a second-phase precipitate of the solute in a matrix of solvent. The system's internal energy increases slightly with temperature until a transition occurs around 350–400 °C, where the solute distribution becomes dispersed. Above the transition temperature, an entropically stabilized solid solution with an excess energy similar to the grain interaction energy (ωc = 65 meV) multiplied by the maximum number of unlike crystalline bonds, estimated by the bond coordination number (z = 8) times the solute fraction (X = 0.002), is preferred over a precipitated state with lower internal energy, as a result of thermal excitation incorporated by uphill switching events with a temperature-dependent probability. As a reference, thermal excitation is also projected in Fig. 1(a) as k
B
T*(zX). This estimate is based on the thermal energy k
B
T accessible to the highest possible number of solute-bearing bonds zX. The important point in this common example situation is that with sufficient thermal excitation, the system may access an excited configuration relative to the ground state; whereas in the single crystal of Fig. 1 the only possibility is a solution, in a nanostructured material there are additional possibilities.
$E_{\rm{c}}^{{\rm{AA}}}$
of 486 kJ/mol or 1.26 eV/bond. At low temperatures, the enthalpically favored configuration is a second-phase precipitate of the solute in a matrix of solvent. The system's internal energy increases slightly with temperature until a transition occurs around 350–400 °C, where the solute distribution becomes dispersed. Above the transition temperature, an entropically stabilized solid solution with an excess energy similar to the grain interaction energy (ωc = 65 meV) multiplied by the maximum number of unlike crystalline bonds, estimated by the bond coordination number (z = 8) times the solute fraction (X = 0.002), is preferred over a precipitated state with lower internal energy, as a result of thermal excitation incorporated by uphill switching events with a temperature-dependent probability. As a reference, thermal excitation is also projected in Fig. 1(a) as k
B
T*(zX). This estimate is based on the thermal energy k
B
T accessible to the highest possible number of solute-bearing bonds zX. The important point in this common example situation is that with sufficient thermal excitation, the system may access an excited configuration relative to the ground state; whereas in the single crystal of Fig. 1 the only possibility is a solution, in a nanostructured material there are additional possibilities.
Effects of temperature in promoting entropically stabilized solvation in a bulk (single crystal) MC system. In (b)–(e), the solute atoms are shown in a three-dimensional view, in colors that show the plane they lie in parallel to the lowest plane. The solute distribution evolves from a precipitated state to a completely miscible solid solution with increasing temperature. While the internal energy, shown in (a), slightly rises by partial solvation with increasing temperature, an abrupt increase in energy is observed when a complete solid solution emerges around 400 °C. The high-energy solid solution state is sustained entropically beyond 400 °C. Simulations are performed on a 30 × 30 × 60 single crystalline BCC lattice with ωc = 65 meV and 0.2 at.% solute content.
With interfaces present, the microstates accessible to the system become more numerous. Figure 2 shows a bicrystal setup with 0.2 at.% solute and ωc of 65 meV similar to the single crystal case of Fig. 1. The added grain boundaries carry an energy penalty of 0.05 eV/bond and for illustration purposes we take the GB interaction energy ωgb to be −5 meV. This set of parameters results in the system's chemical preference for bulk separation as the lowest energy state, followed by GB segregation, which is energetically preferable to bulk solvation. To investigate the chemical response to the grain boundaries, the system is equilibrated with no change to the grain structure.
Effects of interfaces on equilibrium states in a MC alloy system. (a) Changes in system's internal energy with temperature. In (b)–(e), atoms are shown in colors according to their depth normal to the page, in a side-view perspective of a two-tone lattice which indicates the bicrystal geometry. The alloy configuration evolves from a two-phase condition with a precipitate at a GB to become fully GB segregated with increasing temperature. A homogeneous solid solution is realized entropically at the highest temperatures beyond ∼1400 °C. Simulations are performed on a 30 × 30 × 60 BCC bicrystal with ωc = 65 meV, ωgb = −5 meV, and 0.2 at.% solute content.
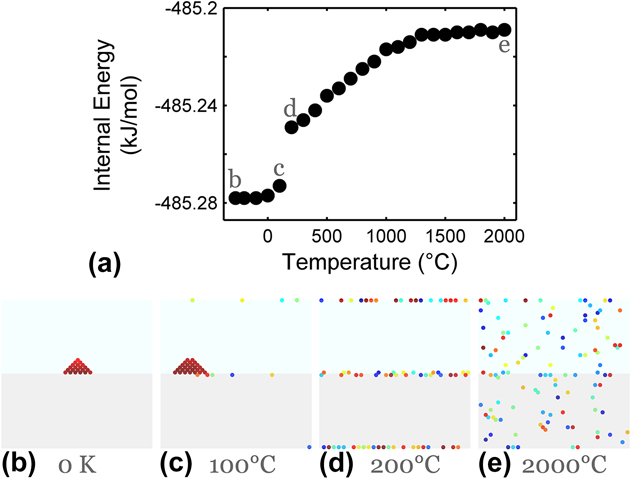
The structure cooled all the way to 0 K in Fig. 2(b) shows a two-phase ground state, with a solute-rich precipitate residing at a GB. This particular segregated precipitate structure is the enthalpically minimized configuration for all bicrystals in Fig. 2, as confirmed by the internal energy comparison in Fig. 2(a). With increasing temperature, the second most preferred state, that of GB solute segregation, is entropically accessed. The structures in Figs. 2(c) and 2(d) reveal a transition from a dual-phase structure to a fully GB-segregated state, with a sudden increase in system energy noted from point “c” to “d” in Fig. 2(a). As the temperature increases further, the third most preferred state of bulk solvation is accessed. The solute starts dissolving out of the grain boundaries into the bulk from point “d” to “e” in Fig. 2(a). The highest energy state available to the system is realized at the highest temperatures. We note that in the fully GB-segregated state with no precipitation [e.g., Fig. 2(d)], the chemical potential of the adsorbing species should be uniform throughout both the interface and the bulk regions, and such systems should be in line with the physical picture of the Gibbs adsorption isotherm.
The above two exercises in Figs. 1 and 2 illustrate how configurational entropy and grain boundaries together offer access to unique stabilized structures in nanostructured alloys; in a nanocrystalline environment, the available temperature-dependent transitions are more complex than in bulk alloys. For the purposes of this paper, we are especially interested in the “duplex nanostructure” regime, which comprises systems with the greatest enthalpic preference for bulk like-bonds, followed by GB segregation of solute which can be accessed entropically. These conditions lead to systems at finite temperatures like the ones shown in Fig. 2(c), where both GB segregation and second phases may be present in equilibrium together. In what follows, we explore in more detail the structures of these duplex nanostructures and how they evolve with alloy parameters, composition, and temperature.
III. SURVEY OF ALLOY STRUCTURES ACROSS STABILITY REGIONS
A nanostructure stability map for tungsten-based alloy systems is shown in Fig. 3(a) using the interaction energies as the two axes and is essentially the same as that presented in our earlier work in Ref. Reference Chookajorn and Schuh45, although plotted on different (transformed) axes. In that prior work, we focused principally on the green region in which “classical” GB segregated nanostructures reside. For the present work, we will examine alloys across multiple stability regions with an emphasis on the classical and duplex nanostructure regions. Note that mathematically, the blue “duplex nanostructure” region on this map is the range where the conditions described in the previous section are fulfilled: the lowest-energy bond in such systems is that for like-atom bonds in the bulk environment (promoting phase separation), while the second lowest-energy bonds are those corresponding to solute segregation at the grain boundaries. For reference, we note that four systems were previously discussed in Ref. Reference Chookajorn and Schuh45 and are marked by the four black circles in Fig. 3(a).
GB formation energies in alloys with 5 at.% solute addition. (a) Stability map showing four classes of alloy behaviors and four boundary lines. (b) The alloys from which the material parameters are taken are marked on the stability map across all stability regions. (c) With varying ωgb, γ is equal to γ0 in bulk systems and starts decreasing as we advance toward the classical nanostructure region, where γ becomes negative. (d) By varying both ωc and ωgb along the map's diagonal, γ is significantly reduced below zero in the classical nanostructure region. The polycrystals from the classical region are enthalpically supported as suggested by their zero ${{{\mathop{\rm d}\nolimits} U} \over {{\mathop{\rm d}\nolimits} A}}$
. Simulations are performed on a 100 × 100 × 6 BCC lattice and T = 500 °C.
${{{\mathop{\rm d}\nolimits} U} \over {{\mathop{\rm d}\nolimits} A}}$
. Simulations are performed on a 100 × 100 × 6 BCC lattice and T = 500 °C.
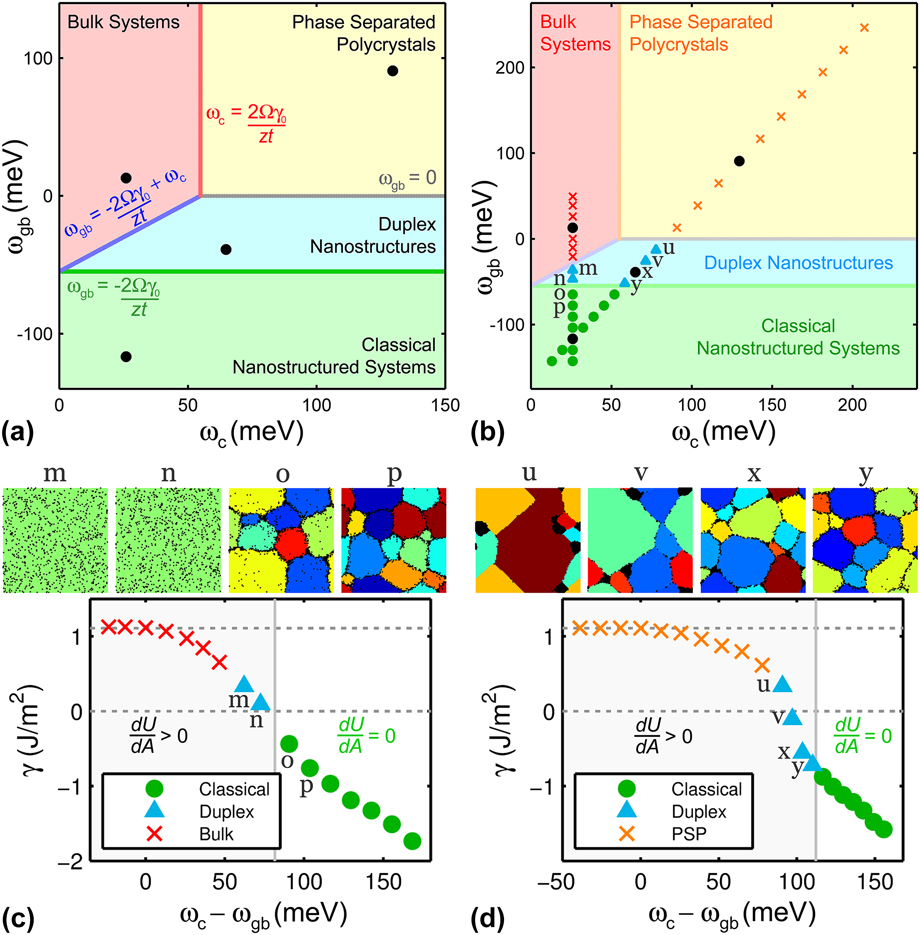
The alloy GB formation energy, γ, is the energy required to create a unit area of GB in an alloy in a chemically isoconfigurational state and can be used as a measure of grain structure stability, i.e., how much energy reduction is achieved by alloying compared to a similar structure without grain boundaries. (Note that the GB formation energy is not equivalent to the more familiar definition of “GB energy” in an open system and can take negative values in a closed alloy system, when the presence of solute favors the formation of grain boundaries. Reference Weissmüller24–Reference Weissmüller26,Reference Chookajorn and Schuh45–Reference Gottstein and Shvindlerman48 ) By allowing both atom and grain switching, we simulate various alloy structures with the material parameters from the systems marked in Fig. 3(b) across all four different regimes of nanostructure behaviors and assess their stability via γ.
The structures from the classical nanostructured region denoted by systems “o” and “p” in Fig. 3(b) and shown visually in Fig. 3(c) are grains of solvent-rich solid solution with solute preferentially segregating at grain boundaries. These structures serve as examples of alloy systems that should be stabilized not only against grain growth but also bulk precipitation. Along with these two examples, all of the “classical” alloys marked by green circles in Figs. 3(b)–3(d) have a negative γ, as expected for such systems at their equilibrium grain size. Reference Weissmüller24–Reference Weissmüller26,Reference Chookajorn and Schuh45–Reference Gottstein and Shvindlerman48
Figures 3(c) and 3(d) show two different series of alloys across the map in Fig. 3(b), which follow the markers shown on the map; these two series are for fixed ωc = 26 meV (varying ωgb) and for ωgb = 2ωc − 169 meV, respectively. For simplicity, the discussion of these series is limited to relatively dilute alloys at 5 at.% solute addition. In either series, as the alloy properties cross out of the green “classical” regime, the lowest energy state for the system is one in which second phase precipitation is favored. With emergent precipitation in these regions, the change in configurational entropy with respect to the chemical distribution becomes non-negligible and therefore we evaluate the change in internal energy with respect to the change in GB area ${{{\mathop{\rm d}\nolimits} U} \over {{\mathop{\rm d}\nolimits} A}}$
to distinguish the enthalpically stabilized equilibrium states from the entropically supported ones. For each system, grain structures at various average grain sizes are obtained using a few different initial solute concentrations. These grain structures are then re-equilibrated at a reassigned composition of 5 at.% while fixing the grain structure, and their internal energies are calculated after 50,000 MC steps of atom switch attempts. This procedure allows us to evaluate different GB areas, A, and the energy changes
${{{\mathop{\rm d}\nolimits} U} \over {{\mathop{\rm d}\nolimits} A}}$
to distinguish the enthalpically stabilized equilibrium states from the entropically supported ones. For each system, grain structures at various average grain sizes are obtained using a few different initial solute concentrations. These grain structures are then re-equilibrated at a reassigned composition of 5 at.% while fixing the grain structure, and their internal energies are calculated after 50,000 MC steps of atom switch attempts. This procedure allows us to evaluate different GB areas, A, and the energy changes ${{{\mathop{\rm d}\nolimits} U} \over {{\mathop{\rm d}\nolimits} A}}$
associated with them (for more procedural details see Ref. Reference Chookajorn and Schuh45). For all of the classical alloys in Fig. 3, the parameter
${{{\mathop{\rm d}\nolimits} U} \over {{\mathop{\rm d}\nolimits} A}}$
associated with them (for more procedural details see Ref. Reference Chookajorn and Schuh45). For all of the classical alloys in Fig. 3, the parameter ${{{\mathop{\rm d}\nolimits} U} \over {{\mathop{\rm d}\nolimits} A}}$
is found to be zero, which is in agreement with their enthalpically stabilized polycrystalline equilibria.
${{{\mathop{\rm d}\nolimits} U} \over {{\mathop{\rm d}\nolimits} A}}$
is found to be zero, which is in agreement with their enthalpically stabilized polycrystalline equilibria.
No precipitation is observed in alloys with low ωc in Fig. 3(c). The values of γ from the bulk systems marked by red x's at low ωgb are obtained from their immediate structures before transforming into single crystals. All of these unstable structures display a positive γ, indicating a higher-energy polycrystalline state compared to their single-crystalline equivalents. At higher ωgb, systems “m” and “n” from the duplex region have lower, but still positive, γ, which is consistent with the absence of grain boundaries in their steady-state structures; the fully equilibrated structures of alloys “m” and “n” are shown in Fig. 3(c) as single crystalline solid solutions. The parameter ${{{\mathop{\rm d}\nolimits} U} \over {{\mathop{\rm d}\nolimits} A}}$
calculated from bulk and duplex systems in Fig. 3(c) is positive; adding grain boundaries costs energy, while grain growth would be favored.
${{{\mathop{\rm d}\nolimits} U} \over {{\mathop{\rm d}\nolimits} A}}$
calculated from bulk and duplex systems in Fig. 3(c) is positive; adding grain boundaries costs energy, while grain growth would be favored.
Along the diagonal trajectory defined by ωgb = 2ωc − 169 meV, the structures from the phase separated polycrystal region at high ωc [marked by orange x's in Fig. 3(d)] show a reduction in γ from the reference metal GB energy γ0 of 1.1 J/m2 but with magnitudes that remain all positive. The duplex structures with zero and positive γ at relatively high ωc (e.g., system “u”) display solute precipitation with weak GB segregation of solute, while those with a negative γ (e.g., systems “x” and “y”) maintain more visible solute segregation at grain boundaries with an appearance that is reminiscent of dilute classical alloys. It is interesting to note that a nanoscale grain structure can be retained in a metastable manner with a zero or slightly positive γ, however, these particular structures display evident solvent–solute separation. The energy reduction in these structures in fact results from phase separation more than GB segregation.
All of the duplex systems shown in Fig. 3(d) are from the medium-to-high spectrum of ωc. Therefore as the tendency for bulk separation increases with ωc, the appearance of these duplex systems changes from classical-like to phase separated polycrystal-like with precipitation emerging. Even though the parameter ${{{\mathop{\rm d}\nolimits} U} \over {{\mathop{\rm d}\nolimits} A}}$
is positive for these duplex systems, polycrystalline structures are still obtained from the MC simulation, unlike the completely coarsened structures from alloys “m” and “n” in Fig. 3(c). All of these observations lead to a hypothesis that these equilibrated duplex polycrystals are not internal energy minimized, but are maintained at equilibrium entropically. This concept will be further explored in Sec. IV. B.
${{{\mathop{\rm d}\nolimits} U} \over {{\mathop{\rm d}\nolimits} A}}$
is positive for these duplex systems, polycrystalline structures are still obtained from the MC simulation, unlike the completely coarsened structures from alloys “m” and “n” in Fig. 3(c). All of these observations lead to a hypothesis that these equilibrated duplex polycrystals are not internal energy minimized, but are maintained at equilibrium entropically. This concept will be further explored in Sec. IV. B.
A. Convergence to a dual-phase structure
The results in Fig. 3 illustrate intricate transitions from one stability region to another through the duplex region. Even though the alloys marked by blue triangles in Fig. 3 are obtained from the duplex region, their structures in the dilute limit can appear similar to those from the neighboring regions. We further explore these duplex systems beyond 5 at.% composition and the results in Fig. 4(a) show reduction in γ below or near zero with increasing solute addition. The negative γ is accompanied by a concomitant dual-phase appearance of solvent- and solute-rich grains that are expected from the duplex region. Examples of these structures are shown for alloys with 20 and 40 at.% solute in Figs. 4(b) and 4(c), respectively. With additional solute, the bulk-like structures of systems “m” and “n” at 5 at.% in Fig. 3(c) begin to exhibit both GB segregation and crystallization of solute at 20 at.% and eventually transform into a duplex blend of solvent- and solute-rich polycrystals at 40 at.%. Similarly, for phase separated polycrystal-like structures at high ωc such as systems “u” and “v” in Fig. 3(d), GB solute segregation becomes increasingly noticeable at higher compositions and these systems finally converge to a duplex polycrystal at 40 at.%.
(a) Reduction in GB formation energy with solute addition in alloys from the duplex region. A certain minimum solute content is required for grain stability and reduction in GB formation energy below zero, as illustrated by the structural evolution with increasing solute content, shown specifically at (b) 20 at.% and (c) 40 at.% composition.
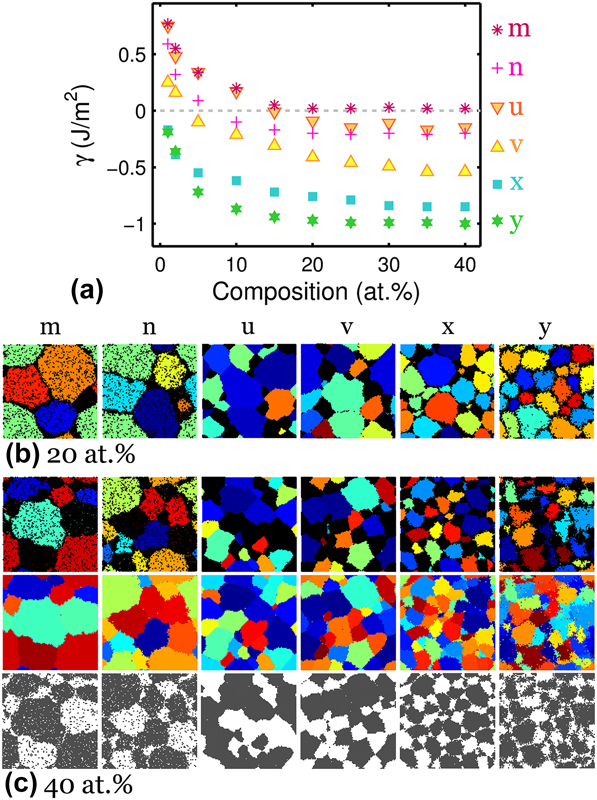
Systems “x” and “y” at intermediate ωc previously shown in Fig. 3(d) at 5 at.% resemble structures from the classical region with atomically thin, solute-segregated interfaces with hardly any sizable solute-rich domain. As more solute is added, solute-rich nanograins develop in competition with GB segregation. The results at the highest compositions such as the 40 at.% structures of systems “x” and “y” in Fig. 4(c) are very refined duplex nanostructures of alternating solvent and solute crystals. To elucidate the crystalline nature of both solvent- and solute-rich regions, the solute atoms are plotted in black in the structures on the first row, the grain structures are plotted on the second row, and the solvent atoms are plotted in gray on the third row of Fig. 4(c) to reveal the underlying grain structures and the dual-phase nature of these alloys.
IV. CLASSICAL VERSUS DUPLEX NANOCRYSTALLINE ALLOYS
The survey of alloy structures across all four stability regions in Fig. 3 confirms that the systems in which alloying leads to potential enhancement of structural stability are those that belong to the classical and duplex nanostructure regions of the map. These two regimes are notably different from one another, and the differences are worthy of further elaboration.
A. Composition dependence of grain size
With increasing addition of solute, the grain size of classical nanocrystalline alloys becomes progressively finer. Since GB segregation is the lowest energy bonding option, solute atoms most prefer to occupy GB sites and therefore both the GB area and GB fraction increase monotonically with solute composition. Using the classical alloy system from Ref. Reference Chookajorn and Schuh45 noted by the black circle in Figs. 3(a) and 3(b), Fig. 5(a) shows a fairly linear increase in GB area with solute composition. In accordance, the overall grain size reduces approximately parabolically to accommodate the increase in the “stabilized” GB area.
Grain refinement with solute addition in (a) classical and (b) duplex nanostructured alloys, along with a comparison in internal energy between accessible states for (c) classical and (d) nanoduplex systems.
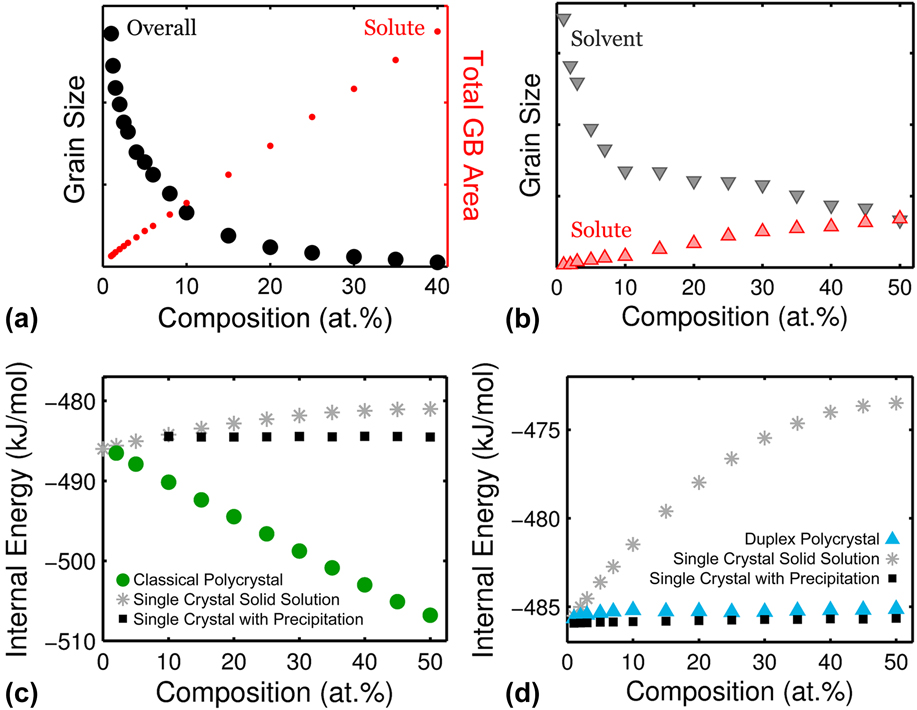
For nanoduplex alloys, on the other hand, grain refinement is a secondary effect of solute addition. Since the solvent-rich and solute-rich grains are the lowest energy state separated by the second lowest energy state of mixed grain boundaries, addition of solute primarily increases the fraction of solute-rich phase while promoting the appearance of low-energy decorated grain boundaries to a secondary degree. To demonstrate this concept, we take a closer look at the 500 °C structures of alloy “x” from Figs. 3 and 4. The average grain size of both solvent- and solute-rich crystals is obtained at 1–50 at.% solute and plotted in Fig. 5(b). The solute grain size increases with solute composition as the solvent grain size simultaneously decreases. Both of the grain sizes finally converge to the same value at the equiatomic composition.
B. Classical and duplex stability
To demonstrate the nature of their stability, the internal energy of classical alloys in the polycrystalline form is plotted in comparison to single crystalline alloys of the same system in Fig. 5(c). Even though bulk precipitation, which emerges above 10 at.%, can slightly decrease the system's energy, the comparison in Fig. 5(c) reveals that the lowest energy configuration is the polycrystal (with grain boundaries decorated with solute). It is worth mentioning that the reduction in energy in these classical polycrystals appears to be monotonic and fairly linear with solute addition.
Structural stability in the duplex region is markedly different, as shown through the comparison of the internal energy of the duplex polycrystals with the corresponding bulk systems in Fig. 5(d). As expected, bulk precipitation lowers the internal energy relative to bulk solvation due to the system's positive ωc. The placement of duplex polycrystals in Fig. 5(d) is noteworthy as they lie slightly above the energies of bulk precipitated states; they are not enthalpically stable relative to a bulk two-phase structure. Yet, the energy difference is small such that the nanoduplex structure can be entropically stabilized by the thermal energy k B T. Indeed, the duplex polycrystals are still maintained after the MC equilibration procedure. The configurational entropy gained from the nanoscale grain structure and separation gives rise to a lower free energy. The comparison between Figs. 5(c) and 5(d) thus underscores that the classical nanocrystalline alloys are stabilized enthalpically whereas the duplex nanocrystalline structures are a result of entropic stabilization.
V. A CASE STUDY ON TUNGSTEN ALLOYS
A. Alloy selection
While the method of MC stability map construction can be applied to any general metallic systems, the particular map from Ref. Reference Chookajorn and Schuh45 that is reconstructed in Figs. 3(a) and 3(b) is specifically tailored for tungsten-based alloys. In Fig. 6(a), this map is again redrawn, and this time populated with the alloy parameters obtained from Refs. Reference Chookajorn and Schuh15 and Reference Chookajorn, Murdoch and Schuh43 and listed in Table I, for binary solute additions to tungsten for all of the positive ωc pairs for which data were available. The stability regions in Fig. 6(a) classify these solutes into three main groups. The first group is those elements that lie in the region where only bulk states are favored (Cd, Cu, Sr, and Ag); these are relatively uninteresting because no unique nanoscale effects are expected in such alloys. The second group is those alloying elements that lie in the “classical” region, where a nanocrystalline state would be enthalpically favored (Ti, Sc, Zn, Mn, and Th); these elements are worthy of study in nanostructured W, because they are expected to decorate the grain boundaries of W and lead to stabilized nanocrystalline structures at at least some temperatures. In our previous work, Reference Chookajorn and Schuh15,Reference Chookajorn, Murdoch and Schuh43 we explored Ti additions to nanocrystalline W, and we will not explore the “classical” regime further in the present paper.
(a) Stability map of tungsten-based alloys populated with alloy's material parameters. (b) MC-generated structures of duplex W-based alloys at 1100 °C. Simulations are performed on a 400 × 400 × 6 BCC lattice.
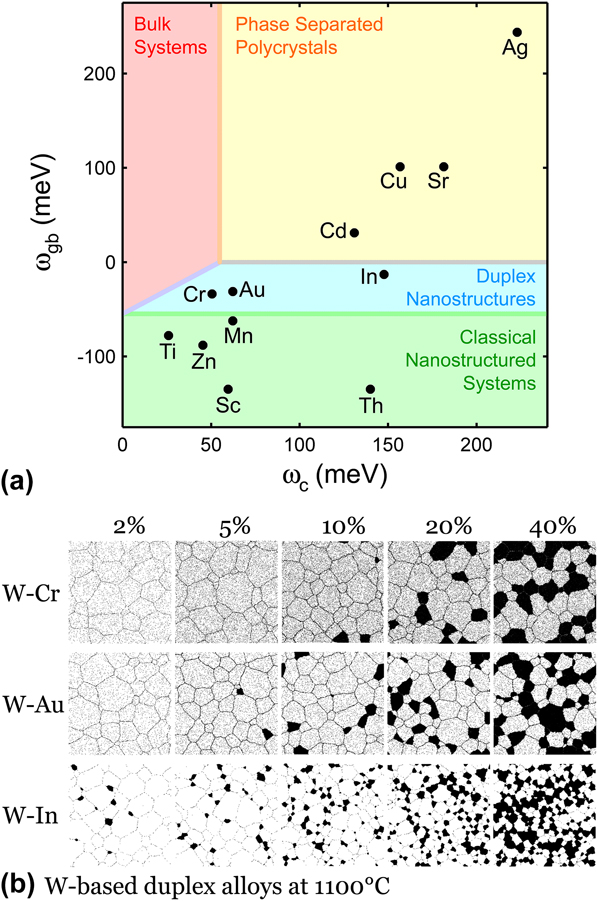
Estimated grain and GB interaction energies of tungsten-based alloys at 1100 °C, based on the tabulations in Refs. Reference Chookajorn and Schuh15 and Reference Chookajorn, Murdoch and Schuh43 which used the enthalpies of mixing and GB segregation data therein.

The third group of elements comprises those that lie in the “duplex” region of Fig. 6(a), namely Cr, Au, and In. As discussed above, these elements may exhibit nanoduplex structures that are stabilized entropically. By inputting the material parameters of tungsten and each of these alloy pairs, the MC procedure is used to simulate each alloy's equilibrium structure at 1100 °C. The visual representations of these alloys are shown in Fig. 6(b) and exhibit the expected structural features according to our earlier discussion of the “duplex” regime: solid solutions in tungsten-rich grains, with a propensity for both GB solute segregation and nanoscale phase separation. The solute-rich nanocrystalline domains emerge as the solute concentration rises, concomitantly with the solvent-rich grains becoming more refined.
B. The W–Cr system
The bulk phase equilibria between W and Cr present a classic example of a phase separating system; the solid portion of their bulk phase diagram consists of a large, fairly symmetric miscibility gap with ∼9 at.% Cr solubility limit at 1100 °C. Reference Turchi, Kaufman and Liu49 There is no competing intermetallic phase, and in the solid state both elements are BCC. If produced in a nanocrystalline form, grain growth and evolution to a bulk dual-phase structure are expected to be the critical factors affecting nanostructure retention. Contrary to the bulk phase diagram, the results in Fig. 6 suggest that this alloy may prefer a nanostructured state where the second phase is present alongside solute-decorated grain boundaries.
To more explicitly examine the role of nanostructure in the phase equilibria of this alloy, in Fig. 7 we present a series of simulations that compare the W–Cr system with and without GB states available. The structures are shown at temperatures from 900 to 1500 °C, which capture the crossing of the solvus. The same cooling procedure as described in Sec. II is applied for the structures with access to grain boundaries. However for the bulk cases, a structure at a certain composition is initialized as a random solution at 2000 °C, which is ∼400 °C above the top of the bulk miscibility gap, and cooled down at a constant rate of 0.01 °C per MC step. Since this cooling rate is adequately slow such that it allows sufficient equilibration in the bulk scenario under the imposed temperature profile, the bulk structure is captured at every 100 °C interval to reflect the change in structure with temperature.
Changes in equilibrium structure with Cr composition and temperature in (a) bulk and (b) nanostructured W–Cr alloys, as predicted by the MC model.

The array of MC-generated bulk structures in Fig. 7(a) is produced in a forced single crystalline (bulk) structure. It reveals a phase separation transition that is consistent with the bulk phase diagram, Reference Turchi, Kaufman and Liu49 with Cr solubility between 5 and 10% at 1100 °C. By contrast, when grain boundaries are allowed in the same simulations, the structures shown in Fig. 7(b) are produced. These structures resemble the GB segregated polycrystals and duplex nanostructures described in detail above, and while they are somewhat similar to their bulk counterparts in that they trace out a Cr solvus in composition-temperature space, they show that configurational entropy favors the production of solute decorated grain boundaries before outright dissolution of Cr into the W grains. Close inspection shows that the solvus line is shifted to higher compositions; the system can dissolve more Cr owing to the availability of extra GB sites that accommodate it in the solution. The size of Cr-rich precipitates here is also highly refined to the nanoscale. At a certain solute composition, the structure evolves from displaying solute-segregated grain boundaries at high temperature to being both GB-segregated and phase-separated at lower temperature.
C. Experiments on W–Cr
To produce a supersaturated solid solution of W–Cr with a nanoscale grain size, W and Cr powders with 1–5 μm average particle size were purchased from Alfa Aesar and mechanically alloyed. We used a SPEX 8000 high-energy mill in an ultra-high purity argon-filled glove box with 1 wt.% stearic acid process control agent, tungsten carbide media, and a ball-to-powder ratio of 5:1. Each alloyed powder was compacted and annealed to high temperatures at a constant heating rate of 15 °C/min in a reducing atmosphere of argon with 3% H2 and cooled down rapidly under flowing argon with 3% H2 after the target temperature was reached. All transmission electron microscopy (TEM) specimens were prepared from the interior of compacts using a Fischione ion mill maintained at −110 °C by liquid nitrogen. A JEOL 2010F instrument (Tokyo, Japan) was used to obtain bright-field TEM images, electron diffractograms, and composition measurement by energy dispersive spectroscopy (EDS). Scanning transmission electron microscopy (STEM) with EDS was used to acquire local composition measurements, elemental mapping, and imaging of structures before and after heating. The probe size used for measuring local composition was 0.2 nm.
The W–Cr system is one that mechanically mixes to a supersaturated solid solution Reference Cordero and Schuh50 and our as-milled powders had an average grain size of ∼13 nm as shown in the TEM micrograph of Fig. 8(a) and were homogeneous after 20 h of milling. Reference Park and Schuh51 The dark-field STEM image as well as W and Cr elemental maps obtained through STEM-EDS in Figs. 8(b)–8(d) reveal that the Cr and W atoms are uniformly distributed over the whole area of observation without noticeable contrast variation at any specific spot. In addition, the selected area diffraction pattern of the ball milled powder as shown in the inset of Fig. 8(a) only exhibits contrast from BCC tungsten solution phase. Thus, we also confirmed that there are no detectable oxides in the specimen after ball milling.
As-milled structure of W–15 at.% Cr, shown by (a) a bright-field TEM image with an electron diffraction pattern (inset), (b) a dark-field STEM image, and EDS maps of (c) W atoms, and (d) Cr atoms. High-energy milling allows W and Cr atoms to be homogeneously distributed over the area without any evident phase separation or chemical partitioning.

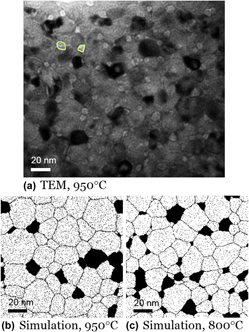
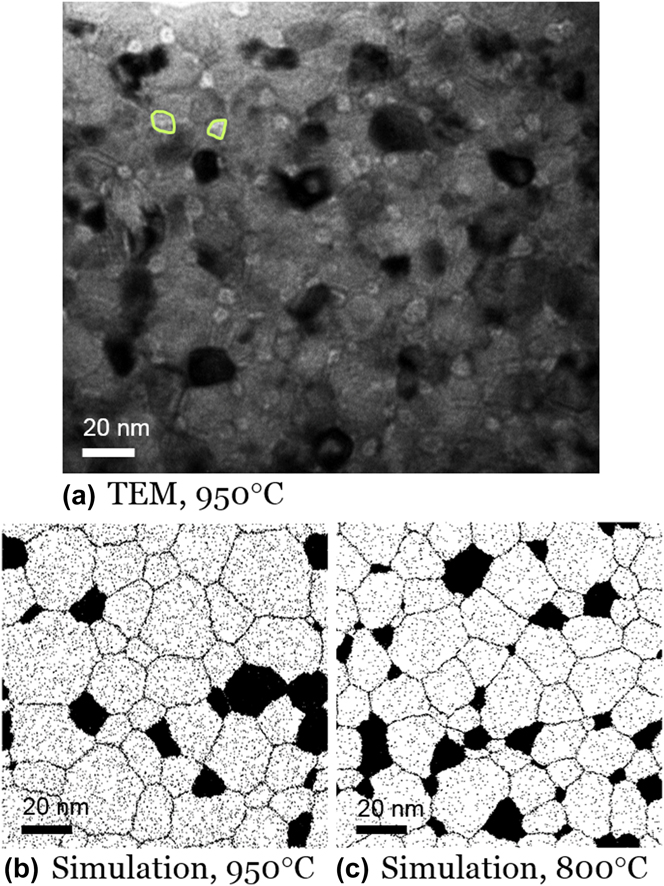
Because the as-milled structure is both nanocrystalline and a nonequilibrium uniform solid solution, it evolves upon heating. We find that in W–15 at.% Cr, nanosized Cr precipitates start to emerge near 950 °C, mostly next to grain boundaries and triple junctions, as delineated with green lines in the bright-field TEM image of Fig. 9(a). This structure is consistent with the MC results of Fig. 7(b), comparing qualitatively favorably in terms of characteristic scales and prevalence of the second phase Cr particles, but with somewhat higher volume fraction and smaller Cr particles than the simulation. This is most likely due to the short heating cycle we used experimentally (a constant heating rate followed by gas-cooling), which may not fully evolve the structure to an equilibrated state. Indeed, comparing with simulations at a slightly lower temperature of 800 °C, which might be more reflective of the average time-at-temperature conditions experienced by the experimental sample, shows an improved agreement. The volume fraction of Cr-rich phase assessed from Fig. 9(a) is around 17%, which matches that of MC result at 800 °C in Fig. 9(c) at 17%. The average size of Cr-rich grains in Fig. 9(a) at ∼8 nm is also close to that from the 800 °C MC structure in Fig. 9(c) at ∼9 nm.
A W–15 at.% Cr alloy after heating to 950 °C and cooling. (a) A bright-field TEM image shows the emergence of nanoscale Cr precipitates mostly next to grain boundaries and triple junctions after annealing up to 950 °C; a few such Cr domains are encircled for clarity. For comparison, MC simulation results of the same system at (b) 950 °C and (c) 800 °C are shown.
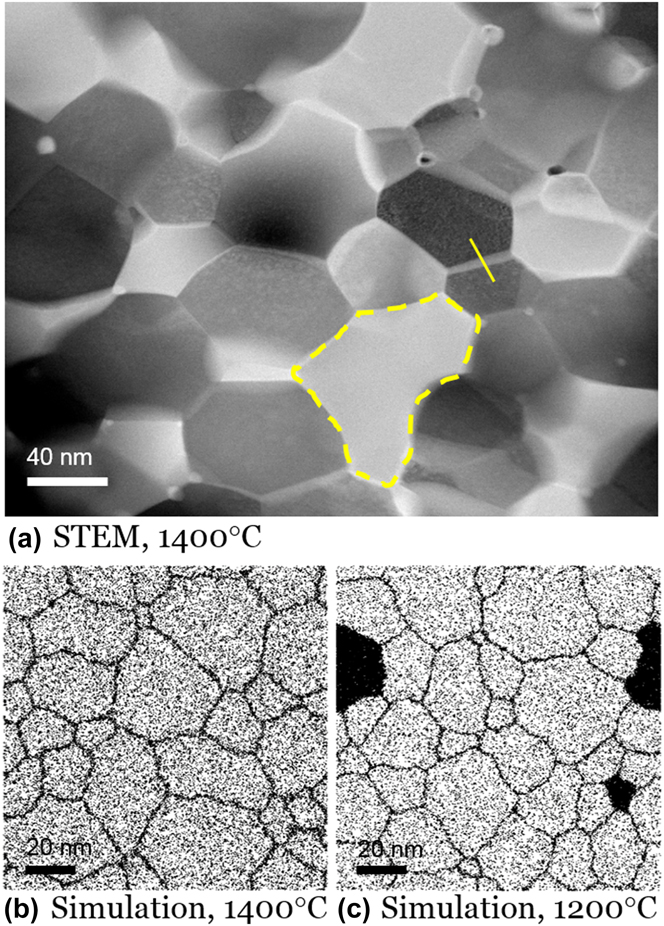
We further annealed a W–15 at.% Cr specimen up to 1400 °C, at which point the sample exhibits larger tungsten-rich grains. The dark-field STEM image in Fig. 10(a) illustrates a structure of nanoscale W-rich grains with only one Cr-rich grain, which is delineated with a yellow dashed line. The high number density of nanoscale Cr-rich precipitates which were found around grain boundaries and triple junctions earlier at 950 °C are now mostly dispersed into the W-rich grains, in agreement with the MC simulations. The length scales of both the W-rich grains and the second phase Cr are also larger, which also agrees with the simulation output. Once again, we see minor disagreement with the simulations on volume fractions and absolute size scales, which again may be associated with our short heating schedule. In support of this, we see that the experimental microstructure is a close match to a MC structure equilibrated at a lower temperature, 1200 °C, in Fig. 10(c). The average composition of W-rich grains measured by STEM-EDS is around 8 at.% Cr, which is also very close to the value of 7.7 at.% obtained from MC simulation at 1200 °C.
Dissolution and GB segregation of Cr in W–15 at.% Cr alloy heated to 1400 °C. (a) A dark-field STEM image shows dispersion of Cr away from the previous nanoscale precipitates into a large Cr-rich grain delineated by the yellow dashed line. MC-generated structures at (b) 1400 °C and (c) 1200 °C are provided for ease of comparison.
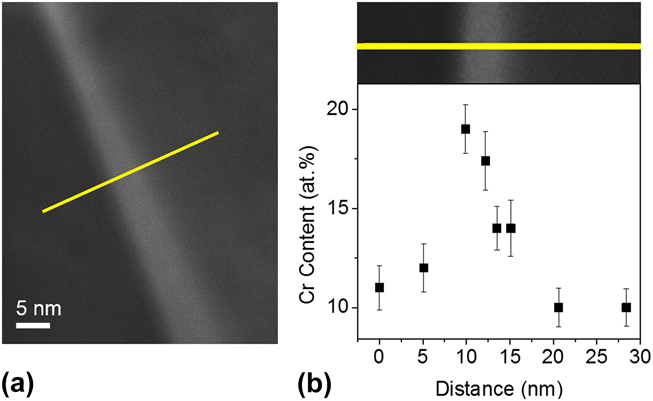
The most important question about the change in the structures between 950 and 1400 °C is whether the dissolution of the Cr-rich phase from the nanoduplex structure leads to entropically supported Cr GB segregation, as expected from the MC simulations in Fig. 7(b). To explore for the presence of GB segregation, local Cr compositions were measured using STEM-EDS across a GB with clear STEM contrast, i.e., along the yellow solid line delineated in Fig. 10(a). The result in Fig. 11 shows a sharp rise in local Cr content to ∼18 at.% Cr at the GB, which is higher than the Cr content in the neighboring grains at around 10–12 at.%. The error of each measurement at the 99.73% confidence level plotted as error bars in Fig. 11(b) is calculated by ${3 \over {\sqrt {{I_{\rm{W}}}} }} + {3 \over {\sqrt {{I_{{\rm{Cr}}}}} }}$
, where I
W and I
Cr are the measured x-ray intensities above the background of W Mα and Cr Kα peaks, respectively.
Reference Joy, Romig and Goldstein52–Reference Shih, Lozano-Perez and Cockayne54
The local Cr content rises significantly beyond the measurement error level at the GB. While the composition values may not be quantitatively accurate due to the specimen thickness and x-ray interaction volume effects, they qualitatively verify the existence of Cr segregation at grain boundaries. This result aligns with the expectations of the model and shows that upon heating, before entropy stabilizes a uniform solid solution, it may first permit access to a GB segregated nanocrystalline state.
${3 \over {\sqrt {{I_{\rm{W}}}} }} + {3 \over {\sqrt {{I_{{\rm{Cr}}}}} }}$
, where I
W and I
Cr are the measured x-ray intensities above the background of W Mα and Cr Kα peaks, respectively.
Reference Joy, Romig and Goldstein52–Reference Shih, Lozano-Perez and Cockayne54
The local Cr content rises significantly beyond the measurement error level at the GB. While the composition values may not be quantitatively accurate due to the specimen thickness and x-ray interaction volume effects, they qualitatively verify the existence of Cr segregation at grain boundaries. This result aligns with the expectations of the model and shows that upon heating, before entropy stabilizes a uniform solid solution, it may first permit access to a GB segregated nanocrystalline state.
GB segregation in nanocrystalline W–15 at.% Cr alloy after heating to 1400 °C. (a) Local Cr composition measurements using discrete STEM-EDS across a GB along the superimposed yellow solid line. (b) Cr composition measurements taken along the yellow line show an abrupt rise around the GB, which implies the tendency of Cr segregation into grain boundaries.
VI. CONCLUSIONS
The thermodynamics of nanostructured alloys have been overviewed with an emphasis on two classes of systems in which stability may result from alloying. It is widely appreciated that nanostructuring can enable access to unique interface-related states, and the present work further elucidates that under certain conditions, stabilized solute-segregated GB states can be supported either enthalpically or entropically. In more commonly studied “classical” nanostructured systems, solute decorated grain boundaries are the most favorable bonding option; this condition results in nanostructured solid solution alloys that are stabilized enthalpically by GB segregation. In this paper, we advanced the notion of duplex nanostructured alloys, or nanoduplex alloys, where phase separation is enthalpically favorable, followed closely by GB segregation of solute. Thus, at temperatures where the entropic contribution is significant, a second phase and GB solute segregation may exist in equilibrium together.
Our MC simulations showed how this type of equilibrium leads to nanoscale dual-phase structures that involve both phase separation and GB segregation, and in which heating causes the second phase to dissolve, leading to greater relevance of GB segregation. Our experimental characterization of W–15 at.% Cr reveals the presence of all of these features. A dual-phase nanoscale structure was observed at a lower temperature (950 °C) with Cr-rich precipitates residing along grain boundaries. With increasing temperature, these nanoscale precipitates largely dissolved into W-rich grains and were present in smaller number densities (and larger sizes). STEM analysis of individual grain boundaries revealed evidence for GB Cr segregation at the higher temperature (∼1400 °C). The experimental observations align reasonably with the MC simulations.
With interest in design, synthesis, and high temperature stability of nanostructured materials on the rise, the competition between phase formation, GB segregation, and solvation is one worthy of study in many different systems. Entropically stabilized nanoduplex materials such as discussed here may be achievable in many systems, and a detailed exploration of alloy compositions, temperatures, etc. where such materials may be produced is offered as a topic for considerable future research.
ACKNOWLEDGMENTS
This work was supported by the US Army Research Office under Grants No. W911NF-09-1-0422 and W911NF-14-1-0539, and by the US Defense Threat Reduction Agency under Grant No. HDTRA1-11-1-0062. M.P. acknowledges support through a Kwan-Jung scholarship.


