


Introduction
A much-debated building
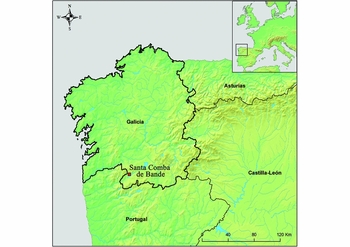
The church of Santa Comba de Bande, in the province of Ourense (in Galicia, north-west Spain; Figure 1), is a famous but controversial example of early medieval architecture in Spain. For decades, it was considered a fine and well-dated example of seventh-century Visigothic art. At the time, this interpretation coincided with and provided a reference for the dating of other emblematic Visigothic churches in the Iberian Peninsula (Utrero 2009). Fourteen years ago, however, a team of archaeologists led by Luis Caballero challenged this idea, arguing that the church was built in the second half of the ninth century or in the tenth century (Caballero et al. Reference Caballero, Arce and Utrero2003, Reference Caballero, Arce and Utrero2004). This hypothesis significantly affects the cultural and chronological attribution of other Visigothic churches as part of an intense and wider debate on these buildings.
Location of Santa Comba de Bande in north-west Iberia.
Santa Comba de Bande is located on a gentle slope in the Limia River valley. It is a cruciform building measuring 18 × 12m; this, in turn, is divided into three areas: a rectangular apse, a central cruciform body and a porch (Figures 2 & 3). The church is built from local granite masonry blocks of differing sizes, many of which were probably reused from Roman buildings. The blocks are arranged in different ways, following regular courses in some parts, creating elbows and wedges in others (Figures 3 & 4). All of the church walls are double, without interior filling, and are mortared together (Caballero et al. Reference Caballero, Arce and Utrero2004: 277–300). A comprehensive review of studies conducted on this church was published in 2004 (Caballero et al. Reference Caballero, Arce and Utrero2004: 273–77), but we will briefly highlight some recent research, notably the study of its capitals, the altar and the vaults (Utrero Reference Utrero2006: 581–83; Sastre Reference Sastre2009: 318–20; Domingo Reference Domingo2011: 92–93, 232–33).
North-west view of the church.

Santa Comba de Bande from the south-east.

Interior of the church from the west.

The church is first mentioned in a charter of AD 905 issued by the nearby Monastery of Celanova, in which it is called “aula virginis Sancte Columba” (Sáez & Sáez Reference Sáez and Sáez1996–Reference Sáez and Sáez2000: 69). Here, the church appears as a reference point in the territory of two nearby churches that a rich landowner (Fernanda Gudesteiz) had received from Alfonso III. The most famous documentary record of the church, however, appears in an unusual narrative of AD 982, which states that by AD 872 it had been abandoned for at least200 years (Sáez & Sáez Reference Sáez and Sáez1996–Reference Sáez and Sáez2000: 193). This reference was key to dating Santa Comba de Bande to the second half of the seventh century; its restoration in AD 872 probably would explain the presence of some ‘Asturian pre-Romanesque’ influences. Recently, however, others have warned about the dangers of an uncritical interpretation of this text, which was written in order to legitimate ownership claims (Caballero et al. Reference Caballero, Arce and Utrero2003). Between 1932 and 1934, Santa Comba de Bande was restored and partly excavated by Manuel Gómez Moreno and Alejandro Ferrant. They discovered the foundations of adjoining rooms considered to be contemporaneous with the church, and evidence of another building that may have functioned as ‘guest quarters’. No further archaeological study of this church took place before 1999, when a detailed stratigraphic analysis was undertaken by Luis Caballero, Fernando Arce and M. Ángeles Utrero (Figure 5). They concluded that the building was constructed in a single phase, with no evidence of significant early restoration. Regardless of the true chronology of the building, this research invalidates the traditionally held theory of a seventh-century church being restored at the end of the ninth century (Caballero et al. Reference Caballero, Arce and Utrero2003, Reference Caballero, Arce and Utrero2004). Most of the present building, including the sculptural decoration, therefore corresponds to the original construction phase—even though two capitals are clearly reused from a Roman building and the chancel is missing. Only minor medieval and modern restorations were recorded. Caballero et al. (Reference Caballero, Arce and Utrero2004: 277–303) also discovered that the original building did not have external chambers attached to the nave.
Sections and stratigraphic analysis of Santa Comba de Bande by Caballero et al. (Reference Caballero, Arce and Utrero2004: 281, 295).

Parallels with other nearby churches (e.g. San Miguel de Celanova, San Martiño de Pazó and Amiadoso) in the construction techniques (e.g. ashlar sizing and brick vaulting) and decorative style of this church (e.g. capitals similar to pre-Romanesque Asturian churches; Figure 6) would suggest that Santa Comba de Bande was constructed around the end of the ninth or during the tenth century (i.e. the ‘Mozarabic period’). Thermoluminescence (TL) analysis by María Asunción Millan (Autónoma University of Madrid) in 2001, however, dated bricks from the vault of this church to between the late sixth and late eighth centuries (AD 674±104, 699±109, 679±120, 1367±57 and 693±111) (Caballero et al. Reference Caballero, Arce and Utrero2004: 313). Although the bricks could have been reused, their homogeneity suggests that they were made specifically for this building. While these results favour the ‘Visigothic’ hypothesis, Caballero and his team insisted that a Mozarabic date was still strongly supported (Utrero 2010: 24). No further archaeological work has since been performed on this church, and its chronology has remained in doubt.
Capitals in the north side of the apse.

Santa Comba de Bande and the problem of Visigothic churches in the Iberian Peninsula
Chronological research on Santa Comba de Bande is valuable in its own right and also contributes to the lively but circular debate on the dating of Visigothic churches that has been taking place in Spain for the last 25 years (i.e. Arbeiter Reference Arbeiter, Caballero and Mateos2000; Collins Reference Collins, Caballero, Mateos and Utrero2009; Chavarría Reference Chavarría2010; Utrero 2010; Caballero & Utrero Reference Caballero and Utrero2013).
Since Lampérez and Gómez Moreno's work in the early twentieth century, Santa Comba de Bande has been grouped with other cruciform churches, such as San Pedro de La Nave (Zamora), Santa María de Melque (Toledo) and San Pedro de la Mata (Toledo), and more recently with Santa María de Quintanilla de las Viñas (Burgos) and São Frutuoso de Montélios (Braga, Portugal) (Utrero 2009) (Figure 7). Along with other emblematic buildings, such as San Juan de Baños (Palencia), this group has traditionally been considered the foremost example of late seventh-century Visigothic art in the Iberian Peninsula, as well as providing evidence of Byzantine influence.
Location map and images of the discussed ‘Visigothic’ churches (source: Wikimedia Commons).

Since 1992, however, the Mozarabic model has proposed that much Visigothic architecture, including this ‘cruciform group’, actually corresponds to the period spanning the eighth to the tenth centuries. This implies that eastern influences displayed in these churches (e.g. ashlar stone masonry, vaulting, decorative elements) were introduced to the Iberian Peninsula by the Arabs after the conquest of AD 711 (which would have promoted the connections with the Eastern Mediterranean and North Africa—the so-called ‘Umayyad channel’) (Utrero Reference Utrero2006, Reference Utrero2010; Caballero & Utrero Reference Caballero and Utrero2013). This theory has strong historical implications for our understanding of Visigothic economy and society. Some, however, do not support this model and still consider these churches to be Visigothic (Arbeiter Reference Arbeiter, Caballero and Mateos2000: 251; Chavarría Reference Chavarría2010). As discussed below, recent archaeological research and absolute dating in these churches have failed to resolve the debate.
Methodological approach
Dating strategy
Given the importance of obtaining an accurate chronology for Santa Comba de Bande, we designed a methodology for its absolute dating. Previous TL dating of vault bricks was challenged due to the possibility that they could have been reused (Caballero et al. Reference Caballero, Arce and Utrero2004: 313). We therefore decided to characterise and date mortar, specifically because it cannot be reused, by optically stimulated luminescence (OSL; Sanjurjo-Sánchez Reference Sanjurjo-Sánchez2016). Four mortar samples were taken from the two oldest phases of the church (following Caballero's stratigraphic study). Results were compared with both AMS radiocarbon dating of organic sediment and previous TL dates.
In luminescence dating the age equation is the ratio between the measured total absorbed dose or charge (estimated as the equivalent dose or De by luminescence) and the dose rate of ionising radiation in the environment surrounding the dated material. The estimated age corresponds to the time elapsed since the last exposure to sunlight (OSL) or heat (TL) before burial (Aitken Reference Aitken1985, Reference Aitken1998). For mortar dating, the age corresponds to the mortar settling just after manufacture. Sand grains of the aggregate mortar are used for dating (Sanjurjo-Sánchez Reference Sanjurjo-Sánchez2016). For reliable OSL ages, the dated material should be exposed to sunlight before burial to bleach the residual (geological) absorbed dose. If this does not occur, the De will result from the luminescence emission of a mixture of well-bleached grains (before burial) and grains keeping some residual dose (plus burial dose). In such cases, the obtained De will overestimate the De acquired during burial, and thus the mortar age.
Sampling
Using Caballero's stratigraphic analysis, we took samples from parts of the building belonging to the oldest two phases (Late Antique or early medieval period) (Caballero et al. Reference Caballero, Arce and Utrero2004: 277–303). Ashlar junctions of sufficient width to extract a mortar sample (after removing the surface Portland cement) were sought. One sample (BAN_MU150410U01) was collected from inside the second phase ‘altar niche’ wall in the south transept (Figure 5). Unfortunately, as explained below, this mortar had deteriorated and it yielded no results. An attempt was made to collect a second sample from the east-facing wall of the north transept (within the current vestry). This was unsuccessful, as modern cement mortar had penetrated too deeply into the junctions, preventing access to any original mortar. Consequently, we explored mortar remaining on the floor of the apse, which belonged to the first building phase (Caballero et al. Reference Caballero, Arce and Utrero2003: 73, Reference Caballero, Arce and Utrero2004: 300). The mortar was found to be made up of two layers. The base layer comprised preparation mortar containing charcoal. One sample was collected for OSL (BAN_MU150410U04) and another for 14C (BAN_MU150410U06) dating. The top layer contained tegula (Roman and early medieval tiles) and gravel fragments, from which two samples (BAN_MU150410U02, BAN_MU150410U03) were taken (Figure 8).
Location of the Santa Comba de Bande samples collected in 2015, and building plan showing its different phases (following Caballero et al. Reference Caballero, Arce and Utrero2004: 279).

For each sample, a report was made and radiation was measured in the extraction zone with a gamma spectrometer. Once the sample was extracted, the hole was repaired with lime mortar to match the original.
OSL mortar dating
For sample BAN_MU150410U01, a 2–4mm outer layer was removed by cutting with a spatula. Sawing with a diamond-impregnated wheel was used for the other samples. Both cutting techniques took place under subdued red light in a luminescence laboratory. After samples from the apse floor were crushed, pure coarse quartz (with a diameter range of 90–180µm) was obtained, following Viveen et al. (Reference Viveen, Sanjurjo-Sánchez, Goy-Diz, Veldkamp and Schoorl2014). As insufficient coarse quartz from sample BAN_MU150401U01 was obtained, we extracted fine polymineral grains (4–11µm diameter) for luminescence analyses, which provided saturated OSL and infrared stimulated luminescence signals.
The quartz OSL signals were measured in an automated Risø DA-15 TL/OSL reader system equipped with blue light-emitting diodes and a coupled 9235QA photomultiplier tube using an optical filter 6mm-thick Hoya U-340. Laboratory doses were given using a 90Sr/90Y beta source mounted on the reader, giving a dose rate of 0.120±0.003 Gy s−1 to samples. To assess the De , the single-aliquot regenerative dose protocol was used (Murray & Wintle Reference Murray and Wintle2000) on small multigrain aliquots, including recovery tests, bleaching and thermal transfer tests with parameters following Viveen et al. (Reference Viveen, Sanjurjo-Sánchez, Goy-Diz, Veldkamp and Schoorl2014).
The annual dose rates (Aitken Reference Aitken1985) were estimated using the U and Th content measured by inductively coupled plasma mass spectrometry and X-ray fluorescence spectrometry to measure K. The gamma radiation was assessed by a geometric model, including the U, Th and K content measured on surrounding materials and in situ gamma spectrometry to cross-check the results. Conversion factors by Guerin et al. (Reference Guerin, Mercier and Adamiec2011) were used to estimate annual dose rates from quartz grains, neglecting internal beta and alpha dose contributions and external alpha dose, considering an attenuation factor for the beta dose (Brennan Reference Brennan2003). The cosmic dose rates were calculated according to Prescott and Hutton (Reference Prescott and Hutton1994), although it is difficult to assess cosmic radiation near vertical surfaces of buildings (Sanjurjo-Sánchez et al. Reference Sanjurjo-Sánchez, Gómez-Heras, Fort, Álvarez de Buergo, Izquierdo Benito and Bru2016).
An independent age was obtained by Beta Analytic (Florida, USA) from an organic sediment sample taken from the base of the altar (sample MU150401U06).
Results
OSL analyses of BAN_MU150401U02 and BAN_MU150401U03 provided bright signals (Figure 9), while the BAN_MU150401U04 OSL provided low signals. We estimated the De s from a high number of aliquots by the central age model (CAM) (Galbraith et al. Reference Galbraith, Roberts, Laslett, Yoshida and Olley1999), as the overdispersion was low for all samples. Radial-plots and histograms of the De s frequency provide normal skewed distributions (Figure 10), indicative of a complete bleaching of the residual OSL signal. The resulting De s were similar for the three samples (Table 1).
OSL decay curve and response-dose curve (inset) for the sample MU150410U03.

Frequency histogram (A) and radial-plot (B) of the aliquots measured for the sample MU150410U03. The distribution corresponds to a Gaussian distribution and the values fall around a central equivalent dose of 8.33 Gy.

Estimated water content of the samples, estimated dose rates and equivalent doses, accepted aliquots, overdispersion and calculated OSL ages.
The content of U, Th and K in the samples was very similar, resulting in similar radiation dose rates (Table 1). This provided very similar ages ranging between 1137±112 and 1234±64 years old, and a historical age range between AD 781±64 and 878±112.
The radiocarbon age obtained from the sediment sample (BAN_MU150401U06) is 1250±30 BP (uncalibrated age). The age 2σ calibration provided a range between 1080 and 1275 yr BP, corresponding to the historical period AD 676–870 (date modelled in OxCal 4.2, using SHCal13 calibration curve; Bronk Ramsey Reference Bronk Ramsey2009; Reimer et al. Reference Reimer, Bard, Bayliss, Beck, Blackwell, Bronk Ramsey, Buck, Cheng, Edwards, Friedrich, Grootes, Guilderson, Haflidason, Hajdas, Hatté, Heaton, Hoffmann, Hogg, Hughen, Kaiser, Kromer, Manning, Niu, Reimer, Richards, Scott, Southon, Staff, Turney and van der Plicht2013). This fits the OSL age obtained for the same sample and the other dated samples.
Discussion
Given the statistical nature of the dating processes, it is usually assumed that scattering is described by Gaussian distributions. Thus, the weighted mean is usually used to assess the age, although other methods can be used (Buck & Millard Reference Buck and Millard2004). As the OSL ages correspond to the moment of mortar setting, this method provides accurate results. The radiocarbon date would not, however, be as equally accurate: the dated organic matter could correspond to a previous soil from which the raw material was taken for inclusion within the mortar, or to a later biochemical process (after mortar setting), such as organic contamination by microorganisms. We can, therefore, suggest two hypotheses. Firstly, if the OSL dates are considered alone, a weighted mean date of AD 811±47 is obtained. Alternatively, if it is assumed that the organic matter taken for radiocarbon dating is contemporaneous with the laying of the floor, a weighted mean date of AD 772±32 is obtained. Although the difference between both hypotheses is relatively low, we must further refine the chronology of this church.
Dates provided by Caballero et al.’s (Reference Caballero, Arce and Utrero2004: 313; Table 2) previous luminescence dating of the bricks are older than our results, with a weighted mean of AD 686±55 and the shortest interval being between AD 590 and 778 (excluding the sample from the south transept, which belongs to a late medieval phase of reconstruction). Those dates are also less precise than ours, although the deviations overlap. Unfortunately, Caballero et al. (2004) did not provide information on the dose rates and De s. Although we cannot provide reasons for such slight differences, their dates fit our results, as the intervals extend up to AD 778–808. If we consider that all the dates correspond to a unique construction phase (with the exception of the sample from the south transept), a final weighted mean age of AD 770±19 is obtained. This age falls very close to our second hypothesis, in which the dated organic matter is contemporaneous with the construction of the floor. This provides a clear date for the construction of the building in the second half of the eighth century.
Comparison among absolute chronologies obtained for Santa Comba de Bande in this work (OSL and 14C) and TL dating of the bricks performed by A. Millán in 2001.

This hypothesis is also consistent with the stratigraphic analysis by Caballero's team, which showed that the pavement, as with the vaults, belongs to the first phase of the building. It should be remembered that the pavement represents the final part of building in this phase, and that full construction of such a church can take several years. This could help explain the time lag between the results from previous TL dating and our OSL dating. The alternative hypothesis implies that Caballero et al.’s stratigraphic analysis is wrong and that there were at least two different construction phases (one for the vault and a later one for the floor). Our reanalysis, however, instead supports the hypothesis of a single phase; thus, it is argued here that AD 770±19 is the most probable date for the construction of Santa Comba de Bande.
Archaeological and historical implications
Regarding the building
This new chronology for Santa Comba de Bande (probably built between AD 751 and 789) presents an unexpected scenario. Previous debates had considered a seventh-century or ninth- to tenth-century date for this church, but never an intermediate date in the second half of the eighth century. This is earlier than the date proposed by Caballero et al. (Reference Caballero, Arce and Utrero2004) and Utrero (Reference Utrero2006), although it does not conflict with their stratigraphic analysis of the building.
The similarity of Santa Comba de Bande to other examples of Asturian architecture (in the use of bricks or the style of two capitals—Figure 6) can better be explained within an eighth- rather than a seventh-century context. Nonetheless, the oldest preserved example of Asturian architecture dates to the late ninth century (Caballero & Utrero Reference Caballero and Utrero2013: 130). The church of Santa Comba de Bande would, therefore, represent the first known antecedent of Asturian architecture, rather than a product of its later expansion from Asturias into Galician territory (Caballero et al. Reference Caballero, Arce and Utrero2004: 310–13; Utrero Reference Utrero2006: 262). It must be significant for our broader understanding of northern Iberian society in this period that this antecedent appears not in Asturias, but in southern Galicia. That should force a reconsideration of the chronology and direction of the influences that formed the so-called ‘Asturian’ and ‘Repoblación’ arts (the artistic expressions derived from the conformation and expansion of the Asturian kingdom in the ninth to tenth centuries in northern Iberia), as well as the concepts of ‘centre’ and ‘peripheries’ within the Asturian kingdom. Only recently have scholars begun to reconsider the key role of ‘peripheral’ territories in its formation (Portass Reference Portass2013; Sánchez-Pardo Reference Sánchez-Pardo2013).
Furthermore, Santa Comba de Bande's mid to late eighth-century date is consistent with information contained in charters preserved from this period in north-west Spain. These texts show the origin of churches in different parts of Galicia, such as the three churches founded in Lugo province c. AD 780 by deacon Rodericus; the monastery of Esperaután (north of Lugo province) founded c. AD 775 by King Silo; the church of San Estevo de Calvor (Sarria, eastern Galicia) founded in AD 785; the churches promoted by the African bishop Odoario around Lugo city c. AD 750; and the c. AD 760 restoration of San Julián de Samos monastery by Abbot Argerico and his sister Sarra (Floriano Reference Floriano1949: 41–59, 66–71, 85–87, 114, 336).
It is interesting that most of the founders of these late eighth-century churches were aristocrats from southern Iberia (and even Africa) escaping Muslim domination and searching for refuge in Galicia. These Hispano-Visigothic refugees were by no means outsiders, but were accepted and assisted by the new kings of Asturias. The extent of their integration into Galician society is uncertain, but conflict with existing communities over land ownership would probably have occurred (Baliñas Reference Baliñas1992: 70–84). The foundation of churches may have played an important role in the political and economic empowerment of these new aristocracies, enabling contested estates and political domains to be acquired and legitimised, and creating networks of social-political relationships (integration into new social circles, the exchange of goods and favours, and the creation of dependencies) in their settlement locations (Sánchez-Pardo 2015). This raises the possibility of Mozarabic links at Santa Comba de Bande. Firstly, there is the unverifiable tradition concerning the arrival of the relics of Saint Torcuatus of Granada to Santa Comba de Bande between the eighth and tenth centuries. Santa Comba de Bande also has clear similarities with the churches of Santa María de Melque and San Pedro de la Mata, both in Toledo (Figure 6). As explained below, neither of these churches is later than our date for Santa Comba de Bande. It is possible, therefore, that Santa Comba de Bande was built by Hispano-Visigothic refugees from southern Spain who imported that architectural model. The cultural background of these refugees perhaps helped to shape the new Asturian and artistic style.
Implications for the cruciform group
Our dating of Santa Comba de Bande cannot solve the debate surrounding ‘Visigothic’ cruciform churches, as they are no longer considered a homogeneous and contemporaneous group (Utrero 2009). What is clear, however, is that Santa Comba de Bande is now the first church to provide a clear chronology; it was built in the aftermath of the Arab invasion of AD 711. This provides an opportunity to revise the absolute chronologies obtained for this group of churches.
Wooden beams from San Pedro de la Nave, Santa María de Quintanilla de las Viñas and San Juan de Baños have been analysed and dated by 14C and dendrochronology. Results show that the trees were felled between AD 499 and 595, AD 476 and 536, and AD 499 and 595, respectively. Although they were probably used for the first time between the sixth and eighth centuries, it has been argued that these beams could have been reused, and so they cannot be relied upon to date the existing churches (Rodríguez Reference Rodríguez2008: 49). This is especially problematic at San Juan de Baños (which does not belong to the ‘cruciform group’, but shares many technical similarities with it), where stratigraphic analysis has shown the existence of reused material from a previous building. This material may also include the controversial epigraph of its foundation by the Visigothic King Recesvinto in AD 661. Radiocarbon dating of oak wood staples used in the ashlars of San Pedro de la Nave, however, provides a date of AD 648–695 (Alonso et al. Reference Alonso, Rodríguez, Rubinos and Caballero2004: 220). These are unlikely to have been reused, as they are small items, usually carved from nearby trees during construction of the building. Stratigraphic analysis of the church also shows that it was built in a single phase.
Radiocarbon and TL dating at Santa María de Melque suggest that the monastery was built between AD 680 and 773 (Caballero & Moreno Reference Caballero and Utrero2013: 202), although the latest revision of the stratigraphy and ceramic chronology suggests the mid or late eighth century as the most probable date for its construction. The same date has been proposed for the church of Santa Lucía del Trampal (Caceres), based on ceramics recovered during excavation and the style of an epigraph (Caballero & Utrero Reference Caballero and Utrero2013: 130).
No archaeological research has been carried out at San Pedro de la Mata. Nevertheless, a seventeenth-century text suggests the existence of an inscription recording its foundation by the Visigothic King Wamba (AD 672–680) in this church (Utrero 2009: 140). Excavations at São Frutuoso de Montélios, which may provide important dating information, are currently underway.
Considered within this scenario, the date obtained for Santa Comba de Bande does not seem to support a single answer to the pre- or post-711 debate. Rather, it is increasingly clear that Visigothic architecture survived well after the AD 711 conquest, until the end of the eighth century. We now know that Santa Comba de Bande dates to the second half of the eighth century, and the same is probably true for Santa María de Melque and Santa Lucía del Trampal. Absolute dating of wood staples from San Pedro de la Nave and, more tentatively, the missing inscription from San Pedro de la Mata, does, however, seem to date these two churches to the end of the seventh century.
Current evidence suggests that the Arab conquest of Iberia in AD 711 was not a barrier to church-building, as indicated by Chavarría (Reference Chavarría2010). Additional research on these churches will spur further discussion. The same late Visigothic architectural model continued to be produced in the decades following the Islamic conquest. This also implies a more progressive interpretation of the arrival of eastern influences to the Iberian Peninsula. Byzantine influences were already present in the last decades of the Visigoth kingdom, as demonstrated by military architecture, coinage and commercial contacts (Chavarría Reference Chavarría2010; Sánchez-Pardo Reference Sánchez-Pardo2013). Eastern motifs could undoubtedly have increased in frequency via the ‘Umayyad channel’ in the eighth century.
In both cases, all these surviving examples of religious architecture seem to be linked to the highest social groups. Some of them are directly related, by epigraphy, to Visigothic kings (La Mata or Baños); the rest are undoubtedly quality products of the investment of the highest Christian elites, whether they lived at the end of the seventh century, or during the eighth century. Reasons of political legitimation may explain the construction of Santa Comba de Bande in this area of Galicia, before its integration into the Asturian Kingdom.
Conclusions
The possibility of a mid to late eighth-century date for Santa Comba de Bande was discounted by Cabellero et al. (Reference Caballero, Arce and Utrero2003), as the date did not fit either of the two principal hypotheses (i.e. a Visigothic or Mozarabic church). This reflects long-standing prejudices about the status of northern Spain in the eighth century; the region was considered a ‘no-man's land’ at a time of political weakness. The date obtained from Santa Comba de Bande presents a new and more flexible scenario, in which the year AD 711 is not a barrier to ‘Visigothic style’ church building, but a marker within a progressive evolution (Chavarría Reference Chavarría2010). The Mozarabic model seems to be shown correct when it argues that ‘Visigothic’ churches such as Santa Comba de Bande were built after AD 711. There are reasons, however, to suggest that similar buildings were already being constructed at the end of the seventh century, and that a ninth- to tenth-century date is incorrect. In fact, the date obtained for Santa Comba de Bande identifies this church as the first known antecedent of Asturian architecture—an example that appears outside the boundaries of Asturias at the supposed ‘periphery’ of the expanding kingdom. Although further research is required, this prompts a reconsideration of the dynamics and influences that shaped the Asturian kingdom, going beyond information available from the later royal chronicles. This result has been achieved by combining different dating methodologies (TL, 14C and OSL) with stratigraphic data. Further such interdisciplinary research is required on this topic to stimulate the discussion of ‘Visigothic churches’.
Acknowledgements
This paper is a result of the Marie Curie CIG ‘EMCHAHE’ project, funded by the European Commission FP7 programme. We are very grateful to Robert Portass for revising the English. Thanks also to María Angeles Utrero for her help with our queries about the TL chronologies, and to Marco García Quintela for his constant support of our research.


