





1 Introduction
Boron and its compounds have attracted significant interest due to their unique properties relevant to various high energy density applications. In particular, boron plays a central role in proton–boron (p–11B) fusion, a promising clean fusion process that produces no neutrons in the primary reaction[ Reference Batani, Margarone and Belloni 1 ] and generates minimal radioactive waste. Moreover, boron-based compounds such as boron nitride exhibit exceptional thermal stability, mechanical hardness and high melting points, making them particularly attractive for advanced material science applications[ Reference Knittle, Wentzcovitch, Jeanloz and Cohen 2 ]. In inertial confinement fusion (ICF), boron compounds are being explored as potential ablator materials due to their favorable equation of state (EoS) and energy coupling properties[ Reference Whitley, Kemp, Yeamans, Walters, Blue, Garbett, Schneider, Craxton, Garcia, McKenty, Gatu-Johnson, Caspersen, Castor, Däne, Ellison, Gaffney, Graziani, Klepeis, Kostinski, Kritcher, Lahmann, Lazicki, Le, London, Maddox, Marshall, Martin, Militzer, Nikroo, Nilsen, Ogitsu, Pask, Pino, Rubery, Shepherd, Sterne, Swift, Yang and Zhang 3 ]. Understanding the behavior of boron under extreme conditions is essential for optimizing its applications in these fields. High-pressure experiments and theoretical simulations allow one to reveal the phase transitions, melting behavior and structural properties critical to both fusion and materials research.
The goal of the experiment presented in this paper was therefore to acquire new EoS points for hexagonal boron nitride (h-BN) along its main Hugoniot curve, thus complementing the data already obtained at the SGIII-p laser facility for h-BN between 5 and 16 Mbar[ Reference Zhang, Yang, Guan, Duan, Yang, Yang, Liu, Shen, Batani, Singappuli, Li, Huo, Lan, Liu, Li, Yang, Li, Wang, Yang, Zhao, Zhang, Sun, Kang and Batani 4 ], and the data obtained at the Omega laser facility for cubic boron nitride (c-BN) for pressure between 12 and 26 Mbar[ Reference Zhang, Lazicki, Militzer, Yang, Caspersen, Gaffney, Däne, Pask, Johnson, Sharma, Suryanarayana, Johnson, Smirnov, Sterne, Erskine, London, Coppari, Swift, Nilsen, Nelson and Whitley 5 ]. Notice that in Ref. [Reference Zhang, Yang, Guan, Duan, Yang, Yang, Liu, Shen, Batani, Singappuli, Li, Huo, Lan, Liu, Li, Yang, Li, Wang, Yang, Zhao, Zhang, Sun, Kang and Batani4] the indirect drive approach was used, generating the shock by the soft X-ray radiation produced inside a holhraum using high energy (~6400 J), while at the Prague Asterix Laser System (PALS) facility we used the direct-drive irradiation of the target with energy up to 200 J.
The second goal of the experiment was to assess the possibility of using PALS as a platform for EoS studies. Even if EoS experiments were conducted in the past at PALS on carbon[
Reference Batani, Stabile, Tomasini, Lucchini, Ravasio, Koenig, Benuzzi-Mounaix, Nishimura, Ochi, Ullschmied, Skala, Kralikova, Pfeifer, Kadlec, Mocek, Präg, Hall, Milani, Barborini and Piseri
6
] and on foams[
Reference Dezulian, Canova, Barbanotti, Orsenigo, Redaelli, Vinci, Lucchini, Batani, Rus, Polan, Kozlová, Stupka, Praeg, Homer, Havlicek, Soukup, Krousky, Skala, Dudzak, Pfeifer, Nishimura, Nagai, Ito, Norimatsu, Kilpio, Shashkov, Stuchebrukhov, Vovchenko and Chernomyrdin
7
], the short duration of the laser pulse ( $\tau \sim 350$
ps full width at half maximum (FWHM)) is likely to produce a decaying shock, which makes the measurements more difficult. A VISAR (velocity interferometer system for any reflector) diagnostic (velocity interferometer) would allow following the time history of the shock velocity and measuring the instantaneous velocities of the shock, typically at the boundary between two materials. Indeed, during the experiment, we were also working on the implementation of the VISAR, which at the moment is not yet completed and works only as a time-resolved reflectivity diagnostic[
Reference Mancelli, Tentori, Raffestin, Singappuli, Chevalier, Renner, Krus, Krupka, Singh, Dudzak, Agarwal, Nissim, Ferber, Greenberg, Martynenko, Neumayer, Tatarakis, Batani and Batani
8
]. In any case, the VISAR can optimally be used only with transparent materials, which is not the case of h-BN. Therefore, it is still necessary to see under which conditions of laser irradiation and target geometry, PALS can provide reliable EoS data using diagnostics such as a streak optical pyrometer (SOP), which can only allow measuring average velocities in stepped samples. Hence, in this paper, we focused on results obtained with the SOP diagnostic.
$\tau \sim 350$
ps full width at half maximum (FWHM)) is likely to produce a decaying shock, which makes the measurements more difficult. A VISAR (velocity interferometer system for any reflector) diagnostic (velocity interferometer) would allow following the time history of the shock velocity and measuring the instantaneous velocities of the shock, typically at the boundary between two materials. Indeed, during the experiment, we were also working on the implementation of the VISAR, which at the moment is not yet completed and works only as a time-resolved reflectivity diagnostic[
Reference Mancelli, Tentori, Raffestin, Singappuli, Chevalier, Renner, Krus, Krupka, Singh, Dudzak, Agarwal, Nissim, Ferber, Greenberg, Martynenko, Neumayer, Tatarakis, Batani and Batani
8
]. In any case, the VISAR can optimally be used only with transparent materials, which is not the case of h-BN. Therefore, it is still necessary to see under which conditions of laser irradiation and target geometry, PALS can provide reliable EoS data using diagnostics such as a streak optical pyrometer (SOP), which can only allow measuring average velocities in stepped samples. Hence, in this paper, we focused on results obtained with the SOP diagnostic.
2 Experimental setup and diagnostics
The experiment was conducted at PALS in Prague[ Reference Jungwirth, Cejnarova, Juha, Kralikova, Krasa, Krousky, Krupickova, Laska, Masek, Mocek, Pfeifer, Prag, Renner, Rohlena, Rus, Skala, Straka and Ullschmied 9 ], which is well suited for experimental studies of the interaction between intense laser radiation and matter. The main experimental facility is a pulsed terawatt iodine laser, capable of delivering up to 1 kJ of energy in an infrared subnanosecond pulse with an intensity of up to 30 PW/cm2. During the present experiments, the PALS[ Reference Singh, Krupka, Krasa, Agarwal, Devi, Dudzak, Cikhardt, Burian, Dostal, Chodukowski, Rusiniak, Pisarczyk, Krus, Morace and Juha 10 – Reference Filippov, Khan, Tentori, Gajdos, Martynenko, Dudzak, Koester, Zeraouli, Mancelli, Baffigi, Gizzi, Pikuz, Nicolaï, Woolsey, Fedosejevs, Krus, Juha, Batani, Renner and Cristoforetti 12 ] was operated in its third harmonic at a wavelength of 438 nm generating high-pressure shock waves in h-BN targets. The laser delivered energies of up to 200 J per pulse with a pulse duration of approximately 350 ps (FWHM). A phase plate was used to ensure a uniform, flat-top spatial intensity profile within the focal spot, which had a diameter of approximately 400 μm on target.
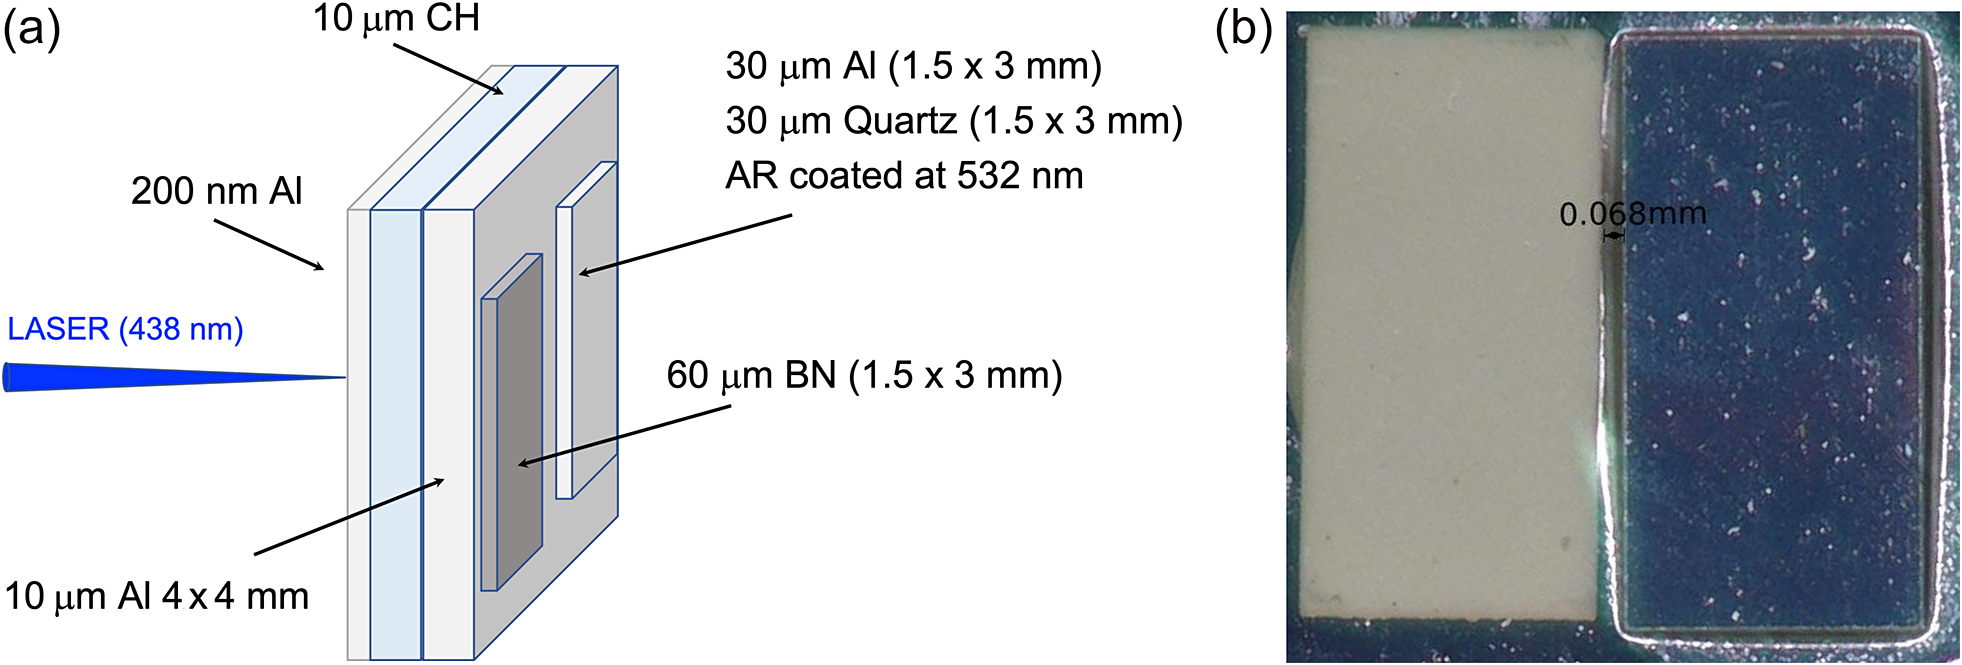
The targets consisted of two-layer (two-step) structures composed of BN and a reference material – either aluminum (Al) or quartz (SiO2). These were fabricated by Scitech Precision Ltd (UK) with precisely controlled thickness and two stepped targets, as shown in Figure 1. One of the steps was constructed from the material under investigation (h-BN), while the other was a reference material with a well-characterized EoS, either aluminum or quartz (in both cases with a thickness of 30 μm). This enabled applying the impedance mismatch technique[ Reference Koenig, Faral, Boudenne, Batani, Bossi, Benuzzi, Remond, Perrin and Temporal 13 ], a standard method for determination of the EoS for matter under dynamic compression.
(a) General scheme of two-step targets and (b) actual photo of the rear side of the target (BN/quartz) showing a gap of 68 μm between the two steps.

The base of the target was made of three layers: the first layer was composed of a thin Al coating on the laser side ( $\lesssim$
200 nm) to prevent laser shine-through, followed by a plastic foil (CH with density
$\lesssim$
200 nm) to prevent laser shine-through, followed by a plastic foil (CH with density $\rho \approx$
1 g/cm3, thickness 10 μm) acting as a low-Z ablator in order to minimize X-ray generation and related preheating effects and finally the third layer was an Al pusher (with density
$\rho \approx$
1 g/cm3, thickness 10 μm) acting as a low-Z ablator in order to minimize X-ray generation and related preheating effects and finally the third layer was an Al pusher (with density $\rho$
= 2.7 g/cm3, thickness 10 μm).
$\rho$
= 2.7 g/cm3, thickness 10 μm).
The h-BN layer was obtained from commercial foils (Goodfellow, 200 μm thickness), which were machined to reduce the thickness down to 60 μm. The measured density for these samples is 2.05 g/cm3, which is less than the nominal density of h-BN (2.28 g/cm3). Indeed, such foils are obtained by compressing h-BN powder at high pressure, which results in a reduced density and some porosity. As we will show later, this characteristic reflects on the emission induced by shock propagation, and it is important for data analysis.
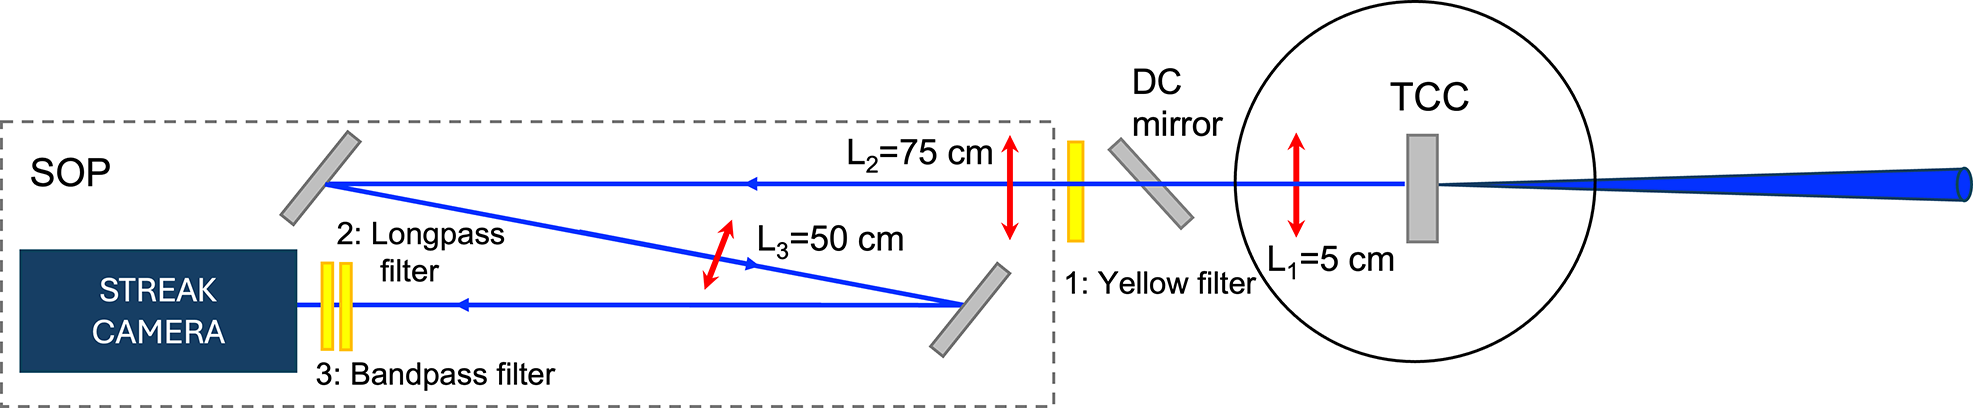
A time- and space-resolved optical diagnostic (see Figure 2) was employed to observe the shock wave propagation into the material. An SOP was used to capture the self-emission of the shock front in the visible range. The SOP provided a time-resolved signal with a temporal resolution of approximately 100 ps, as determined by the sweep speed and streak camera slit opening. The measurement was covering all visible range excluding radiation at 527 nm, which was used as a laser source for a VISAR (under development). This was rejected by using a dichroic mirror at the output of the interaction chamber (DC). Several other filters were present in the optical path. The scattered laser light at 438 nm and the un-converted 1ω light at 1.3 μm were cut by a yellow high-pass filter transmitting light above the cutting edge at 470 nm with transparency of approximately 90% from 524 nm (1 in Figure 2), a high-pass filter with the edge at 490 nm and transparency of approximately 95% above 564 nm (2 in Figure 2) and a band-pass filter for 450–1100 nm with transparency of approximately 95% in the range of 486–1020 nm (3 in Figure 2).
Scheme of the experimental diagnostic.

The SOP captured light emission from the target rear side, allowing the determination of shock breakout times and a direct measurement of the average shock velocity. The target rear side was imaged on the SOP streak camera slit by means of a photographic objective (Olympus, 50 mm, F/1.8) and a 50 cm focal length lens. The SOP diagnostic was synchronized with the main laser pulse using a fast photodiode trigger system.
By measuring the shock velocity in both the reference material (Al, quartz) and h-BN simultaneously and using the well-known Hugoniot relations, the shock pressure and fluid velocity in h-BN were inferred. The relative method reduced systematic uncertainties arising from laser shot-to-shot fluctuations, as both materials were subjected to the same laser conditions.
The smooth operation of the PALS enables more than 10 shots per day, which is a quite high frequency of operations from the point of view of EoS measurements (for comparison facilities such as GEKKO or PHELIX allow for about five shots per day). During this experimental campaign, a total of 95 shots were performed, including 29 shots on h-BN targets. Out of all the performed shots during the experimental campaign, eight shots met the criteria to provide significant results, that is, the laser-driven shock produced a clear breakout signal on the base of the target and on the two steps (the laser being correctly focused on the target front side in the region between the two steps). These successful shots were all conducted near the maximum allowed laser energy and intensity for this operating mode.
3 Analysis of experimental results
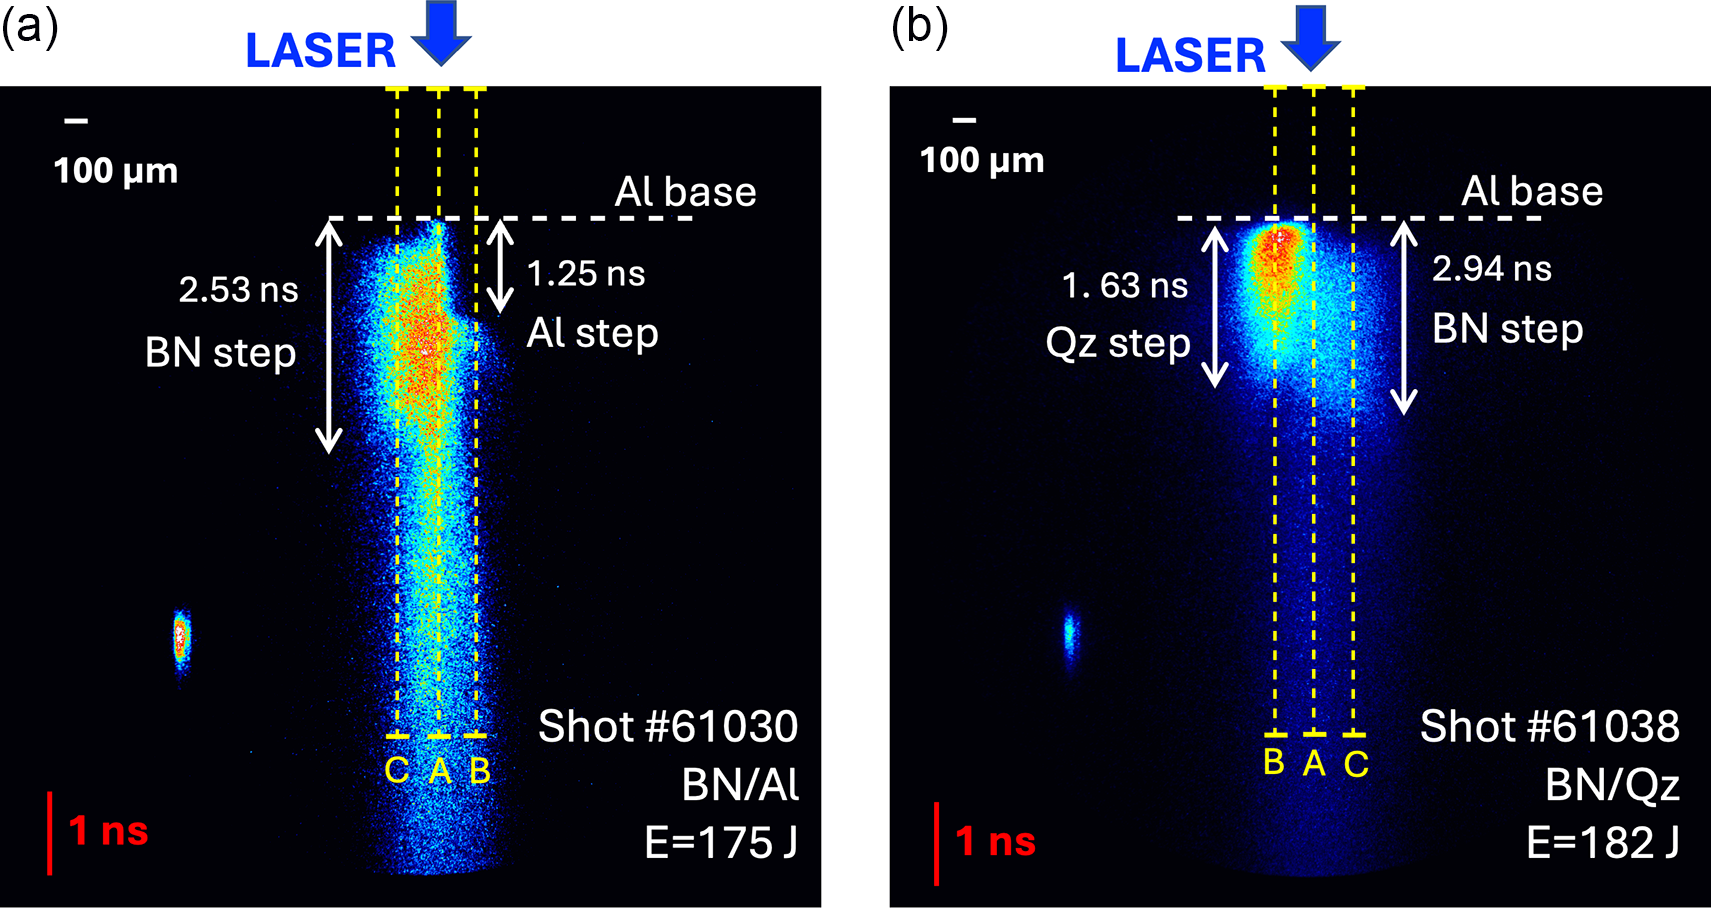
Figure 3 shows two SOP images obtained using Al/BN and quartz/BN targets.
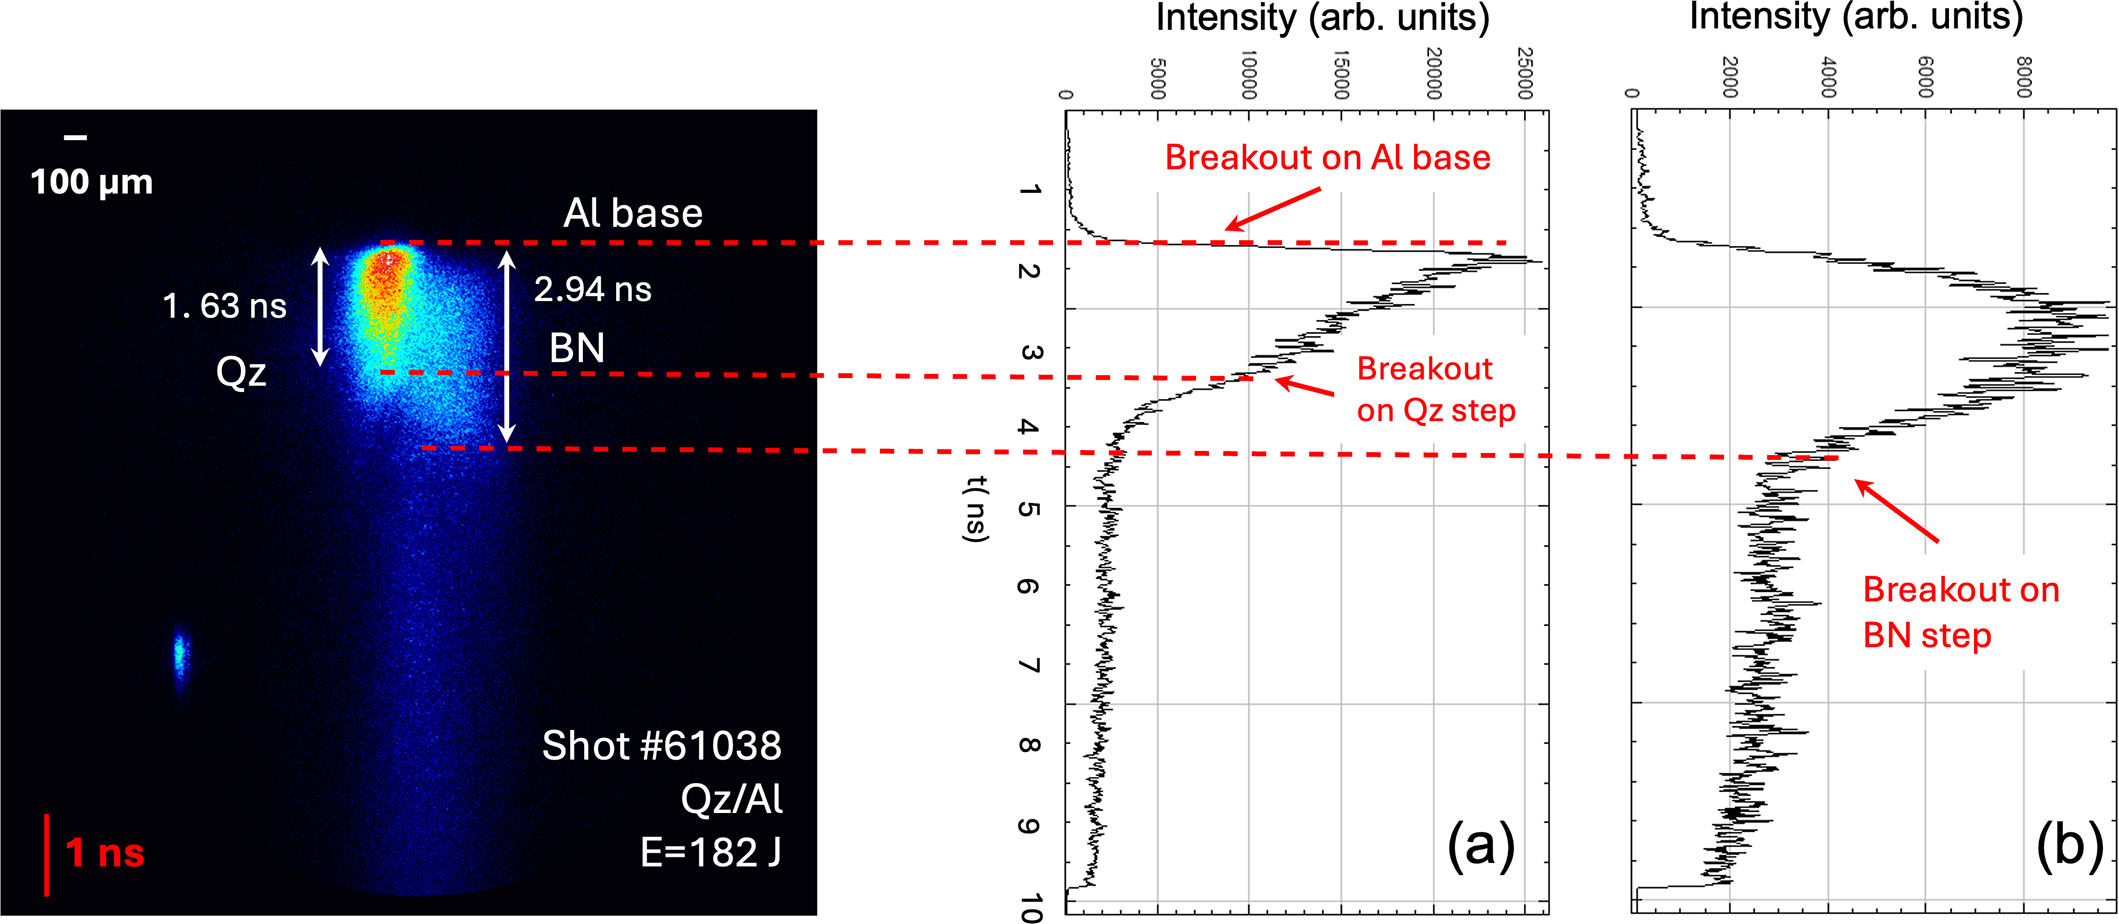
SOP images for (a) Al/BN (shot #61030, E = 175 J) and (b) quartz/BN (shot #61038, E = 182 J). In both cases the sweep time is 10 ns.

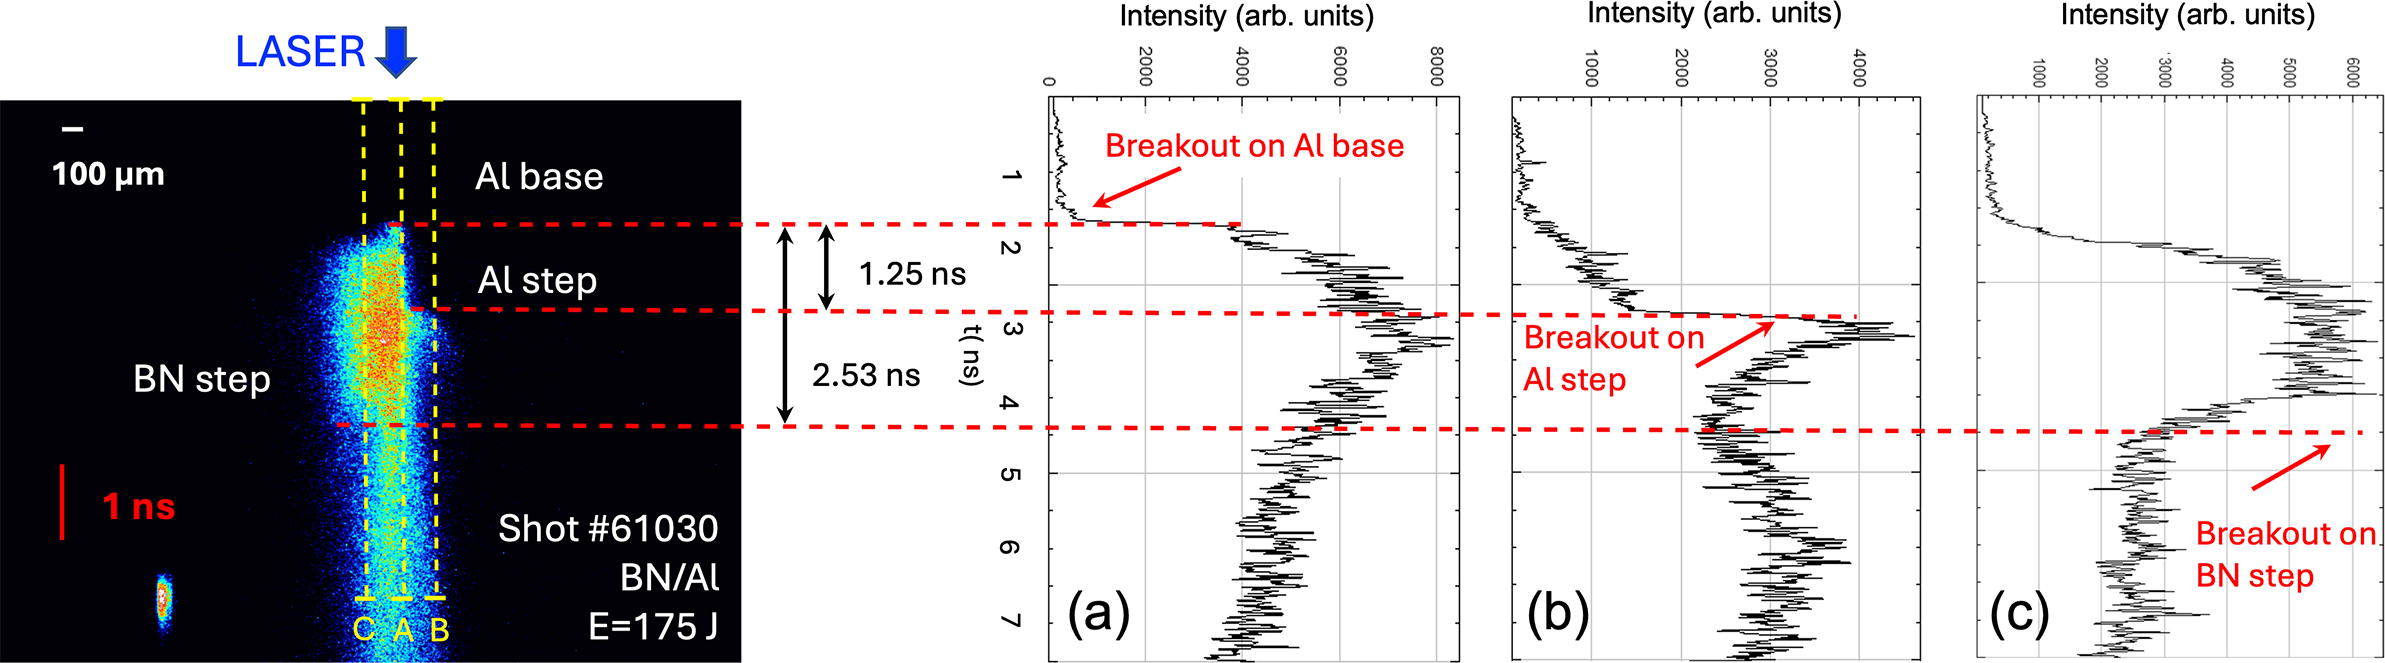
Let us notice that in the case of the Al base and the Al step (opaque material) there is no light emitted (and no light collected by the streak camera) before the shock breaks out from the target rear side (Figure 3(a)). In contrast to quartz (transparent material) and our h-BN sample (partially opaque material), the emission of light begins when the shock enters these materials from the base (or soon after) and continues up to the shock breakout on the target rear side (Figure 3(b)). After breakout the emission rapidly vanishes due to plasma expansion and cooling. The different behaviors are shown in Figures 3(a) and 4 for the Al/BN target and in Figures 3(b) and 5 for the quartz/BN target.
SOP image from shot #61030 as in Figure 3(a) and time profiles of recorder emissivity from the Al/BN target base (a), Al step (b) and BN step (c) obtained in correspondence with the vertical cuts shown in the SOP image.

Time profiles of recorder emissivity from the quartz/BN target for the Al base and quartz step (a) and BN step (b). For shot #61038 as in Figure 3(b).

Figures 4 and 5 show the principle of data analysis. As specified before, the shock breakout from the Al base corresponds to a sharp increase in luminosity. In the case of the quartz target this is indeed seen through the quartz layer. The shock breakout from the quartz and BN step corresponds instead to the decrease in emissivity due to plasma expansion and cooling.
4 Application of the impedance mismatch method
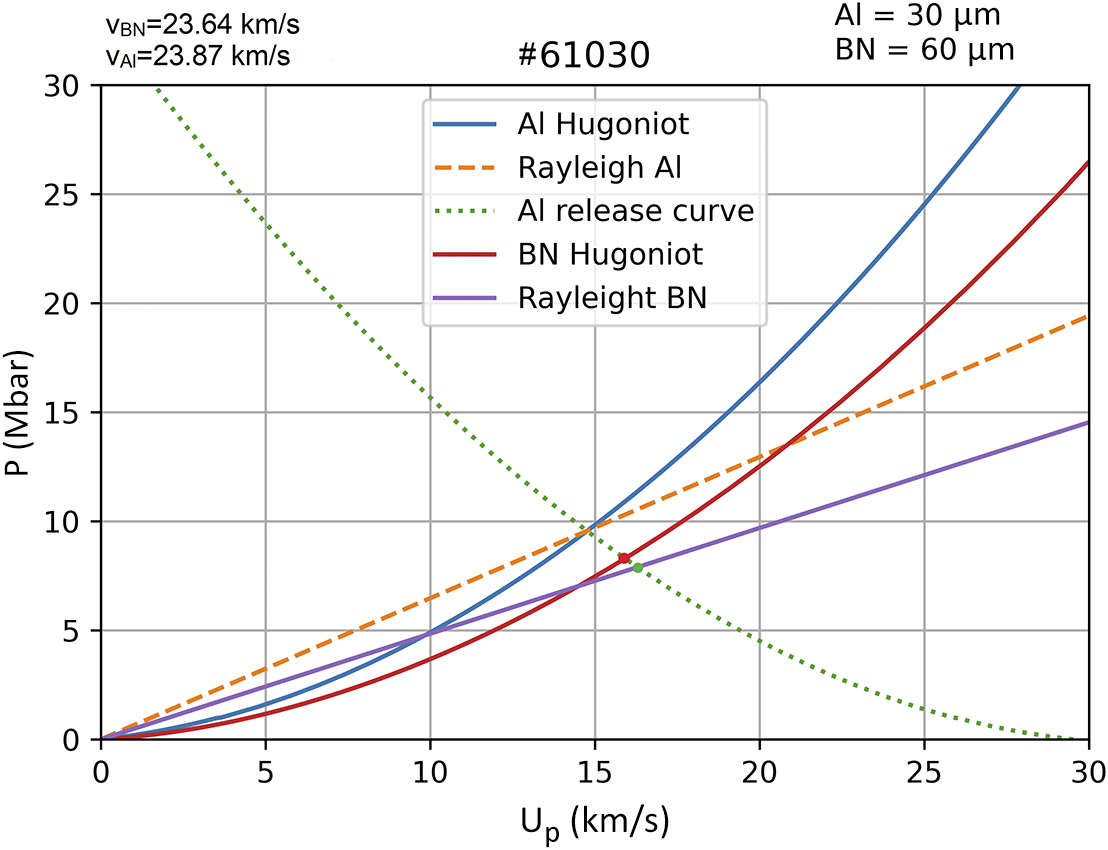
Figure 6 shows the application of the impedance mismatch method to the result of shot #61030. In the plane determined by the variables U
p and P (fluid velocity and pressure, respectively), the state of shocked aluminum lies on the intersection of the Hugoniot curve for Al with the Rayleigh lines (P = ${\rho}_0^{\mathrm{Al}}$
D
Al U
p) determined by the initial density of Al and the measured value of shock velocity D
Al in Al. The experimental point of BN lies at the intersection of the Rayleigh line for BN (P =
${\rho}_0^{\mathrm{Al}}$
D
Al U
p) determined by the initial density of Al and the measured value of shock velocity D
Al in Al. The experimental point of BN lies at the intersection of the Rayleigh line for BN (P = ${\rho}_0^{\mathrm{BN}}$
D
BN U
p) determined by the initial density of h-BN and the measured value of shock velocity D
BN in BN with the release curve for Al. In our analysis for the EoS we used the SESAME table 3717 for Al, SESAME 7385 for α-quartz and the Hugoniot curve obtained from the Frankfurt equation of state (FEOS) model for BN. Since the densities of Al and h-BN are quite close, the release curve of Al is well approximated by reflecting the Hugoniot curve of Al in the (U
p, P) plane. Once the state of shocked BN has been obtained, its density ρ can be calculated by applying the conservation of mass across the shock front, that is, ρD
BN =
${\rho}_0^{\mathrm{BN}}$
D
BN U
p) determined by the initial density of h-BN and the measured value of shock velocity D
BN in BN with the release curve for Al. In our analysis for the EoS we used the SESAME table 3717 for Al, SESAME 7385 for α-quartz and the Hugoniot curve obtained from the Frankfurt equation of state (FEOS) model for BN. Since the densities of Al and h-BN are quite close, the release curve of Al is well approximated by reflecting the Hugoniot curve of Al in the (U
p, P) plane. Once the state of shocked BN has been obtained, its density ρ can be calculated by applying the conservation of mass across the shock front, that is, ρD
BN = ${\rho}_0^{\mathrm{BN}}$
(D
BN – U
p) (one of the Rankine–Hugoniot relations[
Reference Zel’dovich and Raizer
14
]).
${\rho}_0^{\mathrm{BN}}$
(D
BN – U
p) (one of the Rankine–Hugoniot relations[
Reference Zel’dovich and Raizer
14
]).
Application of the impedance mismatch principle to the results of shot #61030. The theoretical point (red point, P = 8.29 Mbar, U p = 15.91 km/s) corresponds to the crossing point of the Hugoniot curve for BN and the aluminum decompression curve. The experimental point (green point, P = 7.89 Mbar, U p = 16.29 km/s) corresponds to the crossing point of the Al decompression curve and the Rayleigh line for BN defined by the shock velocity in BN, v BN = 23.64 km/s.

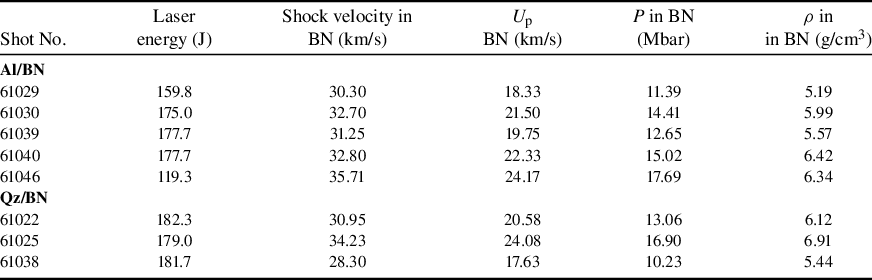
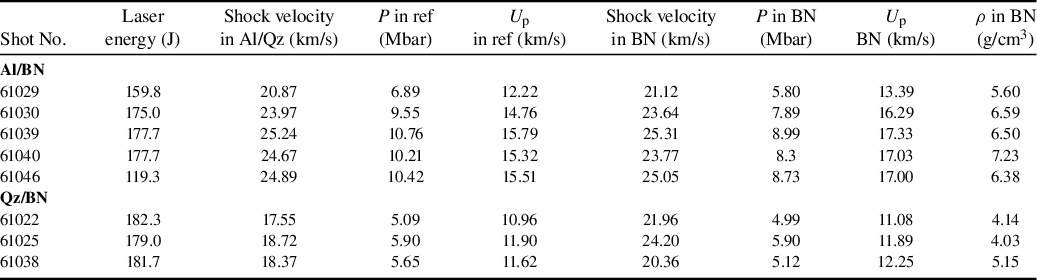
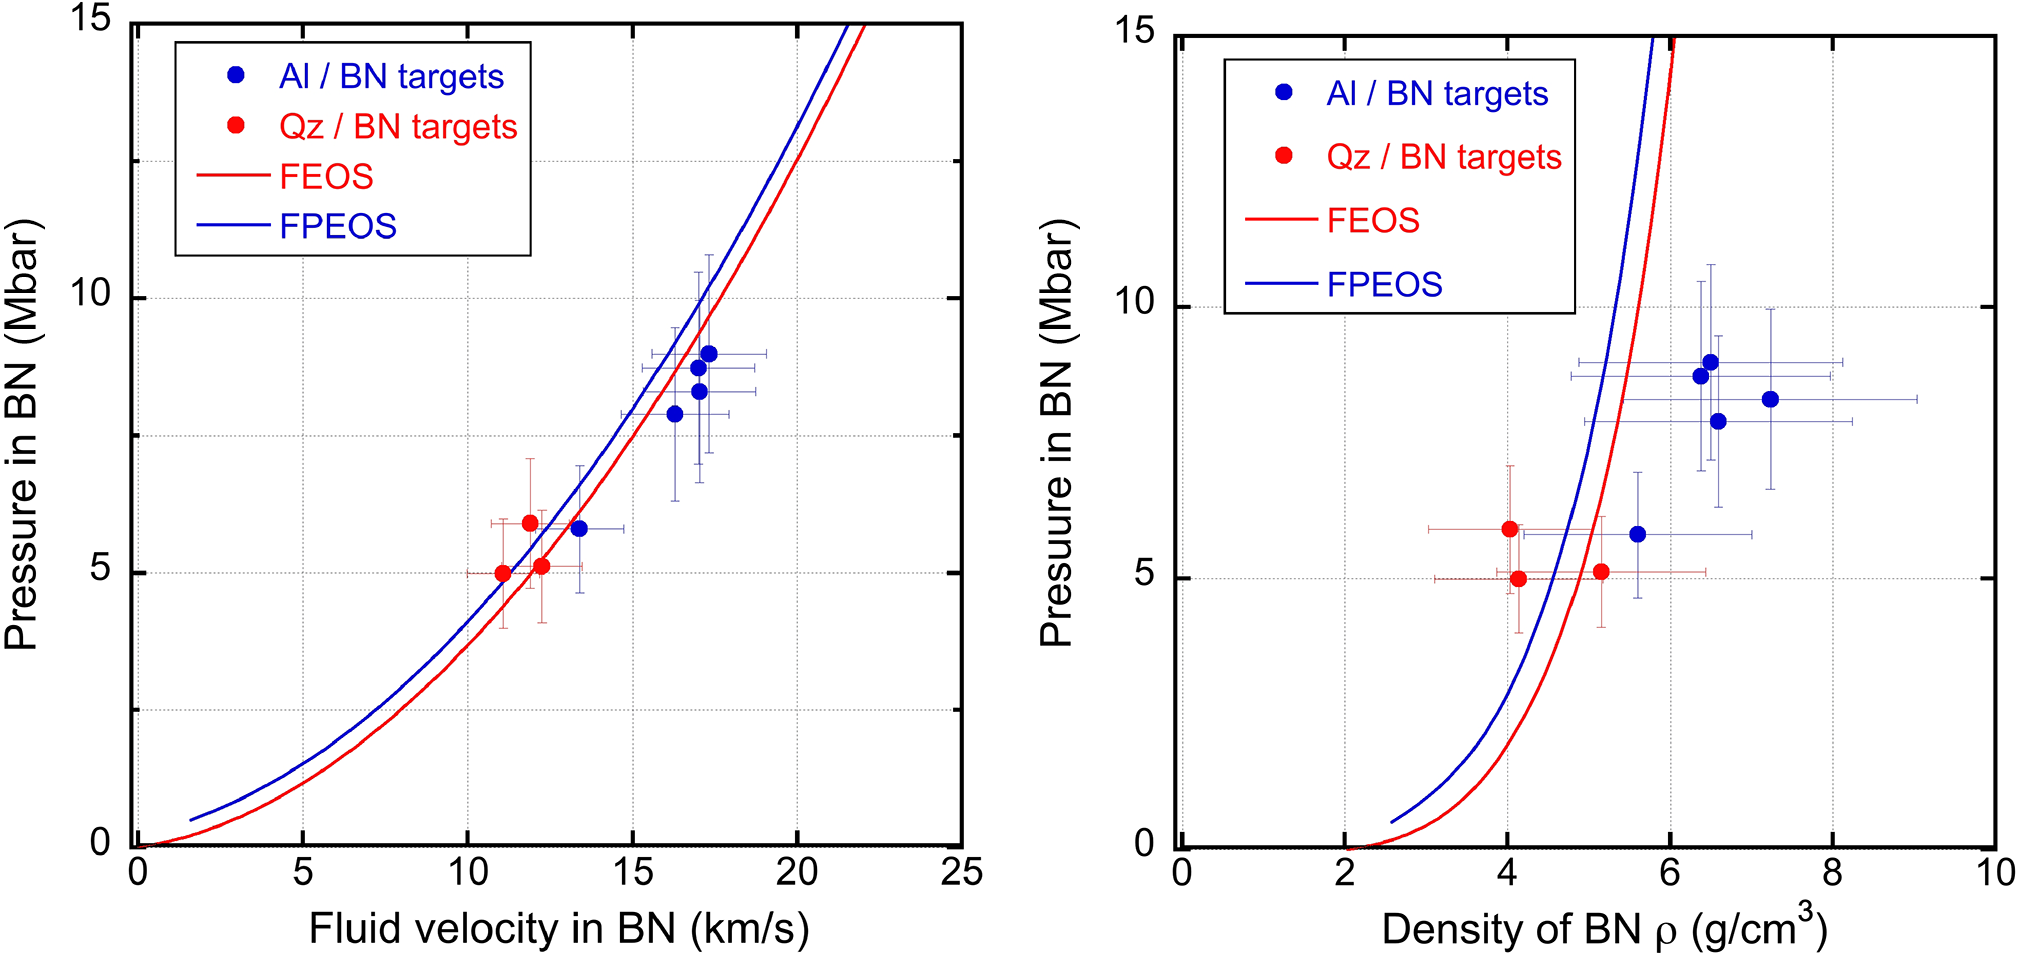
The final set of obtained experimental data is shown in Table 1 and in Figure 7.
Obtained experimental results.

Experimental EoS points for h-BN obtained in the present experiment in the (U p,P) plane and in the (ρ,P) plane.

In Figure 7, the experimental results have been compared with the theoretical curves provided by the FEOS model[ Reference Faik, Tauschwitz and Iosilevskiy 15 ] and the first-principles equation of state (FPEOS) model[ Reference Militzer, Gonzalez-Cataldo, Zhang and Driver 16 ], both calculated using an initial density of 2.05 g/cm3 (as measured in our samples) and the standard bulk modulus of h-BN (37 GPa).
In our study, error bars on velocities were of the order of $\pm$
10% as determined by the roughness of the step surface (mainly the BN step with a measured surface roughness of ≤1 μm) and the time resolution of SOP diagnostics (
$\pm$
10% as determined by the roughness of the step surface (mainly the BN step with a measured surface roughness of ≤1 μm) and the time resolution of SOP diagnostics ( $\sim$
100 ps), and also by the quality of recorded signals, which were not so easy to analyze. All combined uncertainties were reflected in errors of approximately 25% in the density of compressed BN and 20% in estimated pressure.
$\sim$
100 ps), and also by the quality of recorded signals, which were not so easy to analyze. All combined uncertainties were reflected in errors of approximately 25% in the density of compressed BN and 20% in estimated pressure.
5 Corrections for shock non-stationarity
The PALS facility can potentially be interesting for laser-driven shock EoS experiments because its relative high laser energy per pulse (potentially up to $\sim$
400 J) and short wavelength (438 nm) can create high ablation pressure. As is well known, the pressure usually scales as follows[
Reference Lindl
17
]:
$\sim$
400 J) and short wavelength (438 nm) can create high ablation pressure. As is well known, the pressure usually scales as follows[
Reference Lindl
17
]:
 $$\begin{align*}P\left(\mathrm{Mbar}\right)=8.6{\left(I/{10}^{14}\right)}^{2/3}{\lambda}^{-2/3}{\left(A/2Z\right)}^{1/3},\end{align*}$$
where $I$
is the intensity of the laser measured in W/cm2,
$I$
is the intensity of the laser measured in W/cm2, $\lambda$
is the wavelength of the laser measured in μm, Z is the atomic number and A is the mass number. In principle average intensities on targets of the order of approximately 5×10¹⁴ W/cm2 could be reached (while in our experiment we limited ourselves to energies
$\lambda$
is the wavelength of the laser measured in μm, Z is the atomic number and A is the mass number. In principle average intensities on targets of the order of approximately 5×10¹⁴ W/cm2 could be reached (while in our experiment we limited ourselves to energies ${\sim}{200}$
J), which corresponds to
${\sim}{200}$
J), which corresponds to $P$
$P$ $\sim$
40 Mbar. If, instead of the present focal spot diameter of 400 μm, one uses 300 μm, which is still large enough to avoid bidimensional effects, the pressure can increase up to
$\sim$
40 Mbar. If, instead of the present focal spot diameter of 400 μm, one uses 300 μm, which is still large enough to avoid bidimensional effects, the pressure can increase up to $P$
$P$ $\sim$
60 Mbar.
$\sim$
60 Mbar.
The relatively high shot rate (ideally one shot every 30 min) and flexibility of this facility also contribute to the interest of using PALS for EoS experiments.
However, the reliability of obtained EOS data from experiments relies on the application of the impedance mismatch conditions and hence the measurements of instantaneous shock velocity at the interface between two materials. If both the reference material and the sample under study are transparent, the VISAR can provide the full history of the shock velocities. However, this is not often the case. One of the most used reference materials is indeed aluminum because of its well-known EoS validated by many available experimental data. Also often, as in the case of the present paper, the sample material is also nontransparent.
In this case SOP diagnostics can only provide an average value of velocity in the related layer, and hence shock stationarity is essential to assure that the measured average velocity is indeed the same as the instantaneous velocity.
Stationarity is of course related to the duration of the laser pulse because at the end of the laser pulse, a decompression wave is generated on the front side of the target and this can reach the shock front, after which the pressure decreases. This is also related to the thickness of the target because in thicker targets the decompression wave can reach the shock front. Another parameter impacting stationarity is related to the size of the focal spot as compared to target thickness. Again, for thicker targets, the shock front will depart from planar expansion and will be affected by bidimensional effects. Indeed, the need for producing a flat shock front, using optical smoothing techniques[ Reference Koenig, Faral, Boudenne, Batani, Bossi and Benuzzi 18 , Reference Batani and Bleu 19 ], is a key factor in this respect.
All of these factors have been already discussed in the literature (see in particular Ref. [Reference Batani, Löwer, Hall, Benuzzi and Koenig20]). In this respect it is important to study to what extent the EoS data collected at PALS are reliable. In our experiment, two-dimensional (2D) hydrodynamics expansion effects are not relevant since the maximum target thickness (80 μm related to the base plus the h-BN step) is much smaller than the laser focal spot size (400 μm). The loss of stationarity induced by shot-to-shot duration of the laser pulse is instead an issue that must be taken into careful consideration.
To address this point, we performed one-dimensional (1D) radiative hydrodynamic simulations with the open-access code MULTI[
Reference Ramis, Schmalz and Meyer-Ter-Vehn
21
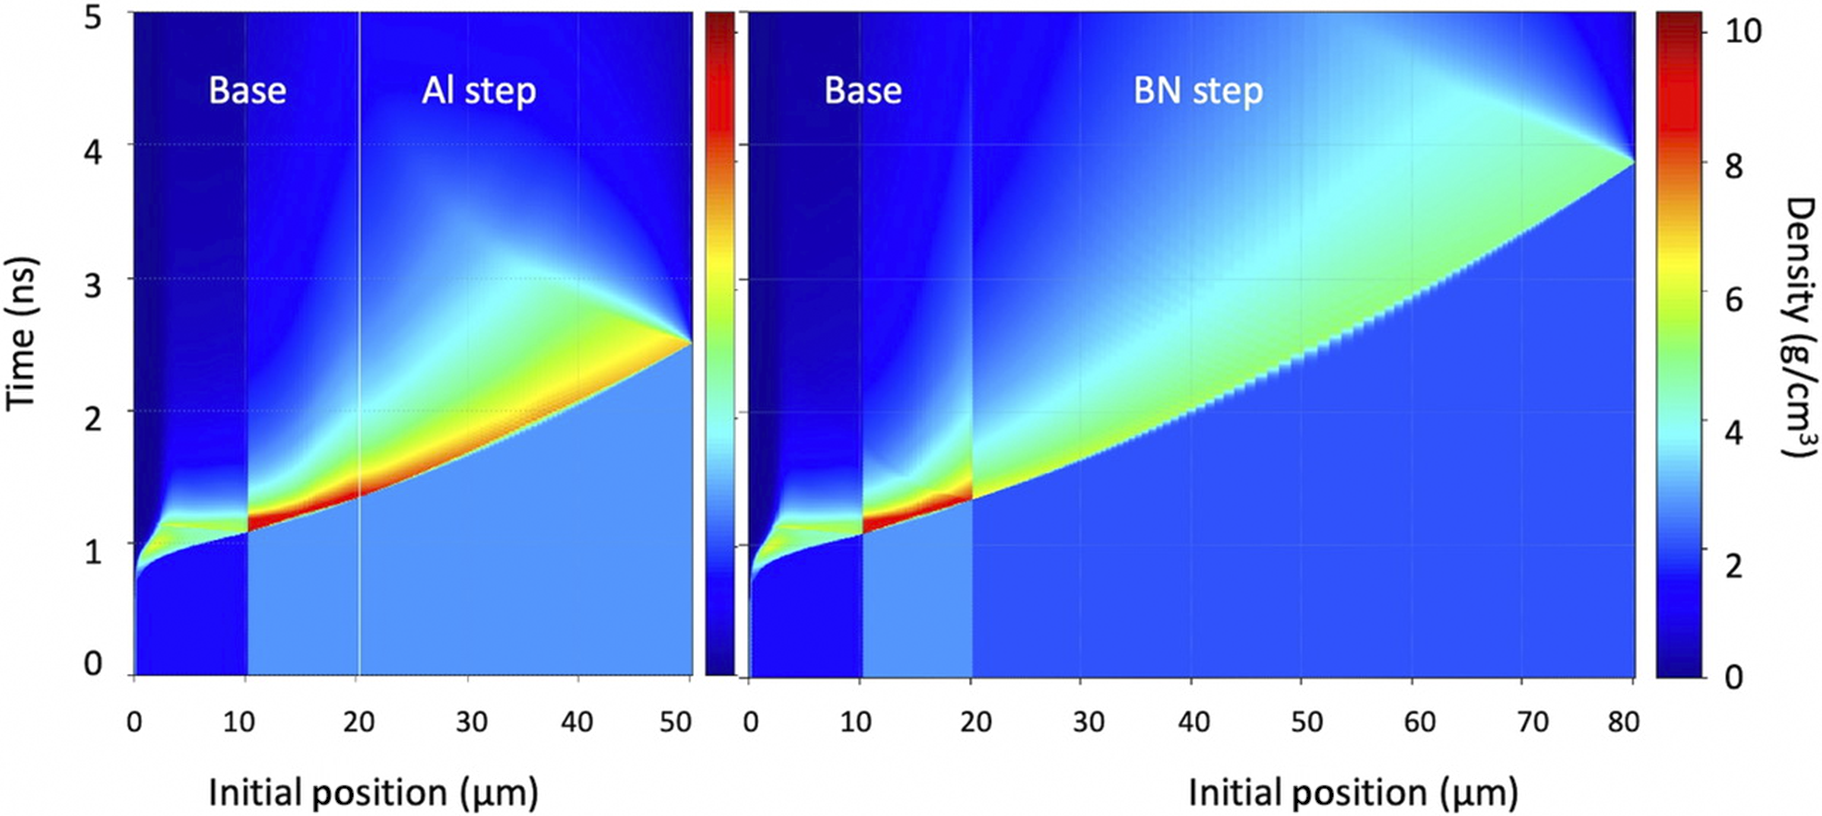
] for all our laser shots reported in Figure 7. As an example, Figure 8 shows the result of simulations performed for an Al/BN target (shot #61030). Al was described using the SESAME EoS 3717[
Reference Johnson
22
]. For BN we used the FEOS EoS model with an initial density of 2.05 g/cm3 and the standard bulk modulus of h-BN (37 GPa). The laser intensity was adjusted to reproduce the experimental shock transit times in the two steps for shot #61030 (respectively ${\Delta t}_{\mathrm{Al}}\approx$
1.25 ns and
${\Delta t}_{\mathrm{Al}}\approx$
1.25 ns and ${\Delta t}_{\mathrm{BN}}\approx$
2.53 ns, corresponding to shock velocities of 23.97 km/s in Al and 23.64 km/s in BN). In the simulation the maximum of the laser pulse arrives on target at 1 ns.
${\Delta t}_{\mathrm{BN}}\approx$
2.53 ns, corresponding to shock velocities of 23.97 km/s in Al and 23.64 km/s in BN). In the simulation the maximum of the laser pulse arrives on target at 1 ns.
Shock propagation in a multi-layered target made of a base (0.2 μm Al, 10 μm CH, 10 μm Al) followed by 30 μm Al (left) or 60 μm BN (right).

It is important to notice that the same laser intensity very well reproduced the shock breakout times at the base and in both the Al (quartz) step and the h-BN step without further adjustments (of course in the experiment the same laser intensity drives the shock in both steps). Also, the fact that our shock breakout times are well reproduced by 1D hydro simulations is a confirmation that indeed 2D effects are negligeable in our experiment.
The results in Figure 8 show that the shock velocity is slightly decreasing approximately after the first 10 μm of propagation inside the steps. This shows that an optimized EoS experiment at the PALS facility should not use targets that are thicker than approximately 30–40 μm in total. This means that in our experiment we have measured the average shock velocity in the two steps, and that therefore the data presented in Figure 7 are based on such average velocities.
It is possible to correct our data and take into account the effect of non-stationarity. In order to consider the effect of slowing down, we have extracted the initial shock velocities in the reference material and in h-BN from our simulations. Because our simulations reproduce the breakout time at the base and at the step very well, we assumed that the time history of shock velocity was also well reproduced by the simulations. Indeed, this assumption is correct because the slowing down of a shock propagating in matter has a very weak dependence on the details of the EoS of the material and is mainly dependent on its density and thickness.
We have then applied the impedance mismatch technique to the initial values of shock velocity in aluminum (or quartz) and in h-BN and, for each shot, we have therefore calculated a corrected EoS point on the Hugoniot curve of the material. This point corresponds to what we would have measured in an experiment, which uses thinner steps (not allowing for shock slowing down) or longer laser pulses (allowing one to maintain shock velocity constant in time). Of course, the initial values of shock velocities are larger than the average velocities measured at the time of shock breakout from the steps, which implies that the initial pressure is also larger than the average pressure.
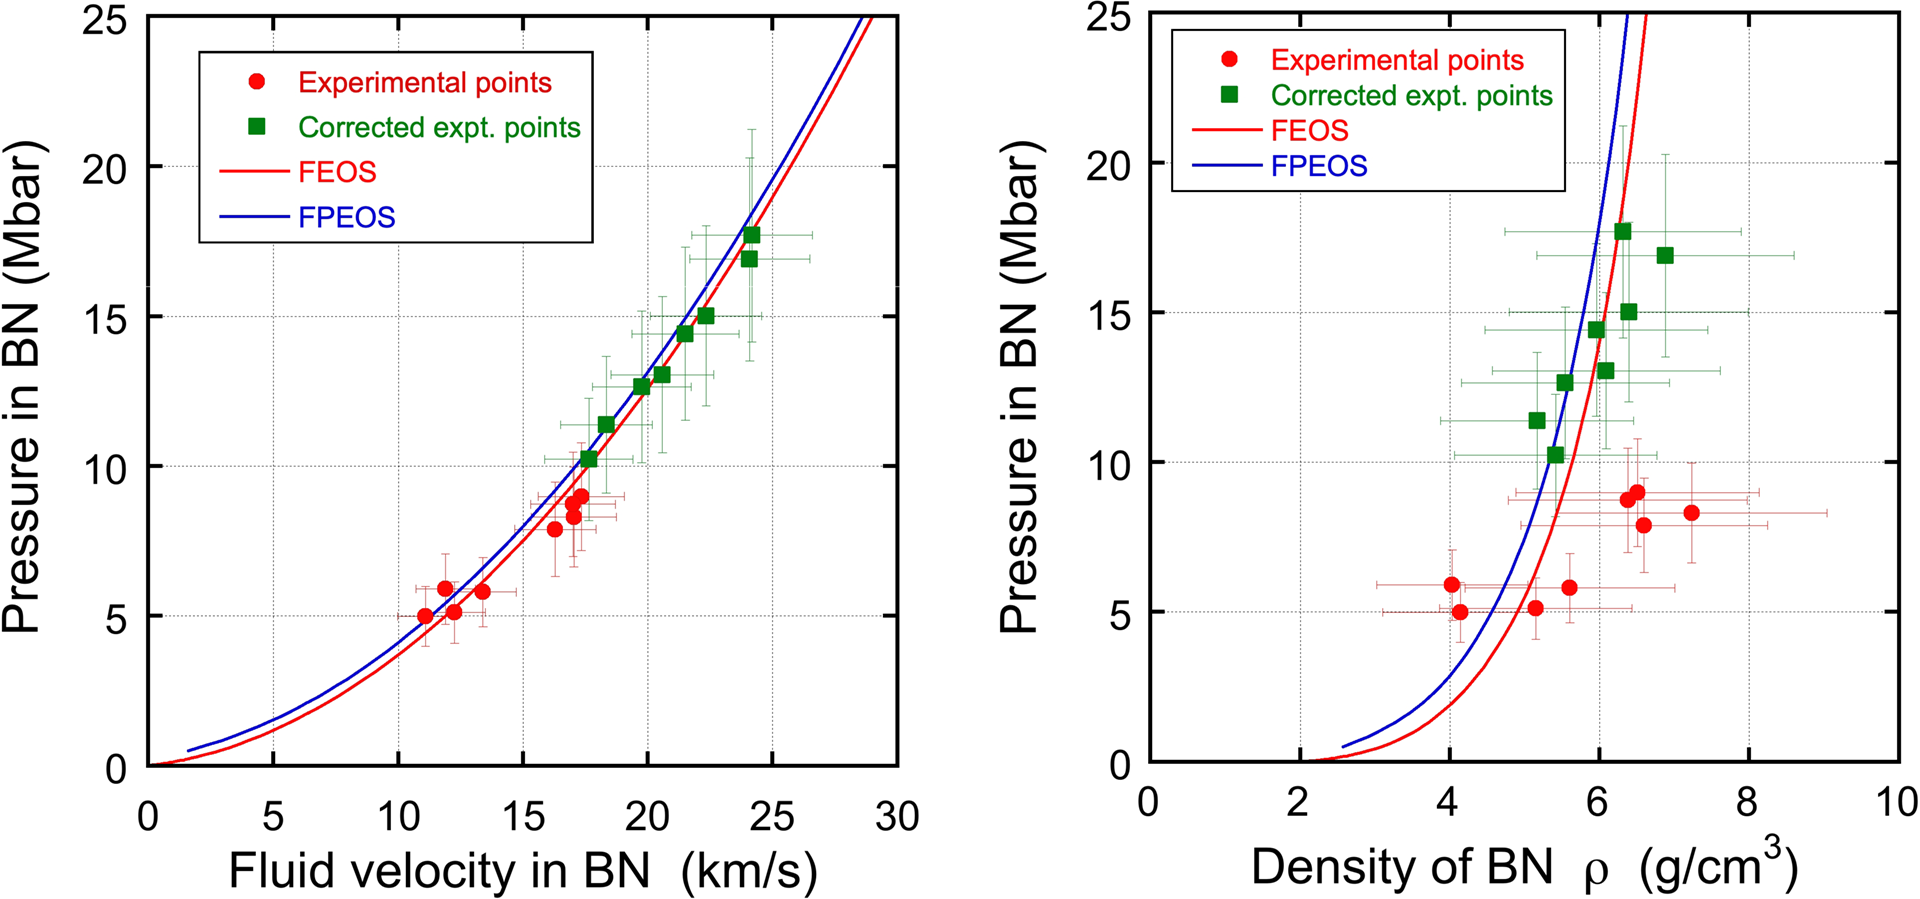
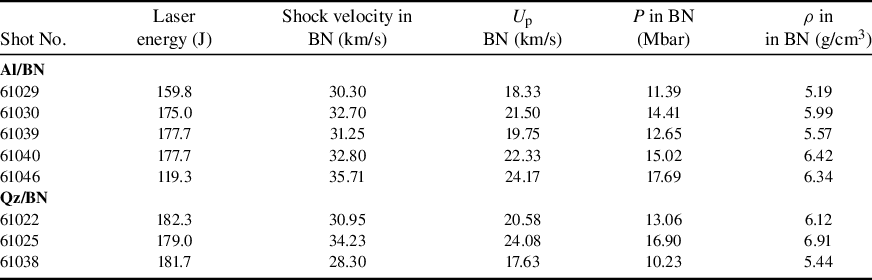
The corrected points obtained with this procedure are reported in Figure 9 (Table 2). We can see that not only do they correspond to higher shock pressures and compressed densities (the natural result of the fact that the initial shock velocities are larger) but also they are definitely closer to theoretical predictions, and with smaller dispersion.
Comparison of the experimental results (red points) with the data corrected taking into account the effect of non-stationarity (green points).

Obtained experimental results taking into account the effect of non-stationarity.
The experimental results in Figure 9 (Table 2) also demonstrate that using a short-wavelength laser at 3ω (438 nm) with an energy of approximately 200 J, it is possible to achieve pressures between 10 and 18 Mbar.
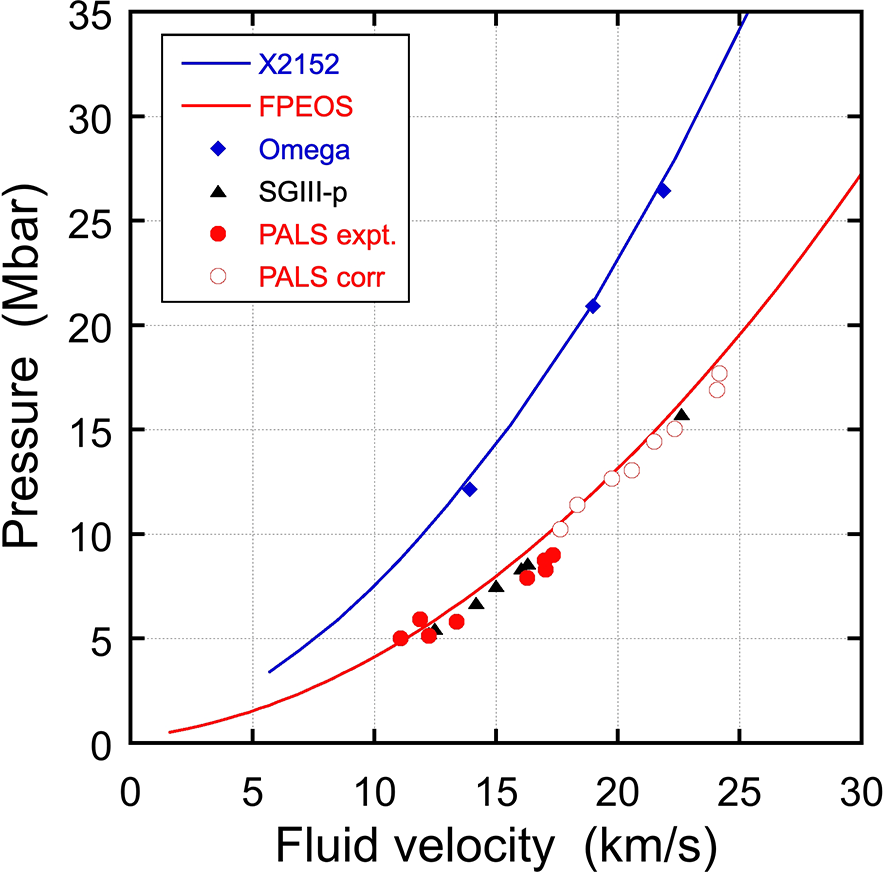
Finally, Figure 10 shows a comparison of the presently available results for h-BN and c-BN. Notably, the pressure range accessed in our experiment performed in direct drive is comparable to what was obtained for the same targets (h-BN, 2.05 g/cm3) using the indirect drive approach at the SGIII-p facility, where 3ω (351 nm) laser light was used with significantly higher energy – up to 6400 J[ Reference Zhang, Yang, Guan, Duan, Yang, Yang, Liu, Shen, Batani, Singappuli, Li, Huo, Lan, Liu, Li, Yang, Li, Wang, Yang, Zhao, Zhang, Sun, Kang and Batani 4 ]. In the same figure we also show the EoS measurements done at the Omega laser facility for cubic BN (ρ = 3.45 g/cm3)[ Reference Zhang, Lazicki, Militzer, Yang, Caspersen, Gaffney, Däne, Pask, Johnson, Sharma, Suryanarayana, Johnson, Smirnov, Sterne, Erskine, London, Coppari, Swift, Nilsen, Nelson and Whitley 5 ].
Comparison of our results with previous results reported in the literature[ Reference Zhang, Yang, Guan, Duan, Yang, Yang, Liu, Shen, Batani, Singappuli, Li, Huo, Lan, Liu, Li, Yang, Li, Wang, Yang, Zhao, Zhang, Sun, Kang and Batani 4 , Reference Zhang, Lazicki, Militzer, Yang, Caspersen, Gaffney, Däne, Pask, Johnson, Sharma, Suryanarayana, Johnson, Smirnov, Sterne, Erskine, London, Coppari, Swift, Nilsen, Nelson and Whitley 5 ]. The curve X2152 has been recalculated in the (U p, P) plane starting from the graph reported in Ref. [Reference Zhang, Lazicki, Militzer, Yang, Caspersen, Gaffney, Däne, Pask, Johnson, Sharma, Suryanarayana, Johnson, Smirnov, Sterne, Erskine, London, Coppari, Swift, Nilsen, Nelson and Whitley5].

6 Conclusions
We have performed the first experiment using BN targets at the PALS facility. This enabled us to test the target design and the diagnostics and obtain new data points for the Hugoniot curve of h-BN, complementing the data obtained at the SGIII-p[ Reference Zhang, Yang, Guan, Duan, Yang, Yang, Liu, Shen, Batani, Singappuli, Li, Huo, Lan, Liu, Li, Yang, Li, Wang, Yang, Zhao, Zhang, Sun, Kang and Batani 4 ] and Omega[ Reference Zhang, Lazicki, Militzer, Yang, Caspersen, Gaffney, Däne, Pask, Johnson, Sharma, Suryanarayana, Johnson, Smirnov, Sterne, Erskine, London, Coppari, Swift, Nilsen, Nelson and Whitley 5 ] facilities, and the data at lower pressures (P ≤ 1 Mbar) reported in the RUSBANK data bank[ 23 ]. These data show a good agreement with the theoretical curve provided by both the FEOS model and the FPEOS model, in both cases using an initial density of 2.05 g/cm3 (as measured in our samples) and the standard bulk modulus of h-BN (37 GPa). Using a laser energy up to 200 J, we obtained pressures comparable to those in the experiment at the SGIII-p facility[ Reference Zhang, Yang, Guan, Duan, Yang, Yang, Liu, Shen, Batani, Singappuli, Li, Huo, Lan, Liu, Li, Yang, Li, Wang, Yang, Zhao, Zhang, Sun, Kang and Batani 4 ], with laser energy up to several kJ. This shows, as is well known, that direct drive is more efficient in comparison to the indirect drive approach in creating high shock pressures.
Such data can be useful to complete our understanding on the mechanical and thermal properties of BN and assess the possibility of using it in inertial fusion research as a possible alternative ablator to synthetic diamond, and also for modeling implosion dynamics in possible proton–boron fusion scenarios.
This experiment also started the development of a diagnostic platform for measuring the EoS under extreme conditions and allowed us to investigate the reliability of using the PALS facility for laser-shock EoS experiments (to be completed with the implementation of a VISAR). In future experiments using a semi-opaque material (such as BN), an improved target design could include the presence of an opaque layer (e.g., Al) deposition on the rear side of the steps, thereby avoiding recording shock emission during the shock traveling time in the step and hence improving the cleanness of the recorded shock breakout signals.
Hydro simulations of our experimental results showed that shock velocities are affected by slowing down. Hence, in order to measure the instantaneous shock velocity we should use thinner targets (up to a maximum of $\sim$
40 μm total thickness). Of course, in order to keep reasonable error bars, the use of thinner steps implies the need for improved surface quality (to reduce error in thickness measurement) and improved time resolution of diagnostics (in order to reduce the error in measurement of shock breakout time). For instance, keeping the error bars in shock velocity below 5% implies keeping both errors at approximately 3%, that is, having a surface roughness of less than 0.3 μm and a time resolution of less than 15 ps (assuming a shock traveling time in the step of
$\sim$
40 μm total thickness). Of course, in order to keep reasonable error bars, the use of thinner steps implies the need for improved surface quality (to reduce error in thickness measurement) and improved time resolution of diagnostics (in order to reduce the error in measurement of shock breakout time). For instance, keeping the error bars in shock velocity below 5% implies keeping both errors at approximately 3%, that is, having a surface roughness of less than 0.3 μm and a time resolution of less than 15 ps (assuming a shock traveling time in the step of $\sim$
0.5 ns), which are both feasible although challenging.
$\sim$
0.5 ns), which are both feasible although challenging.
Finally, in this paper, we have developed a procedure to correct the retrieved experimental data for the effect of non-stationarity. This is based on performing accurate hydrosimulations for each laser shot to correctly reproduce the shock breakout times at the base and at the two steps of the targets. From the simulation results we then extract the corresponding initial shock velocities in the reference material (aluminum or quartz) and in the studied sample (here h-BN). To such initial velocities we have then applied the impedance mismatch procedure to obtain a corrected EoS point. Of course, because the initial velocity is higher than the average velocity, the corrected values correspond to larger shock pressure (indeed the initial shock pressure before it starts decaying).
This procedure is an alternative method for the correction of shock non-stationarity to those already proposed in literature (see Refs. [Reference Fratanduono, Munro, Celliers and Collins24, Reference Duan, Wang, Zhang, Sun, Ye, Liu and Zhang25]). Let us notice that all methods are based on the use of some EoS for the material to be studied. This is the EoS model used in the hydro simulations in our case, or the EoS model used to evaluate the corrections factors F and G in Refs. [Reference Fratanduono, Munro, Celliers and Collins24, Reference Duan, Wang, Zhang, Sun, Ye, Liu and Zhang25]. However, the corrections provided by all these models remain valid because the slowing down of a shock propagating in matter has a weak dependence on the details of the EoS of the material and it is mainly dependent on its density and thickness. Hence, by accurately reproducing the shock breakout times at the base and at the two steps of the targets (with a single laser intensity), we also get an accurate representation of the time history of shock propagation.
Of course, the method works because the starting experimental data are correct in the sense that the shock breakout times were correctly measured with high enough precision.
Acknowledgements
We acknowledge the very useful scientific discussions and collaboration with Prof. Wei Kang (Peking University, Beijing, China) and with Dr. Liang Sun (LFRC, Mianyang, China).
This work has been carried out in the framework of the COST Action CA21128-PROBONO ‘PROton BOron Nuclear fusion: from energy production to medical applications’, supported by COST (European Cooperation in Science and Technology).
This scientific paper has been published as part of the international project co-financed by the Polish Ministry of Science and Higher Education within the program called ‘PMW’.
The research presented in this paper was supported by the Czech Republic’s Ministry of Education, Youth and Sports projects: Prague Asterix Laser System (LM2023068), No. 871124 – Laserlab-Europe, No. 101131771 – Lasers4EU, No. GA2307563S (Czech Science Foundation).
This work has also been supported in the framework of the EUROfusion Enabling Research Project: CfP-FSD-AWP26-ENR-01 ‘Conceptual design for a European High Power Laser Fusion Research Facility’ (HiPER+RF) and has been funded by the European Union via the Euratom Research and Training Programme (Grant Agreement No. 101052200 — EUROfusion). Views and opinions expressed are however those of the authors only and do not necessarily reflect those of the European Union or the European Commission. Neither the European Union nor the European Commission can be held responsible for them.
D. Mancelli acknowledges the funding from Hellenic Mediterranean University within the project ‘Proposal for post-doctoral research at the Institute of Plasma Physics and Lasers (IPPL) of Hellenic Mediterranean University (HMU)’ in the context of the 2607/Φ.120/04-05-2022 call of HMU for post-doctoral research. He also acknowledges the financial support from the French government in the framework of the University of Bordeaux’s France 2030 program/GPR LIGHT.
Finally, we acknowledge the support of the company HB11 Energy, Australia.

 Open access

