


Hereditary transthyretin (TTR) amyloidosis caused by the TTR pathogenic variant/mutation (ATTRv) is an adult-onset autosomal dominant, progressive multisystemic disease that predominantly involves the peripheral nervous system, heart, kidney, eyes and meninges. Reference Alcantara, Mezei and Baker1–Reference Koike, Ikeda and Takahashi3 Peripheral neuropathy is the neurological cardinal feature of ATTRv, which manifests as sensorimotor polyneuropathy, autonomic neuropathy and small fiber neuropathy. Pathologically, ATTRv is characterized by progressive axonal degeneration with loss of nerve fibers and atrophy of Schwann cells (SCs) with, or without, neighboring amyloid deposition. Reference Hanyu, Ikeda, Nakadai, Yanagisawa and Powell4–Reference Sommer and Schröder6 While amyloid deposition is the common mechanism for progressive tissue/organ damage in patients with ATTRv, Reference Alcantara, Mezei and Baker1,Reference Chompoopong, Mauermann, Siddiqi and Peltier2 the pathogenic mechanism of ATTRv remains elusive, particularly in terms of SC pathology and amyloid vasculopathy contributing to neuropathy. Reference Koike, Ikeda and Takahashi3,Reference Hanyu, Ikeda, Nakadai, Yanagisawa and Powell4 Here we report an ATTRv case that demonstrates unique nerve pathology with SC intracellular amyloidosis and inclusions.
A 64-year-old man presented with a 1.5-year history of progressive, painful, length-dependent sensory loss of the extremities. Over time, he developed bilateral foot drop, requiring ankle–foot orthoses and a walker-dependent gait. His past medical history was remarkable for psoriasis. He was not exposed to any biologics contributing to peripheral neuropathy. Neurological examination revealed preserved proximal strength but distal weakness of upper (4 to 4-/5) and lower (3 to 4/5) extremities as well as multimodal mid-limb stocking-and-glove sensory losses. He underwent an extensive diagnostic workup. Electrodiagnostic studies depicted a chronic symmetric axonal polyneuropathy with unrecordable peroneal and tibial motor and median and sural sensory responses. The median motor study revealed a terminal motor latency of 5.4 ms with a severely reduced compound muscle action potential of 0.5 mV and a conduction velocity of 41 m/s. Electromyography demonstrated positive sharp waves and fibrillations in the tibialis anterior, medial gastrocnemius, abductor pollicis brevis and first dorsal interosseous. There was also grade 1 chronic motor unit remodeling of the biceps brachii and vastus medialis but not the deltoid. Screening bloodwork revealed elevated free kappa (71.3 mg) and lambda (47.2 mg) light chains, which were attributed to occult chronic kidney disease (creatinine: 181 µmol/L). His N-terminal pro-brain-derived natriuretic peptide was also elevated at 1175 ng/L (N < 125). Given that reversible causes for polyneuropathy were not found, genetic testing was pursued, which revealed a pathogenic variant in the TTR gene (p.V50M, formerly V30M). After a biopsy of the left sural nerve confirmed the tissue deposition of amyloid, he was started on vutrisiran, a novel N-acetylgalactosamine-conjugated (liver-directed) small interfering ribonucleic acid drug.
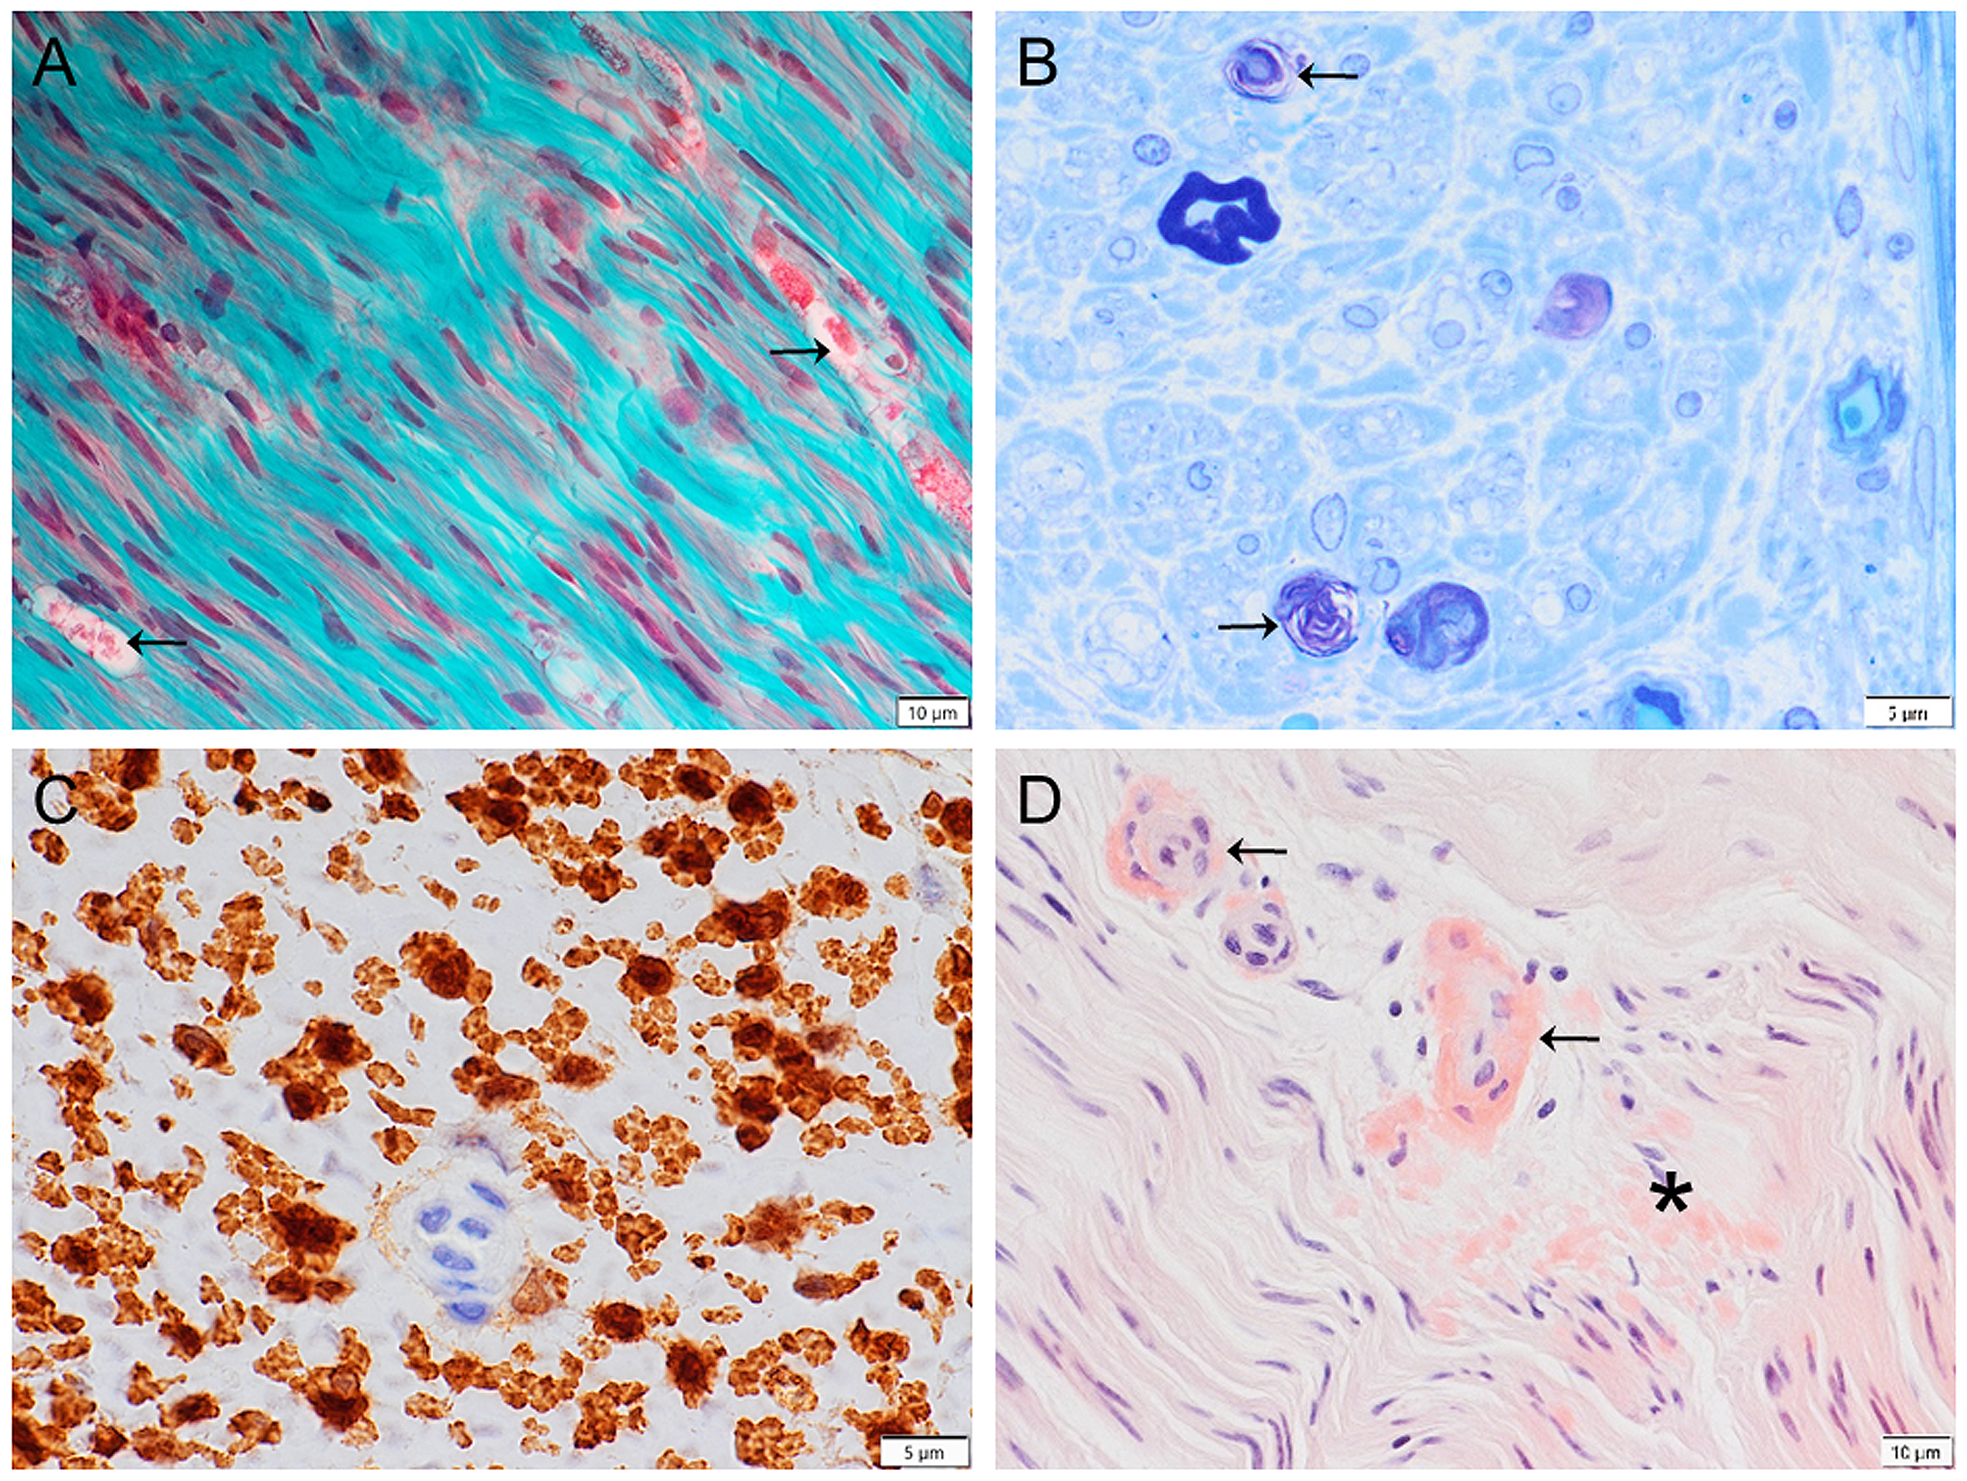
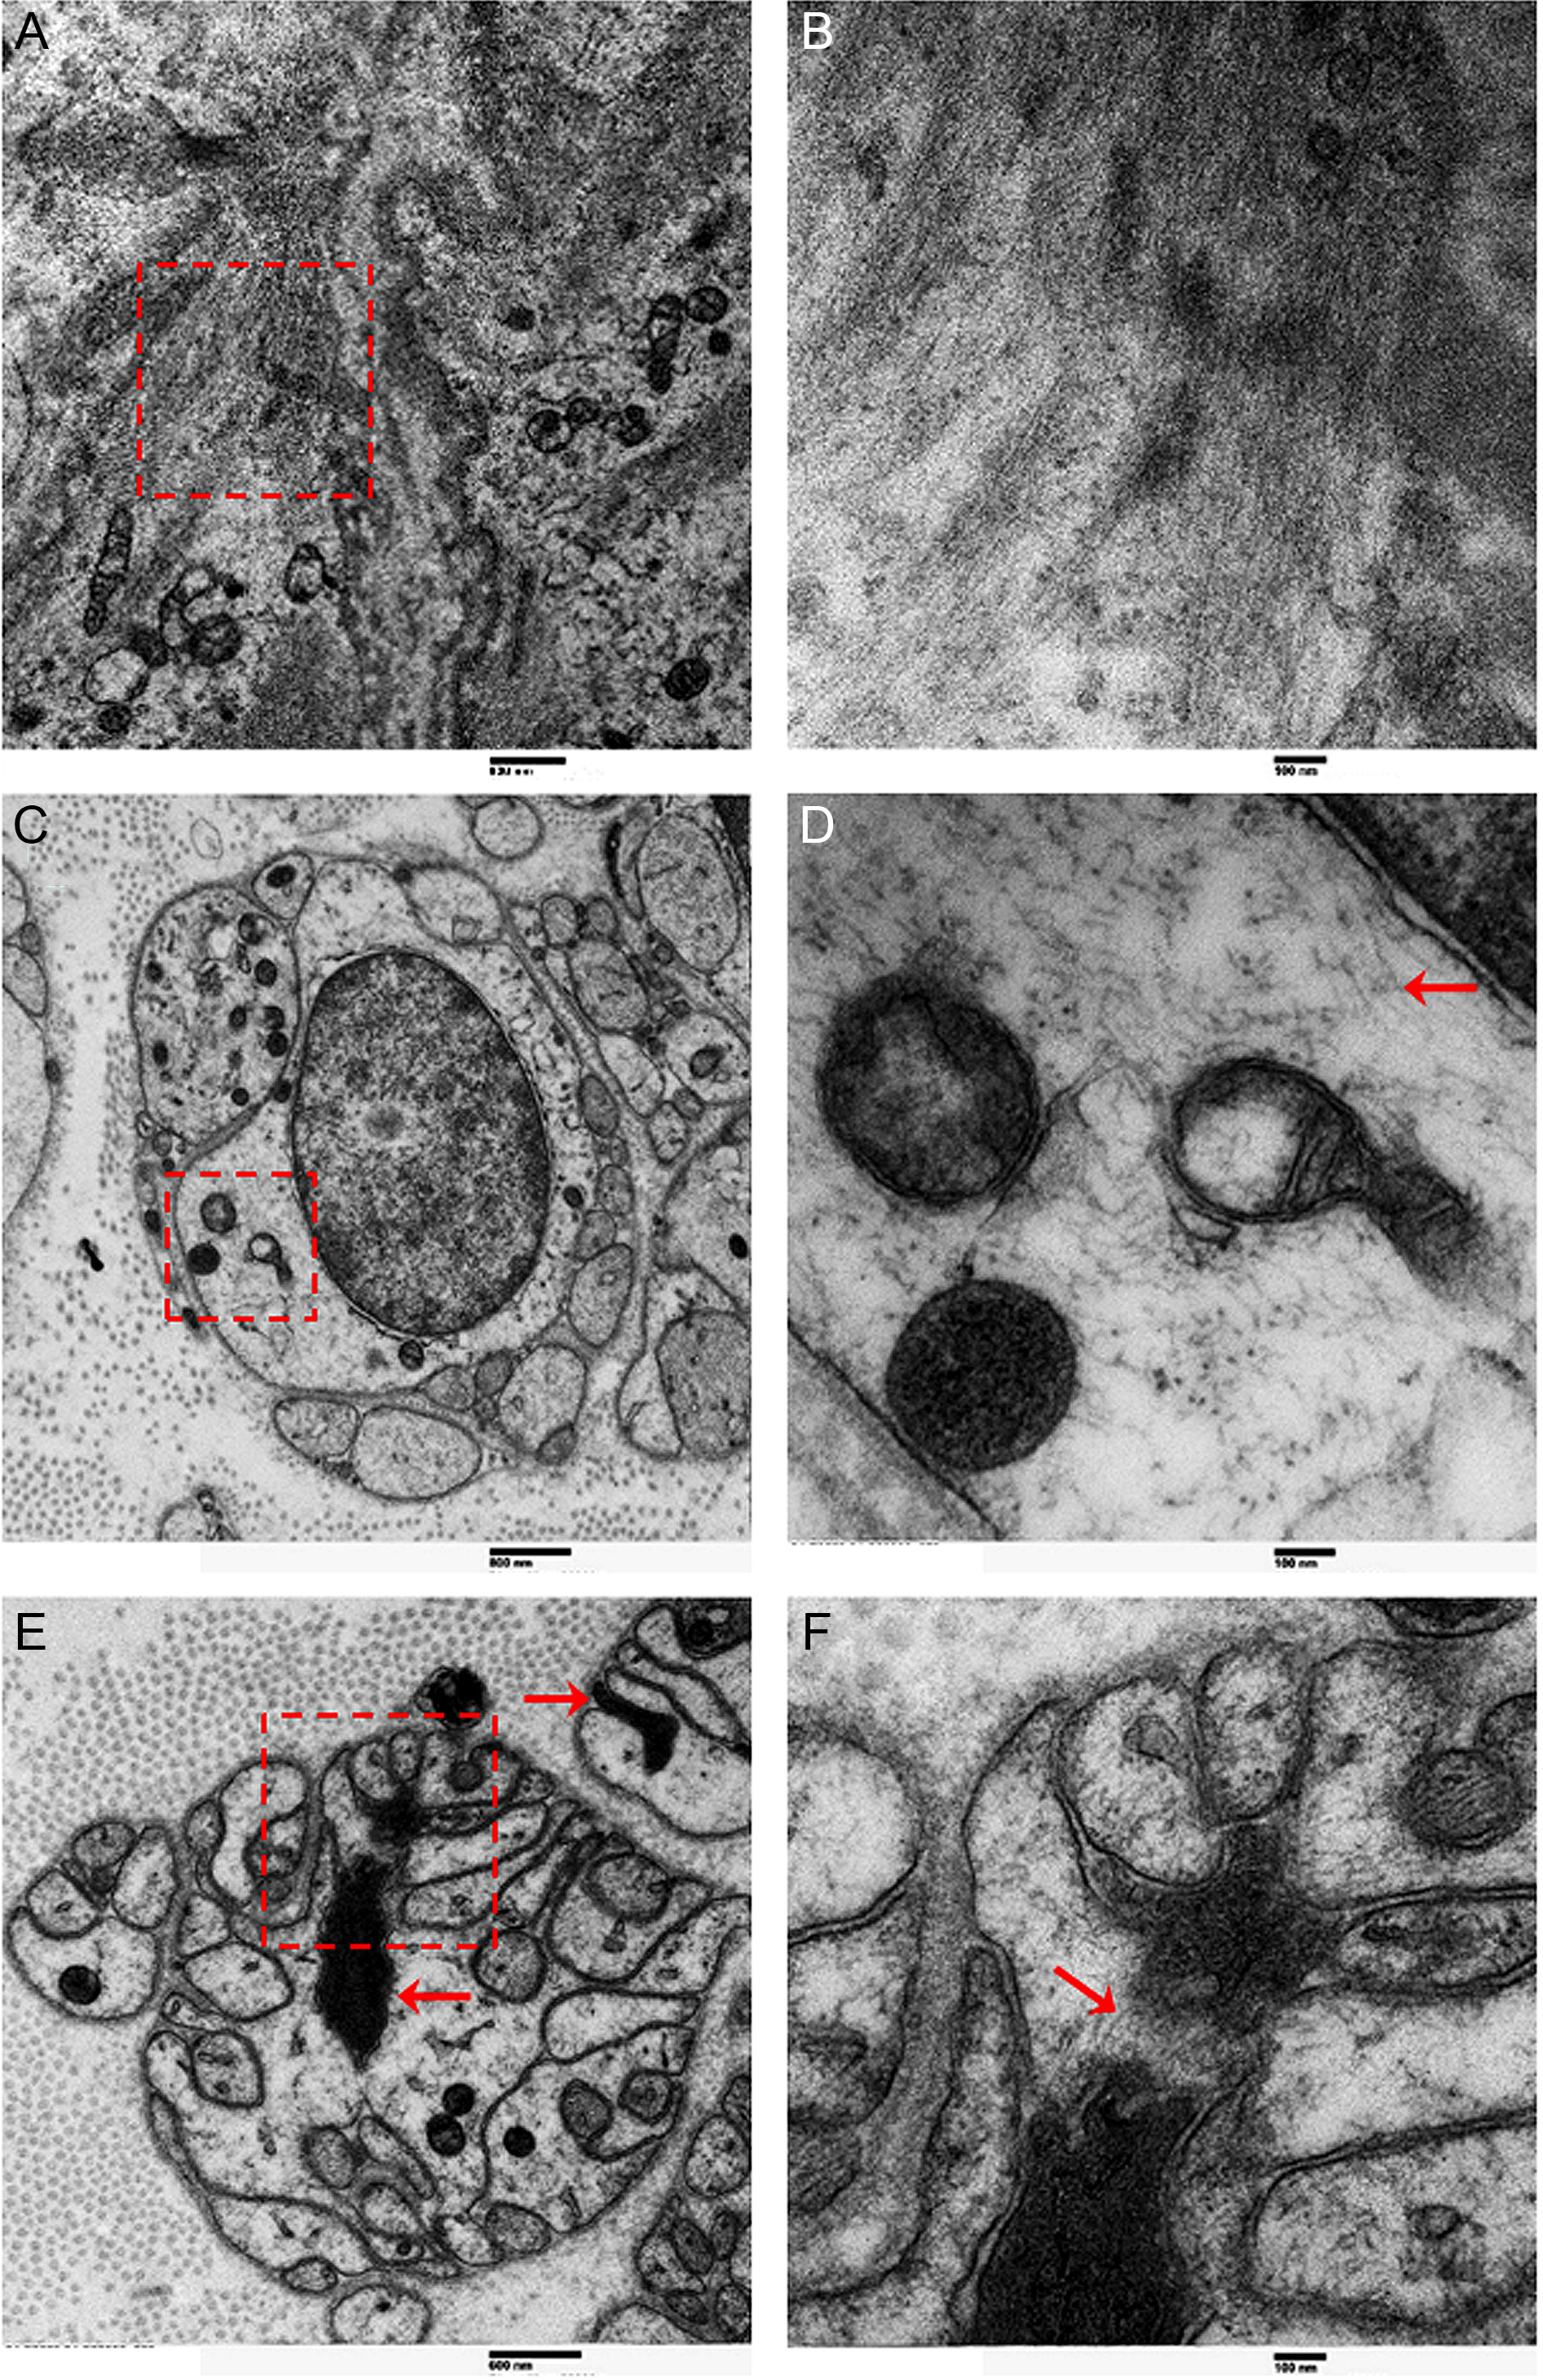
Microscopic examination of the sural nerve showed severe neuropathy with axonal degenerative changes, including severe loss of nerve fibers, particularly myelinated fibers (Figure 1A, 1B), myelin-digestion chambers containing debris (Figure 1A) and myelin ovoids (Figure 1B). There was less loss of unmyelinated fibers (compared with myelinated fibers) on a background of limited regenerative axonal sprouts (Figure 1B), which was highlighted by neurofilament protein immunostaining for axons. Myelin sheaths were decreased in parallel, but many SCs were preserved with complex cytoplasmic processes as demonstrated by S100 immunostaining (Figure 1C). A few endoneurial and perineurial small-sized blood vessels were focally thickened with amorphous materials. Congo red staining exhibited amyloid deposition in the endoneurial capillary walls and adjacent tissue (Figure 1D). Electron microscopy demonstrated amyloid fibrils (7–12 nm in diameter) within capillary endothelial cells (Figure 2A, 2B), along with some preserved cell organelles in the same cytoplasm/cell. Amyloid fibrils were also seen in the cytoplasm of SCs (Figure 2C, 2D) alongside dense inclusions with connecting fibrils (Figure 2E, 2F).
Sural nerve biopsy showing axonal degeneration with severe loss of nerve fibers, myelin-digestion chambers containing debris (A, Masson’s trichrome staining; arrows), myelin ovoids (B, toluidine blue staining; arrows), Schwann cell processes (C, S100 immunostaining) and amyloid deposition in the endoneurial capillary walls (D, Congo red staining; arrows) and adjacent tissue (D,*). Scale bars: 10 µm (A,D), 5 µm (B,C).
Electron microscopy revealing amyloid fibrils within capillary endothelial cells (A, along with some preserved cell organelles; B, □ in A) and Schwann cell cytoplasm (C; D, □ in C, arrow pointing to fibrils), with dense inclusions (E, arrows) and connecting fibrils (F, □ in E; arrow). Scale bars: 600 nm (A,E), 100 nm (B,D,F), 800 nm (C).
Our present case is the first to demonstrate SC intracellular amyloidosis with cytoplasmic inclusions. In amyloidosis, the deposition of amyloid fibrils is typically found in the extracellular matrix of multiple organs including nerves, but there is evidence of intracellular amyloid deposition in ATTRv and non-ATTRv disorders. Reference Buxbaum, Dispenzieri and Eisenberg7,Reference Otto, Hansen and Kriegsmann8 The intracellular deposition of amyloid fibrils has been seen in a few non-ATTR disorders such as neurodegenerative diseases Reference Buxbaum, Dispenzieri and Eisenberg7 and identified in cardiomyocytes of an ATTRv patient with ascending polyneuropathy for several years. Reference Otto, Hansen and Kriegsmann8 In the nerve biopsies from ATTRv patients, amyloid fibrils were found sometimes entangled and fused with the membranes of SCs and endoneurial capillaries. Reference Sobue, Nakao and Murakami5,Reference Sommer and Schröder6 These cell membranes were frequently destroyed and their membrane indentations contained amyloid fibrils. The formation of intracellular inclusions with amyloid fibrils is well noted in non-ATTRv amyloidosis, which is typically associated with the degenerative process. Reference Buxbaum, Dispenzieri and Eisenberg7 Our present ATTRv case demonstrates the intracellular deposition of amyloid fibrils in the capillary cells and SCs with dense inclusions that are connected and likely formed by amyloid fibrils (Figure 2).
In ATTRv polyneuropathy, the insult of amyloid fibrils causes axonal loss and SC damage resulting in SC atrophy as either a primary or secondary process. Reference Chompoopong, Mauermann, Siddiqi and Peltier2 It has been noted that axonal degeneration may be conspicuous in the distal portions of nerves, whereas segmental demyelination followed by remyelination could be observed in the proximal portions of nerves. Reference Hanyu, Ikeda, Nakadai, Yanagisawa and Powell4,Reference Sobue, Nakao and Murakami5 The lack of primary demyelination or remyelination in our present case is likely due to sampling of the distal/sural nerve that shows predominantly axonal degeneration with associated SC changes. The presence of intracellular amyloidosis and formation of cytoplasmic inclusions in SCs may result in the loss of SC functions particularly remyelination/regeneration of nerve fibers and advance axonal degeneration in ATTRv neuropathy. Moreover, the proposed pathogenic mechanisms also include amyloid vasculopathy that is usually characterized by altered vascular permeability of endoneurial/perineurial blood vessels and endoneurial edema. Reference Hanyu, Ikeda, Nakadai, Yanagisawa and Powell4 A study of 49 patients with ATTRv has found amyloid deposition resulting in the atrophy of SCs that were adjacent to amyloid fibrils, along with endoneurial vasculopathy with significant increases in the endothelial cell nuclei, endothelial cell profiles and occluded microvessels; these findings suggest that direct insult of amyloid fibrils causes SC damage, leading to the predominant loss of small-fiber axons, with vasculopathy contributing in the pathogenesis of neuropathy. Reference Koike, Ikeda and Takahashi3 While the pathogenesis of ATTRv warrants further investigation, our present case demonstrates intracellular amyloidosis with SC inclusions in association with axonal degeneration and contributes to the understanding of the pathogenic process of ATTRv in the peripheral nerve.
Acknowledgments
The authors thank the patient for consenting for publication.
Author contribution
JQL and SB contributed to the conception and design. JQL, GM and SB contributed to the manuscript writing. JQL, SG and SB contributed to the acquisition. All authors contributed to the interpretation of the data and revision of the manuscript.
Funding statement
There are no funders to report for this submission.
Competing interests
The authors report no disclosures relevant to the manuscript.


 Open access