

Growing epidemiological evidence indicates that chronic diseases are mostly related to modifiable environmental factors such as dietary and lifestyle habits rather than genetic background( Reference Anand, Kunnumakkara and Sundaram 1 , Reference Popkin 2 ). In particular, maintaining a healthy diet is an important part of disease prevention( Reference Anand, Kunnumakkara and Sundaram 1 – 6 ). In recent decades, considerable nutritional transition has occurred with rapid economic growth in Korea( Reference Lee, Duffey and Popkin 7 – Reference Lim, Kim and Wang 9 ), resulting in substantial variation in dietary habits according to generations and geographical regions( Reference Jung, Yoon and Cho 10 , Reference Choi, Lee and Lee 11 ). These shifts in dietary patterns have influenced disease distribution in the Korean population( Reference Lim, Kim and Wang 9 , Reference Ahn, Hong and Joung 12 ); hence, an accurate and appropriate dietary assessment tool specifically designed to capture dietary habits related to chronic disease and public health burden in Korea is indispensable.
Generally, the examination of long-term rather than short-term dietary exposure is more relevant to analyses of diet and chronic disease( Reference Willett 13 ). The FFQ is one of the most commonly used dietary assessment tools, especially in large-scale cohort studies( Reference Willett 13 ). It is often used to examine habitual dietary intake levels of participants over a 1-year period. However, possible measurement errors, mainly due to the fixed food lists, lack of memory or self-report issues, should be considered in the development of FFQ( Reference Willett 13 – Reference Araujo, Yokoo and Pereira 15 ). A well-designed FFQ can potentially dilute the limitations through memory aids (e.g. pictures to aid the estimation of portion size) and food lists specific to regional cultures( Reference Goulet, Nadeau and Lapointe 16 , Reference Zhang and Ho 17 ) besides representing the usual dietary intake of the study population. Nevertheless, the validation of a newly developed FFQ using various statistical tests is essential to assess the magnitude of measurement errors and bias – for example, it is important to know whether the FFQ show consistent results with repeated measurements (reproducibility) and how well they represent the usual intake (validity). Reproducibility and validity tests can confirm whether the results are obtained by chance and whether the method can be used to investigate the relationship between nutritional exposure and outcomes.
We developed an FFQ for assessing dietary intake levels of Korean adults participating in an ongoing cohort study called the Trace Element Study of Korean Adults in the Yeungnam area (SELEN). The purpose of our study was to assess the reproducibility and validity of the newly developed, self-administered, semi-quantitative FFQ used in both urban and rural areas in the Yeungnam region in South Korea.
Methods
Subjects
The SELEN study investigates the relationship of trace elements with metabolic health conditions in an ongoing prospective cohort of healthy, middle-aged, Korean adults residing in the Yeungnam area. In total, 740 subjects were recruited through advertisements. This study was approved by the Institutional Review Board of Yeungnam University Medical Centre (YUH-12-0468-O94), and all participants gave their written and informed consent to participate in the SELEN study.
The necessary sample size for a statistical power of 0·80 was calculated using G*Power (version 3.1.9.2). On the basis of the results from previous studies, the effect size using the point biserial correlation model as |ρ|=0·30 α=0·05 was entered( Reference Willett 13 , Reference Dyett, Rajaram and Haddad 18 – Reference Cade, Burley and Warm 20 ). As a result, the minimum sample size required was seventy with additional 10 % included for dropouts, calculated by G*power. Approximately 100 subjects from the cohort agreed to participate in the validation study, and of them seventy-two subjects gave their informed consent. Participants completed 3-d dietary records (DR) and two FFQ without missing any information. The first FFQ (FFQ1) was administered at baseline. For validation, we collected additional dietary information, including 3-d DR, 7 d before the second FFQ (FFQ2). The interval between FFQ1 and FFQ2 was on average 3 months.
FFQ development and administration
A 146-item, semi-quantitative FFQ was developed on the basis of the validated 106-item FFQ used in the Korean Genome Epidemiologic Study (KoGES)( Reference Ahn, Kwon and Shim 21 ) and a database of the most frequently consumed foods among adults residing in the Yeungnam area (24-h dietary recall data from Korea National Health and Nutrition Examination Survey (KNHANES) 2007–2010). The following ten frequency categories were used: almost never, less than once a month, once a month, two to three times per month, once per week, two to four times per week, five to six times per week, once a day, twice per day and ≤three times per day. The portion size of each food item was determined on the basis of the portion size in the KoGES FFQ, intake levels from KNHANES analysis and the standardised serving size suggested by the Ministry of Health and Welfare and the Korean Health Industry Development Institute( 22 ). The following answer categories were provided: medium (reference), small (0·5 times reference) and large (1·5 or 2 times of reference). For instance, milk intake could be 1/2 cup or less, one cup (200 ml) and two cups or more, and almond intake could be five pieces or less, ten pieces or twenty pieces or more. Furthermore, we took food photographs with household volume measures or weight to assist in estimating the portion size and reduce bias in reporting related to the amount of food consumed.
Supplement use was assessed separately according to the type, dose, duration and brand. To help administer the questionnaire, a short video clip was posted on the study website. It showed how the FFQ should be checked, what it means and things that should be considered. Finally, the FFQ was cross-checked by nutrition and epidemiology experts to determine the completeness and usability of the food lists, and a pilot study was performed three times with seventeen subjects. The format of the questionnaire was revised and refined according to feedback comments.
All completed FFQ were returned by mail and cross-checked by three trained nutritionists. The respondents were asked to clarify omitted or implausible answers by telephone if necessary.
3-d Dietary records
The participants were requested to make a thorough list of all the food and dish names, recipes and approximate amounts of ingredients in the food consumed on 3 d (including 2 weekdays and 1 weekend day). Further, detailed instructions with photographs of serving size or standard portion size aided in visualising the portion size, completing the DR and measuring with household utensils (cup, spoon, bowl, etc.) or by eye (ping-pong ball size, palm size, handfuls, etc.).
Collected DR were carefully checked by trained nutritionists, and insufficient information was calibrated using a standardised recipe( 22 ) and a telephone interview with participants. The estimates were converted to weight using a published database( 22 ). Nutrient estimates from FFQ and DR data were calculated using CAN-Pro 4.0 (Computer-Aided Nutritional analysis program for Professional 4.0; The Korean Nutrition Society 2011) with the aid of food composition databases of the Korean Nutrition Society (2009) and Korea National Academy of Agricultural Sciences (2006).
Statistical analyses
Mean nutrient intakes as estimated by FFQ1 v. FFQ2 and FFQ2 v. DR were compared using a paired t test. Normal distribution of the data was checked using the Shapiro–Wilk test, and skewed data were transformed logarithmically when required. Pearson’s correlation coefficients and Spearman’s correlation coefficients were calculated for normally distributed and non-parametric data, respectively. In addition, the coefficients were adjusted for age, sex and energy when required. Residuals from regression where total energy intake was the independent variable and absolute nutrient intake was the dependent variable were used for energy adjustment of nutrient intakes( Reference Willett 13 ).
For FFQ validation, 3-d DR were used as reference. As this took several days, the day-to-day variation, that is, within-person variation, might have attenuated the correlation between the FFQ and the DR, and the coefficients were corrected for within-person variation( Reference Willett 13 ). The ratio of within-person variance:between-person variance was calculated using the minimum variance quadratic unbiased estimation method with the variance component procedure. Nutrient intake was the dependent variable, and the number of DR repeats was the independent variable.
 $$r_{t} {\equals}r_{o} \sqrt {1{\plus}\lambda _{x} \,/\,n_{x} } ,$$
r
t
is the true intake, r
o
the observational intake, λ
x
the ratio of within-person variance:between-person variance
 $$(S_{w} ^{2} \,/\,S_{b} ^{2} )$$
, n
x
the number of repeated days.
$$(S_{w} ^{2} \,/\,S_{b} ^{2} )$$
, n
x
the number of repeated days.
Agreements between the two FFQ and/or FFQ2 and DR were analysed using the mean difference (%), limits of agreement (LOA), the Bland–Altman index (%) and cross-classification (%) with weighted κ values. To improve the normal distribution, the values were log-transformed. The mean difference between two methods was calculated, anti-logged and multiplied by 100. These values (%) indicate mean agreement or bias; 100 % indicates exact agreement( Reference Villegas, Yang and Liu 23 ).
To measure the agreement between the two methods on the same subjects, the Bland–Altman method was used. For this, the difference between the two methods $(\bar{d})$
– that is, FFQ1 and FFQ2 and FFQ2 and DR – and its standard deviation as well as the average of the two methods – that is, (FFQ1+FFQ2)/2 and (FFQ2+DR)/2 – were calculated for the same subjects. If the differences are normally distributed, 95 % of the difference would be expected to lie between
$(\bar{d})$
– that is, FFQ1 and FFQ2 and FFQ2 and DR – and its standard deviation as well as the average of the two methods – that is, (FFQ1+FFQ2)/2 and (FFQ2+DR)/2 – were calculated for the same subjects. If the differences are normally distributed, 95 % of the difference would be expected to lie between $\bar{d}\,{\minus}1\! \cdot \!96{\times}$
SD and
$\bar{d}\,{\minus}1\! \cdot \!96{\times}$
SD and $\bar{d}{\plus}1\! \cdot \!96{\times}$
SD – that is, within 95 % LOA. A Bland–Altman index <5 % means that 95 % of the nutrient intake falls within the LOA. This indicates a good agreement between the two methods(
Reference Bland and Altman
24
).
$\bar{d}{\plus}1\! \cdot \!96{\times}$
SD – that is, within 95 % LOA. A Bland–Altman index <5 % means that 95 % of the nutrient intake falls within the LOA. This indicates a good agreement between the two methods(
Reference Bland and Altman
24
).
During cross-classification, subjects were classified into quartiles by nutrient intake level from the two dietary methods as follows: same quartile, adjacent quartile, one quartile apart and opposite quartile( Reference Johansson, Hallmans and Wikman 25 ). The κ coefficient measures the difference between the observed and expected agreement and can range from −1 to 1. Accordingly, the agreement is classified as follows: κ w <0·00 for poor, κ w =0·00–0·20 for slight, κ w =0·21–0·40 for fair, κ w =0·41–0·60 for moderate, κ w =0·61–0·80 for substantial and κ w =0·81–1·00 for almost perfect agreement( Reference Landis and Koch 26 ).
All data were calculated and analysed using Statistical Analysis System (SAS version 9.4; SAS Institute).
Results
A total of seventy-two subjects from the SELEN cohort study were included in this validation study. Of these, eight subjects were excluded because of incomplete DR or missing FFQ1. In total, sixty-five subjects (seventeen men and forty-eight women) aged 38–62 years were included in the analysis. The general characteristics of the study population are described in Table 1. The mean age of the participants was 46 years, and a third of the participants were educated beyond the college level. Approximately 86 and 18 % of the participants were current non-smokers and non-alcohol drinkers, respectively.
General characteristics of the study population (Numbers and percentages; mean values and standard deviations)
* BMI classification for the Asia-Pacific population by the WHO.
Reproducibility
The correlation coefficients for macronutrients and micronutrients in FFQ1 and FFQ2 showed good reproducibility (Table 2). There were no significant differences in the intake levels of all selected nutrients estimated in both FFQ. The correlation coefficients for crude energy and nutrients ranged from 0·32 for carbohydrates to 0·57 for β-carotene. The correlation coefficients for fourteen of twenty nutrients were 0·40 and higher; the correlation coefficients for fat, retinol, β-carotene, vitamin E and Mg intakes were 0·50 and higher. After energy adjustment, the correlation coefficients for macronutrients attenuated, but very marginally. Additional age- and sex-adjusted correlation coefficients for most nutrient intakes ranged from 0·24 for thiamine to 0·61 for niacin, indicating stronger correlations compared with crude coefficients; the correlation coefficient for niacin increased by 0·17 after age, sex and energy adjustment.
Comparison of energy and nutrient intakes by the first and second administration of the FFQ (FFQ1 v. FFQ2) (Mean values and standard deviations)
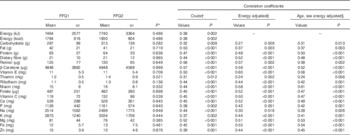
* Paired t test.
† Log-transformed values.
‡ Energy adjustment using residual methods.
§ Energy adjustment using residual methods and age and sex adjustment using partial correlation.
FFQ1 showed reasonably good agreement in the ranking of participants for most nutrients compared with FFQ2 based on the findings from the Bland–Altman method and cross-classification into same and extreme quartiles (Table 3). The mean agreement between FFQ1 and FFQ2 ranged from 95 % (β-carotene) to 111 % (vitamin C), but no significant differences between the two FFQ were observed. For most nutrients, the Bland–Altman index fell <5 % and ranged from 3·1 % (riboflavin, Ca, Zn) to 9·0 % (Na).
Agreement between the two FFQ (FFQ1 and FFQ2) (Geometric means of differences in two methods and 95 % confidence intervals; 95 % limits of agreement)
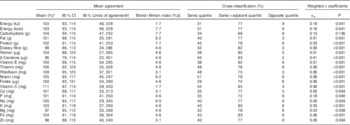
* Geometric means of differences in energy and nutrient intakes (log-transformed values) estimated by FFQ1 and FFQ2 were multiplied by 100 after anti-logging.
† Mean difference±1·96×sd of the differences.
‡ Percentage of subjects with values out of limits of agreement.
In cross-classification, the proportion of subjects classified into the same lowest and highest quartiles ranged from 29 % for folate to 51 % for niacin, and the agreement proportions for twelve of twenty nutrients were 40 % and higher. More than 70 % of the subjects were classified in the same or adjacent quartile for all nutrients except carbohydrates. For instance, >80 % were classified in the same or adjacent quartile for dietary fibre, retinol, β-carotene, vitamin E, vitamin C, K and Fe intakes. The proportion of participants classified into extreme quartiles (disagreement) ranged from 2 % for β-carotene to 9 % for energy, carbohydrate, P, Na and Zn. The weighted κ coefficients for most nutrient intakes were from 0·18 for energy and P to 0·41 for β-carotene.
Validity
Table 4 shows the mean levels of nutrients estimated by FFQ2 and the 3-d DR. The mean intake levels for fat, protein, vitamin E, Na and Fe as estimated from the DR were significantly higher than those estimated from FFQ2. The correlation coefficients for crude energy and nutrient intakes ranged from 0·12 for vitamin E to 0·51 for protein. The correlation coefficients for eleven of twenty nutrients were 0·40 and higher. Energy adjustment resulted in a stronger correlation for the majority of nutrients; in particular, the correlation coefficients for vitamin E, folate, Ca and Mg increased from 0·12–0·23 (crude) to 0·51–0·57 (energy adjusted). Among the energy-producing nutrients, the correlation coefficients of fat and carbohydrate were higher after additional energy adjustment.
Comparison of energy and nutrient intakes by 3-d dietary records (DR) and FFQ2
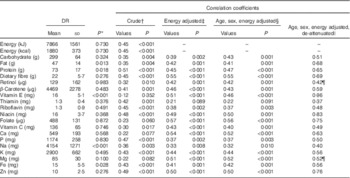
* Paired t test.
† Log-transformed values.
‡ Energy adjustment using residual methods.
§ Energy adjustment using residual methods and age and sex adjustment using partial correlation.
|| Age, sex and energy adjustment multiplied with the de-attenuated factor using variance of component.
¶ Without multiplying the de-attenuated factor because the coefficients were more than 1.
In addition to the adjustment for age, sex and energy intake, the correlation coefficients were multiplied by the de-attenuation factor, taking into account within- and between-person variances in the 3-d DR. The within-person variance was higher than the between-person variance. The magnitude of the variance ratio varied considerably with nutrients and ranged from 1·21 for energy intake to 400·10 for retinol in our study; a ratio <2 was observed with energy, carbohydrates, Ca, vitamin C, Na, dietary fibre and K, and a ratio >10 was observed with vitamin E, Mg and retinol. After additional adjustment with the de-attenuation factor, the correlation coefficients for most nutrients increased. However, the de-attenuated values did not apply when the ratio of within-person variance:between-person variance was too high and the coefficients were >1 – for example, retinol and Mg.
The agreement between FFQ2 and DR is presented in Table 5. The mean agreement between FFQ2 and DR ranged from 53 % for Na to 112 % for retinol. Half of the nutrient intakes estimated from the DR were significantly overestimated (fat, protein, dietary fibre, vitamin E, riboflavin, niacin, Na, Mg, Fe and Zn). The range of LOA for FFQ2 and DR was narrower than that for FFQ1 and FFQ2. Compared with the nutrient intake levels estimated from DR, half of the nutrient intakes estimated from FFQ2 were significantly underestimated; nine of twenty nutrient and energy intakes had Bland–Altman indices that fell <5 % and ranged from 3·1 % for Na to 7·7 % for energy, carbohydrate and folate. To further assess agreement, subjects were classified into quartiles according to the nutrient levels estimated by both methods. The proportion of subjects classified into the same lowest and highest quartiles ranged from 43 % for dietary fibre and thiamine to 25 % for vitamin C. More than 70 % of the subjects were classified in the same or the adjacent quartile for almost all nutrients. The proportion of participants classified into opposite quartiles varied from 2 % for energy and dietary fibre to 9 % for retinol, vitamin E and vitamin C. The weighted κ coefficients ranged from 0·03 for vitamin E to 0·36 for dietary fibre and riboflavin.
Agreements between 3-d dietary records and FFQ2 (Geometric means of differences in two methods and 95 % confidence intervals; 95 % limits of agreement)

* Geometric means of difference in energy and nutrient intakes (log-transformed values) estimated by FFQ1 and FFQ2 were multiplied by 100 after anti-logging.
† Mean difference±1·96×sd of the differences.
‡ Percentage of subject with values out of limits of agreement.
Discussion
We assessed the reproducibility and validity of a self-administered, semi-quantitative FFQ with 146 items newly developed for the SELEN cohort study. Using various statistical approaches including the paired t test, adjusted and de-attenuated correlation coefficients, and agreement tests using cross-classification and the Bland–Altman method( Reference Serra-Majem, Frost Andersen and Henrique-Sanchez 27 ), we found that an FFQ had acceptable reproducibility (range, 0·3–0·6) and validity (range, 0·2–0·6) for most macronutrients and micronutrients, and fairly high agreements between FFQ1 and FFQ2 as well as FFQ and DR where 78 % of subjects on average were correctly classified in the same or adjacent quartiles for most nutrients were found.
Generally, lower validity and reliability have been observed for the FFQ in the Korean population because of unique traditional dietary habits( Reference Willett 13 , Reference Wakai 19 , Reference Ahn, Kwon and Shim 21 , Reference Villegas, Yang and Liu 23 , Reference Johansson, Hallmans and Wikman 25 , Reference Molag, de Vries and Ocke 28 – Reference Park, Noh and Song 33 ). Typically, Koreans have three meals a day consisting mainly of rice with some grains and legumes, soup or stew and various side dishes. The majority of Koreans do not use weighing and/or measuring utensils while cooking, and meals are served in family portions with multiple people sharing the side dishes. Thus, it is difficult to obtain an accurate portion size for an individual diet. In addition, frequently eating out makes it more difficult to recall the frequency of consumption of a specific food item, particularly in the case of an unknown recipe. Nonetheless, our SELEN FFQ showed a higher validity and reliability compared with other validation studies conducted in the Korean population( Reference Ahn, Kwon and Shim 21 , Reference Bae, Choi and Sung 31 , Reference Park, Noh and Song 33 – Reference Kim, Kim and Ahn 36 ). We observed that the mean values of the macronutrient intakes were comparable with those of other Korean studies (range, energy intake 7213–8180 kJ (1724–1955 kcal), protein 63–79 g, fat 29–49 g, carbohydrate 279–335 g), especially with a similar range for age and sex( Reference Ahn, Kwon and Shim 21 , Reference Park, Noh and Song 33 – Reference Kim, Park and Kim 37 ).
Ratios of within-person variance:between-person variance can vary considerably between nutrients. For example, internal organs of cattle, pigs or chickens are occasionally used in Korean cuisine. Among them, the liver is a major source of retinol. Similarly, certain types of eels are also high in retinol (range, 360 μg for conger eel to 7808 μg for lamprey)( 38 ). However, such foods are not frequently consumed, thus consumption (rarely consumed but high in a particular nutrient) on dietary recording days may led to a poor correlation between dietary assessment methods( Reference Ambrosini, van Roosbroeck and Mackerras 39 ). The SELEN FFQ consists of 146 items and considers this problem; thus, the correlation coefficient between FFQ and DR for retinol (r 0·42) was relatively higher than in other validation studies conducted in the Korean population( Reference Ahn, Kwon and Shim 21 , Reference Kim, Song and Lee 30 , Reference Bae, Choi and Sung 31 ).
In this study, the agreements between the two FFQ or between the FFQ and the DR for energy and carbohydrate intakes were lower than that for other macronutrients and micronutrients. This finding is due to a few outliers and cultural dietary habits in which the intakes of energy and carbohydrates are highly dependent on rice – the staple food of the Korean population. Most participants responded that they consumed a bowl of white rice (with or without other grains and legumes) two or three times a day, and, between FFQ1 and FFQ2, only a few participants answered the frequency of rice-item consumption differently. Nevertheless, the results are comparable with those of other Korean studies( Reference Ahn, Kwon and Shim 21 , Reference Bae, Choi and Sung 31 , Reference Park, Noh and Song 33 , Reference Yang, Kim and Hwang 40 ).
Although correlation coefficients indicate the strength of the linear relationship between the two methods, they do not provide accurate information regarding agreement levels between the methods( Reference Bland and Altman 24 ). Therefore, previous validation studies have often used the Bland–Altman method or κ statistics to assess the agreement between two methods rather than linear regression or correlation alone( Reference Cade, Burley and Warm 20 , Reference Bland and Altman 24 ). In the Bland–Altman method, the standard deviation of the difference between the two methods is used, because it is less affected by between-person variance( Reference Serra-Majem, Frost Andersen and Henrique-Sanchez 27 ). The proportion of agreement for the quartile distribution of energy and nutrient intakes and κ coefficients estimated in this study was fairly acceptable and relatively higher than in other validation studies conducted in the Korean population( Reference Ahn, Kwon and Shim 21 , Reference Kim, Song and Lee 30 , Reference Bae, Choi and Sung 31 , Reference Ahn, Lee and Cho 35 , Reference Pakseresht and Sharma 41 – Reference Palacios, Trak and Betancourt 43 ).
A recent systemic review suggested that sex is an important factor influencing portion size, and estimates of nutrient intakes are more often overestimated in women than in men in validation studies( Reference Lee, Kang and Song 44 ). To take into account this difference, as well as individual differences in portion size, we included the following answer categories in the SELEN FFQ: medium (reference), small (0·5 times reference) and large (1·5 or 2 times reference). These categories regarding portion size may reduce the more frequent and significant overestimation of nutrient intakes in women observed in other validation studies.
This is the first FFQ that has been carefully designed for middle-aged adults residing in the Yeungnam area where fish and seafood consumption levels are higher and a unique food culture exists. For example, consumption levels of shark and whale meat are higher than in other areas( Reference Cho, Jacobs and Park 45 ). Considering the rapid shifts in dietary habits and substantial variation in dietary patterns according to generations and geographical regions in Korea, it is very important to build a validated dietary assessment tool suitable for the Korean population. Therefore, we analysed the dietary information of Yeungnam residents and included their main unique food items for a similar range of age groups, using data from the KNHANES, a national representative cross-sectional survey.
Our study has several limitations. First, the present study used a 3-d DR from a relatively small sample. The range of the LOA was wider than in other Korean studies with larger sample sizes( Reference Ahn, Kwon and Shim 21 , Reference Kim, Song and Lee 30 ), and 3 d may not be sufficient to capture usual dietary intakes. Nonetheless, the mean difference by two methods showed moderate-to-good agreement, and sample size calculation showed adequate power to detect statistical significance. Second, the current study examined the reproducibility of the FFQ for a 3-month interval (on average), which may be a limitation, as a FFQ captures dietary information over the previous year. However, seasonal variations or changes in dietary habits and health status may influence the reproducibility of the FFQ, with a 1-year interval or more( Reference Imaeda, Fujiwara and Tokudome 46 ). Considering the seasonal pattern of variation of fruit and vegetable consumption observed in Korea, examining reproducibility of the FFQ over a long-term interval (>6 months) may not be ideal for this population. In addition, a much shorter-term interval (<1 month) is also not recommended, because it affects accurate recall( Reference Maruyama, Kokubo and Yamanaka 47 ). Finally, the FFQ and food records were self-administered by participants; thus, issues with clarity and low-response rates are possible as opposed to other methods such as interviews or researcher-administered questionnaires( Reference Bowling 48 ). However, the majority of our participants were well educated, and the SELEN FFQ was revised and updated using repeated pilot studies. Therefore, over time, it probably became clearer and more comprehensible for the study participants. In addition, we provided photographs of the reference portion size with a scale mark and a pen with the questionnaire to get a more accurate estimate of the amount of food consumed. Furthermore, to compensate for the limitations of a self-administered FFQ, we conducted additional telephone interviews when the returned questionnaires had missing values or ambiguous answers.
A new FFQ, developed for the SELEN cohort, was tested for its validity and reproducibility using various statistical analyses. Overall, the results revealed that the FFQ had good-to-acceptable validity and reproducibility. Therefore, this FFQ is a suitable dietary assessment method for the SELEN cohort study.
Acknowledgements
The authors thank Ms Sle Koo, Ms Hyo-Jin Kim, Ms Sukyung Cho, and Ms Eunmin Seo for their technical contribution to the SELEN study.
This research was supported by Basic Science Research Programme through the National Research Foundation of Korea (NRF) funded by the Ministry of Science, ICT & Future Planning (NRF-2014R1A1A3049866).
Y. L. conducted the analysis, wrote the draft of the manuscript and had primary responsibility for the final content. K. P. reviewed and edited the manuscript, contributed to the discussion and supervised all stages of the study.
None of the authors have financial or personal conflicts of interest.


