


Highlights
-
• We assess the validity and reliability of different language exposure estimates.
-
• We employ the Experience Sampling Method to yield the most detailed estimates.
-
• Exposure estimates at varying levels of detail are highly correlated.
-
• There are no large differences in how well the estimates correlate with vocabulary scores.
-
• The simplest estimates may be sufficiently reliable as a measure of language exposure.
1. Introduction
The amount of relative language exposure multilingual children of (pre)school age receive to each of their languages has been found to be a robust predictor of many aspects of language development, in particular, the acquisition of vocabulary (e.g. Bohman et al., Reference Bohman, Bedore, Peña, Mendez-Perez and Gillam2010; De Cat, Reference De Cat2020; Hammer et al., Reference Hammer, Komaroff, Rodriguez, Lopez, Scarpino and Goldstein2012; Hoff et al., Reference Hoff, Core, Place, Rumiche, Señor and Parra2012; Thordardottir, Reference Thordardottir2011; for overviews, see Paradis, Reference Paradis2017; Unsworth, Reference Unsworth, Nicoladis and Montanari2016). As such, relative language exposure is an important variable to measure in research on multilingual language acquisition, as well as for clinicians, teachers and other professionals working with multilingual children. Estimates of multilingual children’s language exposure are most often obtained through parental report, but there is considerable variation across surveys in how exactly language exposure is assessed and quantified (Kašćelan et al., Reference Kašćelan, Prévost, Serratrice, Tuller, Unsworth and De Cat2022; Unsworth, Reference Unsworth, Schmid and Köpke2019). One source of variation is the amount of information or detail that parents are asked to provide about the child’s language environment, the idea being that a higher level of detail leads to more accurate and more reliable estimates. In the current study, we test this assumption by assessing the reliability and validity of language exposure estimates derived from surveys that vary in level of detail (i.e. with more or fewer questions), and we examine a number of factors that may contribute to discrepancies between these estimates.
One of the least detailed estimates used in earlier research are so-called global estimates, derived from asking a single question such as “Think about a typical week in the current year. At home, how often do people use each language when speaking to the child?” (e.g. De Cat et al., Reference De Cat, Kašćelan, Prévost, Serratrice, Tuller and Unsworth2022; Hoff et al., Reference Hoff, Core, Place, Rumiche, Señor and Parra2012; Lauro et al., Reference Lauro, Core and Hoff2020). On the other end of the continuum are diary-based estimates, for which parents are asked to log multiple times per day who interacted with their child and in which language(s) (e.g. Carbajal & Peperkamp, Reference Carbajal and Peperkamp2020; De Houwer, Reference De Houwer2011; Place & Hoff, Reference Place and Hoff2011). In between these two extremes are many different possible estimates, such as the average of global estimates per context (e.g. home, school and extracurricular activities) or across all the people the child regularly interacts with (e.g. De Cat et al., Reference De Cat, Kašćelan, Prévost, Serratrice, Tuller and Unsworth2022; Unsworth, Reference Unsworth2013). This latter estimate can then also be weighted by how much time the child spends with each person during a typical week. One reason why global estimates may be less reliable than diary-based estimates is that they rely more strongly on parents’ memory and numeracy skills. That is, regardless of whether parents have to provide estimates globally or by context or speaker, they are always implicitly or explicitly asked to estimate an average across a longer period of time (e.g. a typical week in the current year; De Cat et al., Reference De Cat, Gusnanto, Kašćelan, Prévost, Serratrice, Tuller and Unsworth2025). In addition, they either have to estimate this average across different contexts (when providing language estimates per speaker) or speakers (when providing language estimates per context). This is a complex cognitive task that may become increasingly difficult as more languages are spoken per context, if speakers frequently mix languages when talking to the child, or when there is high variability in how much people use each language across different contexts. Studies using day-long audio recordings have, for example, shown that multilingual children’s language exposure varies as a function of which caregivers are present, the talkativeness of the child’s caregivers, and whether or not overheard speech is considered in addition to child-directed speech (Marchman et al., Reference Marchman, Martínez, Hurtado, Grüter and Fernald2017; Orena et al., Reference Orena, Byers-Heinlein and Polka2020). In addition, rates of language mixing vary considerably across families and contexts (e.g. Bail et al., Reference Bail, Morini and Newman2015; Verhoeven et al., Reference Verhoeven, van Witteloostuijn, Oudgenoeg-Paz and Blom2025; Zentella, Reference Zentella1998). This type of variability may make it difficult to estimate children’s overall language exposure across different contexts or speakers. This issue is mitigated in language diaries, as these do not require estimating an average across different contexts or over an extended period of time. Rather, diary entries only concern the previous time slot on that same day, which may span as little as 30 minutes.
Another reason why diary-based estimates could be more reliable is because they may be less susceptible to bias. Parental estimates of their child’s language exposure may be colored by language attitudes, social desirability or the intended family language strategy (Byers-Heinlein et al., Reference Byers-Heinlein, Schott, Gonzalez-Barrero, Brouillard, Dubé, Jardak, Laoun-Rubenstein, Mastroberardino, Morin-Lessard, Pour Iliaei, Salama-Siroishka and Tamayo2020), as well as cognitive biases such as the tendency to overestimate the frequency of infrequent events (Tourangeau et al., Reference Tourangeau, Rips and Rasinski2000). For example, Byers-Heinlein et al. (Reference Byers-Heinlein, Schott, Gonzalez-Barrero, Brouillard, Dubé, Jardak, Laoun-Rubenstein, Mastroberardino, Morin-Lessard, Pour Iliaei, Salama-Siroishka and Tamayo2020) report that parents of bilingual children in Montreal sometimes provide more balanced exposure estimates to highlight their child’s bilingualism, as bilingualism is seen as highly desirable in the Canadian context. Previous studies have furthermore found that parents sometimes report to never mix languages or to strictly adhere to the “one parent, one language” principle when this is not actually the case (Bail et al., Reference Bail, Morini and Newman2015; Goodz, Reference Goodz1989) and to overestimate how much they talk to their child (Richards et al., Reference Richards, Gilkerson, Xu and Topping2017). These findings point to reporting biases that may stem from social desirability or parents’ beliefs about how best to raise bilingual children. Although diary-based estimates may not eliminate these biases completely, their influence may be smaller when parents are asked about short time periods that have just occurred.
Despite the potential of providing more reliable estimates, language diaries come with the significant drawback of increased effort on the part of both participants and researchers. Participants have to commit to taking part in the study over an extended period of time (i.e. multiple days or even weeks) and are typically required to complete an entry every half hour (Carbajal & Peperkamp, Reference Carbajal and Peperkamp2020; De Houwer, Reference De Houwer2011; Place & Hoff, Reference Place and Hoff2011). The additional effort and commitment required from participants may result in smaller sample sizes, both because fewer people might be willing to participate and because of potentially higher drop-out rates. This would also increase the effort required by researchers, as they then have to recruit more participants to compensate for the higher drop-out rates and make an effort to keep participants engaged. In addition, the people that are willing to participate may be more likely to be highly educated and highly motivated, which may lead to a participant sample that is even more unrepresentative of the population than is already typically the case (Fernald, Reference Fernald2010; Singh et al., Reference Singh, Cristia, Karasik, Rajendra and Oakes2023).
Only recently have studies started to investigate whether surveys on multilingual children’s language exposure can be shortened without losing (much) explanatory power (De Cat et al., Reference De Cat, Gusnanto, Kašćelan, Prévost, Serratrice, Tuller and Unsworth2025; see also Calandruccio et al., Reference Calandruccio, Beninate, Oleson, Miller, Leibold, Buss and Rodriguez2021). De Cat et al. (Reference De Cat, Gusnanto, Kašćelan, Prévost, Serratrice, Tuller and Unsworth2025) administered the Q-BEx to 121 parents of 5- to 9-year-old bilingual and trilingual children in France, the Netherlands and the United Kingdom. This questionnaire yields many different language exposure estimates, including (i) global estimates (“At home, how often do people use each language when speaking to the child?”), (ii) the average of estimates per speaker (“At home, how often does [name person] use each language when speaking to the child?”), (iii) the average of estimates per speaker, weighted for how many hours the child spends with each speaker during a typical week, and (iv) cumulative exposure, computed as the average of global estimates (see [i]) provided for each period of the child’s life where relevant changes occurred to their language input (e.g. due to starting daycare or school, moving to a different country, or a new caregiver in the home). The authors used a model selection and cross-validation approach to identify the exposure estimates that best predicted children’s vocabulary and morphosyntactic knowledge in the societal language and parental ratings of the child’s oral proficiency in the heritage language. The results showed that the best model fit and lowest prediction error were achieved by cumulative exposure for the societal language and by current exposure in the home (i.e. the unweighted average of estimates per speaker) for the heritage language. Interestingly, these estimates were not the most detailed ones: cumulative exposure averages multiple global estimates without distinguishing between speakers, while current exposure in the home does not account for differences in time spent with each speaker. The authors therefore conclude that greater survey detail does not necessarily yield more reliable predictors of language outcomes and that global estimates per context and per language period seem to be most effective in terms of balancing costs and benefits, at least in the populations they studied.
The idea that more detailed surveys may not necessarily yield more reliable estimates is also supported by studies that have reported strong correlations between one-time survey and diary-based estimates. For 2.5-year-old Spanish-English bilingual children in the United States, Place and Hoff (Reference Place and Hoff2011, Reference Place and Hoff2016) found medium to strong correlations (r = .61–.84) between global and diary-based estimates of children’s English and Spanish exposure at home (correlations reported by Hoff et al., Reference Hoff, Core, Place, Rumiche, Señor and Parra2012, and Lauro et al., Reference Lauro, Core and Hoff2020, respectively). Similarly strong correlations (r = .70–.77) have been reported between diary-based estimates and time-weighted averages of estimates per speaker for 11-month-old French-English bilinguals in France (Carbajal & Peperkamp, Reference Carbajal and Peperkamp2020) and 3- to 7-year-old French-English bilinguals in Canada (Hambly & Fombonne, Reference Hambly and Fombonne2014). These studies thus suggest that both global and other one-time survey estimates strongly correlate with the more detailed estimates obtained from language diaries. Nevertheless, the correlations are not perfect, and it is unknown whether there are differences in how well these estimates predict children’s language outcomes. In addition, it is unclear to what extent parents’ ability to reliably estimate their child’s language exposure depends on certain child and family characteristics, such as the child’s age, the number of languages and speakers the child is exposed to, and the amount of variability in people’s language use. Furthermore, to the best of our knowledge, no study has investigated the test–retest reliability of language exposure estimates based on parental report, that is, how well the exposure estimates correlate when the same survey is completed twice. This is important to measure, as it indicates the extent to which parents are consistent in their estimations.
1.1. The present study
This study aimed to fill the gaps identified above by comparing three different survey estimates of multilingual children’s language exposure at home that varied in their level of detail. From least to most detailed, we included: (i) estimates of children’s overall exposure to each language at home (henceforth: GLOBAL ESTIMATES), (ii) the average of estimates per speaker, weighted for how much time the child spends with each speaker (ONE-TIME SURVEY ESTIMATES), and (iii) estimates obtained using the Experience Sampling Method (ESM ESTIMATES). The ESM is a procedure whereby participants are prompted to fill out a short survey multiple times a day, typically using digital devices such as smartphones to send participants surveys at set times (Myin-Germeys & Kuppens, Reference Myin-Germeys and Kuppens2022). This method is therefore akin to the language diaries used in previous studies (e.g. Carbajal & Peperkamp, Reference Carbajal and Peperkamp2020; De Houwer, Reference De Houwer2011; Place & Hoff, Reference Place and Hoff2011) but avoids the risk of participants filling out entries retrospectively and removes the burden from participants to remember when to write an entry (as they can receive notifications on their device as prompts). For the ESM estimates, we asked parents to report on their child’s language exposure multiple times a day. However, given that parents could only directly observe their child’s language exposure when they were with their child, we focused on children’s language exposure AT HOME for all three estimates (i.e. the global, one-time survey and ESM estimates).
The aim of our study was threefold. First, we aimed to determine the estimates’ reliability by (i) assessing how well they correlate with each other and (ii) computing the test–retest reliability of the one-time survey estimates. To be able to compute test–retest reliability, we asked participants to fill out the one-time survey twice, separated by at least 1 week. To not overly burden the parents, we did not assess the test–retest reliability of the ESM estimates as this would have required parents to complete another ESM period. The second aim of the study was to determine the estimates’ validity by assessing how well they correlated with children’s productive and receptive vocabulary knowledge in the two languages that were most frequently spoken at home across the families in our sample: Dutch (which was also the societal language) and English. Third, we investigated whether certain child and family characteristics could explain differences between exposure estimates. We suspected that estimating children’s language exposure would be harder when more languages were spoken in the home, when there was greater moment-to-moment variability in how much people spoke each language and when children regularly interacted with a greater number of speakers. We also expected that estimating children’s language exposure would be harder when children were older and therefore spent less time with their parents, and when they had siblings, as having to divide attention between multiple children may reduce parents’ awareness of each child’s language exposure.
In sum, the current study addresses the following research questions:
-
RQ1. How well do the global, weighted one-time survey and ESM estimates correlate with each other?
-
RQ2. What is the test–retest reliability of the weighted one-time survey estimates?
-
RQ3. How well do the different exposure estimates correlate with children’s productive and receptive vocabulary knowledge in Dutch and English?
-
RQ4. To what extent can differences between the global, weighted one-time survey and ESM estimates be explained by child and family characteristics (i.e. children’s age, siblings, number of speakers, number of languages in the home and variability in people’s language use)?
2. Methods
Our study design, sampling plan, exclusion criteria, and analyses were preregistered prior to conducting any analyses at https://osf.io/fzjt5. Unless explicitly stated, all analyses were conducted as preregistered.
2.1. Participants
A total of 102 multilingual families with a child between 3 and 9 years of age participated between September 2023 and April 2024. Three additional families participated that were excluded from further analyses because their data were deemed unreliableFootnote 1 (n = 1) or because they filled out less than seven ESM surveys (n = 2) which was the threshold for inclusion we preregistered. Families came from different parts of the Netherlands, but most (n = 83, 81%) resided in the most densely populated provinces (i.e. Noord-Holland, Zuid-Holland and Utrecht). Almost all families (n = 100, 98%) were two-parent households and most children (n = 67, 66%) were an only child. The other children had one (n = 28, 27%), two (n = 6, 6%) or three (n = 1, 1%) older siblings. Although no other people lived in the child’s home, 23 families (23%) reported that children spent more than 3 hours per week with one to five additional people at home, including grandparents, babysitters, relatives and friends.
According to the ESM estimates, children received at least 5% exposure to two (n = 74, 73%), three (n = 24, 24%) or four (n = 1, 1%) languages at home. There were three children whose exposure to a second language at home was less than 5% according to the ESM estimates. We still included these children, given that these families considered themselves multilingual and because these children did receive more than 5% exposure to a second language based on either the global or weighted one-time survey estimates. A total of 33 home languages were represented in our sample, of which the most frequent were Dutch (n = 67), English (n = 52), Spanish (n = 17), German (n = 12), French (n = 11) and Polish (n = 10). For a list of all languages, see Supplementary Material S1. In most families (n = 75, 75%), parents addressed the child in (partly) different languages. In half of these families, there was (almost) complete language separation between parents (i.e. according to the ESM estimates, the overlap in language use was 10% or less). In the remaining two-parent households (n = 25, 25%), parents used the same languages when speaking to the child, albeit often to different extents.
A subset of 85 children was exposed to Dutch or English (or both languages) at home at least 5% of the time according to the ESM estimates. These children were tested on their vocabulary knowledge in Dutch, English or both languages, depending on which language(s) they were exposed to. We used the criterion of at least 5% exposure to reduce the chance that children would not be able to complete the tasks while still including (almost) the full range of possible exposure estimates. Most of these children (n = 78, 92%) went to primary schools or daycares where Dutch was the only language of instruction. The remaining children went to bilingual Dutch-English schools or daycares (n = 5) or to international schools where the language of instruction was English (n = 1) or English and French (n = 1). See Table 1 for biographical information for all children together, as well as separately for the subset of children who were tested in Dutch and English.
Biographical information for all children and for the children who completed vocabulary tests in Dutch (n = 34), English (n = 22) or both languages (n = 29). For continuous variables, we report the mean, standard deviation and range

a Based on the ESM surveys.
The participating parents (who completed the surveys) worked 29 hours per week on average (SD = 11, range = 0–50) and were generally highly educated, with 92% holding a university degree or equivalent. Most (n = 88, 86%) reported native or native-like proficiency (C2) in the language in which they completed the surveys (Dutch, English, Turkish or Polish; see Materials), whereas the remaining participants reported a level consistent with being a proficient (C1, n = 7) or independent language user (B1-B2, n = 7) according to the Common European Framework of Reference for Languages.
2.2. Materials
2.2.1. Sign-up survey
To register for our study, parents completed a short survey in which they provided informed consent and some basic information about their child, including their date of birth, whether they attended school or daycare and the language(s) spoken by their teachers. We also asked which languages the child heard at home and how often. Parents could answer the latter by adjusting sliders from 0% to 100% that had to sum to 100 across languages. These estimates were used as the global estimates in this study.
We also used the sign-up survey as an additional check that families met all inclusion criteria: (i) their child was between 3 and 9 years, (ii) at least two languages were spoken to their child at home, (iii) they lived with the child on all days of the week and (iv) they had an Android phone. This last requirement was necessary because the mobile app we developed for the ESM surveys was only available for Android. However, because many of the eligible and interested families had an iPhone, we also started to include iPhone users toward the end of the data collection (n = 15), whom we then sent the surveys manually via WhatsApp.
2.2.2. One-time survey
The one-time survey consisted of 16 questions in total, in which we asked about the child’s age, gender and proficiency in the languages spoken at home, and about the participating parent’s education level, working hours and proficiency in the language of the survey. Regarding children’s language exposure, we used questions inspired by the Q-BEx (De Cat et al., Reference De Cat, Kašćelan, Prévost, Serratrice, Tuller and Unsworth2022) that asked about the languages spoken at home, who spent time with the child during a typical week and when, and how much they spoke each language to the child (see Table 2). We included two additional questions about how much people typically spoke to the child compared to one another and how much they used each language both with and around the child (for an overview of all questions included in the one-time survey, see Supplementary Material S2). These questions were used for the first two of the four alternative one-time survey estimates reported in Supplementary Material S3: (i) estimates additionally weighted for people’s relative talkativeness, (ii) estimates that included both child-directed and overheard speech, (iii) estimates additionally weighted for the number of people present during each time slot and (iv) unweighted estimates (i.e. the unweighted average of global estimates per speaker). Due to space limitations, we do not discuss these alternative one-time survey estimates here, but we refer the interested reader to Supplementary Material S3 for results on how well these estimates correlated with the time-weighted one-time survey estimates reported in this paper and with children’s vocabulary scores.
Questions from the one-time survey and the ESM surveys that were used to calculate the language exposure estimates (see Supplementary Material S2 for all survey questions)

a Participants could not continue to the next question unless the sliders summed to 100%. If the sliders did not sum to 100%, they saw an error message instructing them to adjust the sliders. As in the Q-BEx (De Cat et al., Reference De Cat, Kašćelan, Prévost, Serratrice, Tuller and Unsworth2022), pie charts were shown that changed as participants adjusted the sliders. This served as a visual illustration of what we were interested in: how often each language was spoken to the child relative to all other languages.
Besides Dutch and English, the one-time survey and the ESM surveys were made available in Turkish and Polish, as these are the two most-spoken minority languages in the Netherlands (Schmeets & Cornips, Reference Schmeets and Cornips2022) that also have a left-to-right script, making it relatively easy to program these language versions (unlike Arabic, for example, which is another oft-spoken language in the Netherlands). Surveys were translated by a native speaker of the respective languages and then carefully checked by another native speaker.
2.2.3. ESM surveys
For the ESM, we developed an Android app that participants could download from the Google Play Store. Push notifications were sent from our server to this app at scheduled times via Google’s Firebase. The app received these notifications and displayed them in the smartphone’s notification bar. Tapping a notification opened a web-based survey created with the freeware Experiment Designer (Vet, Reference Vet2022), developed at the University of Amsterdam.
To get an overall picture of children’s language exposure at home during a typical week, we sent participants five surveys a day between 10 am and 10 pm for seven consecutive days, with each survey asking about the child’s language exposure during the previous 3 hours. By sending 5 surveys a day, we tried to strike a balance between limiting the number of daily surveys and asking about short enough time intervals to facilitate recall. Each survey consisted of seven questions and took a total of 1–2 minutes to complete. In each survey, parents were asked to answer the questions for the previous 3 hours or since they had last completed a survey (in case they had completed the previous survey less than 3 hours ago). The time period for which the questions should be answered was calculated automatically and appeared at the top of the screen above each question.
In each ESM survey, participants were first asked whether they were with their child during the previous time slot and whether their child was awake. If the answer to either of these questions was No, not at all the survey closed. If the answer to these questions was Yes, the whole time or Yes, part of the time the survey continued. The participant was then asked to indicate who had spent time with their child and during which times, and how much they had used each language in speaking to the child (see Table 2). The final question asked how many minutes the participating parent had actually spoken to the child, but this question was not used in the analyses reported here.
2.2.4. Vocabulary tests
Children’s receptive vocabulary knowledge was tested with the Dutch and English Peabody Picture Vocabulary Test III (PPVT-III; Dunn & Dunn, Reference Dunn and Dunn1997; Schlichting, Reference Schlichting2005). Productive vocabulary was tested with the Dutch and English verb production subtasks of the Cross-Linguistic Lexical Task (CLT; Haman et al., Reference Haman, Łuniewska, Polisenska, Mieszkowska and Chiat2013, Reference Haman, Łuniewska, Pomiechowska, de Jong and Meir2015; van Wonderen & Unsworth, Reference van Wonderen and Unsworth2021). We used the longer, 40-item version of the CLT to prevent ceiling effects in the older children (van Wonderen & Unsworth, Reference van Wonderen and Unsworth2021).
2.3. Procedure
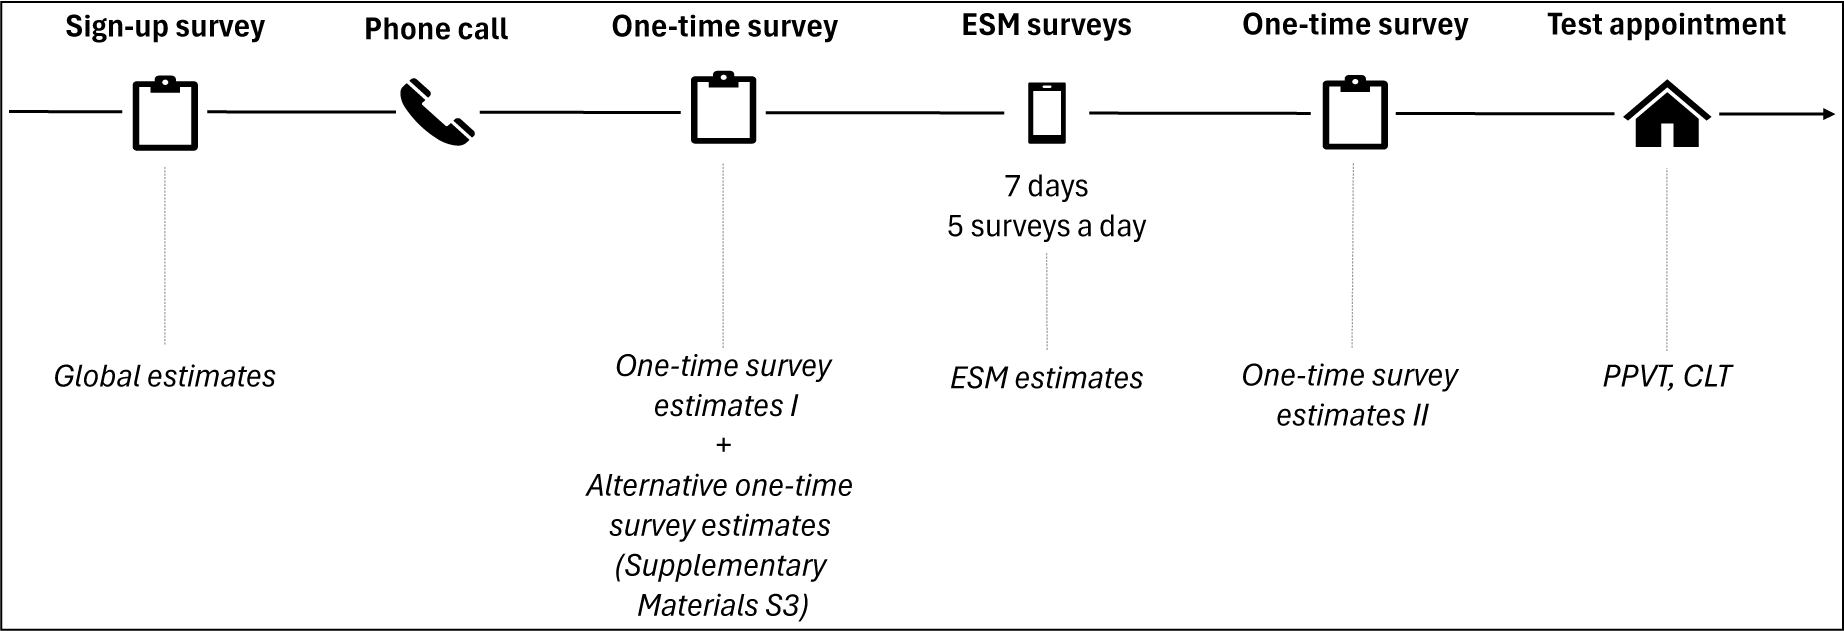
Families were recruited via Facebook groups for expats and multilingual parents, as well as via primary schools, language schools, LinkedIn and word-of-mouth. As preregistered, we continued recruitment until at least 50 children were tested per language (permitting children to be tested in either one or both languages), which was the maximum sample size we deemed feasible given time constraints and anticipated recruitment difficulties. A schematic overview of the procedure is provided in Figure 1. One of the child’s parents, typically the mother (n = 84, 82%), registered for the study by completing the sign-up survey. After signing up, participants received a two-minute instruction video that explained the different steps of the study and how to install the ESM application. A few days later, we would call to explain the study in more detail and to check that the participant’s phone allowed for push notifications from the ESM app. If the participant did not receive the test notifications or stopped receiving them at some point during the ESM week (n = 7), we provided a list of phone settings that could potentially block push notifications (see Supplementary Material S4). This did not solve the issue for two participants, whom we then sent the (remaining) ESM surveys manually via WhatsApp.
Schematic overview of the study’s procedure and the variables derived at each step.

Immediately after the phone call, we sent a link to the one-time survey by email, which took participants between 10 and 20 minutes to complete. Participants could choose in which language they completed the surveys, which resulted in 73 parents filling out the surveys in English, 25 in Dutch, 2 in Turkish and 2 in Polish. If participants did not complete the one-time survey, they received a first reminder via email after a few days (sent to 12 of the 102 participants) and a second reminder 1 week later (sent to 2 participants). Participants typically completed the one-time survey 1–2 weeks after completing the sign-up survey, but for 15 participants, the time between the two surveys exceeded 10 weeks (with a maximum of 29 weeks).
Once participants had completed the one-time survey, the ESM started on the day that was agreed upon during the phone call, typically 1 or 2 days after they had filled out the one-time survey (range = 0–31 days). Participants received a notification on the day before the first ESM survey reminding them that the surveys would start the next day. During the ESM week, participants received notifications to fill out a survey at 10 am, 1 pm, 4 pm, 7 pm and 10 pm. If participants had not yet completed a survey half an hour after receiving a notification, they received a second notification to remind them to complete the survey. To make it more feasible for participants to complete all the surveys and to avoid missing data, we allowed participants to complete a survey until they received the next survey 3 hours later. On average, participants filled out the surveys 34 minutes after receiving the first notification (SD = 39, range = 0–179 minutes), except for the final survey of the day that was sometimes completed the next morning. Throughout the ESM week, participants completed 31 of the 35 surveys on average (median = 33, SD = 6, range = 7–35). Of the completed surveys, an average of 21 surveys (median = 21, SD = 6, range = 7–35) contained information about the child’s language exposure; for the other surveys, the participant indicated to not have been with the child or that the child had been asleep.
The day after the ESM week had ended, participants completed the one-time survey a second time. They then also rated on a 5-point scale how typical the days of the ESM week had been (in terms of who spent time with the child and for how long) and how difficult they found the questions. Fifty-three participants (52%) considered the days of the ESM week completely or quite typical, 31 (30%) considered them more or less typical, 16 (16%) considered them a little bit typical and 2 participants (2%) considered them not typical at all. If participants indicated the days to be a little bit typical or not typical at all, this was because their child had been sick for one or more days (n = 2), their child or other family members had one or more days off from school/work (n = 10), they had family staying over (n = 3), or one of the family members was more or less often at home than usual, for example, because of a work trip (n = 3). Regarding the questions, 66 participants (65%) found them very easy or easy, 32 (31%) found them not easy, but not difficult either, and 4 participants (4%) found the questions difficult or very difficult. For those four participants, it was always the question about people’s language use they found difficult to answer. Reported reasons included not being used to keeping track of people’s language use and people using multiple languages in the same conversation.
For the children who had received at least 5% exposure to English or Dutch during the ESM week, we scheduled a test appointment to administer the vocabulary tests. On average, this appointment took place 3 weeks after the ESM period had ended (range = 3 days–13 weeks). Of the 85 children who were tested in total, 34 children were tested in Dutch, 22 in English and 29 in both languages, resulting in a total of 63 children being tested in Dutch and 51 in English.Footnote 2 Three additional children were tested in Dutch but not included for analysis because they did not complete any of the tasks. Apart from the vocabulary tests, children completed a verbal fluency task and a subset also completed a non-word repetition task, but neither of these tasks are reported here. Administration of the productive vocabulary test (i.e. CLT) was discontinued whenever children did not give any response – or did not respond in the language of testing – on six consecutive items to avoid feelings of frustration or anxiety in children with low proficiency levels. This resulted in seven children (14%) not completing the English CLT and three (5%) not completing the Dutch CLT. These children were excluded from the analyses involving CLT scores.
Upon completion of the study, families received a 15€ gift card and a personal report with a summary of how much time people had spent with the child and how much the child heard each language based on the different surveys the participant had completed. Children who were tested received stickers and a small gift.
2.4. Data analysis
2.4.1. Data cleaning
We removed two global estimates that indicated the child heard only one language 100% of the time as upon inquiry it became clear that the participant had only considered their own language use in this global estimate and not that of other household members.
For the one-time survey, we removed the entry of a baby sibling for two families (as babies do not speak yet) and of teachers for eight families (as participants were asked to only enter people that the child spent time with AT HOME). We also adjusted time slots that overlapped with the child’s sleeping time. For example, if parents reported to be with the child between 6 pm and 10 pm, but the child was reported to sleep from 8 pm onward, we changed the former time slot to 6–8 pm.
For the ESM surveys, the code used to show the time period above the questions did not work for surveys sent via WhatsApp, and due to a technical error, it did not work either for some of the surveys sent to the first eight participants via the app. These participants therefore sometimes filled out information about overlapping time slots on consecutive surveys, but this only happened for two surveys per participant on average (range = 0–7). For these surveys, we adjusted the time slots so that they no longer overlapped (e.g. a time slot from 1– 4 pm was changed to 2–4 pm if the previous survey was completed at 2 pm).Footnote 3
2.4.2. Statistical analysis
The formulas used to compute the different exposure estimates are reported in Supplementary Material S5. To answer RQ1, RQ2 and RQ4, we selected one language per family, as relative exposure estimates for different languages within a family are not independent. As preregistered, we selected the language that was used most during the ESM period (i.e. the language with the highest ESM estimate). However, this introduced a lower bound to the exposure estimates (i.e. 50% for families that speak two languages, 33.3% for families that speak three languages, etc.). Given that range restrictions generally lead to an underestimation of the true correlation (e.g. Wiberg & Sundström, Reference Wiberg and Sundström2009), we conducted additional analyses on a randomly selected language per family as a robustness check, as this was likely to yield an estimated correlation that is more representative of the true correlation.
To answer RQ1 and RQ2, we computed Pearson correlations between the different exposure estimates as well as the absolute differences between them. To answer RQ3, we computed Pearson correlations between the exposure estimates and children’s receptive and productive vocabulary scores. All variables were first regressed on age to remove any age variation in these variables before computing the correlations.Footnote 4 We then compared the correlations between each exposure estimate and children’s vocabulary scores through Steiger’s (Reference Steiger1980) z-test as implemented in the R-package cocor (Diedenhofen & Musch, Reference Diedenhofen and Musch2015).Footnote 5
Prior to comparing these correlations and as preregistered, we performed a compromise power analysis with G*Power 3.1.9.7 (Faul et al., Reference Faul, Erdfelder, Buchner and Lang2009) to balance our Type I and Type II error rate (Faul et al., Reference Faul, Erdfelder, Lang and Buchner2007; Maier & Lakens, Reference Maier and Lakens2022). Normally, researchers set alpha to .05 and aim for 80% power, meaning that false positives are considered four times as bad as false negatives (Cohen, Reference Cohen1988). In our study, a false negative entails falsely concluding all exposure estimates correlate equally well with children’s vocabulary scores, whereas a false positive would entail falsely concluding there are differences. A false negative may therefore cause future studies to not use the most reliable estimates, whereas a false positive may cause researchers to place an unnecessary burden on participants by using time-consuming surveys when these do not provide more reliable estimates. As we considered false negatives and false positives equally undesirable in the current study, we set the error probability ratio between Type I and Type II errors to one. We then performed a compromise power analysis to compute the desired alpha-level for each comparison separately based on (i) the collected sample size, (ii) the effect size of interest and (iii) the estimated correlation between the exposure estimates (see Supplementary Material S6). For the effect size of interest, we considered both a medium difference of .30 (preregistered) as well as a smaller difference of .10 (not preregistered). We added the latter as even small differences in how well the estimates correlate with children’s vocabulary scores may be of interest to other researchers. Note that although compromise power analyses can “easily result in unconventional significance levels greater than α = .05 (in the case of small samples or effect sizes) or less than α = .001 (in the case of large samples or effect sizes) (….), the benefit of balanced Type I and Type II error risks often offsets the costs of violating significance level conventions” (Faul et al., Reference Faul, Erdfelder, Lang and Buchner2007, p. 177; see also Gigerenzer et al., Reference Gigerenzer, Krauss, Vitouch and Kaplan2004; Maier & Lakens, Reference Maier and Lakens2022).
Finally, for RQ4, we conducted three separate regression analyses with the absolute difference between the exposure estimates as the dependent variable.Footnote 6 Because the absolute differences were right-skewed (see Supplementary Material S7), we employed quantile regression using the R-package quantreg (Koenker, Reference Koenker2025), which estimates the effects of predictors at different points (quantiles) of the outcome’s distribution and is robust to non-normality (Koenker & Bassett, Reference Koenker and Bassett1978; Mabire-Yon, Reference Mabire-Yon2025). Because we were primarily interested in relatively large discrepancies between survey estimates, we report the effects of predictors at the 0.75 quantile (i.e. the lower boundary of the 25% largest absolute differences) but note that estimated effects were relatively constant across quantiles (see Supplementary Material S8). We included five child and family characteristics as predictors: children’s age in years, whether or not the child had siblings, number of people who weekly spent more than 3 hours with the child at home (2, 3 or ≥ 4),Footnote 7 number of languages spoken to the child at home (2 vs. >2), and amount of variability in people’s language use across ESM surveys, for which we calculated a pooled standard deviation (see Supplementary Material S5). We included the number of days between surveys as a control variable as there was some variation in how much time passed between the surveys, especially between the sign-up survey (that provided the global estimates) and the first one-time survey (see Procedure). Because this variable was extremely right-skewed (indicating there were not many days between surveys for most families), we turned it into a binary variable using a median split. Days between surveys, siblings and number of languages were deviation-coded, while children’s age and amount of variability were mean-centered. Number of people was treated as an ordinal variable with three levels, for which we set a linear contrast.
3. Results
3.1. RQ1. Comparison of global, weighted one-time survey and ESM estimates
Figure 2 shows the correlations between the global estimates, the weighted exposure estimates from the first one-time survey and the ESM estimates, both for the most-spoken language per family and for a randomly selected language. We found strong correlations between all exposure estimates, with the correlations between the one-time survey and ESM estimates being very high (r = .83–.90), whereas the correlations with the global estimates were somewhat lower (r = .63–.80). For the distribution of absolute differences between the exposure estimates, see Supplementary Material S7.
Scatterplots of the correlations between the different exposure estimates for the language that was used most during the ESM period (top panel) and for a randomly selected language per family (bottom panel); 52 of the 102 data points overlap between the top and bottom panels. The first-mentioned exposure estimate in the figure headings is always on the x-axis, and the second-mentioned estimate is always on the y-axis. The values between brackets indicate the 95% confidence intervals for the correlation coefficient. The diagonal dashed line is the line through the origin (i.e. where the dots should be if there was a perfect correlation).

As shown in Figure 2, for the most-used language, the ESM estimates were typically the highest, followed by the one-time survey and global estimates. This is not just because we selected the language that was used most during the ESM period, as the pattern persisted when selecting the language that was used most according to the one-time survey or global estimates and also when selecting the least-used language (i.e. for the least-used language, ESM estimates were typically the LOWEST). This suggests that exposure to the most-spoken language may be underestimated by the global estimates (and to a lesser extent by the one-time survey estimates) or overestimated by the ESM estimates. Likewise, exposure to lesser-spoken languages may be overestimated by the global and one-time survey estimates or underestimated by the ESM estimates.
3.2. RQ2. Test–retest reliability of the weighted one-time survey estimates
The correlation between the exposure estimates from the first and second one-time survey was very high (r = .87 for the most-spoken language and r = .94 for a randomly selected language, see Figure 2), and the absolute differences between the estimates were generally small (median = 3.5 percentage points for the most-spoken language, range = 0.1–26, and 3.9 for a randomly selected language, range = 0–26), indicating high test–retest reliability. We also directly compared participants’ answers in the first and second one-time survey to the questions that were used to compute the weighted language exposure estimates (see Table 2) and found that participants typically reported the same languages and the same speakers, but that there were sometimes large differences in the exposure estimates per speaker and in how much time each person was reported to spend with the child. Differences in the overall exposure estimates seemed to be largely driven by differences in how much people were reported to use each language and not by differences in time spent with the child (see analyses in Supplementary Material S9).
3.3. RQ3. Correlations with children’s vocabulary scores
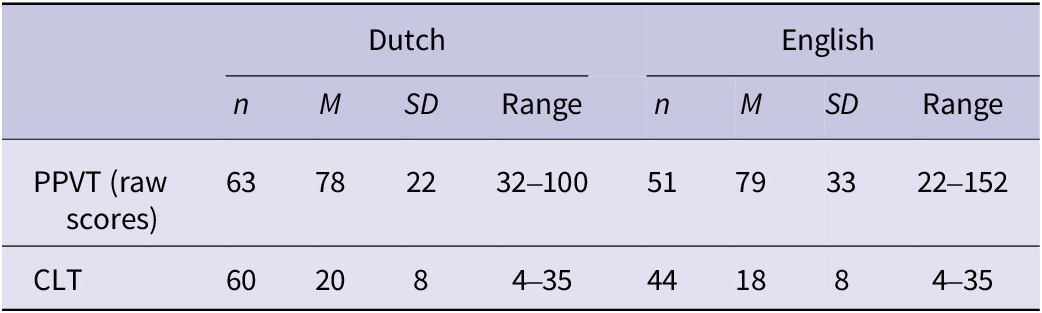
Table 3 shows children’s scores on the receptive (PPVT) and productive (CLT) vocabulary tasks in Dutch and English. The correlations between the different exposure estimates and children’s vocabulary scores are shown in Table 4, along with the predetermined alpha-level for each comparison based on a compromise power analysis that assumed either a medium (.30) or small (.10) difference between the correlations (see Statistical analysis). The difference between the correlations was deemed significant if the p-value was smaller than alpha.
Children’s receptive and productive vocabulary scores in Dutch and English

Correlations (and corresponding 95% confidence intervals) between the different survey estimates and children’s vocabulary scores (all variables regressed on age), and Steiger’s (Reference Steiger1980) z-tests of the differences between these correlations

Note: Significant differences are in bold. Differences between correlations were deemed significant if p < α, where α was calculated based on a compromise power analysis that balanced the Type I and Type II error rates assuming a medium (.30) or small (.10) difference between the correlations (see Statistical analysis). One asterisk indicates the test was significant assuming a small difference, whereas a double asterisk would have indicated the test was also significant while assuming a medium difference (but this did not occur).
Since none of the exposure estimates significantly correlated with children’s receptive vocabulary knowledge in Dutch, we refrain from interpreting the small differences in the correlations we observed (see Table 4). In contrast, all exposure estimates significantly correlated with children’s productive vocabulary knowledge in Dutch, but there were no differences in how well the different survey estimates correlated with children’s scores. In English, all exposure estimates significantly correlated with both receptive and productive vocabulary scores. The ESM and one-time survey estimates consistently demonstrated significantly higher correlations with children’s vocabulary scores than the global estimates (and did not significantly differ from each other), but the differences were small (between .09 and .11).
3.4. RQ4. Predicting differences between survey estimates
Table 5 shows the results of the quantile regressions that investigated to what extent child and family characteristics predicted absolute differences between survey estimates at the higher end of the distribution (i.e. the 0.75 quantile). Only a few effects were statistically significant. First, when the number of people regularly spending time with the child was relatively high, this was associated with larger discrepancies between the global and ESM estimates. Although this effect went in the same direction for both the most-used and a randomly selected language, the effect was only significant for the most-used language. Second, discrepancies between the one-time survey and ESM estimates increased with greater variability in people’s language use across the ESM surveys (both for the most-used language and a randomly selected language) and when fewer languages were spoken to the child at home (which was significant for a randomly selected language, and marginally significant for the most-used language). This latter finding went against our expectations; we will come back to this in Discussion.
Quantile regression models predicting absolute differences between the exposure estimates at the 0.75 quantile

a Children’s age was measured in months but divided by 12 to convert it to years.
Note: Significant effects (p < .05) are in bold; Pseudo-R 2 values were calculated as proposed by Koenker and Machado (1999).
Because the examined family characteristics had little explanatory power (as evidenced by the low pseudo-R 2 values, see Table 5), we also manually inspected the data of the 38 families for whom at least one absolute difference between any of the exposure estimates exceeded 20 percentage points (i.e. the largest 0.75 quantile for the absolute differences between survey estimates, see Supplementary Material S7). In most of these cases, the global estimate diverged from the other two measures (n = 24, 63%), although in some cases the ESM or one-time survey estimate diverged instead (n = 6 each, 32%). In two families, all three estimates differed substantially. When the ESM or one-time survey estimates diverged, this seemed to have had various causes, with few common patterns across families. In contrast, half of the cases in which the global estimate diverged appeared to reflect parents’ inclusion of overheard speech, as they often provided global estimates for English that were higher than any of the speaker-specific estimates for English, and these global estimates matched closely with the alternative one-time survey estimates (reported in Supplementary Material S3) that included overheard speech. Another one-third of the cases where the global estimate diverged from the other two estimates appeared to involve inclusion of language exposure outside the home, as these global estimates were higher (or lower) than any of the speaker-specific estimates, also when including overheard speech. In some cases, it was clear that parents had included the child’s exposure to Dutch or English at their school or day care, while in other cases, it remained unclear what other source of exposure parents might have considered in providing the global estimate.
4. Discussion
In this study, we examined estimates of multilingual children’s language exposure at home at varying levels of detail and assessed their reliability and validity by assessing (i) how well they correlated with each other, (ii) their test–retest reliability (only for the one-time survey estimates) and (iii) how well they correlated with children’s productive and receptive vocabulary outcomes. We expected that more detailed measures of children’s language exposure would show stronger correlations with children’s vocabulary scores. We also assessed to what extent differences between the exposure estimates could be explained by several child and family characteristics: children’s age, presence of siblings, number of speakers, number of languages spoken at home and amount of variability in people’s language use. We expected that differences between survey estimates would be larger for higher values on these variables.
Our sample included data from 102 multilingual children in the Netherlands (ages 3–9 years) with diverse language backgrounds. One of the children’s parents completed a detailed one-time survey about the child’s language environment twice, with the two surveys separated by at least 1 week. In between, that same parent completed five short surveys a day for seven consecutive days, following the ESM method. In each of these surveys, they reported on the child’s language exposure during the 3 hours preceding the survey. We compared the ESM estimates, which we considered to be the most detailed measure, to one of the simplest measures (i.e. global estimates based on a single question) and one of the most detailed one-time survey measures (i.e. the average of estimates per speaker, weighted for how much time each speaker spends with the child during a typical week). Because the ESM surveys only captured language exposure that parents could observe directly, we focused on children’s language exposure AT HOME for all three estimates to ensure consistency.
Our first research question concerned the similarity between the three different estimates. We found that especially the ESM and the one-time survey estimates correlated very highly (r = .83 and .90), whereas the global estimates showed slightly lower correlations with the other two measures (r ± .80 for a randomly selected language per family and r ± .60 for the most-used language). For the most-used language per family, we additionally found that the ESM estimates tended to be highest, followed by the one-time survey and global estimates. This may suggest that parents tend to provide global estimates that underestimate the frequency with which the most-used language is spoken while overestimating the frequency with which lesser-used languages are spoken. This is in line with reports from Byers-Heinlein et al. (Reference Byers-Heinlein, Schott, Gonzalez-Barrero, Brouillard, Dubé, Jardak, Laoun-Rubenstein, Mastroberardino, Morin-Lessard, Pour Iliaei, Salama-Siroishka and Tamayo2020) and with our personal experience of administering similar surveys face-to-face, during which parents sometimes estimate that their child’s relative exposure to a language is 5–10% when their actual exposure is probably 1% or less (as often becomes clear when asking about the number of hours per week that the child hears this language). Parents may thus tend to overestimate exposure to infrequently used languages, which may reflect social desirability, parents’ positive attitudes toward multilingualism, or a cognitive bias to overestimate the frequency of infrequent events (Byers-Heinlein et al., Reference Byers-Heinlein, Schott, Gonzalez-Barrero, Brouillard, Dubé, Jardak, Laoun-Rubenstein, Mastroberardino, Morin-Lessard, Pour Iliaei, Salama-Siroishka and Tamayo2020; Tourangeau et al., Reference Tourangeau, Rips and Rasinski2000).
Regarding our second research question, we found that the test–retest reliability of the one-time survey estimates was very high (r = .87 and .94), despite some differences in parents’ answers to the timetable questions and the reported language use per speaker. Closer inspection revealed that absolute differences in overall exposure were driven mainly by differences in reported language use, rather than in time spent with the child (see Supplementary Material S9). This is likely because, unlike differences in reported language use, differences in time spent with the child only affect the overall language exposure estimate if this person’s language use is (very) different from the average language use of all other speakers. In addition, differences in reported language use across surveys were relatively larger than differences in reported time spent with the child. This is unsurprising, as reporting people’s language use requires complex estimations and calculations, whereas reporting when each person typically spends time with the child is presumably more straightforward.
For the third research question, we assessed whether there were significant differences between how strongly the different survey estimates correlated with children’s vocabulary knowledge in Dutch and English. For this analysis, we used a preregistered compromise power analysis to balance the Type I and Type II error rate. We took this approach because we regarded false negatives and false positives as equally undesirable, as false negatives could result in not using the most reliable estimates, while false positives could result in administering unnecessarily long surveys. Although this approach led to unconventional alpha-levels (smaller than .05 for detecting a medium difference, range = .0001–.04, and greater than .05 for detecting a small difference, range = .19–.37), we agree with Faul et al. (Reference Faul, Erdfelder, Lang and Buchner2007) and others that the gains from balanced error risks often outweigh the cost of non-standard significance thresholds. Nevertheless, these alpha-levels do suggest that for reliably detecting small differences between the correlations, our study would have benefitted from a larger sample size. Assuming a correlation of .80 between exposure estimates, we would have needed a sample size of 156 to detect the difference between r = .30 and r = .40 with 80% power and balanced error rates, and a sample size of 443 to reach the conventional alpha-level of .05 with balanced error rates (calculation performed with G*Power, Faul et al., Reference Faul, Erdfelder, Buchner and Lang2009). Any findings mentioned next that involve small but significant differences between correlations should therefore be interpreted with caution until replicated by future studies.
We found that none of the exposure estimates correlated with children’s receptive vocabulary knowledge in Dutch, which is not surprising given that much of the children’s exposure to Dutch takes place outside the home, which was not captured in the exposure estimates. Furthermore, it is, in fact, common to find weak or no correlations between children’s language exposure and their (receptive) vocabulary knowledge in the societal language (e.g. Dijkstra et al., Reference Dijkstra, Kuiken, Jorna and Klinkenberg2016; Golberg et al., Reference Golberg, Paradis and Crago2008; Hammer et al., Reference Hammer, Davison, Lawrence and Miccio2009; Mieszkowska et al., Reference Mieszkowska, Łuniewska, Kołak, Kacprzak, Wodniecka and Haman2017; Vaahtoranta et al., Reference Vaahtoranta, Suggate, Lenhart and Lenhard2021), possibly because children’s relative exposure to the societal language has already reached a threshold beyond which additional exposure is no longer beneficial in fostering the language knowledge tested in a specific vocabulary task (Thordardottir, Reference Thordardottir2011; Unsworth, Reference Unsworth, Nicoladis and Montanari2016). In contrast, all exposure estimates correlated with children’s productive vocabulary knowledge in Dutch and with both receptive and productive vocabulary knowledge in English. Using the compromise power analysis approach described above, we found no significant differences between the one-time survey and ESM estimates in their correlational strength with children’s vocabulary scores. In contrast, the global estimates showed significantly lower correlations with children’s vocabulary scores, but the differences were small (±.10). These results suggest that, at least in the current sample, parents reliably estimated their child’s language exposure at home, even when providing a single global estimate per language.
Regarding our fourth research question, we found that, overall, family characteristics did not have much explanatory power in predicting discrepancies between the three survey estimates. Nevertheless, we found some small effects. First, discrepancies between the global and ESM estimates were greater when more people regularly spent time with the child, indicating that it may be harder for parents to provide an overall estimate of their child’s language exposure when they have to average across more speakers. Second, differences between the one-time survey and ESM estimates were larger when there was higher variability in people’s language use across ESM surveys and when fewer languages were spoken to the child at home. The former finding suggests, as expected, that estimating overall language use is harder for speakers whose language use is more variable. In contrast, the latter finding went against our hypothesis, but is likely an artifact of using RELATIVE exposure estimates: Because the values across languages must sum to 100, an increase in the number of languages necessarily reduces the range of values any single language can take. For example, if all languages are spoken equally often (i.e. 50% of the time in a two-language household, and 33% in a three-language household) and parents underestimate the child’s exposure to one of the languages, the reporting bias for this language can reach 50 percentage points in a two-language household (in the extreme case that they report 0% exposure to this language) but only 33 in a three-language household. Finally, manual inspection of large discrepancies between the global estimates, on the one hand, and the one-time survey and ESM estimates, on the other hand, showed that some parents had included overheard or out-of-home exposure in their global estimates, suggesting that more consistent global estimates might be achieved by explicitly instructing parents to exclude such exposure.
In summary, we found that exposure estimates at varying levels of detail were highly correlated, consistent with previous studies reporting strong associations between one-time survey and diary-based estimates (Carbajal & Peperkamp, Reference Carbajal and Peperkamp2020; Hambly & Fombonne, Reference Hambly and Fombonne2014; Hoff et al., Reference Hoff, Core, Place, Rumiche, Señor and Parra2012; Lauro et al., Reference Lauro, Core and Hoff2020). Furthermore, all estimates significantly correlated with children’s receptive and productive vocabulary knowledge in English and their productive vocabulary knowledge in Dutch. The simplest estimates (i.e. the global estimates) only showed a small reduction (±.10) in how well they correlated with children’s vocabulary knowledge compared to the more detailed estimates. Our findings thus mirror those of De Cat et al. (Reference De Cat, Gusnanto, Kašćelan, Prévost, Serratrice, Tuller and Unsworth2025), who concluded that the most detailed measures are not necessarily the most informative when it comes to predicting multilingual children’s language outcomes. Based on these findings, researchers may decide that the benefits of using global estimates, in terms of shorter completion time and reduced risk of non-response, offset the cost of having slightly less reliable estimates, especially if exposure is only measured as a control variable or for the purposes of sample description. In contrast, when language exposure is the main variable of interest, detailed one-time surveys (including estimates per speaker and how much time the child spends with each speaker) are the preferred option, given that they are less demanding than language diaries but provide estimates that are just as accurate. Detailed one-time surveys or ESM surveys may furthermore be useful when researchers are interested in additional aspects of the child’s language environment that are not captured by global estimates, such as the variability in people’s language use or from whom the child hears each language and during which activities.
4.1. Limitations
There are several limitations to the current study. The first concerns the generalizability of our findings. Our sample consisted of highly educated and highly motivated parents, as evidenced by the high response rate and low drop-out rate. We do not know if our general conclusion that parents reliably estimate their child’s language exposure would hold for parents that are less highly educated or motivated. Likewise, most families spoke only two (73%) or three (24%) languages to the child, had “nuclear” family structures (i.e. only parents and siblings lived with the child at home) and showed low moment-to-moment variability in their language use. These characteristics are rather typical for countries like the Netherlands, but they may be rather atypical for other types of societies. Providing global estimates of children’s language exposure may be much harder – or nearly impossible – in societies where children are typically exposed to more than three languages, live with multiple caregivers (e.g. grandparents, nannies, or other family members), or where people’s language use is very context-dependent or contains a lot of code-switching.
Furthermore, even within our current sample, we might have obtained different results if we had tested children’s vocabulary knowledge in languages other than Dutch or English. As already mentioned above, Dutch being the societal language meant that a great portion of children’s exposure to Dutch took place outside the home, which was not captured in our estimates. Similarly, children’s exposure to English did not come solely from child-directed speech at home but also from media (videos, movies, songs, games, etc.) and overheard speech, as English was often the language parents communicated in with each other. Moreover, some children’s home exposure to Dutch and English came (partly) from non-native speakers, which may have further reduced the correlation between amount of exposure and children’s vocabulary scores (Buac & Kaushanskaya, Reference Buac and Kaushanskaya2023; Place & Hoff, Reference Place and Hoff2011, Reference Place and Hoff2016; Sun et al., Reference Sun, Low and Chua2023; Unsworth et al., Reference Unsworth, Brouwer, Bree and Verhagen2019). For languages where the child’s only exposure comes from native or highly proficient child-directed speech at home, fine-grained differences in the exposure estimates may have a larger impact on children’s language outcomes, making it more important to measure exposure at home as precisely as possible. Nonetheless, the findings from De Cat et al. (Reference De Cat, Gusnanto, Kašćelan, Prévost, Serratrice, Tuller and Unsworth2025) suggest that even for heritage languages other than English, a relatively simple measure of exposure (i.e. the unweighted average of estimates per speaker) may be sufficiently reliable. However, since their heritage language proficiency measures were based on parental report, future research could still benefit from comparing how well different exposure estimates correlate with direct assessments of children’s language proficiency in heritage languages other than English.
Another limitation of our study concerns the ESM surveys. Because only one of the child’s parents completed these surveys, we lack information about times where the other parent was alone with the child, which may have biased the ESM estimates toward the languages spoken most by the participating parent. To determine whether this may explain discrepancies between the ESM estimates and the global and one-time survey estimates, we calculated the number of hours the other parent was typically alone with the child based on the first one-time survey (median = 3.7, range = 0–23 hours). When we added this variable to the regression analyses reported for RQ4, it did not have a significant effect. This finding suggests that having only one parent complete the ESM surveys did not greatly impact our results.
Finally, it is important to consider that all exposure estimates were based on parental report. Ideally, we would have used daylong audio recordings to assess how well the different parental estimates correspond to direct observations of children’s language exposure. Studies that have compared relative exposure estimates based on parent report and audio recordings found mixed results, with correlations ranging between .40 and .80 across studies (Cychosz et al., Reference Cychosz, Villanueva and Weisleder2021; Marchman et al., Reference Marchman, Martínez, Hurtado, Grüter and Fernald2017; Orena et al., Reference Orena, Byers-Heinlein and Polka2020). Whereas audio recordings can measure the exposure the child receives directly and thus more reliably, they typically only cover 1 day due to practical constraints and may therefore not capture the child’s general language exposure patterns. For this reason, it has been suggested that it may be useful to use both sources of information by complementing parental survey estimates with information from audio recordings (e.g. Cychosz et al., Reference Cychosz, Villanueva and Weisleder2021; De Houwer, Reference De Houwer, Miller, Bayram, Rothman and Serratrice2018). This approach was taken by Verhoeven et al. (Reference Verhoeven, van Witteloostuijn, Oudgenoeg-Paz and Blom2024), who calculated how much each person used each language in different contexts based on day-long audio recordings and multiplied this with information from the Q-BEx, namely how much time each person spent with the child in different contexts during a typical week. However, contrary to the authors’ expectations, combining the two methods did not lead to stronger correlations with children’s vocabulary scores and neither method outperformed the other. This suggests that parent report estimates may be a good enough proxy for children’s relative language exposure.
5. Conclusion
This study assessed the reliability and validity of parental report estimates of multilingual children’s language exposure at home at varying levels of detail. In terms of reliability, we found that all estimates were strongly correlated and that the one-time survey estimates showed high test–retest reliability. Regarding validity, we found that all estimates showed medium-to-strong correlations with children’s productive vocabulary knowledge in Dutch (the societal language) and their receptive and productive vocabulary knowledge in English (a heritage language for a subset of the children). Moreover, the least detailed measure (i.e. the global estimates) only showed a small reduction in correlational strength with children’s vocabulary outcomes. We therefore conclude that global estimates may be sufficiently reliable in research on multilingual children’s language development, particularly when exposure is not the main variable of interest. Using shorter surveys not only reduces the burden on participants – thereby potentially improving participation rates and reducing the amount of missing data – but also aligns with established research ethics principles such as data minimization, which emphasize only collecting the data necessary for achieving the research objectives.
Supplementary materials
The supplementary material for this article can be found at https://osf.io/qjtdg/.
Data availability statement
In accordance with the Peer Reviewers’ Openness Initiative (https://opennessinitiative.org, Morey et al., Reference Morey, Chambers, Etchells, Harris, Hoekstra, Lakens, Lewandowsky, Morey, Newman, Schönbrodt, Vanpaemel, Wagenmakers and Zwaan2016), all materials, anonymized data and analysis scripts associated with this manuscript were available during the review process and remain available on the OSF project “Quantifying multilingual children’s language input” at https://osf.io/qjtdg/. This study was preregistered after collecting about half of the data but prior to conducting any analyses at https://osf.io/fzjt5.
Acknowledgments
We would like to thank all parents and children for participating in this study. We also thank Sofie van den Berg, Linda Meijer and Britt Daize for their help with data collection and the audiences at the Q-BEx workshop 2023 and IASCL 2024 for fruitful discussions.
Author contribution
Elise van Wonderen: Conceptualization, Methodology, Investigation, Data Curation, Formal analysis, Visualization, Writing – original draft, Writing – review and editing, Project administration. Kimberley Mulder: Conceptualization, Methodology, Writing – review and editing. Dirk Jan Vet: Software. Josje Verhagen: Conceptualization, Methodology, Writing – review and editing, Funding acquisition.
Competing interests
The authors declare none.
Ethical standard
The authors assert that all procedures contributing to this work comply with the ethical standards of the relevant national and institutional committees on human experimentation and with the Helsinki Declaration of 1975, as revised in 2008.


 Open access