



Evidence gathered over the last few decades shows that relationships exist between socio-economic status (SES) and lifestyles of young people, including eating behaviour(Reference Inchley, Currie and Young1,Reference Currie, Zanotti and Morgan2) . The influence of family affluence on adolescent eating habits has been the most extensively investigated(Reference Voráčová, Sigmund and Sigmundová3–Reference Zaborskis, Lagunaite and Busha6). Studies show that adolescents living in high-affluence families consume healthier diets than counterparts living in low-affluence families. Family affluence may influence people’s eating behaviour in several ways. In particular, differences in family affluence affect access to healthy food, and, therefore, adolescents from families of lower affluence report lower levels of fruit and vegetable consumption and often have nutrient and energy-poor diets(Reference Gaspar, Matos and Ribeiro7,Reference Wang8) . Furthermore, living in low SES is often associated with low academic background of the parents that limits awareness of food nutritive value and healthy eating practice in family(Reference He, Zhai and Engelgau9–Reference Slusser, Prelip and Kinsler11). There are more possible explanations regarding SES level and the impact it may have on eating behaviour. One additional example includes the fact that individuals from high SES are more likely to uptake new behaviours(Reference Cockerham12), for example, when healthy food is new, those from high SES will be the first to show such behaviour.
Family structure is another social factor with a tremendous impact on health in general and on children and adolescents in particular(Reference Anderson13,Reference Fagan and Churchill14) . When evaluating the effect of divorce on health and well-being of children, the scientific research demonstrates that children with divorced parents consistently experience poorer physical, emotional and academic well-being than those living with their married biological parents(Reference Anderson13,Reference Shibeshi15–Reference Kleinsorge and Covitz17) . Studies have also found that children living with a single parent are much more likely to live in poverty than children living with married parents(Reference Shibeshi15,Reference Edwards18) . Divorced parents often experience financial hardship due to the divorce, which can lead to the inability to obtain basic needs including adequate amounts of food, clothing and educational support. This type of family structure may also negatively affect children’s nutrition; however, regardless of its wide range occurrence, there are few studies that examine the association between family structure and children’s eating habits(Reference Formisano, Hunsberger and Bammann19,Reference Mauskopf, O’Leary and Banihashemi20) . Formisano et al. (Reference Formisano, Hunsberger and Bammann19) found that children who lived with their grandparents as opposed to both parents had higher BMI, while Mauskopf et al. (Reference Mauskopf, O’Leary and Banihashemi20) found that preadolescents who had divorced parents consumed more sugar-sweetened drinks than those who lived with married parents. Mauskopf et al. (Reference Mauskopf, O’Leary and Banihashemi20) also found that preadolescents with divorced parents consumed breakfast less frequently than those who had married parents.
Although studies have demonstrated that family affluence and structure are important factors in the nutrition of adolescents, to the best of our knowledge, the combined effect of both social factors on adolescent eating habits has not been studied at all. The analysis of this effect is limited by the interaction between social factors. As was mentioned above, it is likely that family structure without two married parents reduces family wealth; thus, the family structure affects adolescent eating habits both directly and indirectly due to family affluence. Indirectly, family affluence levels play a mediating role. The association between social factors and adolescent eating habits may vary depending on the social and cultural context, so it is important to examine the relationships among adolescents from different countries.
Social inequalities in health and health behaviours during adolescence is one of the foci of the cross-national Health Behaviour in School-aged Children (HBSC) study, which involves a wide network of researchers from more than forty countries and regions(Reference Inchley, Currie and Young1). The previous editions of the study have highlighted the effect of socio-economic differences on the way young people grow and develop(Reference Inchley, Currie and Young1,Reference Currie, Zanotti and Morgan2) . A significant positive association between family affluence and daily fruit consumption has been found for both genders and all three age groups (11, 13 and 15 year olds) in nearly all participating countries and regions, while the relationship between family affluence and soft drink consumption has not been consistent across countries.
The present study aimed to investigate the family structure and family affluence-related inequality in adolescent fruit, vegetable, sweets and chocolate, and soft drink consumption in forty-one HBSC (2013/2014) countries. A specific objective was to test the mediating effect of family affluence in the relationship between family structure variable and daily food consumption among adolescents.
Methods
Subjects and study design
The data were obtained from the HBSC study, a cross-national survey with support from the WHO (Europe), which was completed in 2013/2014 in forty-two countries, including forty European countries and regions (considered alone as countries, i.e., England, Scotland and Wales), Canada and Israel. More detailed background information about the study is provided on its website(21) and in international reports(Reference Inchley, Currie and Young1,Reference Currie, Zanotti and Morgan2) .
The population selected for sampling included 11-, 13- and 15-year-old adolescents. Sampling was conducted in accordance with the structure of national education systems within countries. In most countries, the primary sampling unit was the school class or the whole school where a sample frame of classes was not available. If a school with two or more classes was selected, then the one chosen for the sample was randomly selected.
The data were collected by means of self-report standardised questionnaires. The surveys were administrated in school classrooms. Students did not provide any personal details (such as name, classroom and teacher), making them completely anonymous and ensured the students’ confidentiality. Researchers strictly followed the standardised international research protocol to ensure consistency in survey instruments, data collection and processing procedures(22). Response rates at the school, class and student level exceed 80 % in the majority of countries(Reference Inchley, Currie and Young1).
Measures
At the individual level, the outcome (dependent) variable was the frequency of selected food (fruit, vegetable, sweets and chocolate, or soft drink) consumption and the explanatory (independent) variables were family affluence, family structure, gender and age.
Eating habits
The frequency of four eating habits was assessed by questions: ‘How many times a week do you consume fruits/vegetables/sweets and chocolate/soft drinks?’ To make it more clear, in the survey provided to the students, there was a table with all of these options (fruits, vegetables, sweets and chocolate, soft drinks); students checked which ones they consume on a weekly basis and how many times per week: ‘never’ (1), ‘less than once a week’ (2), ‘once a week’ (3), ‘2–5 times a week’ (4), ‘5–6 times a week’ (5), ‘once a day’ (6) or ‘more than once a day’ (7). Daily consumption referred to eating these foods once or more times per day.
Family affluence was measured by the Family Affluence Scale(Reference Currie, Molcho and Boyce23,Reference Torsheim, Cavallo and Levin24) . The scale is a validated measure for material affluence of household based on the following six questions (assignment of points shown in parentheses): ‘Does your family own a car, van, or truck?’ (‘no’ (0), ‘yes, one’ (1), ‘yes, two or more’ (2)); ‘Do you have your bedroom for yourself?’ (‘no’ (0), ‘yes’ (1)); ‘During the past 12 months, how many times did you travel away on holiday with your family?’ (‘not at all’ (0), ‘once’ (1), ‘twice’ (2), ‘more than twice’ (3)); ‘How many computers does your family own?’ (‘none’ (0), ‘one’ (1), ‘two’ (2), ‘more than two’ (3)); ‘How many bathrooms are in your home?’ (‘none’ (0), ‘one’ (1), ‘two’ (2), ‘three or more’ (3)); ‘Does your family have a dishwasher at home?’ (‘no’ (0), ‘yes’ (1)). A family affluence score (FAS) was calculated by summing the points of the responses to these six questions. Higher FAS values indicated higher family affluence. In addition, this indicator was recoded into country-specific three groups. The first group included those in the lowest 20 % (reference group), the second included those in the medium 60 % and the third group included those in the highest 20 % of the FAS(Reference Inchley, Currie and Young1). The proportion of missing cases in the total sample for this scale was 8·3 %(Reference Inchley, Currie and Young1). The valid data on family affluence were obtained from forty-one countries (Armenia was excluded from the analysis due to deviance in the family affluence assessment).
Family structure
To identify family structure, respondents were given a checklist to mark the people living in their home. If the respondent ticked on the checklist that he or she lived with the biological mother and father, he or she was coded as living in ‘intact family’ (0, reference value); in all other cases (meaning that not both mother and father were ticked), respondents were categorised as living in ‘non-intact family’(Reference Inchley, Currie and Young1). On average, the proportion of missing cases in the total sample for family structure was 4·0 %.
Gender and age
Equal proportions of boys and girls, as well as 11-, 13- and 15-year-old adolescents were the target groups for the study.
Statistical analysis
All analyses were performed with SPSS (version 21.0; SPSS Inc.). They were conducted with data from all countries, as well as with data of each country. Statistics were estimated with 95 % CI. Statistical tests with P < 0·05 were considered statistically significant.
We first used an approach proposed by Kunst and Mackenbach to estimate the extent of SES-based inequality in health(Reference Kunst and Mackenbach25). In this model, the ordinal FAS measure was transformed into a continuous X variable scaled from 0 (the lowest FAS) to 1 (the highest FAS), incorporating appropriate population weights for each FAS category. In the present study, the binary logistic regression estimated the association between the continuous X variable and proportion of daily food consumption. OR were derived from this model as a measure of health inequality, which denoted the ratio between the likelihood of daily food consumption at the lowest FAS level (at X = 0) and at the highest FAS level (at X = 1). The logistic regression model included also a binary family structure variable to estimate effect (OR) of ‘non-intact family’ v. ‘intact family’ in daily food consumption. The models were adjusted for gender and age group variables. Then, we produced analyses of the total sample of all countries with weighting data by country sample size. The use of FAS in adolescent health inequality analysis was described in detail in previous research(Reference Zaborskis and Grincaite26,Reference Zaborskis, Grincaite and Lenzi27) .
Next, path analysis was used to examine the hypothesised causal relationships of FAS and family structure with daily food consumption adjusting data for gender and age. These relationships were assumed to be unidirectional. Finally, structural equation modelling was conducted to assess the final model using a maximum likelihood estimation method, given its applicability to non-normal data(Reference Čekanavičius and Murauskas28-Reference Hooper, Caughlan and Mullen30). The final model provided path coefficients (β) showing the strength of the predictive relationship between the connected variables. The χ 2 statistic was used to assess the magnitude of the discrepancy between the sample and fitted covariance matrices, where P > 0·05 indicated that the model and data were consistent. Because this statistic is sensitive to sample size, model fit was primarily evaluated using the root mean square error of approximation and the comparative fit index. Root mean square error of approximation values lower than 0·05 indicated good fit and lower than 0·08 indicated reasonable fit. Comparative fit index values higher than 0·9 indicated adequate fit and higher than 0·8 indicated marginal fit(Reference Hooper, Caughlan and Mullen30). Path analysis was performed using AMOS 21 (SPSS Inc.)(Reference Arbuckle29).
Results
Socio-demographic characteristics and prevalence of eating behaviours
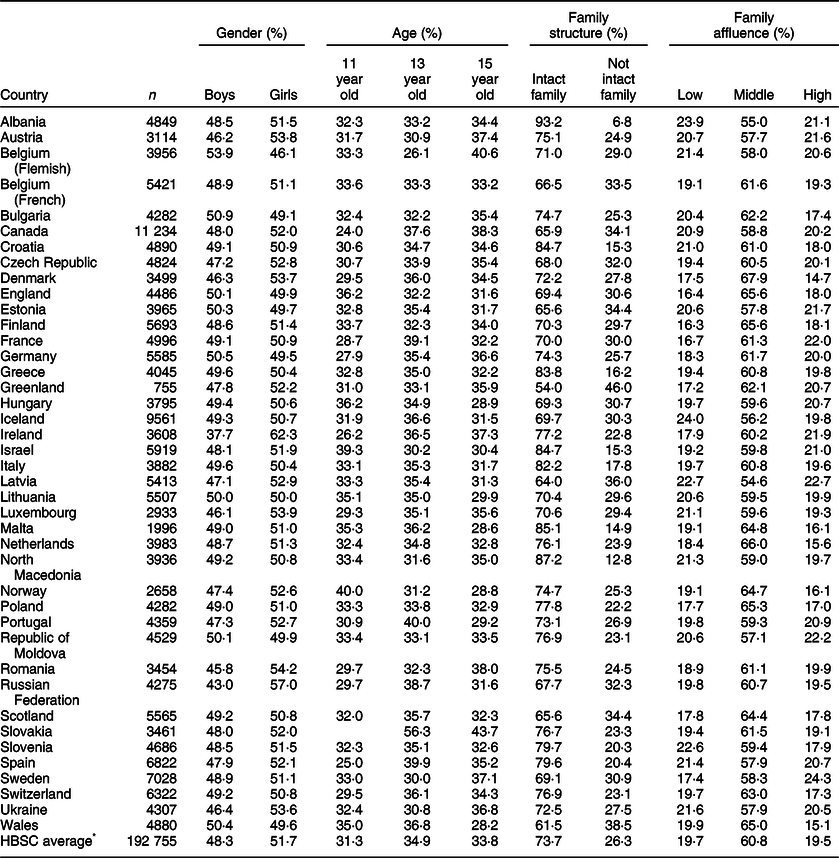
A total of 192 755 students from forty-one countries were eligible for the current study (Table 1). Of them, 48·3 % were boys and 51·7 % were girls. A negligible range between proportions of students’ gender was common in all countries, except for Ireland and the Russian Federation, for which the difference between the percentages of boys and girls was more than 10 percentage points. In the whole sample, the age groups of 11, 13 and 15 years achieved nearly equal proportions (31·3, 34·9 and 33·8 %, respectively). Across countries, there were nevertheless deviations, ranging from 24·0 to 40·0 % in the youngest age group with similar patterns among 13 year olds and 15 year olds. In Slovakia, 11 year olds were not surveyed. The proportions of subjects in ‘low’, ‘middle’ and ‘high’ family affluence groups were relative for each country; across countries, they varied around 20, 60 and 20 % groups, respectively. Family structure distribution showed wide variation across countries, ranging from 54·0 % of adolescents living with both parents in Greenland to 93·2 % in Albania (73·7 % in the total sample). Table 1 displays the detailed information on socio-demographic characteristics of the participants in the current study, by countries.
Sample size (n) and socio-demographic characteristics, by countries
HBSC, Health Behaviour in School-aged Children.
* Data weighted by country sample size.
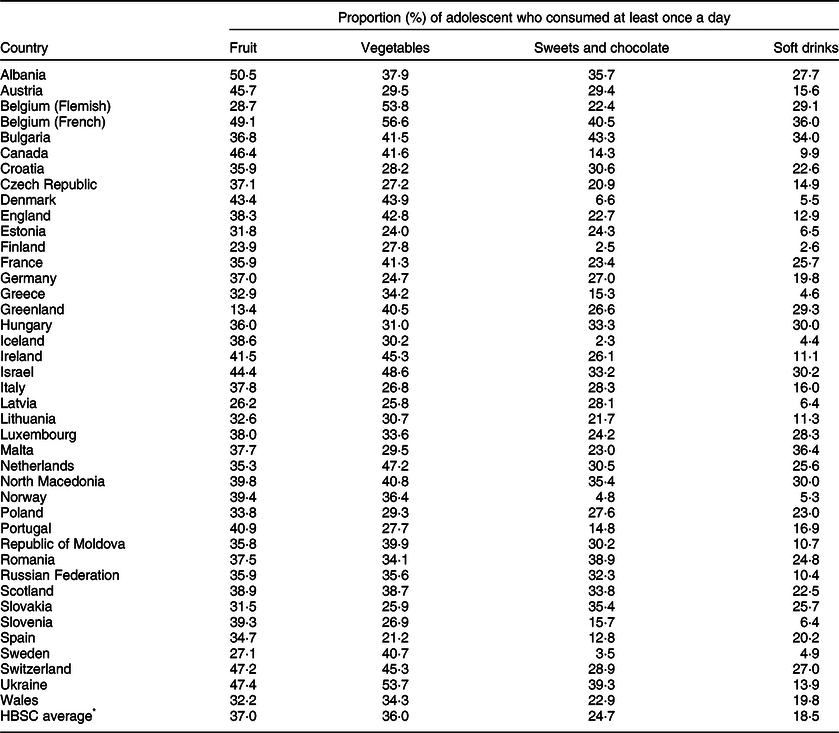
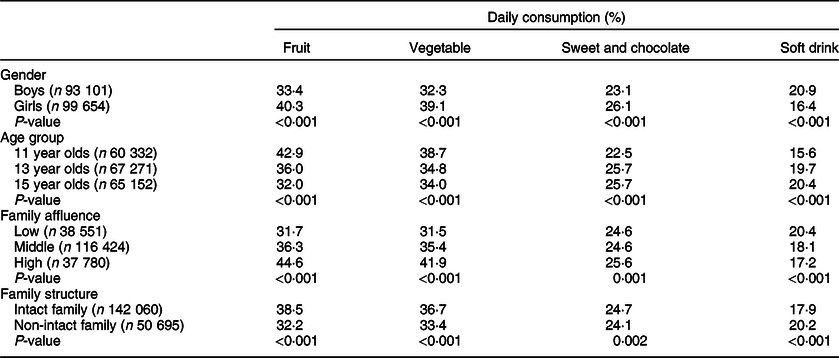
Findings presented in Table 2 show frequencies of daily fruit, vegetable, sweets and chocolate, and soft drink consumption, by countries. Table 3 describes the proportions reporting daily consumption of these items by gender, age group, family structure and family affluence, which were estimated from the total sample.
Daily consumption of selected foods, by country
HBSC, Health Behaviour in School-aged Children.
* Data weighted by country sample size.
Daily fruit, vegetable, sweet and soft drink consumption, by gender, age group, family structure and family affluence: Health Behaviour in School-aged Children average based on equal weighting of each country
Overall, frequency of eating fruit at least once a day was 37·0 %; it was lowest (13·4 %) among students in Greenland and highest (50·5 %) among students in Albania. The average frequency of daily vegetable consumption (36·0 %) was similar to that of fruits, with a range of 21·2 % in Spain to 56·6 % in Belgium (French). Girls reported to eating both fruits and vegetables more frequently than boys. Daily fruit and vegetable consumption decreased with age.
On average, one in four respondents (24·7 %) reported to eating sweets and chocolate daily. Across countries, this proportion had a wide range of 2·3–43·3 % among students in Iceland and Bulgaria, respectively. Daily consumption of soft drinks was reported in 18·5 % of adolescents on average; the lowest level of its consumption was found among students in Finland (2·6 %), while students in Malta reported the highest levels (36·4 %). Girls generally reported greater daily consumption of sweets and chocolate but a lower daily consumption of soft drinks than boys. Daily consumption of both these items increased with age.
Social inequalities in eating behaviour
Table 3 also represents a comparison of eating habits between levels of family affluence and family structures. Analysis of the total sample showed that students living in low-affluent families or in non-intact families reported a noticeable lower frequency of daily consumption of fruits and vegetables, along with a greater frequency of a daily consumption of soft drinks than among their counterparts. In regard to daily sweets and chocolate consumption, the difference between the groups was less pronounced.
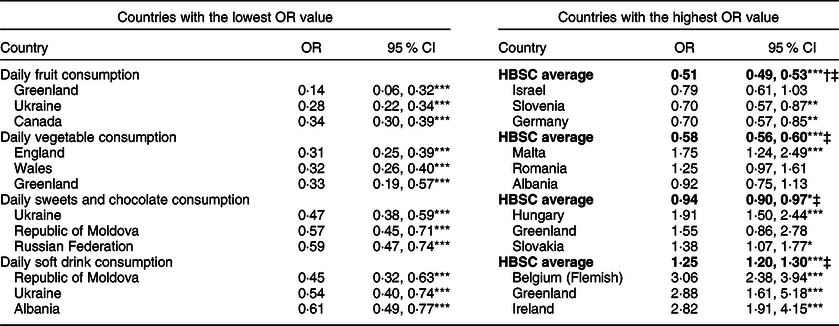
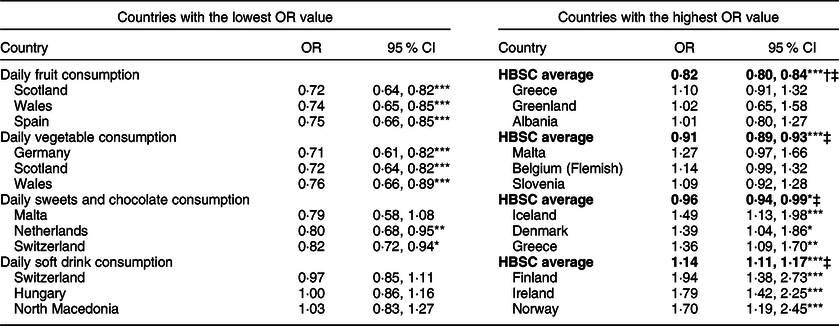
The results from a multivariate logistic regression analysis of family affluence-related inequality in and family structure-related inequality in adolescent eating behaviour are presented in Tables 4 and 5, respectively. After controlling for gender and age in the model of total sample, students who lived in the lowest family affluence group were significantly less likely to consume fruits daily (OR 0·51; 95 % CI 0·49, 0·53), vegetables daily (OR 0·58; 95 % CI 0·56, 0·60) and sweets and chocolate daily (OR 0·94; 95 % CI 0·90, 0·97), but were significantly more likely to consume soft drinks daily (OR 1·25; 95 % CI 1·20, 1·30), compared with their counterparts who lived in the highest family affluence group. Students who lived in a non-intact family were significantly less likely to eat fruits daily (OR 0·82; 95 % CI 0·80, 0·84), vegetables daily (OR 0·91; 95 % CI 0·89, 0·93) and sweets and chocolate daily (OR 0·96; 95 % CI 0·94, 0·99), but were significantly more likely to consume soft drinks daily (OR 1·14; 95 % CI 1·11, 1·17), compared with those who lived in families with both parents.
OR of daily consumption of selected foods comparing adolescents from the lowest and highest family affluence group: Health Behaviour in School-aged Children (HBSC) average and countries with the lowest and highest OR value
† Data weighted by country sample size.
‡ Bolded values are HBSC average.
* P < 0.05; ** P < 0.01; *** P < 0.001.
OR of daily consumption of selected foods comparing adolescents from non-intact and intact family: Health Behaviour in School-aged Children (HBSC) average and countries with the lowest and highest OR value
† Data weighted by country sample size.
‡ Bolded values are HBSC average.
* P < 0.05; ** P < 0.01; *** P < 0.001.
Across countries, a wide range of social inequality in daily eating of selected foods was observed (Tables 4 and 5 present results of the current analysis only for three countries with the lowest and highest inequalities selecting for each food type). Low FAS was uniformly associated with lower levels of fruit consumption among students in all countries. The OR measure of inequality, which was used to estimate the impact of family affluence on daily fruit eating, ranged from 0·14 (95 % CI 0·06, 0·32) in Greenland to 0·79 (95 % CI 0·61, 1·03) in Israel that was a distinguished country with not sufficient P-value of this association. Daily fruit consumption dropped significantly between intact and non-intact families in nineteen countries, and this tendency was seen in the majority of countries. A similar pattern was observed regarding vegetable consumption. Malta, however, stood out here, as the dependence of daily vegetable eating on family affluence was inverse than in most other countries.
Daily eating of sweets and chocolate differed according to FAS and family structure in a few countries, but no consistent pattern emerged for these social factors. There were several countries (e.g., Ukraine and Netherlands) where students from low-affluence families and non-intact families reported less eating of sweets and chocolate daily, and there was a consistent group of countries (e.g., Hungary and Iceland) where the students from the same kind of families reported to more eating of sweets and chocolate daily, in comparison to their counterparts elsewhere.
Soft drink consumption was significantly associated with FAS in approximately half of the countries surveyed; however, the value of this association varied noticeable across countries. There was a group of countries where the daily consumption of soft drinks was associated with high FAS; this pattern was strongest in Eastern Europe and the Baltic states. The reverse pattern was found in western and northern Europe; here the daily consumption of soft drinks was associated with low-affluence families. The frequency of daily soft drink consumption was higher among students from non-intact families compared with students from intact families in the majority of countries, and in around two-thirds of these countries a significant difference was detected.
An overview of the presented figures above indicates the possibility of correlation between estimated inequalities. Results from the Spearman correlation analysis of these estimations are presented in Table 6. With respect to inequalities due to family affluence, significant positive correlations were observed between inequalities in daily fruit and vegetable consumption, as well as between inequalities in daily sweets and chocolate consumption and daily soft drink consumption. In contrast, family affluence defined inequalities in daily vegetable and soft drink consumption were negatively correlated; this indicated that countries with a high inequality in vegetable consumption had a low inequality in soft drinks consumption. With respect to inequalities due to family structure, significant positive correlations were found between the same correlates as for the inequalities caused by family affluence, but the negative correlation was observed between inequalities in daily vegetable consumption and daily sweet and chocolate consumption. Any significant correlations were found between inequalities defined by family affluence and inequalities defined by family structure (results not shown).
Spearman correlations between inequalities in fruit, vegetable, sweets and chocolate and soft drink consumption among adolescents in forty-one Health Behaviour in School-aged Children countries
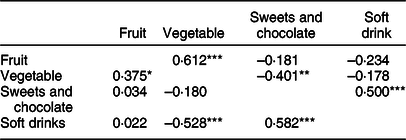
An upper triangle represents inequalities due to family structure, and lower triangle represents inequalities due to family affluence.
* P < 0.05; ** P < 0.01; *** P < 0.001.
Path analysis
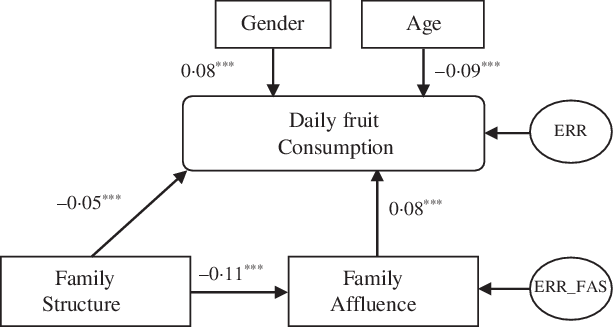
The path models were studied for daily consumption of each food type. Figure 1 represents an example of such models with assessments of the standardised regression weights that were calculated for daily fruit consumption from the total sample of the forty-one countries. Table 7 shows corresponding assessments and the goodness-of-fit statistics of models for remaining food types.
Path model of daily fruit consumption. Arrows indicate a direction of the association; the numbers are standardised regression weights (β). Estimations were done from the total sample of forty-one countries. ERR and ERR_FAS are other determinants that affect corresponding variables. *** P < 0·001
Standardised regression weights and model goodness-of-fit statistics in path models of daily fruit, vegetable, sweets and chocolate, and soft drink consumption in selected and all Health Behaviour in School-aged Children (HBSC) countries
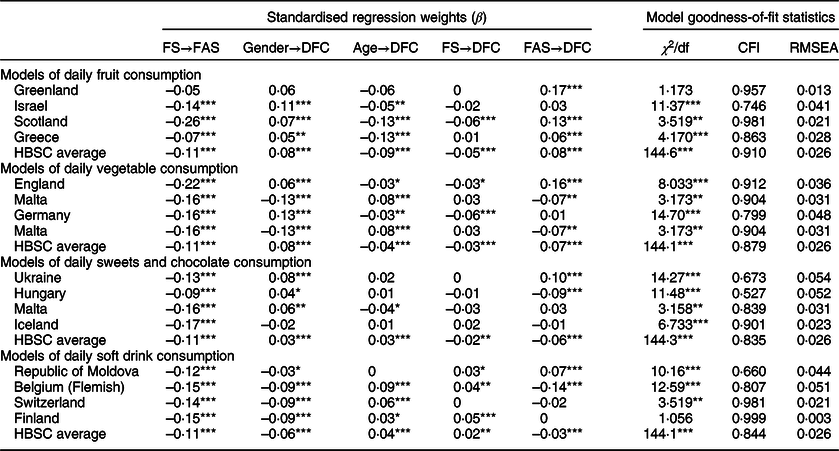
FS, family structure; FAS, family affluence score; DFC, daily food consumption; CFI, comparative fit index; RMSEA, root mean square error of approximation.
* P < 0.05; ** P < 0.01; *** P < 0.001.
Using the total sample of forty-one countries, the results of the path analysis were consistent with the data presented in Table 3. Standardised regression weights (β) indicated that girls were more likely than boys to report consuming fruits, vegetables, and sweets and chocolate daily but less likely to report consuming soft drinks. By age, fruit and vegetable consumption decreased but sweets and chocolate, as well as soft drink consumption increased. The non-intact family structure had a direct negative impact on daily fruit, vegetable, and sweets and chocolate consumption, but its effect was positive on daily soft drink consumption. FAS had a positive influence on daily fruit, vegetable, and sweets and chocolate consumption (e.g., if the FAS increased, daily consumption of these foods increased), but the corresponding relationship was inverse for soft drink consumption. In addition to these common findings, the path analysis revealed that a non-intact family, compared with an intact family, reduced FAS on average by 11 % (β = –0·11). In some countries (e.g., Scotland) this effect reached up to 26 %. Therefore, family structure was hypothesised to exert an indirect effect on daily food consumption through family affluence.
We were interested in the extent to which these models fit country data and the impact of each social factor on the inequality in daily food consumption for an individual country. For this purpose, from Tables 4 and 5, the countries that exhibited the highest and lowest social inequalities in daily food consumption were selected. Results from path analysis for these countries are shown in Table 6. In Greenland, the high inequality of daily fruit consumption was only due to differences in family affluence, whereas changes in family structure did not significantly influence the inequality; such a model was simple and well fit to national data. In Scotland, high inequality in daily fruit consumption due to family structure was observed; it can be seen that this inequality was due not only to the direct but also to the strong indirect effect of changes in family structure on the child’s nutrition. A similar pattern was observed in Germany’s data, explaining the high inequality in daily vegetable consumption related to changes in family structure. Considering soft drink consumption among students in the Republic of Moldova and Belgium (Flemish), non-intact families had the same consequences in both countries; therefore, the inequality in the consumption of soft drinks was related mainly to family affluence. The influence on daily soft drink consumption had opposite signs in the Republic of Moldova and Belgium (Flemish). The consumption of soft drinks among Swiss students was not related to family structure or family affluence. In Finland, inequality in soft drink consumption was strongly related to a non-intact family structure, although the latter factor reduced FAS.
The goodness-of-fit statistics for the models are included in Table 7. Due to the large sample size, the χ 2 statistic that assessed the magnitude of the discrepancy between the sample and fitted covariance matrices for several models indicated that the model and data were consistent (P > 0·05). However, for all path models tested in the current study, the main statistic RMSEA showed an acceptable model fit (RMSEA < 0·08), and it indicated a very good fit for the majority of the models (RMSEA < 0·05). For most models, comparative fit index statistics also showed an acceptable fit (comparative fit index > 0·9) or was close to the threshold.
Discussion
The current study examined family structure and family affluence-related inequalities in the consumption of fruits, vegetables, sweets and chocolate, and soft drinks among adolescents in forty-one countries. Inadequate or insufficient intake of fruits and vegetables was common among the study population. Many adolescents also ate sweets and drank soft drinks regularly. On average, only one-third of the adolescents reported consuming fruits and vegetables at least once a day, one in four respondents reported eating sweets and chocolate daily and one in five respondents reported drinking soft drinks daily.
Our results showed that adolescents from non-intact families were less likely to report daily fruit and vegetable consumption in almost all of the study countries, and in nearly half of the countries this effect was significant when compared with adolescents living with both parents. Such a result is logical, since coming from a non-intact family negatively affects family affluence, which, as we have seen, is directly related to the consumption of fruits and vegetables(Reference Costa, Menezes and Oliveira31–Reference Rasmussen, Pedersen and Johnsen35). The literature on the impact of the non-intact family on eating fruits and vegetables in adolescents is very scarce. The study by Pearson et al. (Reference Pearson, Atkin and Biddle36) among adolescents in the United Kingdom (England) revealed no significant association between family structure and any dietary behaviours. We also found several countries where no such association was found, but in the aforementioned England, non-intact family had a significant negative impact on adolescent fruit and vegetable consumption. Our study also showed that adolescents from non-intact families were more likely to drink soft drinks daily than their peers living with both parents; this pattern was significant in more than half of the countries. These findings were in line with the findings of Mauskopf’s et al. study(Reference Mauskopf, O’Leary and Banihashemi20), which showed that preadolescents with divorced parents consumed more sugar-sweetened beverages than preadolescents with married parents.
Family affluence also had a significant influence on adolescent eating habits, and it was, therefore, appropriate to evaluate their related inequalities regarding adolescent nutrition. This approach was based on the assumption that the relationship of adolescent nutrition and socio-demographic factors depended on the specific socio-cultural context(Reference Cullen, Baranowski and Rittenberry37-Reference Lazzeri, Ahluwalia and Niclasen40). It has been well documented in the literature(Reference Voráčová, Sigmund and Sigmundová3-Reference Zaborskis, Lagunaite and Busha6) that adolescents living in families with low SES consume less healthy diets that their counterparts living in families with high SES. Results from our study were in line with such conclusions in regard to fruit and vegetable consumption, showing daily intake of these foods less frequently among students from low-affluent families in almost all countries. Although there was a great variety to the degrees of inequality in fruit and vegetables consumption, there were no clear geographic patterns in such inequalities. It is also difficult to explain why in Malta alone students from low-affluence families were more likely to report regular eating of vegetables compared with their counterparts from highly affluent families. It is also interesting to note that family affluence-related inequalities in daily fruit and vegetable intake correlated positively, that is, in countries with high inequality in fruit eating, there was also significant inequality in vegetable eating. The family affluence-related inequality in daily sweets and chocolate, as well as soft drink intake, was not consistent across countries, but at the country level, a significant correlation between their values was identified. There were some countries where adolescents from low-affluence families consumed these foods less frequently, while there were also some countries with an inverse relationship. There were no clear geographic patterns for inequality in sweets and chocolate consumption, but inequality in soft drinks consumption differed noticeably between countries in Eastern Europe and the Baltic states (high intake in high-affluence families) and countries in Western and Northern Europe (high intake in low-affluence families). The pattern identified may be partially associated with availability and pricing contrasts of foodstuffs(Reference Costa, Menezes and Oliveira31,Reference Currie, Nic Gabhainn and Godeau41,Reference Mitchell42) . Soft drinks were among the first western goods to break into Eastern Europe and the Baltic states in the post-Soviet period, and yet their impact on health issues has not been appropriately discussed in health education in schools in these countries. This assumption is consistent with the strong negative correlation found at the country level between soft drink and vegetable consumption inequalities due to family affluence.
Gender and age differences were similar to other studies(Reference Inchley, Currie and Young1,Reference Currie, Zanotti and Morgan2,Reference Myszkowska-Ryciak, Harton and Lange43,Reference Lipsky, Nansel and Haynie44) , in the sense that healthier consumption habits occurred among the girls as they more often ate fruits and vegetables and consumed less soft drinks. Adolescents’ eating habits worsened with age; the frequency of eating fruits and vegetables daily decreased with age, whereas the frequency of eating sweets and drinking soft drinks daily increased with age.
Finally, the path model was helpful in providing a more comprehensive understanding of the relationships between social determinants and allowed an assessment of the impact of each determinant on adolescent eating behaviour. The analysis showed that in most of the countries, dietary inequality was more pronounced for family affluence than for family structure. Moreover, family affluence was hypothesised to mediate the relationship between family structure and adolescent eating habits. This hypothesis was confirmed in all national samples and in the total sample of all countries. One possible explanation for mediating pathway is the negative influence of non-intact family on the material and psychological wealth of the family. Such an influence was confirmed in different studies(Reference Anderson13,Reference Shibeshi15-Reference Edwards18) . There is not much literature on adolescent dietary studies using path analysis. For example, Pettigrew et al. (Reference Pettigrew, Jongenelis and Miller45) used this method to elucidate factors that increase the propensity of children to consume unhealthy food. Another study(Reference Adamo, Papadakis and Dojeiji46) investigated the complex effect of family income and parental education on a child’s nutrition; its results showed that fruit and vegetable consumption was only related to family income.
Overall, the results of the present research are a step forward to filling the gap of mapping health inequalities in the context of social determinants in youth. Particularly, they provided a better understanding of the mechanism that links family structure and family affluence and how it influences adolescent eating behaviour. Different initiatives for reduction of family structure and family affluence-related inequalities should therefore be considered in order to make effective interventions to promote healthy eating in the young population.
Methodological considerations
The current study had several strengths. First, it utilises data from the HBSC survey, which collects longitudinal data worldwide on adolescent behaviour. Another strength is the fact that data from forty-one countries are analysed in the current study, which allows for a broader understanding of eating behaviour among adolescents worldwide. Although the sample size and methodology of the current analysis strengthen the findings, there are several limitations to the study. First, because of the cross-sectional design of the HBSC study, our study is limited in terms of its potential to establish causal inferences about the relationships observed. Longitudinal studies should be conducted in order to expand the understanding of the relationship between social determinants and eating behaviour outcomes. Second, food choice may be influenced by a number of additional social and economic factors, such as parental occupation, education level and place of residence (urban/rural) that were not available in our data. It is worthwhile to explore these factors in future studies on social family environment-related inequality in adolescent eating behaviour. Third, food consumption data were collected using a self-reported FFQ. In this measure, adolescents may have overreported consumption of healthy foods and underreported consumption of unhealthy products due to social pressure(Reference Moore, Tapper and Moore47). The use of self-report data on socio-economic characteristics may also have introduced response bias that we were not able to account for. The analysis was still controled by gender and age, as only two of these counfounders were available in all country data. Finally, in path analysis we were interested in the relative strengths of coefficients. However, path analysis will correctly estimate the relative strengths of competing factors only for the model under consideration. While such analysis offers structured models that may underlie hypotheses, it cannot by itself confirm or disprove the existence of causal relationship(Reference Čekanavičius and Murauskas28).
Conclusions
Among adolescents in European countries, Canada and Israel, there was a high level of family structure and family affluence inequalities in daily food consumption. In most countries, adolescents living in non-intact and low-affluent families were less likely to consume fruits and vegetables daily. With regard to daily consumption of sweets and chocolate, as well as soft drinks, such a pattern was not consistent.
Overall, the results of the present study provided a better understanding of the mechanism that links family structure and family affluence and how it influences eating behaviour among adolescents across different countries. Therefore, country-specific initiatives for reduction of family structure and family affluence-related inequalities should be considered in national policy in order to make effective interventions to promote healthy eating in the young population. Future research could be used to assess the impacts of other family determinants on adolescent eating behaviour in cross-national perspective, and ideally with longitudinal studies.
Acknowledgements
Acknowledgements: The HBSC study is an international study carried out in collaboration with WHO (Europe). Professor Candace Currie from the University of St. Andrews, United Kingdom served as the international coordinator of the 2013–2014 survey, and Professor Oddrun Samdal from Bergen University, Norway served as the international databank manager. The principal investigators in each of the forty-one countries were responsible for the HBSC survey undertaken in their country. Financial support: Data collection was funded by each of the participating countries and regions separately. The analysis of data and preparation of the manuscript received no specific grant from any funding agency, commercial or not-for-profit sectors. Conflict of interest: The authors declare that they have no competing interests. Authorship: A.Z. made substantive intellectual contribution to the conception and design of the manuscript and carried out the statistical analysis. M.G. was involved in national data collection and carried out the drafting of the manuscript. A.K. conducted a literature analysis, which is included in the manuscript. R.T. substantially improved the content and provided the final edition of the manuscript. All authors read and approved the final manuscript. Ethics of human subject participation: The current study was conducted in accordance with the Declaration of Helsinki. All procedures, involving research study participants, were approved by each national ethics committees according to the national guidance and regulations at the time of data collection. Additionally, written informed consent for participation in the study was sought from parents of the adolescents.



