INTRODUCTION
The postwar rise of Japan is one of the most dramatic cases of rapid economic development in modern history. Only a decade after suffering total military defeat, Japan returned to its pre-war standard of living. More remarkable, Japan's growth accelerated after this initial recovery period. The average growth rate from 1945 to 1958 was 7.1 percent, whereas it was 9.5 percent from 1959 to 1970, according to the most widely used comparative and historical data on GDP (Bolt and Van Zanden Reference Bolt and van Zanden2014).Footnote 1 The official data published by Japan's Cabinet Office also show that the real GDP growth rate was 6.8 percent in 1956, 8.1 percent in 1957, and 6.6 percent in 1958. Then, it sharply increased to 11.2 percent in 1959, 12.0 percent in 1960, 11.7 percent in 1961, and so on. From 1959 to 1970, the growth rate was above 10 percent in eight (out of 12) years.Footnote 2 As a result of this growth spurt, by 1970 Japan boasted the third largest economy and ranked among the most developed countries in the world. As Babones (Reference Babones2011, 81) points out, Japan is the only large country with a diversified economy that has risen from a below-average level of development to the upper tier of the world economy.
Why did Japan experience such a remarkable growth spurt?Footnote 3 Numerous economists, political scientists and historians have examined Japan's economic growth, in particular its growth acceleration, and have stressed different factors, but the bulk of the literature tells some version of the following story (e.g. Amsden Reference Amsden2001; Calder Reference Calder1988; Denison Reference Denison1976; Dower Reference Dower1979; Gao Reference Gao2001; Johnson Reference Johnson1982; Kōsai Reference Kōsai1986; Nakamura Reference Nakamura1995; Nishimizu and Hulten Reference Nishimizu and Hulten1978; Samuels Reference Samuels1987; World Bank 1993). In the 1950s and 1960s, a coalition of Japanese bureaucrats and businesspersons set Japan on a path of export-led growth, buoyed by massive domestic investment, foreign technology acquisition, protectionist barriers, and well-designed industrial policies. As a result of these far-sighted policies, economic growth accelerated dramatically and Japan ascended to the heights of the world economy.
On the other hand, some scholars argue that this conventional wisdom is incomplete (e.g., Forsberg Reference Forsberg2000; LaFeber Reference LaFeber1997; Miller Reference Miller2012; Pempel Reference Pempel and Woo-Cumings1999; Schaller Reference Schaller1997; Shimizu Reference Shimizu2001). According to these scholars, the success of Japan's economic policies depended on Japan's close alliance with the most powerful country in the world—the United States. Specifically, high investment rates required an abundance of capital, export-oriented growth required dedicated buyers, and technology-acquisition and protectionist policies necessitated a tolerant international community. Japanese policymakers could not take any of these growth ingredients for granted. Fortunately for them, American leaders were both willing and able to provide Japan with such advantages, because US foreign policy during the early Cold War prioritized the cultivation of strong anti-communist allies. Japan still might have developed without American patronage, but it is unlikely that it would have developed as quickly or thoroughly.
Policy makers, political scientists, economists, historians, and journalists on both sides of the Pacific have told this story, but no study has yet tested it with modern statistical methods. This lack of systematic evaluation is understandable because there is no suitable comparison unit—a country sufficiently similar to Japan in many respects except in terms of its relationship with the United States—to serve as a valid counter-factual case.
To overcome this methodological challenge, we employ a new statistical tool—the synthetic control method—developed by Abadie and Gardeazabal (Reference Abadie and Gardeazabal2003) and Abadie, Diamond, and Hainmueller (Reference Abadie, Diamond and Hainmueller2010, Reference Abadie, Diamond and Hainmueller2015). Specifically, we use data from other countries to construct a “synthetic” Japan whose growth trajectory closely resembles that of Japan before it consolidated its security relationship with the United States, a process that began in June of 1957, accelerated substantially in 1958, and culminated with the signing of a new security treaty on January 19, 1960. We then compare this synthetic Japan's economic trajectory with Japan's actual economic experience after the consolidation of the relationship with the United States. The results suggest that while Japan's average annual growth rate was 9.3 percent from 1958 to 1968, the synthetic Japan only grew at 3.6 percent per year.
These findings have important implications for the field of political economy. In particular, our results suggest that geopolitical context plays an essential but often overlooked role in shaping cross-national patterns of economic development. Japan's postwar economic growth “miracle” is often cited as clear evidence of the virtues of the “East Asian model,” an ambitious growth blueprint that entails considerable state-intervention in the economy. Our results, however, indicate that the success of Japan's economic model, an allegedly effective and generally applicable model, required exceptional international circumstances that no longer exist and are unlikely to return anytime soon. If this is the case, then developing countries today may need to eschew textbook models derived from Japan's Cold War experience in favor of more modest reforms tailored to their specific geopolitical circumstances.
This paper proceeds in three sections. First, we review the history of the US–Japan relationship from the early 1950s to the late 1960s and argue that a sequence of events in the late 1950s, particularly in 1958, was an important historical turning point for Japan's growth spurt. Second, we introduce our statistical methods and present the empirical results. Finally, we discuss the implications of our results for development policy.
A HISTORICAL TURNING POINT IN THE LATE 1950S
On January 19, 1960, the United States and Japan signed a revised alliance treaty that formally committed the United States to defend Japan from external aggression. This treaty, however, was the culmination of several years of negotiations and policy changes that began in June of 1957 and accelerated significantly in 1958. Although Japan was the focal point of US security strategy in Asia throughout the 1950s, American leaders did not extend a security guarantee to Japan until the end of the decade, and the US–Japan relationship was plagued by economic and diplomatic conflicts prior to that point. In this section, we describe the evolution of US–Japan relations in the 1950s and explain how the sudden shift in the relationship in 1958 affected Japan's subsequent economic growth.
The Sudden Shift in US–Japan Relations
After defeating Japan in World War II, the United States disbanded the Japanese military and assumed administrative control of the country. In 1951, the United States and Japan signed the San Francisco Peace Treaty, which officially restored Japan's sovereignty. From a Japanese perspective, however, this treaty “was only a modest step from occupation” (Destler et al. Reference Destler, Clapp, Sato and Fukui1976, 13; also see Miller Reference Miller2012, 88–92). The treaty gave the United States the right to station American troops in Japan and to use those troops to quell domestic disturbances, but did not provide Japan with a formal US security guarantee. The unequal nature of the treaty, plus several high-profile incidents in which Japanese citizens were killed by US military personnel—e.g. the Lucky Dragon incident in which the fallout from a US nuclear test killed a Japanese fisherman, and the Girard incident in which a US soldier shot and killed a Japanese woman—aroused widespread Japanese contempt for the US presence and the broader US–Japan relationship.
This discontent was fueled by the fact that the Japanese economy in the early- to mid-1950s was “treading water, not moving forward” (Forsberg Reference Forsberg2000, 83; also see Kim Reference Kim1997, 156; Mochizuki Reference Mochizuki, Iriye and Wampler2001, 16; Schaller Reference Schaller1997, 57). US procurement orders during the Korean War helped boost Japan's GDP back to pre-war levels (Welfield Reference Welfield1988, 90; also see Calder Reference Calder1988, 43; Dower Reference Dower1979, 315), but the “gift” of the wartime boom came with the “dagger” of inflation, shortages of raw materials (Dingman Reference Dingman1993), and a “distorted” economy that “cannot function without depending on special procurements” (Economic White Paper of Japan 1953, quoted in Uchino Reference Uchino1983, 75; also see Samuels Reference Samuels1994, 146–148). In the mid-1950s, the United States did little to help Japan diversify its economy; in fact, in 1956 and 1957 the United States pressured Japan to implement a set of voluntary export restraints that the US Ambassador to Japan described as “about as voluntary as your doing something if you've got a pistol pointed at your head” (quoted in Forsberg Reference Forsberg2000, 212).
By the mid-1950s, American officials were becoming increasingly aware that US policy was failing to produce a strong alliance. The US National Security Council (NSC) issued reports documenting Japan's “creeping neutralism” and “tendency to drift away” from alignment with the United States (LaFeber Reference LaFeber1997, 314; Schaller Reference Schaller1997, 114). After a series of conflicts over Japanese rearmament, the US ambassador to Japan reported to the Secretary of State that
Japan does not consider itself an ally or partner with the United States but rather a nation which for the time being is being forced by circumstances to cooperate with the United States and which intends … to wring out of this relationship every possible advantage at minimum cost (US Department of State 1952–1954, 1714–1715).
Indeed, in 1956, Japanese Prime Minister Hatoyama IchirōFootnote 4 normalized Japanese diplomatic relations with the Soviet Union and sought to forge new economic links between Japan and Communist China (Forsberg Reference Forsberg2000; LaFeber Reference LaFeber1997; Schaller Reference Schaller1997; Swenson-Wright Reference Swenson-Wright2005).
By the start of 1957, the US–Japan relationship was fraught with tension, and US leaders worried that they were losing their main foothold in Asia. As the NSC noted in 1957, the “major US objective—a firm alliance in the Pacific—is not being achieved” (Schaller Reference Schaller1997, 130). In January 1957, Ishibashi Tanzan became Prime Minister and declared his intention to normalize Japan's relations with Communist China, another blow to American hopes for an active and strong US–Japan relationship.
The next month, however, Ishibashi became seriously ill and was replaced as Prime Minister by Kishi Nobusuke,Footnote 5 a staunch anticommunist and advocate of close relations with the United States. Kishi was a former member of Japan's cabinet during World War II and an accused Class A war criminal. Yet, he endeared himself to US officials because of his willingness to crack down on leftist activism, his disdain for the Soviets, and his willingness to curtail Japan's economic links with China (LaFeber Reference LaFeber1997, 135; Schaller Reference Schaller1997, 315). Secretary of State John Foster Dulles described Kishi as “the strongest government leader to emerge in postwar Japan” (US Department of State 1955–1957, 346–347), and Douglas MacArthur II, the US ambassador to Japan, said Kishi was “by far the best leader in sight in terms of US objectives” (US Department of State 1955–1957, 271). Reiterating that Kishi presented new and important opportunities, MacArthur II argued, “[W]e have at last an able leader of Japan. [Kishi] indicates he wants to make a bold new start with us … I think we can do business with him” (quoted in Miller Reference Miller2012, 224). This sudden and unexpected change in Japanese leadership from Ishibashi to Kishi opened up the possibility for a new US–Japan relationship, and both sides seized the opportunity.
In June 1957, Kishi made a state visit to the United States. During the visit, American officials made several major concessions, including withdrawing a large number of US troops to assuage the outcry prompted by the Girard incident, and more importantly, opening the possibility of renegotiating the US–Japan security treaty, which the Japanese had first requested in 1955. This shift showed US officials’ desire to strengthen the US–Japan relationship and to secure Kishi's political standing in Japan (US Department of State 1955–1957, 485–535; also see US Department of State 1958–1960, 23). In a joint statement, Kishi and Eisenhower declared they were “convinced that relations between Japan and the United States are entering a new era firmly based on common interests and trust” (emphasis added). Other US officials echoed this sentiment, characterizing Kishi's visit as a “bold new start” that would usher in a “new era” in the bilateral relationship (US Department of State 1955–1957, 328–375). Formal negotiations for a new security treaty began in 1958.
The Economic Consequences of the US–Japan Alliance
The security treaty negotiations in 1958 were accompanied by various economic initiatives designed to facilitate Japan's economic growth. American leaders were driven by “the conviction that economic growth by strategic allies would defuse the potential appeal of anticapitalist ideologies” (Pempel Reference Pempel and Woo-Cumings1999, 174) and decided to “promote Japan as a bulwark, if not a base camp, against communist encroachments” in Asia (Encarnation and Mason Reference Encarnation and Mason1990, 37; also see Miller Reference Miller2012, 204). Importantly, these major economic initiatives, which we describe below in detail, to strengthen Japanese economy took place within a short period of time, mostly in 1958.
First, the United States orchestrated a series of low-interest loans to Japan (Calder Reference Calder1988, 89; Welfield Reference Welfield1988, 90). By the mid-1950s, Japan had faced a scarcity of capital necessary for active domestic investments. As a result of US efforts, however, foreign loans to Japan doubled in 1958, most of which came from the World Bank, “which the United States dominated,” as well as the US Export-Import bank and American banks, which started “to play a major role as capital supplier[s] in the development of Japanese utilities and heavy industry” (Calder Reference Calder1988, 89–90). Such capital injections spurred a dramatic increase in Japanese investment, one of the key variables in a standard economic growth model (e.g., Solow Reference Solow1956, Reference Solow1957).
Second, the Eisenhower administration approved a reduction in Japanese defense spending, specifically Japan's financial support of US forces (US Department of State 1958–1960, 1–3). More broadly, American policymakers refrained from pressuring Japan to further develop its military, a major shift from the first half of the 1950s. As a result, Japanese defense spending as a share of GDP declined by 20 percent between 1958 and 1960, the sharpest shift of the entire post-war era, and continued to decline thereafter, falling below 1 percent of GDP by 1970 (Calder Reference Calder1988, 415, 431–432). In essence, the United States allowed Japan to “tur[n] inward and ma[k]e economic growth and the pursuit of affluence its highest priorities” (Sasaki Reference Sasaki1991, 2). This US policy shift allowed Japan to “minimize expenditures for its own defense and … allocate its scarce resources mostly to expand its private sector …. Consequently, Japan's economic growth was considerably accelerated” (Shibuya, Maruyama, and Ito Reference Shibuya, Maruyama, Ito, Shibuya, Maruyama and Yasaka2002, 4). Indeed, Patrick and Rosovsky (Reference Patrick, Rosovsky, Patrick and Rosovksy1976) estimate that Japan's economy would have been 30 percent smaller by 1976 if it had shouldered its own defense burden.
Third, the United States helped promote Japanese exports. Japan had become a member of General Agreement on Tariffs and Trade (GATT) in September 1955, but 14 of the 32 members refused to grant most-favored-nation status to Japan, and the remaining 18 members “established stand-by measures … to protect their industries in the event Japanese imports [threatened] their domestic industry” (Shimizu Reference Shimizu2001, 156). As a result, the GATT agreement was “slight in substance,” and Japan's balance-of-payment deficit spiraled to dangerous levels in the mid-1950s (Forsberg Reference Forsberg2000, 5, 150–168). US leaders like Ambassador Douglas MacArthur II worried that Japan would be “forced into some form of economic accommodation with [the] Communist Bloc” if the United States did not provide an outlet for Japanese exports (US Department of State 1958–1960, 4). To prevent this outcome, the Eisenhower administration (and subsequently the Kennedy and Johnson administrations) resisted protectionist demands from US interest groups and worked to open the US market to Japanese goods.
Specifically, in 1958, US and Japanese business leaders established the Joint Committee on US–Japan Trade, and Japan sent its first government-funded trade mission to the United States. Eisenhower also used the flexibility given by the US Trade Act of 1958, which authorized the president to lower tariffs by 20 percent and gave him four years of enhanced authority to negotiate trade deals, to expand US–Japanese trade (Forsberg Reference Forsberg2000, 218–219). Many US industries called for protection from Japanese goods, but “the Eisenhower administration successfully deflected most of the pressure for restrictions on Japanese imports” (Forsberg Reference Forsberg2000, 225). For example, during a closely watched discussion over imports of Japanese-made stainless-steel flatware in 1958, the Eisenhower administration resisted business pressure for increased tariffs by instead proposing that Japan accept a slightly lower Voluntary Export Restraint (VER) (Forsberg Reference Forsberg2000, 218–225; Shimizu Reference Shimizu2001, 167–170).
As a result of these deliberate US policies to boost Japan's exports, American purchases from Japan increased by more than 150 percent from 1958 to 1960, giving Japan its first-ever trade surplus (Forsberg Reference Forsberg2000, 218; Shimizu Reference Shimizu2001, 3). Over the subsequent decade, the United States absorbed more than 30 percent of Japan's exports, a situation comparable to Bulgaria's export dependence on the Soviet Union (Hunsberger Reference Hunsberger and Cohen1972, 134; Pempel Reference Pempel and Woo-Cumings1999, 177). Such aggressive exports from Japan to the US increased profits and thus mitigated Japan's balance-of-payment constraint for further investment and productivity growth (McCombie and Thirlwall Reference McCombie and Thirlwall1994).
Finally, fearing the growing popularity of the Japanese Socialist Party (JSP), the United States intervened financially in Japanese politics. Evidence in a variety of open and (according to scholars who have seen them) still-classified US government documents shows that the Eisenhower administration, through the Central Intelligence Agency, began providing millions of dollars in secret campaign funds to Kishi and other Liberal Democratic Party (LDP) politicians in early 1958 as part of their larger goal of rebuilding the US–Japan alliance (Johnson Reference Johnson1995; LaFeber Reference LaFeber1997, 312–337; Samuels Reference Samuels2001; Schaller Reference Schaller1997, 130–35; Schaller Reference Schaller, Irie and Wampler2001, 46). American officials—including Alfred C. Ulmer, Jr., the CIA's operations chief for East Asia from 1955 to 1958; Roger Hilsman, the head of Intelligence and Research at the State Department in the Kennedy and Johnson administrations; Norbert A. Schlei, a legal adviser in the Kennedy and Johnson administrations; and U. Alexis Johnson, American ambassador to Japan from 1966 to 1969—have publicly acknowledged making or authorizing millions of dollars in payments to LDP politicians. US officials believed that US security and the efficacy of the US–Japanese alliance rested on “a conservative political hegemony within Japan” (Schaller Reference Schaller1985, 122; Johnson Reference Johnson1995). Scholarly research (e.g., Alesina, et al. Reference Alesina, Ozler, Roubini and Swagel1996) suggests that maintaining political stability was another likely determinant of Japan's economic growth spurt.
It should be noted that the alliance consolidation process was far from smooth. Kishi's determination to ram the ratification of the revised security treaty through the Diet, especially on the heels of his push for a highly controversial police bill in 1958, gave Japanese citizens the impression that Kishi was reviving the pre-war authoritarian state (Calder Reference Calder1988, 88). When the Socialist party tried to stop voting in the Diet on the revised security treaty, Kishi ordered 500 policemen to remove them; the Diet then passed the treaty in the absence of the opposition. In response to both the treaty and Kishi's actions, socialists, labor unions, anti-base groups, and student groups helped organize massive protests and strikes that brought millions of Japanese to the streets in June 1960 (Kapur Reference Kapur2011, 13). In the face of such a large public outcry, Kishi resigned after the new security treaty passed through the Diet, and Eisenhower canceled his planned trip to Japan to celebrate the signing of the new treaty (Packard Reference Packard1966).
Despite this turmoil in 1960, however, the strategic bargain between the United States and Japan persisted and economic ties continued to flourish. By focusing on economic growth, Japan's new Prime Minister, Ikeda Hayato, sought to overcome the contentious politics of the 1950s. In particular, in November 1960, Ikeda announced his ten-year Income Doubling Plan, which grew out of an earlier 1957 plan that combined domestic and international factors (Metzler Reference Metzler2013, 199). Economic interactions also remained central to the US–Japan alliance; in 1961 the Kennedy administration passed several trade expansion initiatives that lowered tariffs on a broad range of Japanese products and allowed Japan to raise textile exports to the United States by 5 percent, all part of Kennedy's public pledge to assist Ikeda's Income Doubling Plan (Schaller Reference Schaller1997, 177–183). As Forsberg concludes, “the US desire to consolidate the Cold War alliance provided Japan the opportunity to crack the lucrative American market, and Japanese industry seized the moment” (Forsberg Reference Forsberg2000, 230).
In sum, Japan profited tremendously from the consolidation of the US–Japan alliance. By the end of the 1960s, however, American leaders, facing a costly war in Vietnam, an expanding trade deficit, and tepid economic growth, had become less tolerant of Japan's privileged position in US economic and security policy. In 1969, President Nixon pulled tens of thousands of US soldiers out of Asia and declared that US allies would have to “assume the primary responsibility of providing the manpower for [their] defense.”Footnote 6 In 1971, the Nixon administration abandoned the dollar's peg to gold and imposed a 10 percent surcharge on imports. Nixon later described these policies as an effort to “stick it to the Japanese” (Quoted in Hoff Reference Hoff1994, 140). Indeed, they marked “the beginning of the end of the special dependency relationship that had prevailed between the United States and Japan” (Schaller Reference Schaller1997, 245). Japan was forced to revalue its currency, and Japanese leaders “could no longer count on transferring many of the economic consequences of their domestic policies onto the United States, nor could they even anticipate world economic conditions that would allow them to continue their prior policies of high growth” (Pempel Reference Pempel1987, 282).
Not coincidentally, Japan's annual economic growth rate plunged from 10 percent (the 1960s average) to 3 percent in 1971, where it remained until the 1980s when it declined still further. To be sure, other factors help explain why Japanese growth decelerated in the 1970s, among them the surge in oil prices after the 1973 OPEC crisis. The correspondence between the downturn in US–Japan relations and the end of rapid Japanese growth, however, is consistent with the argument that the formation and strengthening of the US–Japan alliance in the early decades of the Cold War played a crucial role in facilitating Japan's exceptional economic performance.
EMPIRICAL TESTS
If the consolidation of the US–Japan alliance was a key factor behind Japan's economic miracle, then this consolidation should coincide with the start of Japan's growth acceleration. In this section, we test this observable implication with a non-parametric approach known as the synthetic control method (Abadie and Gardeazabal Reference Abadie and Gardeazabal2003; Abadie, Diamond, and Hainmueller Reference Abadie, Diamond and Hainmueller2010, Reference Abadie, Diamond and Hainmueller2015). We first introduce this method. After showing the results of estimation and placebo tests, we discuss possible alternative interpretations of the estimated effects.
The Synthetic Control Method
To study the consequences of major historical events, scholars typically do what we did in the previous section; namely, they describe the chronology of events and highlight certain quotations and coincidences as evidence of a causal story. Such qualitative process-tracing is valuable, but it provides only suggestive evidence and is therefore an inadequate method to answer the key counter-factual question necessary for causal identification: What would have happened in the absence of the critical event?
To address this problem, we use a non-parametric statistical method developed by Abadie and Gardeazabal (Reference Abadie and Gardeazabal2003) and Abadie, Diamond, and Hainmueller (Reference Abadie, Diamond and Hainmueller2010, Reference Abadie, Diamond and Hainmueller2015). Their “synthetic control” method uses data from multiple comparison units to construct a single, synthetic comparison unit that resembles the unit of interest before it experienced a critical event. Previous studies have used this method to examine the effect of the outbreak of terrorism in the late 1960s on per capita GDP in the Basque Country in northern Spain (Abadie and Gardeazabal Reference Abadie and Gardeazabal2003), the effects of economic liberalization on per capita GDP in a worldwide sample of countries (Billmeier and Nannicini Reference Billmeier and Nannicini2013), the effect of the German reunification in 1990 on West Germany's per capita GDP (Abadie, Diamond, and Hainmueller Reference Abadie, Diamond and Hainmueller2015), the effect of the outbreak of the 2000 Palestinian Intifada on Israel's per capita GDP (Horiuchi and Mayerson Reference Horiuchi and Mayerson2015), and many others (see Craig Reference Craig2015 for a review).We use this method to compare the growth trajectory of Japan vis-à-vis that of a “synthetic” Japan. If the consolidation of the US–Japan alliance had substantial economic ramifications, then the economic trajectories of Japan and the synthetic Japan should be similar until 1958 and then diverge thereafter.
Three important remarks are in order. First, although the US and Japan formally signed the revised security treaty on January 19, 1960, the historical documents presented in the previous section show that the economic groundwork for the alliance was laid in 1958.Footnote 7 For this reason, we use 1958 as the year of “intervention” (or “treatment”) rather than 1960.Footnote 8
Second, the policy changes in 1958 constituted a sudden and major shift in US–Japan relations and thus function methodologically as a valid treatment for the synthetic control method. As we emphasized in the previous section, the nature of US–Japan relations changed unexpectedly in 1957 when Ishibashi Tanzan became ill and was replaced as prime minister by Kishi Nobusuke. Kishi's visit to the United States in June 1957 spurred a series of major economic agreements in 1958. In this regard, our application of the synthetic control method is similar to those used in other studies that have examined the effects of sudden incidents (e.g., terrorist attacks) or major policy changes (e.g., the German reunification, the introduction of tobacco controls) on economic growth. None of these events were totally random exogenous shocks, but the synthetic control method has nevertheless demonstrated to be a helpful way to analyze their effects in conjunction with qualitative evidence and traditional counter-factual analyses.
Finally, strictly speaking, our statistical analysis only allows us to examine whether some events in 1958 set Japan on a higher growth trajectory. As we discussed in the previous section, the efforts to consolidate the US–Japan security relationship fundamentally altered Japan's economic prospects. We therefore regard the alliance as the most likely driver of Japan's growth acceleration after the late 1950s. At the end of this section, however, we discuss several alternative events that may have triggered the growth takeoff.
Specifications
Following the studies cited above, we use per capita GDP as our outcome variable. The data comes from the Maddison Project (Bolt and Van Zanden Reference Bolt and van Zanden2014), which is the only dataset that provides the estimated GDP and population for many countries for a sufficiently long time-period. Another data set commonly used to study variations in GDP across countries and over a long time-period is the Penn World Table (Feenstra, Inklaar, and Timmer Reference Feenstra, Inklaar and Timmer2015).Footnote 9 The period of coverage, however, is from 1950, only eight years before the year of intervention (in 1958). Abadie, Diamond and Hainmueller (Reference Abadie, Diamond and Hainmueller2010, 495) show that a longer pre-treatment period is necessary to improve the accuracy of estimation. In this regard, the Penn World Table is not suitable for our analysis.Footnote 10
Specifically, the period of investigation for our analysis is from 1920 to 1969. As we noted earlier, we use 1958 as the treatment year. Our post-treatment period (including 1958) spans 11 years, from 1958 to 1968. We do not extend the post-treatment period beyond these years (say, from 1958 to 1978), because as we discussed earlier, the US–Japan relationship deteriorated in the late 1960s in part due to the post-treatment outcome (i.e., the growth acceleration in the 1960s) itself.Footnote 11 Indeed, Japan's growth acceleration and resulting trade surplus with the United States was one of the factors that drove the Nixon administration to end some of the economic perks that the United States was providing Japan.
The synthetic control method makes a weighted-average comparison unit based on two steps. The initial step is to choose countries, and the second is to choose a set of predictors to assign optimal weights. For the first step, to avoid an arbitrary selection,Footnote 12 we use as many countries included in the Maddison Project as possible, as a “donor pool” (i.e., the base set of countries, not all of which could be chosen to construct a synthetic control). Some of these donor countries experienced post-war economic and/or military assistance from the United States during the period of investigation, but none of them experienced a dramatic and sudden consolidation of security and economic alliance with the US in the late 1950s.Footnote 13 Specifically, we include the following 48 countries in our donor pool: Argentina, Australia, Austria, Belgium, Brazil, Bulgaria, Canada, Chile, Colombia, Costa Rica, Cuba, Czechoslovakia, Denmark, Ecuador, El Salvador, Finland, France, Germany, Greece, Guatemala, Honduras, Hungary, India, Indonesia, Ireland, Italy, Malaysia, Mexico, Netherlands, New Zealand, Nicaragua, Norway, Peru, Philippines, Portugal, Singapore, South Korea, Spain, Sri Lanka, Sweden, Switzerland, Taiwan, USSR, the United Kingdom, United States, Uruguay, Venezuela, and Yugoslavia.
Second, we choose a set of predictors to assign optimal weights. Formally, we have a sample of J + 1(= 49) countries, where j = 1 is the “treated unit” (i.e., Japan) and units j = 2 to j = J + 1 are comparison units in the donor pool. We construct a synthetic Japan using a weighted average of the countries in the donor pool, represented by a (J × 1) vector of weights W = (w 2, … w j +1)′ with 0 ≤ w j ≤ 1 for j = {2, … ,J + 1} and w 2+ … +w j +1 = 1. This vector is estimated by the constrained optimization with a set of “predictors” that are not influenced by the treatment but are expected to affect the post-treatment trajectory of Japan's per capita GDP.Footnote 14 With these predictors, countries that are not sufficiently similar to Japan are assigned zero or small weights.
In selecting predictors, we confronted a challenge: data on standard predictors of economic growth, such as measures of investment, consumption, human capital, trade openness, and inflation are only available from 1950 onwards for a large set of countries.Footnote 15 Therefore, we use several alternative variables as predictors.
First, we add variables representing the growth of each country's economy and population prior to 1958. The economic growth variable is calculated by dividing each country's level of per capita GDP in 1957 by the level of its per capita GDP in 1945. The population growth variable is calculated in the same manner. These two variables are essential in characterizing each country's post-war economic recovery.
Second, following previous studies applying the synthetic control method, we include three lagged outcome variables. First, the average per capita GDP during the entire pre-intervention period (i.e., from 1920 to 1957) is necessary to give higher weights to countries that are similar to Japan, on average, with regard to the level of economic development. Furthermore, we add per capita GDP in 1944, the year in which Japan's catastrophic economic disasters started, and per capita GDP in 1958, the year of the intervention, both of which are used to improve the construction of the synthetic control.Footnote 16
Finally, we use a dummy variable indicating whether or not a country was a member of the United Nations (UN) as of its foundation in 1945. Japan and other defeated nations were initially excluded from the UN, a fact that testifies to their unique and inauspicious geopolitical circumstances at the start of the postwar era.
Main Results
As long as the model specifications (i.e., the selections of a donor pool, predictors, and the length of a pre-treatment period) are valid, we should obtain a synthetic control that provides a good fit for the treated unit during the pre-treatment period. The top panel in Figure 1 shows that this is indeed the case. It compares the trajectories of per capita GDP between Japan (black line) and the synthetic Japan (gray line). The two lines are almost exactly the same until 1958. Then they begin to diverge and continue to do so at an increasing rate until the end of the period of investigation. This result is consistent with the historical narrative sketched out in the previous section: Kishi's June 1957 visit to the United States set in motion plans for a new and more robust US–Japan relationship, which developed during 1958, culminated in the signing of the revised security treaty, and persisted throughout the 1960s.
The Effect of Intervention in 1958 in Japan on Per Capita GDP
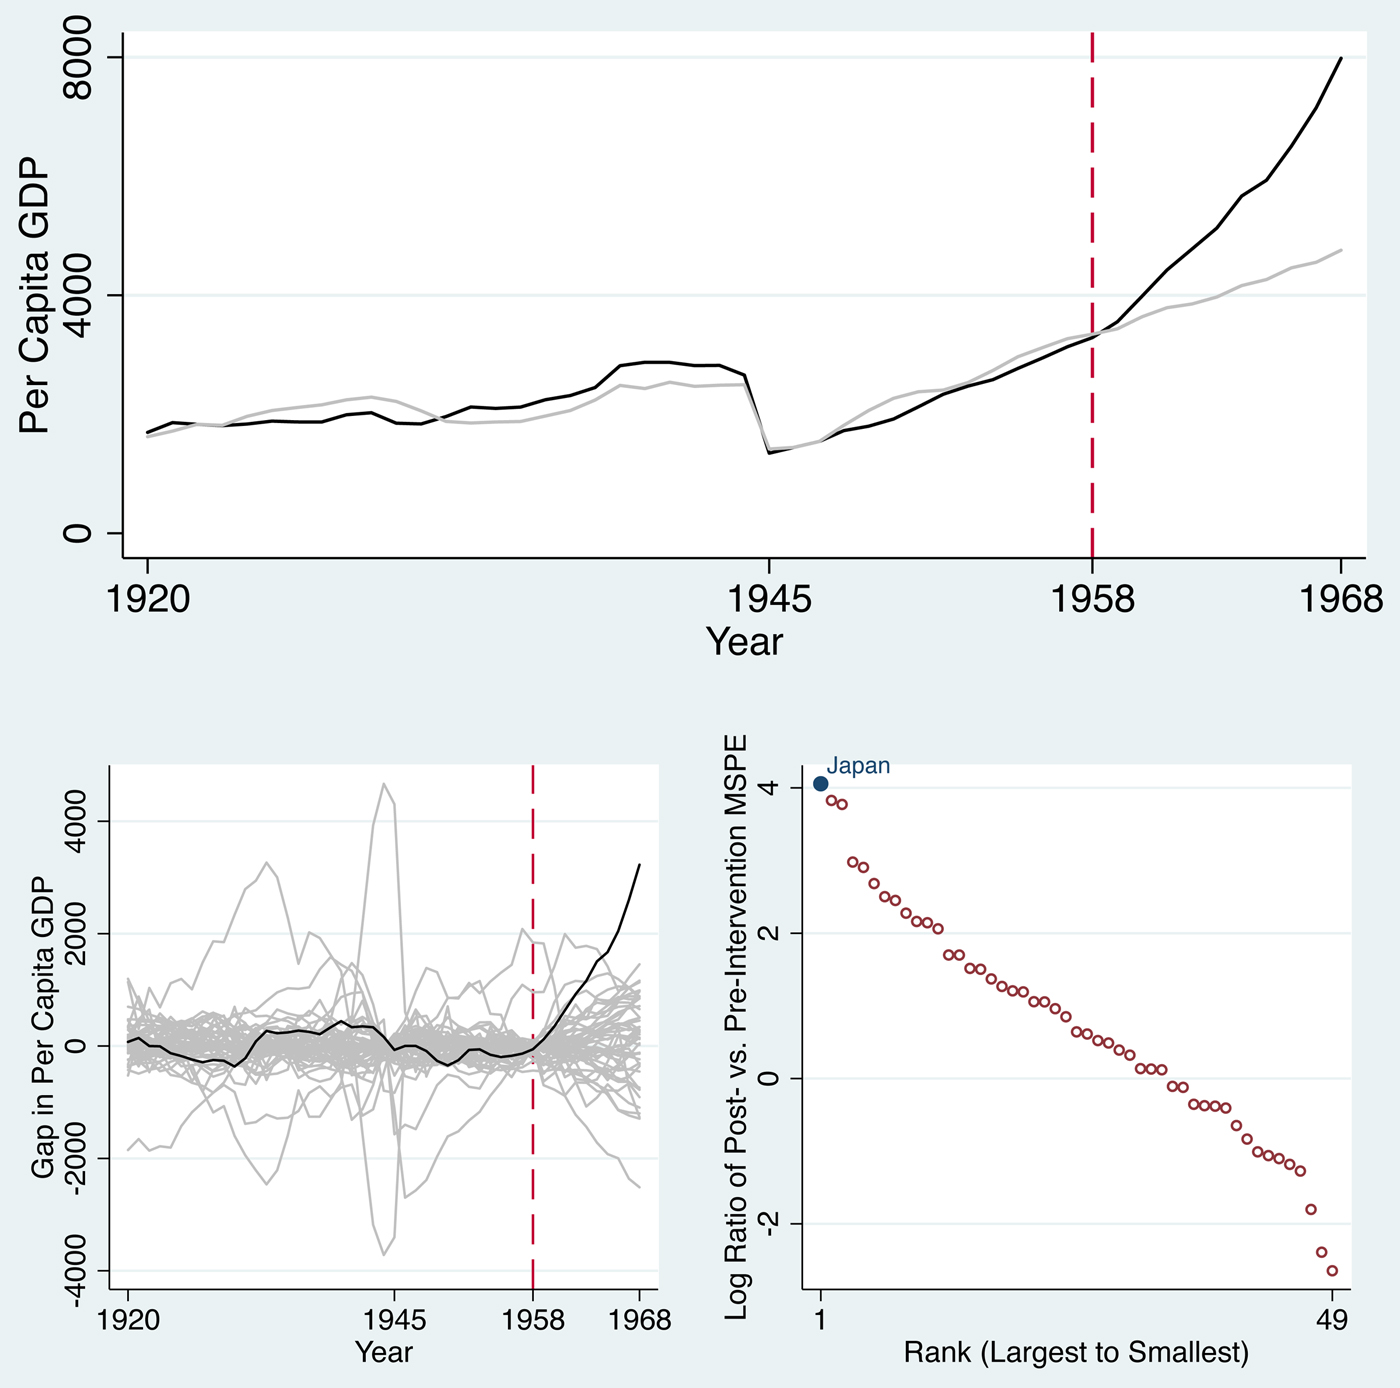
Japan's per capita GDP grew at an average annual rate of 9.3 percent from 1958 to 1968 (from $3,289 to $7,983). By contrast, the synthetic Japan's per capita GDP only grew at 3.6 percent (from $3,346 to $4,757). This result suggests that Japan's per capita GDP would have been smaller by an average of about $1,288 per year without the US–Japan alliances. This growth gap is equivalent to 39.2 percent of the 1958 level. In a well-known study of Japan's economic growth, Patrick and Rosovsky (Reference Patrick, Rosovsky, Patrick and Rosovksy1976) note that Japan's economy would have been 30 percent smaller without the low defense spending, although they do not explain their method of estimation. Based on a modern statistical technique, we show that their estimated/claimed effect is similar to ours.
Table 1 shows a list of countries in the donor pool and the weights assigned to these countries by the synthetic control method. The synthetic Japan in our analysis is comprised of 42.6 percent Austria, 18.1 percent South Korea, 15.7 percent Indonesia, 13.4 percent the Philippines, 8.9 percent Malaysia, and 1.3 percent the United States. Table 2 shows the values of predictors for Japan during the pre-intervention period, as well as the weighted average values of predictors for the synthetic Japan. These values are very similar: Japan and the synthetic Japan (except for the Philippines and the United States, which constitute 14.7 percent of the synthetic Japan) are not founding UN members; per capita GDP more than doubled from 1945 to 1957 in both Japan (2.33 times) and the synthetic Japan (2.18 times);during the same period, the population increased by 20.1 percent in Japan and 17.9 percent in the synthetic Japan; and the average per capita GDP from 1920 to 1957, as well as the levels of per capita GDP in 1944 and 1958, are all fairly similar for the actual Japan and the synthetic Japan. These results suggest that our synthetic Japan serves as a valid counter-factual case for Japan's economic growth in the absence of the US–Japan alliance.
Weights for Synthetic Japan

Note: The weights are assigned using the synthetic control method. The countries assigned 0 weight include Argentina, Australia, Belgium, Brazil, Bulgaria, Canada, Chile, Colombia, Costa Rica, Cuba, Czechoslovakia, Denmark, Ecuador, El Salvador, Finland, France, Germany, Greece, Guatemala, Honduras, Hungary, India, Ireland, Italy, Mexico, Netherlands, New Zealand, Nicaragua, Norway, Peru, Portugal, Singapore, Spain, Sri Lanka, Sweden, Switzerland, Taiwan, USSR, the United Kingdom, Uruguay, Venezuela, Yugoslavia.
The Means of Predictors During the Pre-Intervention Period

Note: Post-war Economic Recovery is per capita GDP in 1957 divided by per capita GDP in 1945. Post-war Population Growth is population in 1957 divided by population in 1945.
Placebo Tests
To assess the credibility of the estimated treatment effect, we conducted two types of placebo tests suggested by Abadie, Diamond, and Hainmueller (Reference Abadie, Diamond and Hainmueller2010, Reference Abadie, Diamond and Hainmueller2015). The first type is what they call an “in-space” placebo study. Specifically, we applied the synthetic control method to estimate the effect of an intervention in 1958 to every other country in the donor pool listed in Table 1. That is, for each country, we created a synthetic control using the same set of predictors and examined whether the trajectories of per capita GDP diverged between the factual and counter-factual cases from 1958.Footnote 17
The results are shown in the bottom panels in Figure 1. The vertical axis on the bottom-left panel measures the difference in per capita GDP between the factual case and the counter-factual (synthetic control) case. The grey lines denote the gaps for all countries except Japan, while the black line denotes the gap for Japan. The graph shows that the (positive) gap during the post-treatment period is much larger for Japan than for other countries.
The large post-intervention gap for Japan, however, may not necessarily indicate that the effect of an intervention in 1958 is large, since the pre-intervention gap may also be large. To assess the relative magnitude of the gap for Japan, as compared to that of other countries in the donor pool, we calculated the logged ratios of post/pre-intervention mean squared prediction error (MSPE). The results are presented in the bottom-right panel of Figure 1. Japan's score is the largest among all 49 countries. If we were to select a country at random, the probability that its post- versus pre-intervention MSPE ratio would be the largest out of the 49 countries is 1/49 = 0.020, which is smaller than 5 percent, the conventional level often used in statistical inference.
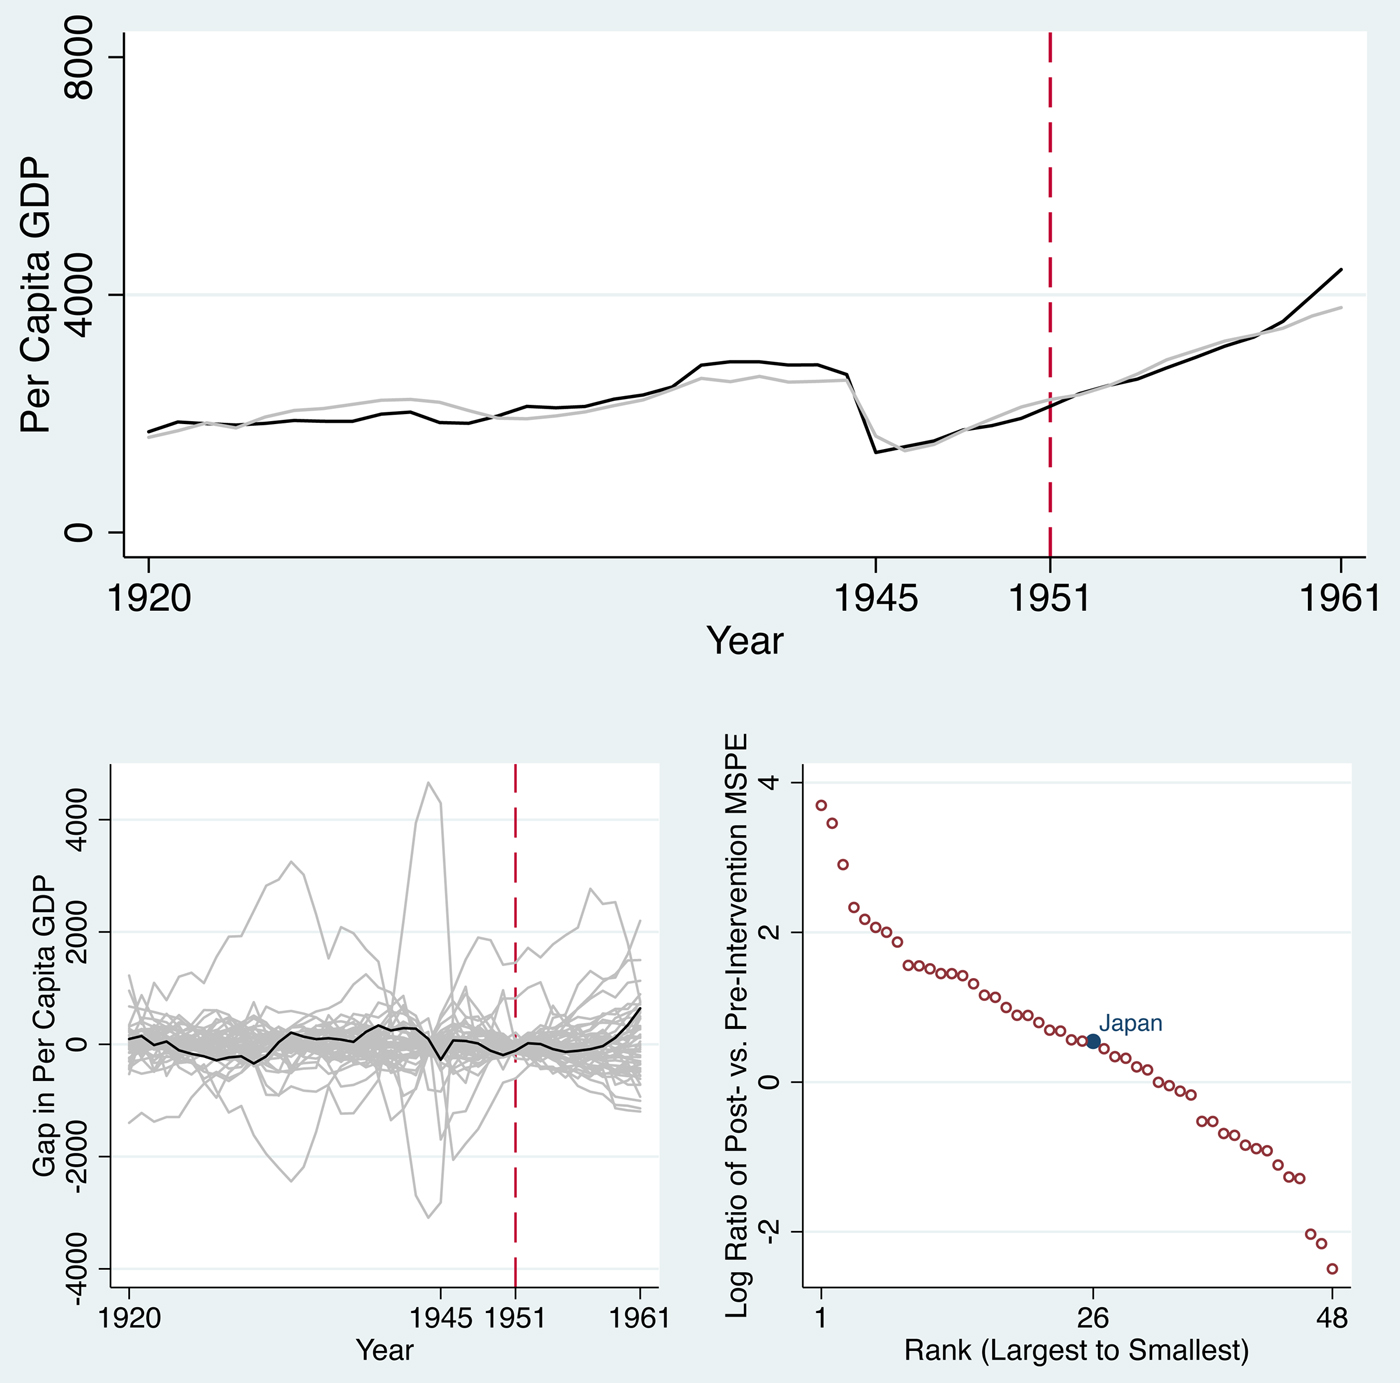
Figure 2 shows the results of another placebo test, called an “in-sample” placebo study. In this analysis, the treatment is counter-factually assumed to have happened in 1951, which marks the first full year of the Korean War. We choose this year because some studies argue that the Korean Wan kick-started Japan's growth via military procurement orders (see, for example, Gao Reference Gao1997). For this test, we use the same technique and the same predictors to construct a synthetic control. The length of the post-treatment period is also the same (ten years), and the pre-treatment period is from 1920 to the year of treatment. Figure 2 shows that trajectory of Japan's per capita GDP does not diverge from that of the synthetic Japan in 1951. Japan's post- versus pre-intervention MSPE ratio is ranked 26th. The probability that this ratio would be ranked 26th by chance is almost equivalent to the probability of observing a head in coin tossing.Footnote 18 These results imply that the beginning of the Korean War was not the turning point for Japan's growth acceleration.
The Effect of Intervention in 1951 in Japan on Per Capita GDP
Finally, we conduct a robustness test suggested by Abadie, Diamond, and Hainmueller (Reference Abadie, Diamond and Hainmueller2015) in which we iteratively drop one of the six units that constitute the synthetic control (i.e., Austria, Indonesia, Malaysia, the Philippines, South Korea and the United States) and re-estimate the effect using the same period and the same set of predictors. The objective of this “leave-one-out” sensitivity test is to make sure that a particular country does not drive the results of our analysis. The results are presented in Figure 3 and show that our basic finding remains unchanged even after excluding various countries: The trajectories of per capita GDP are similar between Japan and the synthetic Japan until 1958, and then Japan grows at a much faster rate.
The Results of Leave-One-Out Sensitivity Tests

Alternative Interpretations
The synthetic control method provides a systematic way to determine when an unexplained acceleration in Japan's growth occurred, but not a definitive account of why Japan's growth accelerated. As we discussed in detail with our qualitative analysis, we believe that the sudden shift in the US–Japan relations was the major trigger of growth spurt. Yet, we acknowledge that it is possible that our results are driven by other events that occurred around the same time. Below, we highlight several alternative explanations and discuss why we think they did not significantly affect Japan's growth acceleration from the late 1950s.
One such event could be the 1958 Japanese elections in which the LDP secured more than 60 percent of the seats in the Lower House election. The LDP would go on to retain power until 1993. It is possible that the consolidation of conservative power in Japan marked a major turning point in Japan's postwar economic growth, but we are skeptical that it fully explains our results. The 1958 election was not a landslide victory and, therefore, did not allow investors to predict that the LDP would dominate Japanese politics for 35 years. Although the LDP won 287 out of 467 seats in 1958, it was ten fewer seats than the Liberals and Democrats jointly won in 1955 (the Liberals and Democrats then merged to form the LDP that same year). Moreover, the Japanese Socialist Party won 166 seats in 1958, an amount greater than the number of seats the Socialists won in 1955. Finally, as we explained earlier, there is reason to believe that the LDP's electoral success in 1958 and subsequent political dominance were at least partially due to the party's close relationship with the US, which funneled funds to LDP politicians and helped the LDP stimulate the Japanese economy once it was in power.
The second alternative explanation for our statistical results is the Japanese business cycle. In 1958, Japan recovered from a yearlong inventory recession and experienced an economic boom (the “Iwato” boom), which was generated by a rapid influx of capital. This investment surge may explain the initial few years of economic growth after 1958, but it seems an unlikely explanation for the next decade of double-digit growth rates. Moreover, as we explained earlier, the surge in Japanese investment rates beginning in 1958 may be partially owing to the consolidation of the US–Japan alliance; after agreeing to renegotiate the US–Japan security treaty in 1958, the United States orchestrated an influx of foreign investment to Japan and helped Japan free up capital for investment by significantly reducing Japan's defense burden.
A third alternative explanation highlights labor arrangements within Japan. The 1950s was marked by economically disruptive labor activism in major industries, particularly between 1957 and 1961 (Gordon Reference Gordon1998, 104). By the late 1950s, however, changing union values, a growing corporate ethos, and more generous pay schedules began to foster a new pattern of “cooperative unionism” that increasingly eschewed strikes as a major tactic (Gordon Reference Gordon1998, 129–32). But this shift was just beginning in 1958. Indeed, 1960 witnessed a yearlong strike at the large Mitsui Miike Coal Mine. Moreover, this corporate ethos was fostered in part by American policymakers, who promoted cooperation between Japanese business and labor as part of their emphasis on Japanese economic growth.
In sum, we acknowledge that there may be other factors that explain Japan's dramatic growth takeoff after 1958. We believe, however, that they cannot explain Japan's sustained growth throughout the 1960s and may, in fact, be partially relevant to the “intervention” itself in our analysis; namely, the sudden and dramatic changes in Japan's relationship with the United States in the late 1950s.
CONCLUSION
Most analyses attribute Japan's postwar prosperity to Japanese policies. Our study, by contrast, suggests that such factors were necessary but insufficient: Japan rose in part because of its institutions and policies, but the effectiveness of those institutions and policies was, in turn, enhanced by Japan's privileged geopolitical environment. Specifically, Japan had the good fortune to rebuild its economy during the Cold War when the most powerful country in the world needed strong allies. The United States not only absorbed Japan's exports and tolerated Japanese protectionism but also subsidized the Japanese economy and transferred technology to Japanese firms. Without such advantages, Japan might still have achieved solid economic growth, but probably not an economic miracle.
What does this historical finding mean for contemporary development policy? The harsh reality is that poor countries today confront a far less nurturing international environment than Japan enjoyed in the 1950s and 1960s. With the Cold War over, the United States is less willing to tolerate protectionism or curtail its own prosperity for the sake of other countries.Footnote 19 Moreover, many of the tools that Japan used to stimulate growth and cultivate globally competitive firms—e.g., export subsidies, import tariffs, foreign investment restrictions—are now regulated or banned by the World Trade Organization (WTO). As the United States and other rich countries dig themselves out of the recent economic crisis, they are unlikely to tolerate policies that give firms in poorer countries an advantage over their own.
In such a hostile economic environment, poor countries’ best option may be to smuggle industrial policies and protectionism through the back door under the guise of innovation, monetary, and human development policies. For example, subsidies can be funneled through R&D budgets, exports can be promoted through currency undervaluation and special economic zones, and industries can be protected by health and environmental standards. Alternatively, poor countries can simply flaunt the rules and try to get an entire industry up and running before the WTO can rule on a case or trade partners can retaliate. Indeed, several countries, most notably China, have shown how such “second-best” strategies can produce rapid growth even under the constraints of the WTO (Rodrik Reference Rodrik2008).
In general, however, we should not expect to see many Japan-style miracles in the future. This conclusion, in turn, implies that the economic gap between rich and poor countries will remain stubbornly persistent.Footnote 20 Economic convergence is possible in theory, but Japan's experience suggests that convergence will be the exception rather than the norm and that the success of any growth model will depend, to some degree, on the peculiarities of a country's geopolitical circumstances. The most important point to be made, therefore, is that the study of economic development should pay closer attention to historically specific geopolitical contexts. We believe that this article demonstrates how such factors can be rigorously examined by grafting “qualitative flesh onto quantitative bones” (Tarrow Reference Tarrow1995)—combining the granularity of historical research with the rigor and mathematical precision of case-specific statistical analysis.
SUPPLEMENTARY MATERIAL
To view supplementary material for this article, please visit https://doi.org/10.1017/jea.2017.24.


