




I. INTRODUCTION
Aerogels cover a class of solid materials distinguished by their extreme low density and ultrafine, open pore structure. Initially synthesized as a wet gel, aerogels are created by replacing the liquid phase of the wet gel with gas, which results in a dry porous solid. As the pore structure is minimally perturbed during this process, it is not uncommon for aerogels to consist of greater than 95% porosity, with pores that average less than 100 nm. These features alone give aerogels in general some very unique properties, such as large accessible surface areas and extremely low thermal conductance. In fact, the first metal-oxide aerogels prepared by Kistler et al. targeted applications in catalysis Reference Kistler, Swann and Appel1 and thermal insulation Reference Kistler and Caldwell2 to take advantage of these novel properties. Aerogel research has continued to grow since Kistler et al. prepared the first aerogels in the 1930s. For the first few decades, though new synthesis routes were reported, Reference Teichner, Nicolaon, Vicarini and Gardes3,Reference Tewari, Hunt and Lofftus4 the composition of aerogels was limited to metal oxides. However, in the past 30 years, there has been a collective push to not only develop new methods Reference Gash, Tillotson, Satcher, Poco, Hrubesh and Simpson5 to produce traditional metal oxides but also to expand the variety of materials that aerogels cover. Some notable examples of these new aerogels include reports of organic aerogels, Reference Pekala6 carbons, Reference Fung, Wang, Lu, Dresselhaus and Pekala7–Reference Pauzauskie, Crowhurst, Worsley, Laurence, Kilcoyne, Wang, Willey, Visbeck, Fakra, Evans, Zaug and Satcher10 conducting oxides, Reference Rolison and Dunn11 chalcogenides, Reference Mohanan, Arachchige and Brock12 metals, Reference Tappan, Huynh, Hiskey, Chavez, Luther, Mang and Son13–Reference Leventis, Chandrasekaran, Sotiriou-Leventis and Mumtaz15 and various two-dimensional (2D) materials. Reference Jung, Jung, Dresselhaus, Jung and Kong16–Reference Worsley, Shin, Merrill, Lenhardt, Nelson, Woo, Gash, Baumann and Orme18 A major driver for realizing aerogels from a wider materials set is the potential to unlock novel properties that these materials only exhibit as aerogels.
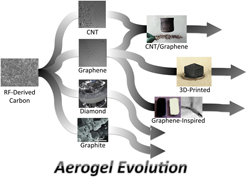
Carbon aerogels (CAs), in particular, possess a unique combination of ultralow density, large surface area, high electrical conductivity, thermal and chemical robustness, and good mechanical properties, not available in other aerogel materials. These properties arise directly from assembling amorphous sp 2 carbon nanoparticles into a highly porous, low-density aerogel. Consequently, CAs have enjoyed steady growth in research interest since their invention in the early 1990s Reference Fung, Wang, Lu, Dresselhaus and Pekala7 [Fig. S1(a)] and have been actively pursued for applications touching a wide variety of fields including energy storage, catalysis, filtration, chemical sensors, energy generation, sorbents, and electronics. The discovery of new carbon allotropes Reference Iijima and Ichihashi19–Reference Novoselov, Geim, Morozov, Jiang, Zhang, Dubonos, Grigorieva and Firsov21 (e.g., nanotubes, graphene, and fullerene) has fueled pursuits to synthesize aerogels on the basis of these novel nanomaterials. Graphene aerogels (GAs) have been an exceptionally popular topic, showing a very rapid rise in published works and citations since its invention [Fig. S1(b)]. The intense interest in graphene is in part largely due to the advantages that the graphene allotrope exhibits compared with amorphous or nanocrystalline carbon. Furthermore, graphene has inspired interest in other 2D materials, such as boron nitride (BN), transition metal dichalcogenides, and black phosphorus (BP). This interest in graphene-inspired materials has also led to novel synthesis routes to make aerogels based on these 2D materials. And finally, CAs have been playing a prominent role in the emerging body of literature devoted to three-dimensional (3D)-printed aerogels. This has led to the development of novel 3D printing schemes to make aerogel synthesis compatible with current 3D printing technologies. Conventional CAs have been covered in previous reviews, but a broad look at how the CA synthesis has evolved and expanded the aerogel landscape is lacking. Reference Al-Muhtaseb and Ritter22–Reference George and Costas26 Therefore, this review seeks to provide the reader with a survey of the CA synthesis methods with a focus on novel carbon allotropes, graphene-inspired or 2D materials, and 3D printing, as well as some perspective with regard to the future outlook for aerogel synthesis.
II. CARBON ALLOTROPES
Allotropes refer to the different forms of a chemical element, which may possess very different properties. As such, aerogels of the various allotropes would also be expected to reflect these different properties. In the case of carbon, aerogels based on four different carbon allotropes have been reported: (i) amorphous carbon, (ii) carbon nanotubes (CNTs), (iii) diamond, (iv) graphite, and (v) graphene. Reference Balandin27 Following is a discussion of the synthesis methods, properties, and applications of each of these important CAs.
A. Amorphous carbon
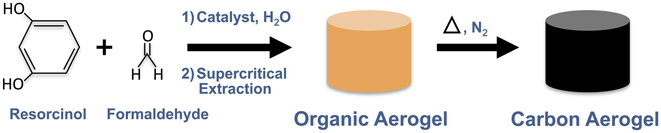
Traditional CAs consist of a 3D network of interconnected amorphous carbon nanoparticles. Because of their high surface area, mechanical robustness, and electrical conductivity, they have been widely pursued for electrical energy storage, hydrogen storage, desalination, and catalysis. CAs were originally derived from organic aerogels synthesized via the polycondensation of resorcinol with formaldehyde. Reference Pekala6 These resorcinol–formaldehyde (RF) aerogels were then fired under inert gas to produce RF-derived CAs (Fig. 1). This RF sol–gel route to sp 2-hybridized carbon gels was a key development in the evolutionary path of CAs. Specifically, the scheme of starting with a carbon precursor in solution (or suspension), inducing gelation (e.g., cross-linking, solidification, etc.), and then converting the precursor to the desired carbon allotrope is a pattern that will be apparent in many of the methods used to synthesize the carbon allotrope aerogels. And in some cases, the organic sol–gel method is directly utilized to assist in building the matrix of other carbon allotrope aerogels.
Synthesis scheme for resorcinol–formaldehyde sol–gel path to CAs.
B. CNT aerogel
CNTs possess exceptional mechanical, thermal, and electrical properties. Reference Nardecchia, Carriazo, Ferrer, Gutierrez and del Monte23 Therefore, structures fabricated from these materials hold technological promise for a variety of applications, Reference Bryning, Milkie, Islam, Hough, Kikkawa and Yodh8,Reference Leroy, Carn, Backov, Trinquecoste and Delhaes28–Reference Wang, Wang, Huang, Cui, Gui, Kang, Wang and Wu34 including structural composites, thermal interfaces, energy storage, actuators, and artificial membranes. Synthesizing CNT aerogels that retain the intrinsic properties of individual tubes, however, is extremely challenging. In general, CNT aerogel synthesis begins with a dispersion of CNTs. Although there are a few examples where CNTs are grown within an aerogel matrix, Reference Gui, Wei, Wang, Cao, Zhu, Jia, Shu and Wu35–Reference Hoecker, Smail, Pick and Boies38 they are the exception. Pristine CNTs, being hydrophobic, require a surfactant if dispersal in aqueous media is required. Otherwise, organic solvents or highly oxidized CNTs must be used. Next, gelation is induced via a physical or chemical cross-linking mechanism, followed by drying [typically freeze drying or critical point drying (CPD)], and any desired post-processing.
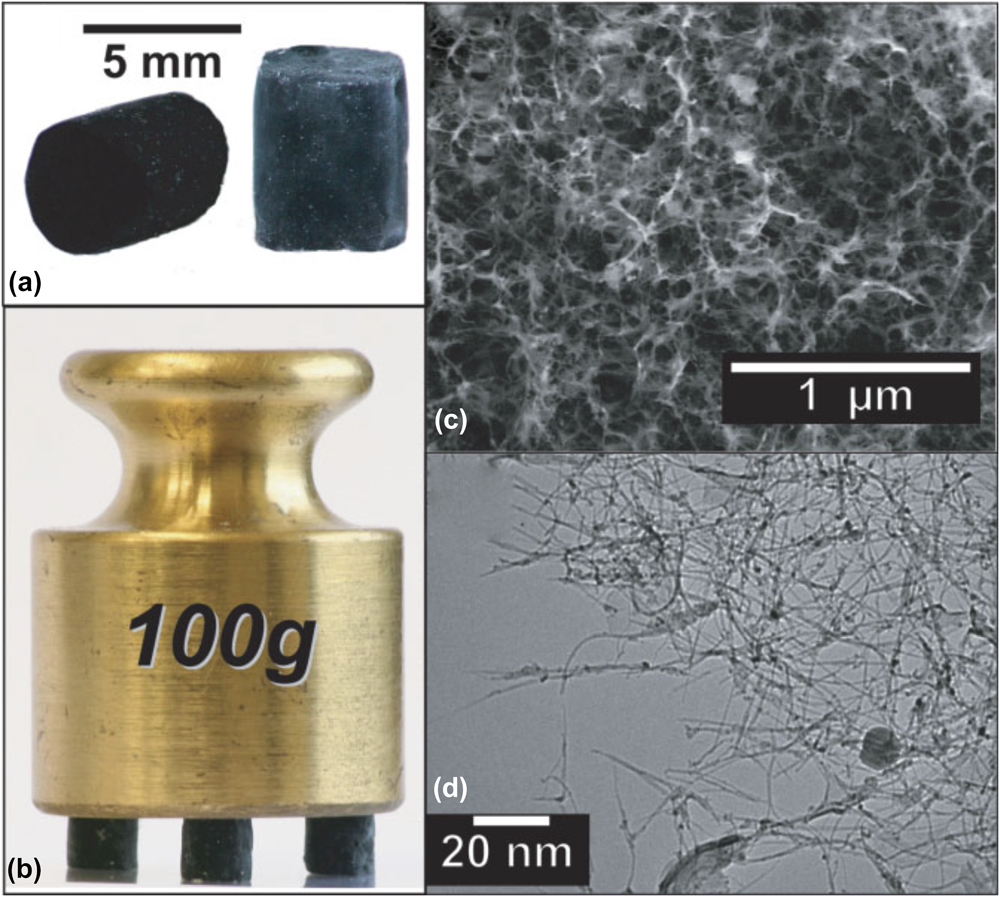
Bryning et al. reported the first CNT aerogel in 2007. Bryning et al. used a surfactant to successfully disperse a low concentration of single-walled CNTs (SWCNT) in water. The suspension would form a physical gel overnight and then be washed in water or an aqueous polyvinylalcohol (PVA) solution to remove surfactant and, in the case of the PVA solution, mechanically reinforce the aerogel. Both freeze-drying and CPD were used to achieve the final aerogel (Fig. 2). The final properties of the CNT aerogel (e.g., electrical conductivity, mechanical robustness, and density) were highly dependent on the CNT concentration, PVA concentration, and drying method. CPD was shown to give consistently better results overall than freeze-drying, and increasing CNT concentration gave electrical conductivities as high as 1 S/cm when no PVA was used. This is quite remarkable given that a traditional CA of equal density would be expected to exhibit an order of magnitude lower conductivity. However, the pure CNT aerogels were fragile because they rely solely on van der Waals (physical) forces between CNTs for mechanical integrity. Alternatively, the PVA-reinforced CNT aerogel exhibited remarkable mechanical integrity by supporting 8000 times its own weight but suffered from low conductivity as the binder likely interferes with electrical conduction between CNTs. Regardless, this work provided the first evidence of the enhanced properties that could be realized in a CNT aerogel and led to many more notable works. Reference Jung, Jung, Dresselhaus, Jung and Kong16,Reference Kim, Oh and Islam39,Reference Lin, Gui, Gan, Chen, Cheng, Liu, Zhu, Yang, Cao and Tang40
Images of aerogels. (a) Macroscopic pieces of 7.5 mg/mL CNT aerogels. Pristine CNT aerogel (left) appears black, whereas the aerogel reinforced in a 1 wt% PVA bath (right) is slightly gray. (b) Three PVA-reinforced aerogel pillars (total mass = 13.0 mg) supporting 100 g, or approximately 8000 times their weight. (c) This SEM image of a critical-point-dried aerogel reinforced in a 0.5 wt% PVA solution (CNT content = 10 mg/mL) reveals an open, porous structure. (d) This high-magnification TEM image of an unreinforced aerogel reveals small-diameter CNTs arranged in a classic filamentous network. Reproduced by permission from Ref. Reference Bryning, Milkie, Islam, Hough, Kikkawa and Yodh8 (John Wiley and Sons).
To produce CNT aerogels with both the desired mechanical and electrical properties, some researchers sought to mechanically reinforce the CNTs with a conductive binder instead of the traditional polymer binder. The RF sol–gel route is a natural choice for such an effort. During the initial efforts by Worsley et al., Reference Worsley, Satcher and Baumann41 a small concentration of the surfactant-dispersed CNTs was added to the traditional RF solution before gelation, aiming to achieve a homogenous dispersion of CNTs within the aerogel framework. After gelation, drying, and carbonization, a CNT-CA composite was observed via electron microscopy. For the CNT-CA, instead of observing a network consisting solely of amorphous carbon nanoparticles, the CNTs were uniformly dispersed as bundles within the CA matrix. Not surprisingly, the CNT-CAs prepared with higher CNT concentrations showed a higher population of CNTs in the images. The CNT-CAs also showed enhanced electrical and mechanical properties. Reference Worsley, Satcher and Baumann41 However, as the proportion of RF-derived carbon was still relatively high compared with the CNT fraction, the improvements were not as significant as those reported by Bryning et al. To minimize the amount of RF-derived carbon, such that its presence in the CNT aerogel was limited to coating and cross-linking the CNT network, another study by Worsley et al. Reference Worsley, Kucheyev, Satcher, Hamza and Baumann42 reduced the RF concentration in the sol–gel reaction mixture from 12 to 4 wt% while holding the CNT concentration constant. By introducing low concentrations of the sol–gel precursors to a suspension of highly purified CNTs, polymerization is induced primarily on the walls of the CNT bundles and, more importantly, at the junctions between adjacent bundles to form an organic binder. Upon carbonization, the organic binder is reduced to a conductive, mechanically reinforcing sp 2 carbon binder. Scanning electron microscopy (SEM) showed that the network of CNT-based foams comprises randomly interconnected filament-like struts with diameters that range from 5 to 40 nm and lengths of ∼500–1000 nm (Fig. S2). Transmission electron microscopy (TEM) showed that at the surface, these filaments do not appear to be simply individual CNTs or CNT bundles as the nanotube walls are not visible. The CNTs were coated with a thin layer of carbon, indicating that nucleation and growth of the sol–gel polymer did indeed occur on the surfaces of the CNTs.
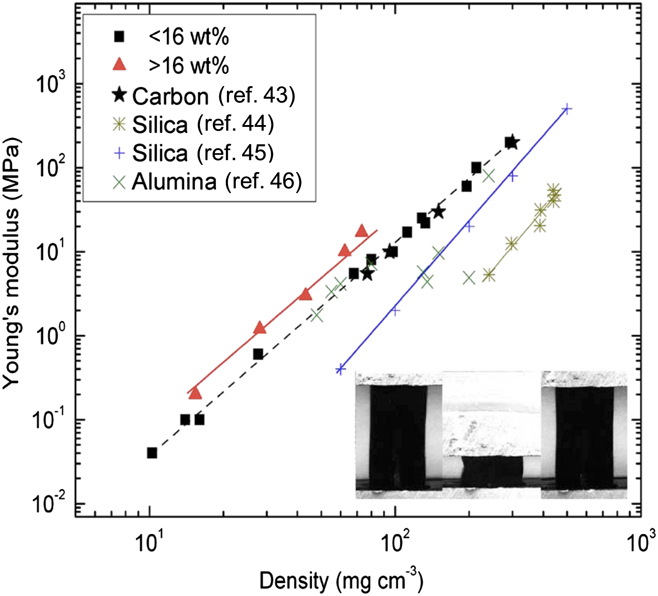
The utilization of the carbonaceous binder affords monolithic CNT aerogels that simultaneously exhibit exceptional mechanical and electrical properties. In Fig. 3, the elastic moduli of these CNT aerogels are compared with some other porous carbon materials, such as conventional CAs, highlighting the unprecedented mechanical properties of CNT-based aerogels. Indeed, for a given density, the CNT-based aerogel is the stiffest. In fact, at a density of 100 mg/cm3, aerogels with high CNT loadings (over 16 wt%) are ∼12 and ∼3 times stiffer than conventional silica and CAs, respectively. Reference Pekala, Alviso and Lemay43–Reference Leventis, Sotiriou-Leventis, Zhang and Rawashdeh45 These CNT-based aerogels are also ∼3 times stiffer than the “super-stiff” alumina nanofoams whose struts have the morphology of curled nanoleaflets. Reference Kucheyev, Baumann, Cox, Wang, Satcher, Hamza and Bradby46 The inset in Fig. 3 shows a sequence of images taken of an ∼30 mg/cm3 aerogel with a CNT loading of 55 wt% before, during, and after uniaxial loading up to a maximum strain of ∼76%, showing the “superelastic” behavior with complete strain recovery that has been observed for nanotube-based aerogels with densities below ∼50 mg/cm3. In addition to exceptional mechanical properties, these low-density CNT aerogels also exhibit a 5-fold increase in electrical conductivity (>1 S/cm) compared with standard CAs.
Dependence of Young’s modulus on density for monolithic CNT foams compared to carbon, silica, and alumina aerogels. The inset shows the sequence of uniaxial compression of a monolith 30 mg/cm3 and 55 wt% CNT content, illustrating the superelastic behavior with complete strain recovery after compression to strains as large as 76%. Reproduced by permission from Ref. Reference Worsley, Kucheyev, Satcher, Hamza and Baumann42 (American Institute of Physics).
Gutiérrez et al. Reference Gutiérrez, Carriazo, Tamayo, Jiménez, Picó, Rojo, Ferrer and del Monte47 achieved enhanced performance in CNT-based aerogels by adapting the organic sol–gel method to deep eutectic solvents (DESs) that readily disperse CNTs. Gutiérrez et al. report that DESs catalyze the polycondensation of furfuryl alcohol to form a bicontinuous porous architecture consisting of colloidal particles. On inclusion of multiwalled CNT (MWCNT), it appears that furfuryl alcohol preferentially coats the MWCNTs forming a strong, conductive “glue” between the MWCNTs after carbonization (Fig. S3). This carbon shell resulted in CNT-based aerogels with electrical conductivities as high as 4.8 S/cm and elastic moduli up to 24 MPa. Thus by using the RF sol–gel method to form sp 2 carbon junctions between CNTs, CNT aerogels that simultaneously exhibited good electrical conductivity and mechanical robustness were realized. Reference Worsley, Kucheyev, Satcher, Hamza and Baumann42,Reference Gutiérrez, Carriazo, Tamayo, Jiménez, Picó, Rojo, Ferrer and del Monte47,Reference Worsley, Pauzauskie, Kucheyev, Zaug, Hamza, Satcher and Baumann48
Recently, De Marco et al. Reference De Marco, Markoulidis, Menzel, Bawaked, Mokhtar, Al-Thabaiti, Basahel and Shaffer49 demonstrated another route to synthesis of CNT aerogels with covalent carbon bonds starting from SWCNT anions in N,N-dimethylacetimide (DMAc). A major advantage of working with SWCNT anions in DMAc is that one can start with a true solution of individualized CNTs at high concentrations without damaging the CNTs with sonication or oxidation. De Marco et al. then used Na/naphthalene as a charge transfer agent and p-diiodobenzene as the dielectrophilic cross-linker to create carbon-bonded CNT gels (Fig. S4). After freeze-drying, the CNT aerogels exhibited surface areas in excess of 700 m2/g and electrical conductivities of 9.4 S/m at an ultralow density of 2.3 mg/cm.
Other chemical cross-linkers have also been used to synthesize CNT aerogels with enhanced properties. Kohlmeyer et al. used ferrocene-grafted poly(p-phenyleneethynylene) (Fc-PPE) to form a stable CNT gel. Reference Kohlmeyer, Lor, Deng, Liu and Chen50 On drying via CPD and thermal annealing, in addition to exhibiting good mechanical and electrical properties, these CNT aerogels also had surface areas approaching 700 m2/g. Similarly, Zou et al. Reference Zou, Liu, Karakoti, Kumar, Joung, Li, Khondaker, Seal and Zhai51 used poly(3-(trimethoxysilyl)propyl methacrylate) to disperse and chemically cross-link a low concentration of MWCNT. The subsequent MWCNT aerogel showed excellent compressibility and high surface area. In lieu of thermal annealing, it was shown that pulsing a high electrical current through the MWCNT aerogel was sufficient to increase its electrical conductivity to 0.67 S/cm without significantly degrading the structure. Reference Kohlmeyer, Lor, Deng, Liu and Chen50
Finally, a number of bio-related molecules have been effectively used to synthesize CNT aerogels. Chitosan (CHI) was an effective dispersant for generating homogenous, stable MWCNT suspensions (2–8 wt%). Reference Gutiérrez, Hortigüela, Amarilla, Jiménez, Ferrer and del Monte52 Using a process called ice segregation–induced self-assembly (ISISA), the suspensions are unidirectionally frozen via immersion in liquid nitrogen and freeze-dried. The final MWCNT/CHI aerogels are highly porous, electrically conductive, and possess well-aligned microchannels, which can be controlled by freezing rate, direction, and MWCNT concentration (Fig. S5). Kwon et al. Reference Kwon, Kim and Jin53 also utilized ice templating to create MWCNT aerogels. In this case silk fibroin was used as the structural binder. Non-aligned aerogels were formed by flash freezing the silk-fibroin-gelled MWCNT suspensions, whereas unidirectional freezing was used for the aligned aerogels. The aligned MWCNT aerogels exhibited orders of magnitude higher electrical conductivity than the nonaligned aerogels. Lastly, Ostojic Reference Li, Zhang, Bai, Sun, Wang, Wang and Dai55 introduced a streptavidin/DNA connector to noncovalently bind SWCNTs into ultra-lightweight aerogels with densities as low as 0.75 mg/cm3.
As seen in the above examples, the synthesis methods play a critical role in determining the observed properties of a CNT aerogel. The CNT-to-CNT cross-links can be covalent or noncovalent; binder and CNT fraction can vary greatly; and the drying method can play a crucial in the pore morphology. Nonetheless, it has been shown repeatedly that the extraordinary properties of individual CNTs can be realized in CNT aerogels if the correct synthesis scheme is chosen. With this wide variety of viable routes to high performance CNT aerogels comes the ability to customize the CNT aerogel for the rigors of specific applications.
C. Graphene aerogels
Individual graphene sheets possess a number of remarkable properties, including extremely low electrical and thermal resistivity, Reference Li, Zhang, Bai, Sun, Wang, Wang and Dai55 large carrier mobility, Reference Geim and Novoselov56 high surface area, Reference Peigney, Laurent, Flahaut, Bacsa and Rousset57 and exceptional mechanical elasticity. Reference Lee, Wei, Kysar and Hone58 Graphene and graphene-based materials hold technological promise in the areas of energy storage, Reference Pumera59,Reference Zhu, Murali, Stoller, Ganesh, Cai, Ferreira, Pirkle, Wallace, Cychosz, Thommes, Su, Stach and Ruoff60 electronics, Reference Xia, Farmer, Lin and Avouris61,Reference Schwierz62 composites, Reference Zhang, Jiang, Yan, Wang, Wang, Song, Guo and Wan63 actuators, Reference Shao, Biener, Jin, Biener, Baumann and Weissmüller64 and sensors. Reference Schedin, Geim, Morozov, Hill, Blake, Katsnelson and Novoselov65,Reference Bai, Li, Wang and Shi66 Realizing the full potential of graphene in these applications, however, requires the design of bulk multifunctional architectures that retain the exceptional properties of graphene. Broadly speaking, the synthetic scheme for GAs is similar to that for CNT aerogels except for a few key differences. Graphene oxide (GO) is by far the most common precursor for GAs due to its affordability and ease of processing. Large-scale production of GO is enabled through chemical exfoliation of graphite through a well-established chemical process developed by Brodie, Reference Brodie67 and later modified by Hummer and Offeman. Reference Hummers and Offeman68 The method is based on the principle of oxidizing graphite by treating graphite in a mixture of strong acids (such as H2SO4) and oxidizing agents (such as NaNO2 and KMnO4) for 2 h at a temperature of 45 °C. After the completion of the reaction, the mixture is then washed in an ice bath with hydrogen peroxide to remove the residual KMnO4. The presence of several functional groups such as epoxide, hydroxyl, carboxylic acid, etc., makes GO hydrophilic, and thus it can be easily dispersed in water and further exfoliated via sonication. At this point, the individual layers are negatively charged and therefore restacking of the sheets is inhibited. The layer spacing of natural graphite is 3.34 Å but for GO the spacing is increased to 7.88 Å, which is due to the presence of water molecules and various other oxide groups. As was the case with CNT aerogels, there are limited examples of chemical vapor deposition (CVD) GA growth, but they are the exception. Reference Bi, Chen, Lin and Huang69 Unlike CNTs, GO is readily dissolved or suspended in aqueous media making it relatively easy to work with and more environmentally friendly. Because of the high degree of oxidation and lattice defects present in GO (i.e., sp 3 carbon) compared with CNTs, a reduction step (e.g., chemical or thermal) is required to recover the desired graphene-like (i.e., sp 2 carbon) properties. Apart from these differences, the general gelation strategies (e.g., covalent vs noncovalent) for GAs are analogous to what is reported for CNT aerogels.
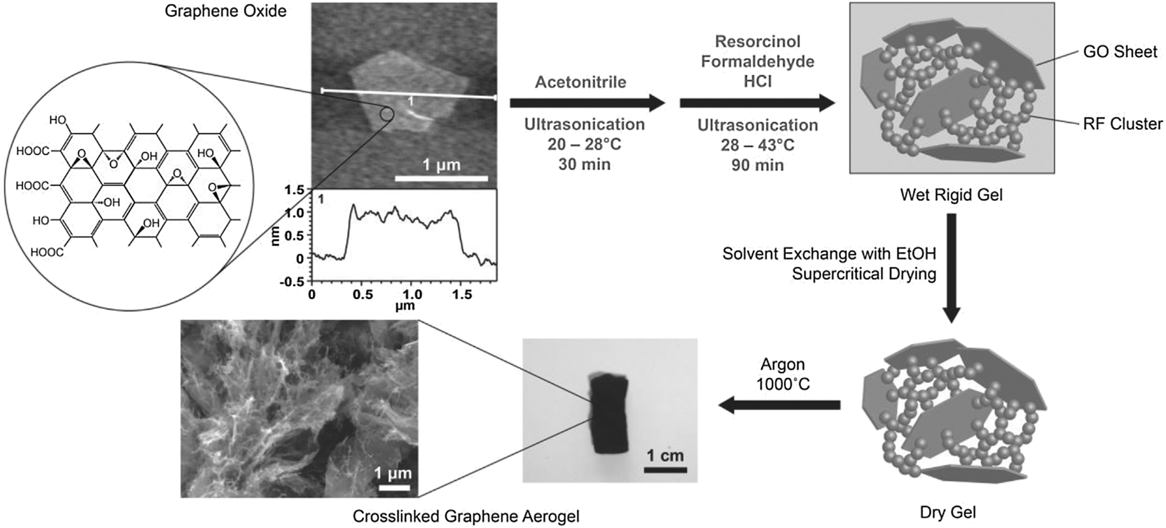
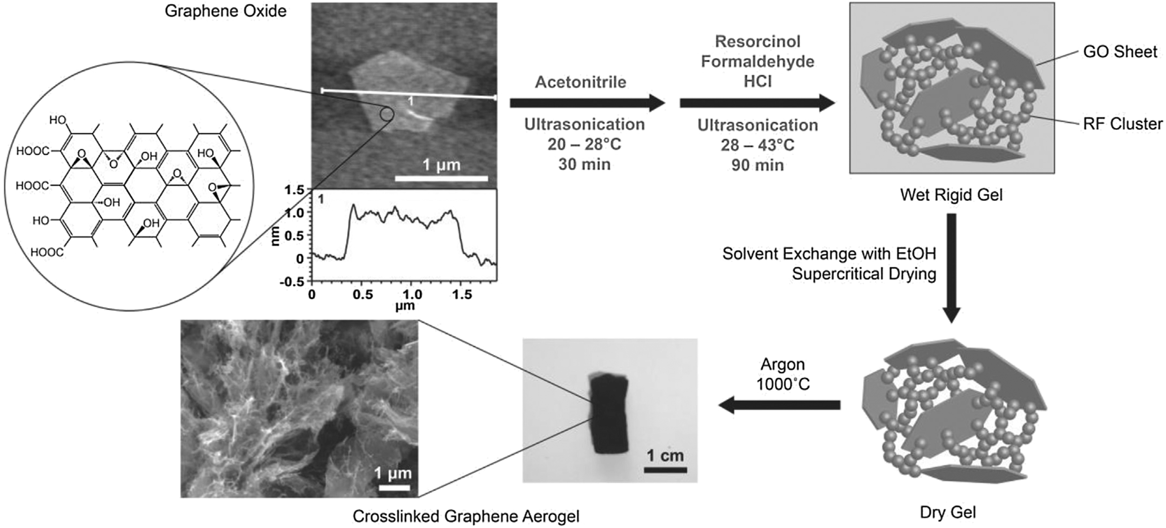
In 2010, Xu et al. Reference Xu, Sheng, Li and Shi70 and Worsley et al. Reference Worsley, Pauzauskie, Olson, Biener, Satcher and Baumann9 both independently reported synthesis routes for GAs. Xu et al. reported a hydrothermal method in which an aqueous GO suspension is heated to 180 °C in a pressure vessel for 12 h to simultaneously reduce and gel the GO. Gelation occurs because the oxygen functionality that imparts GO its hydrophilicity and electrostatic repulsion effect is removed upon reduction. As local regions on the GO sheet become hydrophobic, they are prone to noncovalent bonding (e.g., π–π stacking) with reduced regions on nearby sheets building a physically cross-linked gel. Properties of the aerogel, accomplished via freeze-drying, were strongly dependent on the starting GO concentration of the suspension. If the concentration dropped below 1 mg/mL, no gel was formed. The duration of the hydrothermal treatment also proved to be critical to the properties of the aerogel. The time at elevated temperature and pressure determined the degree of reduction, which impacted density, conductivity, and cross-linking (Fig. S6). This GA demonstrated electric conductivity (up to 5 mS/cm), good thermal stability, and mechanical properties comparable to chemically cross-linked polymer hydrogels. As such, this was a promising example of manifesting the properties of graphene sheets in an aerogel form and inspired a number of related studies. Reference Ji, Xu, Bao, Cai, Lu, Chai, Yang and Wei71–Reference Zang, Gao, Dang, Liu and Lei73 Worsley et al. used a strategy of RF sol–gel chemistry to form carbonaceous “glue” between graphene sheets in the aerogel. Much like the scheme used for the CNT aerogel, a small concentration of the RF sol–gel reactants was added to a 10 mg/mL GO suspension. The RF particles preferentially nucleate and grow on the surface and between GO sheets, covalently binding them together. Thermal treatment at 1050 °C under inert gas converted both the RF and the GO to sp 2 carbon (Fig. 4). It was determined that aerogel properties such as density, surface area, and conductivity were correlated with the RF concentration. Reference Worsley, Olson, Lee, Willey, Nielsen, Roberts, Pauzauskie, Biener, Satcher and Baumann74 Electrical conductivities for this covalently bonded GA were as high as 1 S/cm and surface areas ranged from 500 to 1200 m2/g. Lim et al. Reference Lim, Hu, Manandhar, Sakshaug, Strong, Riley and Pauzauskie75 drastically reduced the time for GA synthesis using the RF cross-linking strategy by adapting the fast gelation method developed by Mulik et al. Reference Mulik, Sotiriou-Leventis and Leventis76 The fast gelation method uses a one-pot synthesis route to prepare GO-RF gels in just a few hours instead of days. First, GO is suspended in acetonitrile, instead of water, via sonication. Then, after adding RF, hydrochloric acid is used to catalyze the sol–gel transition. Using this method, gel times as low as 30 min were achieved at 45 °C. After aging for just 1 h, the wet GO-RF gels can be washed and supercritically dried. Pyrolysis at 1000 °C is used to convert the RF to sp 2 cross-links creating a low-density, high surface area, electrical conductive GA (Fig. 5).
SEM of the GA at low (a) and high (b) magnifications. TEM of the GA at low (c) and high (d) magnifications. Black arrow denotes holey carbon on TEM grid. Reproduced by permission from Ref. Reference Worsley, Pauzauskie, Olson, Biener, Satcher and Baumann9 (American Chemical Society).

Diagram of the fast GA preparation process. Reproduced by permission from Ref. Reference Lim, Hu, Manandhar, Sakshaug, Strong, Riley and Pauzauskie75 (Elsevier).
Other cross-linkers have also been used to synthesize GAs. Tang et al. Reference Tang, Shen, Zhuang and Wang77 reported a noble metal–promoted self-assembly of GO gels. Their method involved using glucose to reduce a metal salt (e.g., chlorides of Au, Ag, Pd, Ir, Rh, or Pt, etc.) dissolved in a GO suspension to metal nanoparticles which formed critical cross-links between GO sheets. The critical role of the noble metal nanoparticles was demonstrated by dissolving the metal in aqua regia, which caused the integrity of the aerogel to degrade. Aerogels made without the metal cross-linkers were stable in aqua regia. Tang et al. also report high electrical conductivities and good mechanical strength. Xu et al. reported the use of DNA to cross-link GO sheets. Reference Xu, Wu, Sun, Bai and Shi78 In this example, a solution of double-stranded DNA (dsDNA) is added to a GO suspension and heated to 90 °C for 5 min. The elevated temperature causes the dsDNA to unwind to single-stranded DNA chains which form noncovalent bonds between GO sheets. Despite relying primarily on physical cross-linking for structural integrity, these GO/DNA gels showed remarkable chemical resistance and mechanically strength. Shi et al. Reference Shi, Wang, Wu, Chen and Feng79 used glutathione to serve both as the cross-linker and reducing agent, yielding GAs that were doped with nitrogen and sulfur.
In addition to inducing gelation using noncovalent and chemical cross-linkers, many researchers have taken advantage of the rich chemical functionality native to GO to induce self-assembly of GO suspensions. Reference Bai, Li, Wang and Shi80,Reference Worsley, Charnvanichborikarn, Montalvo, Shin, Tylski, Lewicki, Nelson, Satcher, Biener, Baumann and Kucheyev81 A strong base, such as ammonium hydroxide, has been shown to induce self-assembly of GO suspensions with cross-linking analogous to that found in RF sol–gel chemistry. In a recent study, Reference Worsley, Kucheyev, Mason, Merrill, Mayer, Lewicki, Valdez, Suss, Stadermann, Pauzauskie, Satcher, Biener and Baumann82 nuclear magnetic resonance (NMR) was used to follow GO self-assembly in the presence of ammonium hydroxide at 85 °C. 13C and 1H NMR spectra showed the appearance of sp 3 carbon as well as –CH2– and CH2O– cross-linkers after gelation of the GO suspension, strongly suggesting some covalent bonding between GO sheets during gelation (Fig. S7). After annealing, these aerogels showed very high electrical conductivities (100 S/m), were supercompressible, and possessed surface areas greater than 1300 m2/g.
Several researchers have also shown that a number of chemical reducing agents can aid in the self-assembly process similar to that observed by Xu et al. Reference Xu, Sheng, Li and Shi70 with the hydrothermal treatment. In general, the self-assembly mechanism involves the aggregation of partially reduced GO sheets as their hydrophobicity increases. The sheets stack randomly as the aggregates are formed and water is expelled from the 3D assembly of aerogels, resulting in volume shrinkage of the gel. A number of chemical reagents, such as NaHSO3, Na2S, ethylenediamine, ammonia, HI, and hydroquinone, were used to induce GO gelation. Reference Chen and Yan83,Reference Wan, Zhang, Yu, Zhang and Zhou84 As many chemical reducing agents are dangerous and toxic to the environment, there has been significant effort to work with “green” reducing agents, such as ascorbic acid. Zhang et al., Reference Zhang, Sui, Xu, Yue, Luo, Zhan and Liu85 as well as a number of other groups, Reference Fan, Tng, Nguyen, Feng, Lin, Xiao, Lu and Duong86–Reference Chen, Li, Tian, Duan, Guo, Chen, Zhou, Zhang, Dugnani and Liu88 have used ascorbic acid (e.g., vitamin C) to induce GO gelation. In addition to its environmentally friendly nature, it is also mild enough not to produce gaseous products, as occurs with some stronger reducing agents, which tend to disrupt or completely destroy the integrity of the gel. Zhang et al. reported that using ascorbic acid, uniform well-formed aerogels could be created with the expected enhancements in mechanical and electrical properties. Ji et al. Reference Ji, Xu, Bao, Cai, Lu, Chai, Yang and Wei71 used carbohydrates (glucose, β-cyclodextrin, and chitosan) as both reducing and morphology-orienting agents in the assembly of GAs. Other “green” reductants that have been reported include tannic acid, dopamine, and amino acids. Reference Zhang, Liu, Yang, Zhou and You89–Reference Luo, Lai, Zhang, Liu, Liu and Liu91
In another study, Reference Zhang, Zhang, Sang, Liu, Luo, Peng, Han, Tan, Ma, Wang and Zhao92 GAs with densities less than 3 mg/cm3 were assembled in a one-pot synthesis step at the oil–water interface of a GO emulsion (Fig. S8). The GO emulsion was prepared using a cyclohexane/water mixture in the presence of sodium bisulfite under ultrasonication. The GO-stabilized emulsion gelled at 70 °C over 12 h by gradually removing the oxide functionalities. Here, sodium bisulfite acts as both reducing agent and a coemulsifier due to the salt effect. Reference He, Wu, Sun, Li, Guo, Li, Zhang, Xing, Wang and Gao93 This method produced a cellular pore morphology which enhanced the mechanical robustness of the aerogel. Finally, γ-ray irradiation was used by He et al. Reference He, Li, Li and Li94 for self-assembly of porous honeycomb GAs. A low-concentration (5 mg/mL) GO dispersion in isopropanol was deoxygenated using nitrogen gas and then irradiated with 60C γ-rays. The γ-rays induce reduction of GO, which leads to self-assembly as the π–π conjugation is restored. After freeze-drying, the final reduced GO aerogel has an average density of 3.8 mg/cm3.
Reduction of GO aerogels to GAs is done by heat treatment, chemical reagents, and by hydrothermal processing in an autoclave. Reference Chua and Pumera95 The most commonly used chemical reagents are hydrazine, borohyrides, aluminum hydrides, and hydrohalic acids. Sudeep et al. Reference Sudeep, Narayanan, Ganesan, Shaijumon, Yang, Ozden, Patra, Pasquali, Vajtai, Ganguli, Roy, Anantharaman and Ajayan96 reported a controlled reduction process to reduce a 3D covalently interconnected GO with a resorcinol–gluteraldehyde network using hydrazine monohydrate vapor at 50 °C under vacuum for 12 h. The reduced GO had an electrical conductivity of 3.4 S/m and exhibited good adsorption capacity for CO2 storage. Tang et al. Reference Tang, Gao, Bao, Zhou, Shen, Mei and Wu97 used Mg vapor to reduce GO aerogels. The freeze-dried GO aerogel was heated in an ampoule with Mg powder at 700 °C for 5 h. After magnesiothermic reaction, the reduced GO sheets were decorated with MgO nanocrystals, which were washed with acid and freeze-dried again. The final GA retained the original morphology with densities as low as 1.1 mg/cm3 and exhibited an electrical conductivity of 27 S/m. On compression, the sample had <4% permanent deformation after 1000 cycles.
The other popular reduction method is thermal annealing. This is one of the most effective methods to achieve high electrical conductivity in the GA. Annealing at 800–1100 °C under inert gas produces aerogels with conductivities of ∼100 S/m. Reference Worsley, Pauzauskie, Olson, Biener, Satcher and Baumann9,Reference Worsley, Kucheyev, Mason, Merrill, Mayer, Lewicki, Valdez, Suss, Stadermann, Pauzauskie, Satcher, Biener and Baumann82 However, using an even higher thermal annealing temperature (1500–2500 °C), the crystallinity of the graphene sheets is further increased, which is reflected in the Raman spectra, oxidative thermal stability, electrical conductivity, and mechanical properties Reference Worsley, Pham, Yan, Shin, Lee, Bagge-Hansen, Mickelson and Zettl98,Reference Cheng, Zhou, Hu, Zhao, Li, Zhang and Han99 (Fig. S9). For example, electrical conductivity can be enhancements of 5–6 times the values recorded at lower temperature anneals. This demonstrates the key role crystallinity plays in GA properties. Thermal reduction in a furnace is most common, but in some work, other means are used. For example, Hu et al. Reference Hu, Zhao, Wan, Gogotsi and Qiu100 report synthesis of ultralight GAs via microwave irradiation. The aerogels show densities as low as 3 mg/cm3 and yet the structure fully recovers without fracture even after 90% compression.
D. CNT/GAs
In addition to CNT and GAs, there is also a considerable body of research devoted to composite CNT/GAs, which seek to create synergy by combining these two extraordinary carbon allotropes in the aerogel framework. Reference Nardecchia, Carriazo, Ferrer, Gutierrez and del Monte23 Sun et al. Reference Sun, Xu and Gao101 reported synergistically assembled aerogels by combining CNTs and giant GO sheets to form hybrid aerogels. The aerogels were of extremely low-density (as low as 0.16 mg/cm3) and were prepared by freeze-drying solutions of CNT with GO sheets and subsequent reduction with hydrazine. The morphology of these aerogels was similar to that of GAs with an interconnected, porous 3D framework of randomly oriented sheets, except that entangled CNT networks covered the graphene sheets (Fig. S10). On detailed observation, multiple forms of CNT interconnections such as overlapping, twisting, and enwrapping with graphene were seen. The aerogels maintained mechanical integrity when compressed to 80% strain and fully recovered upon unloading. Compared with GAs of similar density, the CNT/GA hybrids also displayed good elasticity. The synergistic effect is attributed to strong interaction between graphene and CNTs, with CNTs reinforcing the graphene sheets like ribbing.
Zhang et al. Reference Zhang, Tang, Wang and Qin102 synthesized CNT/GAs using the hydrothermal method. SWCNTs are first treated in acid to remove catalyst impurities before dispersing them with GO. Gelation is achieved in a Teflon-lined autoclave at 180 °C for 4 h. The wet gel is then freeze-dried to yield the graphene/SWCNT aerogel. The surface area of this aerogel was reported to be 656 m2/g, which is much higher than is typically reported for freeze-dried aerogels. It is presumed that the SWCNTs served as spacers between graphene sheets preventing restacking and thus allowing the final aerogel to retain more accessible surface area.
Researchers have also pursued green synthesis routes for fabrication of CNT/GAs. In the work by Sui et al., Reference Sui, Meng, Zhang, Ma and Cao103 GO sheets and MWCNTs were sonicated together. Ascorbic acid was used as the chemical reducing agent to induce gelation and the wet gels were supercritically dried with CO2. The morphology of the aerogels had a 3D hierarchical pore structure with macropores in the micron regime and the solid walls of the aerogel were composed of CNTs and graphene sheets forming mesopores in the nanometer regime. These aerogels exhibited large surface areas and pore volumes, in addition to good electrical conductivity resulting in excellent sorbent performance for desalination, as well as oil and dye absorption.
A novel synthesis approach to CNT/GAs was reported by Kim et al. in which graphene was grown on CNT aerogels to make the composite. Reference Kim, Oh and Islam39 CNT aerogels were coated with polyacrylonitrile (PAN), which was converted into multilayer graphene by means of a multistep pyrolysis process. The conversion of PAN to graphene was accomplished by first treating the aerogel at 210 °C in argon for 1.5 h to convert PAN to a condensed heterocyclic ring structure, then treating the aerogel at 1010 °C to convert the condensed heterocyclic structure to graphene. The volume fraction of graphene coating ranges from 0.0067 to 0.009 giving a porosity of 99% in the aerogels. The morphology of aerogels by TEM showed that 25–40% of the nanotubes are coated with 1–5 layers of graphene. The CNT/GAs completely recover their original shape with no mechanical failure after a compressive strain of ≥90% compared with permanent collapse of CNT aerogels under the same conditions (Fig. S11). The aerogels also exhibited excellent structural robustness. No significant plastic deformation or degradation in compressive strength was observed in these CNT/GAs after repeated loading and unloading for up to 106 cycles at a strain of 60%.
In addition to the previous example of growing graphene in a CNT aerogel, several researchers have reported growing CNTs in GAs to produce a CNT/GA. Hu et al. Reference Hu, Zhao, Gogotsi and Qiu104 used a microwave irradiation-mediated approach for manufacturing of CNT/GAs, in which MWCNTs are vertically anchored on the surface of the graphene walls of the aerogels. This method starts with an ethylenediamine-functionalized GA that is exposed to microwave radiation to remove the functionalization and yield an ultralight GA (ULGA). The ULGA gel is impregnated with an acetone solution of ferrocene and then air-dried. Additional microwave irradiation leads to in situ super heating and growth of CNTs in the ULGA (Fig. S12). By varying the concentration of ferrocene solution from 5 to 20 mg/mL, the authors increased the CNT loading from 14 to 46 wt%. The CNT/GAs were superhydrophobic and highly compressible making them excellent recyclable oil sorbents. Lee et al. Reference Lee, Lee, Lee, Jeong, Baek, Yoon and Kim37 synthesized CNT/GA from a hydrothermally treated NiCl2-loaded GO suspension. The resultant wet gel was then freeze-dried to form graphene–metal salt aerogel that was now ready for CVD processing. Using a water-assisted thermal CVD process, CNTs were grown from the Ni nanoparticles (in situ reduced from Ni salt) embedded in the GA at 810 °C with acetylene as a carbon source. The morphology of the CNT/GAs revealed entangled CNTs covering the graphene sheets and bonded CNTs bridging the graphene layers. The CNT/GAs exhibited enhanced surface area, mechanical properties, and electrical properties compared with pure GAs. Wang et al. Reference Wang, Yang, Ma, Jia and Ma105 prepared similar CNT/GAs using Fe catalyst instead of Ni to grow the CNTs. These aerogels also showed enhanced properties and impressive sorption of various organics.
E. Diamond aerogels
Diamond is a metastable allotrope of carbon well known for its extraordinary mechanical, thermal, and optical properties, as well as its chemical inertness. Realizing a high surface area aerogel consisting of nanodiamonds creates an exciting material with potential applications in a range of fields covering catalysis, photonics, sensing, and even drug delivery. Reference Manandhar, Roder, Hanson, Lim, Smith, Mann and Pauzauskie106 Examples of diamond aerogels are still relatively limited, but two methods have been reported: (i) high pressure, high temperature (HPHT) conversion of an amorphous CA and (ii) the use of RF sol–gel chemistry to covalently cross-link nanodiamonds. Both methods are discussed below.
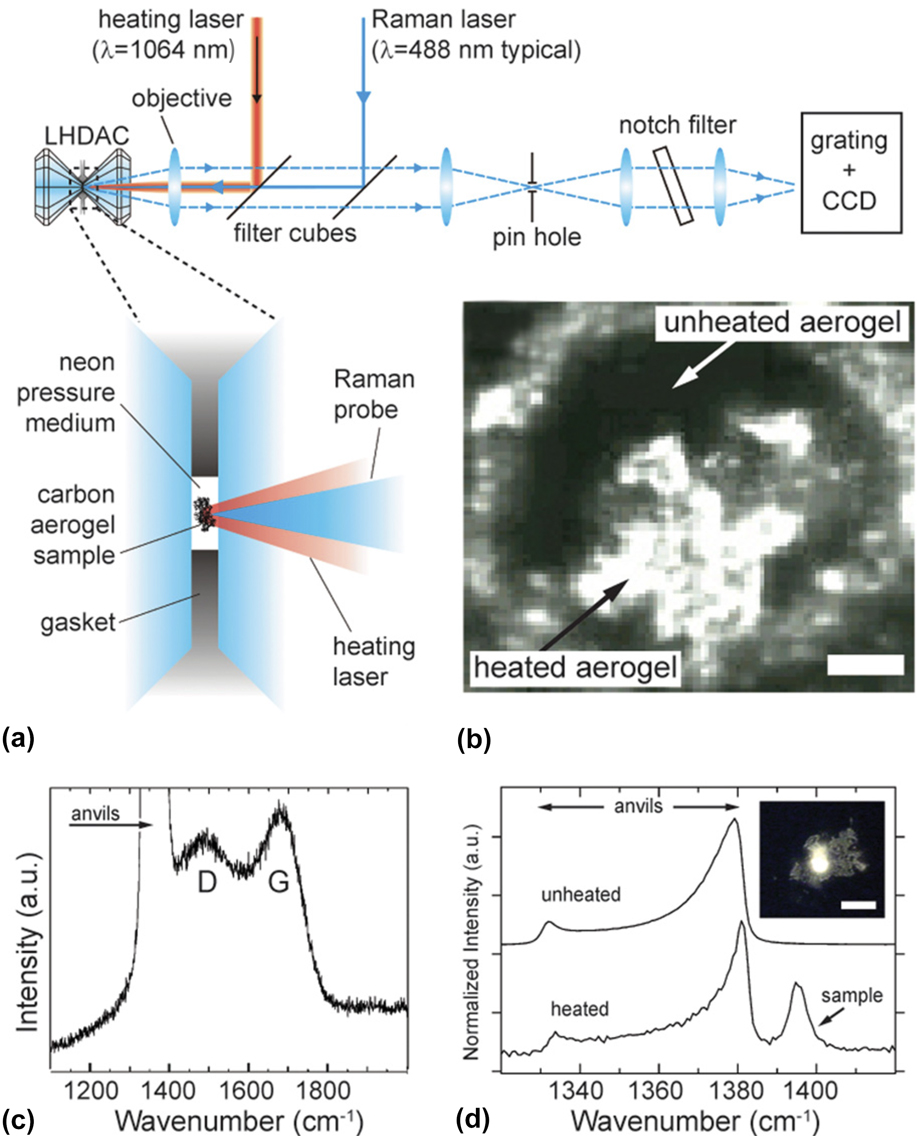
Pauzauskie et al. Reference Pauzauskie, Crowhurst, Worsley, Laurence, Kilcoyne, Wang, Willey, Visbeck, Fakra, Evans, Zaug and Satcher10 reported HPHT synthesis of diamond aerogels from an amorphous carbon precursor. In this study, the amorphous-to-crystalline phase transition is achieved by subjecting the amorphous precursor aerogel of density 0.04 g/cm3 to a high pressure until the material reaches the diamond state in the carbon phase diagram and the material is further heated to temperatures slightly above 1580 ± 40 K through a laser-heated diamond anvil cell (DAC) to overcome the kinetic barriers. The DAC with the amorphous aerogel is filled with supercritical neon at a pressure of 22 kpsi (Fig. 6). To maintain the aerogel structure at all length scales, a near hydrostatic pressure is maintained inside the DAC cavity. Formation of diamond aerogel is confirmed from Raman spectra by tracking both D and G bands of the amorphous precursor at approximately 22.5 GPa. Comparing the Raman spectra before and after heating an additional peak is observed due to newly formed diamond. This is again confirmed through TEM, which reveals the highly porous aerogel morphology and crystalline diamond particles. Electron diffraction confirmed the conversion from amorphous carbon to cubic diamond (Fig. S13).
Synthesis of diamond aerogel from amorphous CA precursor under high pressure and temperature. (a) Schematic of optical system used to heat the sample contained in the diamond anvil cell and to perform in situ Raman spectroscopy. The CA precursor is laser heated to likely more than 1600 K at several pressures between approximately 21 to 26 GPa to drive the transition to diamond. Dashed lines show path followed by collected light. (b) Optical transmission micrograph of synthesized diamond aerogel above 20 GPa following laser heating. Translucent regions were laser heated while dark regions were not heated as a control. Surrounding material is the rhenium metal gasket. Scale bar: 20 μm. (c) Raman spectrum of amorphous precursor at approximately 22.5 GPa showing both D and G modes consistent with prior reports of amorphous carbon. The intense peak between 1300 and 1400 cm−1 is due to the diamond anvil or anvils. (d) Comparison of the Raman spectrum in (c) with that obtained after heating (note difference in x-axis scale from c). The additional peak is due to newly formed diamond. The peak is resolvable from that of the anvils because of the different stress states and the spatial selection of the instrument. The difference in signal-to-noise is partly attributed to intense fluorescence from the diamond aerogel. Inset: Optical micrograph of fluorescence from diamond aerogel. Scale bar: 50 μm. Reproduced by permission from Ref. Reference Pauzauskie, Crowhurst, Worsley, Laurence, Kilcoyne, Wang, Willey, Visbeck, Fakra, Evans, Zaug and Satcher10 (Copyright (2011) National Academy of Science).
As the HPHT conversion process requires the use of a DAC, it can be cost prohibitive and the volume of diamond aerogel synthesis is limited to the size of the DAC. Therefore, Manandhar et al. Reference Manandhar, Roder, Hanson, Lim, Smith, Mann and Pauzauskie106 proposed the use of RF sol–gel chemistry to create diamond aerogels on a much larger scale. Given the chemically inert surface of the nanodiamonds and the presence of some amorphous soot, the nanodiamonds were first treated at 450 °C for 8 h in air. This provides the oxygen surface functionality required for covalent bonding with the RF polymer. From here the strategy is similar to that used by Lim et al. for fast sol–gel synthesis of GAs. Reference Lim, Hu, Manandhar, Sakshaug, Strong, Riley and Pauzauskie75 The nanodiamonds are suspended in acetonitrile, and gelation is achieved with the addition of RF and the acid catalyst. Final aerogels consist of nanodiamonds cross-linked with RF with surface areas greater than 500 m2/g.
F. Graphite aerogels
Graphite is the most stable allotrope of carbon and consists of many stacked layers of graphene sheets. Graphite is known for its excellent electrical and thermal conductivity, chemical and thermal stability, and low density. As such, in aerogel form, it is a potential candidate material for many of the same applications associated with CNT and GAs. Like diamond aerogels, examples of graphite aerogels are limited, but the reports below highlight the many benefits that such a material could provide.
Aerographite is the name by which most graphite aerogels are referred. The first example of this ultra-lightweight graphite aerogel was developed by a team of researchers from the University of Kiel and the Technical University of Hamburg. Mecklenburg et al. Reference Mecklenburg, Schuchardt, Mishra, Kaps, Adelung, Lotnyk, Kienle and Schulte107 developed a single-step CVD synthesis method for the fabrication of aerographite from a freely adjustable ZnO network. The ZnO tetrapod templates (densities ranging from 0.15 to 0.8 g/cm) are placed in a two-zone (200 °C and 760 °C) split tube furnace where the introduction of hydrogen gas flow reduces ZnO to metallic Zn that is precipitated into the exhaust system. The degree of crystalline order of the carbon structure and its morphology are controlled by the CVD parameters and also by the design of the ZnO templates (Fig. S14). During the synthesis, the carbon-feeding rate is a key parameter to adjust for the resulting density of aerographite (i.e., wall-thickness of graphitic layers of aerographite). Aerographite consists of a seamless interconnected network of closed shell microtubes, and the walls have nanoscopic thickness of (≈15 nm) like thin multiwall CNTs (MWCNTs) but have a microscale tube diameter (Fig. 7). Mechanical tests on the tetrapod-like aerographite exhibited an elastic recovery under compression for a 95% strain where the modulus of the sample (density 8.5 mg/cm3) increased to 160 kPa. The electrochemical performance of surface-modified aerographite tetrapodal network was measured though a three-electrode cell. Surface-functionalized aerographite with optimum porosity leads to significantly high specific capacitance (640 F/g) with high energy (14.2 W h/kg) and power densities (9.67 kW/kg). Reference Parlak, Kumar Mishra, Grigoriev, Mecklenburg, Luo, Keene, Salleo, Schulte, Ahuja, Adelung, Turner and Tiwari108 Besides the structural properties, aerographite samples exhibited piezo-resistive behavior where the DC electrical conductivity can increase up 10 S/m upon compression. Reference Garlof, Mecklenburg, Smazna, Mishra, Adelung, Schulte and Fiedler109
Overview of different aerographite morphologies by controlled derivations of synthesis. (a) Photograph of macroscopic aerographite. (b–d) 3D interconnected structure of closed-shell graphitic aerographite in different magnifications and TEM inset of wall. (e–h) Hierarchical hollow framework configuration of aerographite in different magnifications. (i–l) Other variants of aerographite. (i) Aerographite network in low aspect bubble-like configuration. (j–k) Aerographite with nanoporous graphite filling. (l) Hollow corrugated pipe design of aerographite surface by detailed adoption of template shape. Reproduced by permission from Ref. Reference Mecklenburg, Schuchardt, Mishra, Kaps, Adelung, Lotnyk, Kienle and Schulte107 (Wiley and Sons).

Apart from using ZnO tetrapods, Hirahara et al. Reference Hirahara, Hiraishi, Imadate, Xu, Hirota and Nishiyama110 reported a new morphology of spiked-shell microparticles of aerographite where they used sea-urchin-like microparticles of ZnO, the so-called ZnO nanorod-microspheres as templates for the synthesis of these spiked-shell aerographite. Compressing these spiked shell aerographite, the authors reported an elastic recovery after 73% strain. Chandrasekaran et al. Reference Chandrasekaran, Liebig, Mecklenburg, Fiedler, Smazna, Adelung and Schulte111 reported a thermoset composite with tetrapod-like aerographite as a filler in the range of 0.1–1.2 wt%. The composites were electrically conductive (2–8.7 S/m), and when uniaxially compressed, the composites exhibited an increase in energy absorption of ∼133% per unit volume for 1.5 wt% of aerographite when compared with pure epoxy.
III. GRAPHENE-INSPIRED AEROGELS
The extraordinary properties and performance of graphene has inspired an explosion of research interest in a number of other 2D or layered materials. This interest in graphene-inspired materials has also become evident in the aerogel community. With the many successes reported in both the synthesis and application of GAs, researchers now look to create aerogel materials using other 2D materials, with the goal of realizing the novel properties and advantages that the aerogel form offers. Although inspired by graphene, synthesis of graphene-inspired aerogels tends to be more challenging because, typically, no water-soluble precursor (e.g., GO analog) is readily available. Therefore, in many cases, new strategies are adopted to realize these next-generation aerogel materials.
A. Boron nitride aerogels
Like graphene, hexagonal BN is a 2D material highly prized for its chemical inertness, high melting temperature, high thermal conductivity, and low density. However, in contrast to carbon, BN is an electrical insulator. It has a similar structure to graphene except that the carbon atoms are replaced by alternating boron and nitrogen atoms. The first example of a BN aerogel was reported by Lindquist et al. Reference Lindquist, Borek, Kramer, Narula, Johnston, Schaeffer, Smith and Paine112 in which a poly(borazinyl amine) aerogel is used as the precursor aerogel. This precursor aerogel is annealed up to 1200 °C in ammonia, and then up to 1500 °C in argon to produce turbostratic BN aerogels. These aerogels exhibited surface areas greater than 300 m2/g, which were maintained at high temperatures and possessed very fine pore structure (mean pore diameters of 7–20 nm). However, the synthesis scheme for producing the poly(borazinyl amine) precursor gel requires an oxygen-free environment, which can be restrictive, therefore simpler synthetic routes have been pursued. For example, Rousseas et al. Reference Rousseas, Goldstein, Mickelson, Worsley, Woo and Zettl17 used a graphene precursor aerogel in a fairly straightforward BN aerogel synthesis scheme. This method takes advantage of one of the earliest known synthetic routes to pure BN. Reference Friederich and Sittig113 The reaction involves the carbothermal reduction of boron oxide in the presence of nitrogen according to the equation
 $${{\rm{B}}_2}{{\rm{O}}_3} + 3{\rm{C}} + {{\rm{N}}_2} \to 2{\rm{BN}} + 3{\rm{CO}}\quad {\rm{.}}$$
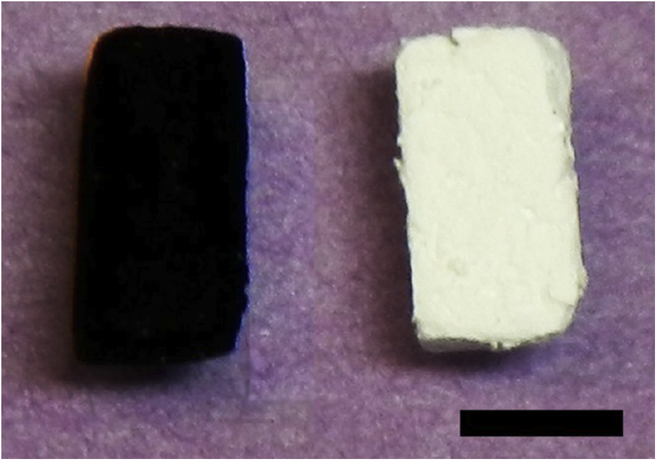
This method is widely used in industry Reference Paine and Narula114 and has been exploited to make other BN nanostructures from carbon precursors. Reference Han, Brutchey, Tilley and Zettl115 Here, the GA serves as the carbon source for reduction of boron oxide and as the template for determining the pore structure of BN aerogel at temperatures above 1500 °C. The effectiveness of this method is striking when looking at the aerogel before (black graphene precursor) and after (final white BN) as seen in Fig. 8. A closer look at the pore structure using TEM (Fig. S15) reveals that the BN aerogel is highly crystalline. In fact, it appears even more crystalline than the precursor GA. This is likely due to the fact that the GA itself becomes more crystalline at temperatures above 1500 °C, Reference Worsley, Pham, Yan, Shin, Lee, Bagge-Hansen, Mickelson and Zettl98 and this crystallinity is reproduced in the BN aerogel. The BN aerogel possesses surface areas greater than 400 m2/g, excellent resistance to oxidation, and superhydrophobicity. These properties make it a promising material for reusable sorbent Reference Pham, Goldstein, Lewicki, Kucheyev, Wang, Russell, Worsley, Woo, Mickelson and Zettl116 and combustible gas sensor Reference Harley-Trochimczyk, Pham, Chang, Chen, Worsley, Zettl, Mickelson and Maboudian117 technologies.
Photograph of a precursor GA (left) and a converted BN aerogel (right). The color of the aerogel undergoes a significant color change, from pitch black to bright white, indicating a major change in the chemical composition. However, the overall macroscopic geometry of the samples remains unchanged. Samples shown have roughly square cross-sections. Scale bar is 5 mm. Reproduced by permission from Ref. Reference Rousseas, Goldstein, Mickelson, Worsley, Woo and Zettl17 (American Chemical Society).
Lower temperature synthetic routes have also been reported for BN aerogels. Song et al. Reference Song, Li, Yang, Ding, Zhang and Xie118 used a template-assisted method to grow BN aerogels at temperatures as low as 900 °C. This method starts with a CA template and uses borazine as a source to deposit BN via CVD. The carbon template can be removed by calcination in oxygen at 600 °C to yield a BN aerogel with surface areas as high as 1051 m2/g. A further reduction in the temperature required for BN aerogel synthesis was reported by Lei et al. Reference Lei, Mochalin, Liu, Qin, Gogotsi and Chen119 Lei et al. succeeded in producing aqueous colloidal suspensions of BN which form hydrogels at room temperature. To achieve this, the BN powder is ball milled with urea to both exfoliate and functionalize the sheets with amine groups, which renders the BN water dispersible. Colloidal suspensions with concentrations as high as 30 mg/mL were prepared with this method. At these high concentrations, the suspensions form gels that can be freeze-dried to produce the aerogel. These aerogels have densities ranging from 1.4 to 20 mg/cm3 and surface areas greater than 250 m2/g.
B. Phosphorene aerogels
Phosphorene, also referred to as BP, consists of a single layer of phosphorus atoms in a hexagonal lattice analogous to graphene. Reference Liu, Du, Deng and Ye120,Reference Lin, Chui, Li and Lau121 Like graphene, it has excellent transport properties and low density, but also has a widely tuneable band gap that depends on the number of layers present. Reference Woomer, Farnsworth, Hu, Wells, Donley and Warren122 One of the more challenging aspects of working with BP is that it is not stable in air but will readily oxidize over time. The instability of BP in ambient conditions means that synthesizing a pure BP aerogel would be difficult. To overcome this obstacle, Xing et al. Reference Xing, Jing, Liang, Qiu, Li, Cao, Li, Fan and Zhang123 sought to create a BP/GO composite aerogel. Given the instability of BP, an ultrafast GO gelation method was chosen that could produce a gel in a matter of minutes using poly(oxypropylene)diamine as the cross-linking agent. Reference Wan, Li, Zhao, Hu, Hao, Winkler, Xi, Hughes and Qiu124 To prepare the composite gel, the poly(oxypropylene)diamine was added to an aqueous suspension of GO and BP nanoflakes (BPNFs), which were sealed in a vial and placed in a 90 °C bath for 1 min. After the gel formed, it was freeze-dried to create the BP/GO aerogel. The BP/GO aerogel exhibited sheet-like morphology expected of a 2D material and was of fairly low density (12 mg/cm3 with 13.4 wt% BP). Xing et al. found that BP was very stable in the composite aerogel, showing less oxidation than is found in bulk BP (Fig. S16) and that the BP remained stable for at least 30 days in air. It is suggested that the GO sheets cover and protect the BPNF within the aerogel. The BP/GO aerogel showed enhanced photothermal activity in comparison to the pristine GO aerogels owing to the presence of BP in the composite.
C. Transition metal dichalcogenide aerogels
Transition metal dichalcogenides (TMDs) are a class of layered material in which a single sheet consists of a layer of metal atoms (e.g., Mo, W, V, etc.) sandwiched between two layers of chalcogen atoms (e.g., S, Se, or Te). These 2D materials, like graphene, have generated a lot of interest due to their exceptional properties for applications such as catalysis, energy storage, sensors, and electronics. Reference Wang, Kalantar-Zadeh, Kis, Coleman and Strano125–Reference Ortiz-Quiles and Cabrera127 Although there are a number of reports on chalcogels, Reference Gacoin, Malier and Boilot128–Reference Rechberger and Niederberger132 examples of pure TMD aerogels remain limited. Reference Shehzad, Xu, Gao and Duan133 In 2015, Worsley et al. Reference Worsley, Shin, Merrill, Lenhardt, Nelson, Woo, Gash, Baumann and Orme18 reported a fairly straightforward method for MoS2 and WS2 aerogels. Aqueous solutions of precursor salts, ammonium thiomolybdate (ATM) and ammonium thiotungstate (ATT) were prepared and freeze-dried yielding a precursor aerogel. Next the precursor aerogels were simply annealed at 450 °C to yield pure TMD aerogels (Fig. 9). The MoS2 and WS2 aerogels exhibited the expected sheet-like morphology but due to significant restacking of the sheets during processing, surface areas were typically less than 20 m2/g. Wu et al. Reference Wu, Liu, Yan and Zhang134 reported a similar morphology by freeze casting an aqueous suspension of WS2 powder.
(a) Synthesis scheme for MoS2 and WS2 aerogels. SEM images of (b) ATM, (c) ATT, (d and f) MoS2, and (e and g) WS2 aerogels. TEM images of (h) MoS2 and (i) WS2 aerogels. The inset in images (h) and (i) is the magnification of the white box and is 10 nm in width. Reproduced by permission from Ref. Reference Worsley, Shin, Merrill, Lenhardt, Nelson, Woo, Gash, Baumann and Orme18 (American Chemical Society).

For energy storage and catalysis, typically larger surface areas are desired. In addition, for electrochemical storage or electrocatalysis a more conductive framework is preferred. Therefore, using the same general scheme, MoS2/GAs were synthesized. After the GA is immersed in the ATM solution, it is freeze-dried and annealed to produce the MoS2/GA. This composite aerogel showed high surface areas (greater than 700 m2/g), was electrically conductive, and showed good catalytic activity. Reference Worsley, Shin, Merrill, Lenhardt, Nelson, Woo, Gash, Baumann and Orme18 The catalytic performance of MoS2/GAs is consistent with similar work by other groups. Reference Zhao, Xie, Zhang, Liu, Ahn, Sun and Wang135,Reference Liu, Zhao, Zhang, Lin and Wu136 TMD/GAs have also shown promise in energy storage and sensor applications. Reference Jiang, Lin, Li, Song, Xia, Li and Zeng137–Reference Lee, Peng, Loh, Huang and Xue141
IV. 3D PRINTING
CAs have played an integral role in the development of 3D printed or additively manufactured aerogels. GAs, in particular, have led the way in terms of bringing these two fields. Reference Zhu, Liu, Qian, Chen, Chandrasekaran, Yao, Song, Duoss, Kuntz, Spadaccini, Worsley and Li142 3D printed aerogels are especially exciting because they represent the application of 3D printing to functional materials, not simply models. With the wide scope of applications already demonstrated for GAs, they are promising candidates for showing the potential of 3D printed functional materials. 3D printing is also capable of addressing one of the main weaknesses of aerogels, which is the inherently random nature of their pore morphology. This random pore morphology means that mass transport through an aerogel is typically slow and hard to tune. By using 3D printing to engineer the macropore architecture, mass transport can be easily tailored. Thus, applications that rely on the transport of some species through aerogels (e.g., energy storage, filtration, desalination, catalysis, etc.) can take advantage of optimally tailored pore morphology in 3D-printed aerogels to maximize their performance. Reference Zhu, Liu, Qian, Han, Duoss, Kuntz, Spadaccini, Worsley and Li143,Reference Lin, Liu, Casano, Bhavsar, Kinloch and Derby144
To date, a number of different micro extrusion-based techniques have been reported to create 3D-printed CAs. In general, they all depend on flowing a carbon-based ink through a nozzle, which upon extrusion becomes a solid. Following is a summary of the methods currently reported for 3D printing CAs.
A. Direct ink writing
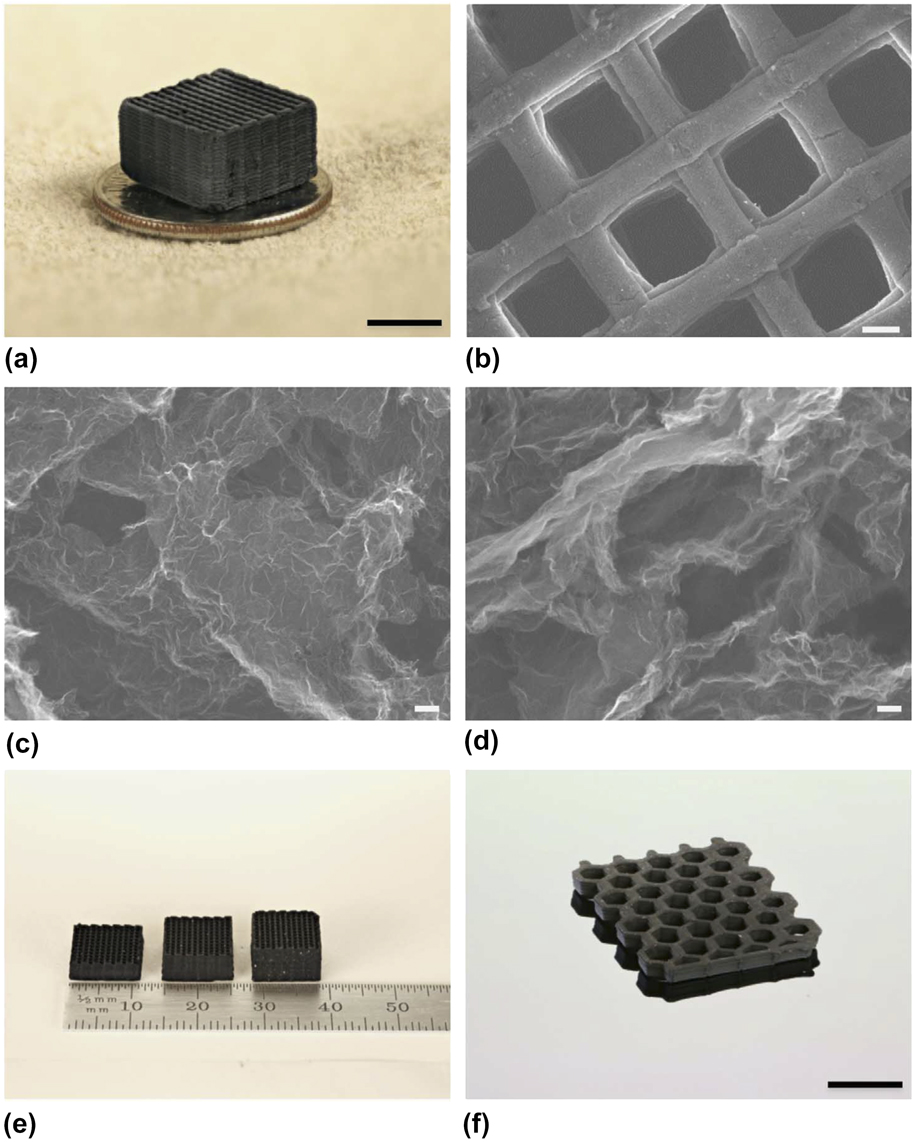
Zhu et al. Reference Zhu, Han, Duoss, Golobic, Kuntz, Spadaccini and Worsley145 developed a GO-based ink that made GAs compatible with the 3D-printing technique known as direct ink writing (DIW). DIW involves extruding the ink through a fine nozzle that is programmed to follow a toolpath which allows the construction of a 3D structure. A key requirement of the ink is that it is thixotropic, e.g., it flows under applied shear but reverts back to a self-supporting solid when the shear is removed. Here, the authors created inks consisting of high-concentration GO suspensions (20–40 mg/mL GO) that exhibited shear-thinning behavior as a non-Newtonian fluid. To further enhance the yield stress of the inks, viscosifiers such as hydrophilic fumed silica powders were added. These inks exhibit the desired viscoelasticity and have a long pot life (in weeks) when refrigerated. One of the challenges involved in 3D printing ultralow-density aerogels is that the ink must remain wet during printing and gelation. This is required so that the liquid from the wet gel can be either removed by freeze-drying or supercritical drying to avoid pore collapse due to capillary forces present during ambient drying. Hence, the ink was printed in an organic solvent bath (isooctane), which is not miscible with the aqueous GO ink. The organic solvent not only helps to keep the aerogel wet but also prevents drying of the ink in the nozzle which can cause clogging. After supercritically drying the printed gel, the structure was heated to 1050 °C under N2 to thermally reduce the GO to sp 2 carbon. Finally, the fumed silica was etched using hydrofluoric acid. The physical properties of the 3D printed aerogel are similar to those of the bulk aerogel (Fig. 10). The DIW aerogel had large surface areas (up to 1100 m2/g) and pore volumes (2–4 cm3/g), and a C:O ratio above 20. The electrical conductivity of the DIW aerogels varied from 87 to 278 S/m, and the aerogel exhibited supercompressibility up to 90% compressive strain. The Young’s modulus versus density of bulk and printed GAs obeyed the power-scaling law (E ∝ ρ2.5) indicating that the failure mechanism is mainly bending dominated for these cellular materials. Interestingly, the engineered microlattice displayed a higher (almost twice) Young’s modulus for a given density than bulk GAs. Electrical resistance change with cyclic compression up to 50% strain for 10 cycles for the printed GA was almost constant with a slight decrease of <5% change. This is consistent with the results reported by Zhang et al. Reference Zhang, Zhang, Medarametla, Li, Zhou and Lin146 and Lin et al. Reference Lin, Liu, Casano, Bhavsar, Kinloch and Derby144 showing that printed GAs are structurally resilient and highly conductive.
Morphology and structure of GAs. (a) Optical image of a 3D printed GA microlattice. SEM images of (b) a 3D printed GA microlattice, (c) GA without RF after etching and (d) GA with 4 wt% RF after etching. Optical image of (e) 3D printed GA microlattices with varying thickness and (f) a 3D printed GA honeycomb. Scale bars, 5 mm (a), 200 mm (b), 100 nm (c, d), and 1 cm (f). Reproduced by permission from Ref. Reference Zhu, Han, Duoss, Golobic, Kuntz, Spadaccini and Worsley145 (Nature Publishing Group).
B. Inkjet
Zhang et al. Reference Zhang, Zhang, Medarametla, Li, Zhou and Lin146 combined 3D printing with freeze casting to fabricate GA with low density (10 mg/cm3). A low concentration aqueous GO suspension (10 mg/mL) was used as the ink. The ink was deposited by syringe directly on a cold sink which was maintained at a temperature of −25 °C. In this manner, individual layers of GO suspension were instantaneously frozen, constructing the 3D structure. Since the aqueous GO ink is rapidly frozen and ice crystals are selectively formed in the aqueous solutions, this technique can also be used to print material dropwise on demand onto the ice scaffold to obtain truly 3D structures. The low-viscosity inks exhibit Newtonian fluid behavior and the concentrations of the ink can go as low as 1 mg/mL. The advantage of this printing technique is the interlayer diffusion in the printed structures. The liquid ink was dispensed on the frozen material which was maintained at −25 °C. Once in contact, this melted the frozen layer and the low-viscosity ink filled the voids between layers through surface tension and gravitational forces and both layers were re-frozen again as they were still in contact with the cold surface. Therefore, the 3D-printed structure exhibited good structural integrity from the bonding between layers (Fig. S17). The printed GAs possessed conductivities of 2–15 S/m and were electrically resilient when compressed multiple times. The electromechanical properties were studied by monitoring the resistivity change as a function of compressive strain. The printed GAs displayed a linear behavior and no hysteresis. Mechanical properties under compressive loading show a nonlinear superelastic behavior and a reversible compressibility up to 50% strain. 3D printed aerogels also exhibited remarkable viscoelastic stability over a temperature range from −100 to 300 °C.
C. Room temperature freeze gelation
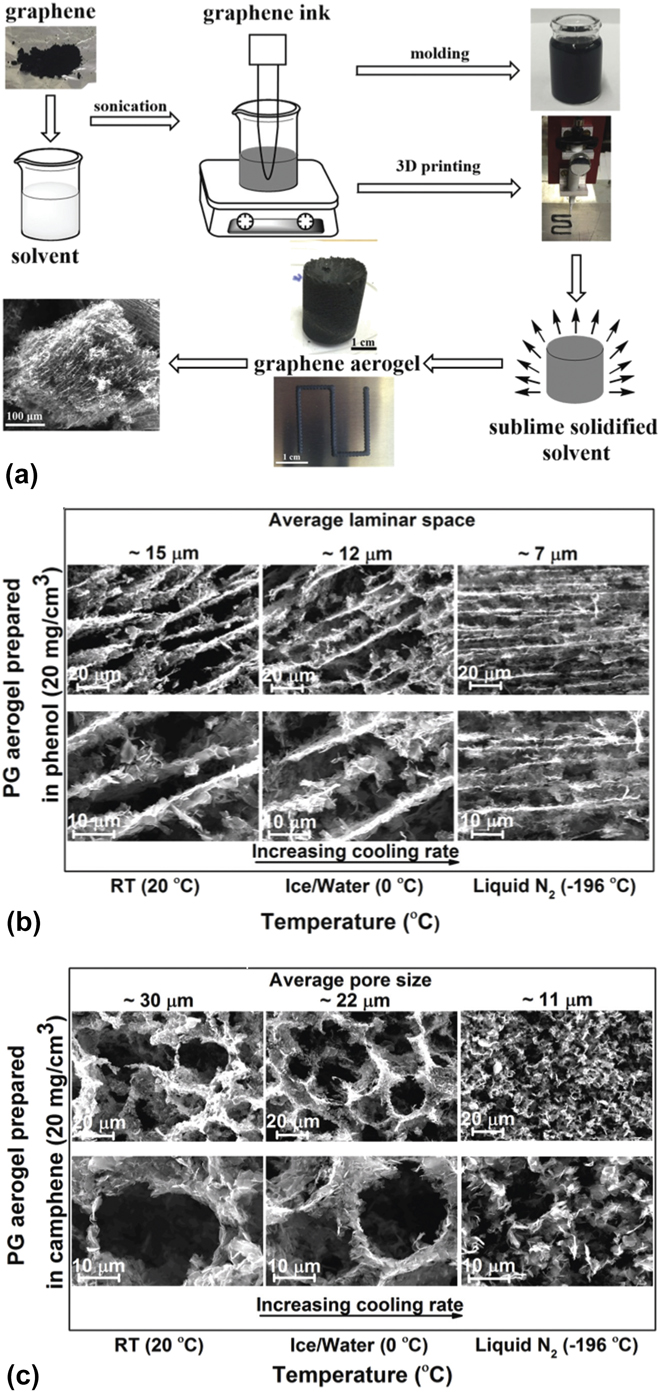
Lin et al. Reference Lin, Liu, Casano, Bhavsar, Kinloch and Derby144 introduced the use of room temperature freeze gelation (RTFG) to 3D print pristine graphene, not GO. RTFG bears similarities with both the freeze casting used in the inkjet method Reference Zhang, Zhang, Medarametla, Li, Zhou and Lin146 and the DIW technique, Reference Zhu, Han, Duoss, Golobic, Kuntz, Spadaccini and Worsley145 Like DIW, RTFG extrudes a filament through a micronozzle and follows a toolpath to build the 3D structure. Temperature is used, similar to freeze casting, to make the ink self-supporting on deposition on the stage. Room temperature printing is possible because the ink consists of graphene suspended in an organic solvent (camphene or phenol) with a melting point above room temperature. Solvents with high vapor pressures were selected so that sublimation of the solvent could also proceed at room temperature. The resulting architectures are similar to those obtained via traditional DIW, while the solvent determines the microstructures. In fact, very different microstructures were obtained depending on the solvent used. With phenol, a lamellar, directionally biased morphology was produced, consistent with aqueous freeze casting reports. Reference Qiu, Liu, Chang, Wu and Li147,Reference Liu, Huang, Li, Wang, Gui and Yu148 Camphene, however, solidifies more like a metal with “rough interfaces” which are templated into the GA, giving it a more random pore morphology (Fig. 11). The RTFG GAs did require polymer reinforcement to bolster mechanical properties due to an absence of chemical cross-links, but large surface areas (up to 700 m2/g) and high electrical conductivities (up to 9 S/cm) were reported for densities of 20 mg/cm owing to the use of pristine graphene. The RTFG aerogels also showed promising performance as electrochemical double-layer capacitor electrodes with energy densities as high as 27 W h/kg and power densities up to 21 kW/kg, some of the highest values reported for 3D printed aerogels.
(a) Schematic of the RTFG process. (b, c) SEM images of (b) phenol-based and (c) camphene-based aerogel structures cooled using liquid N2, an ice/water mixture, and at room temperature. Reproduced by permission from Ref. Reference Lin, Liu, Casano, Bhavsar, Kinloch and Derby144 (Wiley and Sons).
V. SUMMARY AND CONCLUSIONS
Since their invention in the early 1990s CAs have continued to evolve and push the aerogel community forward. This evolution began with the synthesis of the various carbon allotropes (e.g., CNTs, diamond, graphite, and graphene), graphene-inspired aerogels (e.g., BN, phosphorene, and transition metal dichalcogenides) and continues as the leading edge in 3D-printed aerogel materials. The extraordinary and wide-ranging properties of these novel materials will continue to be a driver for next generation technologies in energy storage and conversion, filtration and separations, catalysis, and sensors.
3D printing of aerogels will also continue to be a growing field. With the potential to decouple traditionally correlated aerogel properties such as pore size and mass transport, research into adapting CAs to additional 3D printing methods as well as the use of modeling and optimization to determine the ideal aerogel architectures will continue to be areas of high interest. Lastly, in the wake of the advances in 3D-printed CAs, expanding 3D printing of other aerogel materials (e.g., metal oxides, metals, carbides, nitrides, etc.) is a clear area of future growth. With this in mind, the major role that CAs has played in the past 30 years should persist as the search for tomorrow’s technology breakthroughs continues.
Supplementary Material
To view supplementary material for this article, please visit https://doi.org/10.1557/jmr.2017.411.
ACKNOWLEDGMENTS
This work was performed under the auspices of the U.S. Department of Energy by Lawrence Livermore National Laboratory under Contract DE-AC52-07NA27344. Funding was provided by the Lawrence Livermore National Laboratory Directed Research and Development (LDRD) Grant Nos. 16-ERD-051, 14-SI-004, and 13-LW-099.




 Open access

