


Introduction
Neuroimaging encompasses a range of modalities used to investigate and visualize brain structure and function. Technologies such as MRI and positron-emission tomography (PET), whether used independently or in combination, have significantly advanced our understanding of the human brain in both health and disease. Reference Catana, Drzezga, Heiss and Rosen1–Reference Zimmer, Leuzy, Benedet, Breitner, Gauthier and Rosa-Neto4 These tools have played a crucial role in identifying pathological features of neurological disorders like Alzheimer’s disease, Parkinson’s and epilepsy, Reference Bidesi, Vang Andersen, Windhorst, Shalgunov and Herth3,Reference Valkanova and Ebmeier5,Reference Peet, Spina, Mundada and La Joie6 enhancing our ability to distinguish between complex conditions such as Alzheimer’s disease and other dementias. Reference Valkanova and Ebmeier5,Reference Peet, Spina, Mundada and La Joie6
The human brain varies across individuals due to complex genetic and environmental factors. Reference Gu and Kanai7–Reference Lenroot and Giedd9 While brain imaging genetics is still emerging, voxelwise genetic association analyses have explored how single nucleotide polymorphisms influence specific brain regions at a voxel level. Reference Li, Liu and Li10 Similarly, studies of cortical gene expression offer insights into how variations in regions contribute to differences in functional connectivity. Reference Xin, Ortiz-Terán and Diez11,Reference Dickie, Tahmasebi and French12 Environmental factors also shape brain health, either negatively or positively. Reference Xu, Liu and Polemiti13,Reference Tost, Champagne and Meyer-Lindenberg14 A classic example is the contrast between urban and rural living. While cities offer better infrastructure and resources, they may expose individuals to environmental stressors like pollution and limited green spaces. An analysis of the UK Biobank dataset 15 found strong links between urban living and psychiatric symptoms, such as anxiety and depression. Reference Xu, Liu and Polemiti13 Together, genetic and environmental differences shape behavior, disease susceptibility and resilience, Reference Genon, Eickhoff and Kharabian16,Reference Reiman, Arboleda-Velasquez and Quiroz17 underscoring the need for research to embrace this complexity.
Historically, neuroimaging research has been concentrated in the Global North, resulting in limited representation of population diversity. While recent efforts have aimed to include underrepresented groups, Reference McGlinchey, Duran-Aniotz and Akinyemi18,Reference Adams, Evans and Terzikhan19 addressing demographic diversity within local contexts remains equally important. Neuroimaging studies should reflect the full spectrum of human diversity, across race and ethnicity, sex, age and socioeconomic status, to ensure findings are broadly applicable. Research has demonstrated that the relationship between brain structure and cognitive decline differs across ethnic and racial groups. Reference Gavett, Fletcher and Harvey20 For example, a longitudinal study found that global gray matter change was the strongest predictor of cognitive decline in White and African American participants, whereas baseline white matter hyperintensity volume was more predictive for Hispanic participants. Reference Gavett, Fletcher and Harvey20 Similarly, another study found significant volumetric differences between African American and White participants in several brain regions, including white matter and the thalamus. Reference Atilano-Barbosa and Barrios21 These findings underscore the biological relevance of demographic diversity. Furthermore, an analysis of the Imaging Dementia-Evidence for Amyloid Scanning (IDEAS) study dataset Reference Wilkins, Windon and Dilworth-Anderson22 revealed that amyloid PET positivity, a biomarker of Alzheimer’s disease, Reference Wilkins, Windon and Dilworth-Anderson22,Reference Jack, Bennett and Blennow23 varied by race and ethnicity among White, Hispanic and Asian patients. Reference Wilkins, Windon and Dilworth-Anderson22,Reference Jack, Bennett and Blennow23 Age and sex differences in brain morphology are also well documented, Reference Liu, Wen and Zhu24,Reference Zhao, Matloff, Ning, Kim, Dinov and Toga25 further emphasizing the need for representative sampling for accurate diagnosis and effective treatment development.
Neuroimaging can help establish cutoff values for tools like plasma biomarkers. Reference Schindler, Karikari and Ashton26 If studies lack diversity, those values may not be universally applicable. Despite this, demographic reporting in neuroimaging remains inadequate. A recent review of US MRI research found that only 10% of 408 articles reported race, 4% reported ethnicity and 77% reported sex. Reference Sterling, Pearl, Liu, Allen and Fleischer27 Reporting varied by disease area, with psychiatric disorders showing the highest rate of sex reporting. Among studies that reported race and ethnicity, 55% of participants were White, 0.4% American Indian, 13% Black or African American and 2% Asian. While some of these were consistent with the US population, underrepresentation persists, particularly among Asian and Hispanic or Latino individuals, a pattern also observed in a US review of Alzheimer’s disease neuroimaging research. Reference Sterling, Pearl, Liu, Allen and Fleischer27,Reference Lim, Barnes and Weissberger28 A separate analysis of 536 MRI and electroencephalography (EEG) research articles found race and ethnicity reported in less than 4% of studies. Reference Goldfarb and Brown29 Similarly, only 14.8% of 919 studies included in a systematic review of MRI/fMRI publications across nine high-impact neuroscience journals included such data. Reference Gard, Shariq and Albrecht30 This trend appears widespread in the field, making it challenging to account for or model ethnoracial diversity.
Limited physical access to neuroimaging technologies also drives underrepresentation. Most scanners are located in urban research centers and hospitals, far from remote communities. To improve access and representation, we must first understand the current demographic landscape. In this work, we describe the demographic makeup of MRI and PET neuroimaging study participants in Quebec, Canada. This initiative supports the mission of the Quebec Bioimaging Network (QBIN) 31 to promote equitable access and enhance diversity in imaging research. Our objective was to provide a comprehensive overview of key demographic factors: age, sex, race and ethnicity, and geographic representation. Here, geographic location refers to the site of data collection, assumed to reflect the participants’ location.
Methods
A preliminary search of databases (Medline, Embase, Google Scholar) was conducted, and no current or underway systematic or scoping reviews on this topic were identified. The review encompassed sources published between 1992 and 2023, with 1992 marking the introduction of the MINC medical imaging file format. A scoping review was conducted in accordance with the JBI methodology for scoping reviews Reference Aromataris, Lockwood, Porritt, Pilla and Jordan32 and with an a priori protocol registered with the open science framework. Reference Oyeniran, Anazodo, Leener and Alonso-Ortiz33
Search strategy
The search strategy aimed to locate published studies that used MRI and/or PET imaging (the two most common neuroimaging research tools) to examine the human brain in the province of Quebec, Canada. A preliminary search was performed to identify relevant keywords and index terms to support the development of a robust search strategy on MEDLINE, Embase and Google Scholar databases (see Supplementary Materials, S1 for a complete list). Reference lists for some of the included studies were screened for additional studies that may not have been captured in our search. For studies that used the same datasets, efforts were made to identify the original study. The search strategy was reviewed and validated by the team in consultation with a librarian and iteratively refined by continuously assessing the relevance of retrieved studies. The Ovid interface was used to search the Medline and Embase databases, while the public or perish interface Reference Harzing34 was used for the Google Scholar database.
Study/source of evidence selection
Following the search, all identified citations were compiled and uploaded into Covidence (Veritas Health Innovation, Melbourne, Australia), where duplicates were removed. Team members screened titles and abstracts to assess their relevance based on the inclusion criteria. The full texts of studies that passed the screening stage were then thoroughly evaluated against the inclusion criteria. Reasons for excluding studies that did not meet the inclusion criteria were documented and reported. The results of the search and the study inclusion process are shown in a Sankey diagram (Figure 1). The results are reported in full in the PRISMA chart in Supplementary Materials Figure 1.
Sankey diagram visually representing the process of retrieving and screening studies. For the interactive figure with detailed numbers and criteria, as well as an interactive treemap containing links to all studies included in this review, see the interactive publication: https://preprint.neurolibre.org/10.55458/neurolibre.00035/.

Inclusion criteria
Participants
Our review included original research studies that use MRI and/or PET to investigate the human brain across all age groups between 1992 and 2023.
Concept
Research focused on the brain in both healthy and diseased states using PET and/or MRI. Studies that used PET and/or MRI with other modalities, such as CT, EEG, ultrasound etc., but did not report the number of participants that were scanned with MRI and/or PET were excluded.
Context
The study must have taken place in the province of Quebec, Canada. Multicenter studies with participants from Quebec were included if demographic details were provided. Studies with unspecified/undetermined location were excluded.
Studies that reused datasets were excluded to prevent duplication or overestimation of data. Reviews and meta-analyses, case reports and series, animal studies, correspondences, conference abstracts or articles and registered reports were excluded. Postmortem brain studies and studies with publicly available datasets outside Quebec were also excluded.
Data extraction
Data were extracted from the articles included in the review by the research team with the assistance of an online AI research tool (Elicit). Reference Whitfield and Hofmann35 The data extraction process was conducted in two phases: the first phase involved primary data extraction following the template developed in the registered protocol (Supplementary materials, S2), while the second phase entailed the final extraction process, during which the data were refined and summarized. The extracted data included specific details about the participants, concept, context and key findings relevant to our study. The key data of interest for this review included age, sex, race and ethnicity, and study geographic location. Instances of missing data were categorized as “not reported.” Data extraction from multinational or multicenter studies was limited to participants based in Quebec.
Data processing
Extracted data were organized in a spreadsheet for readability and ease of use in creating reproducible figures.
Studies were categorized by population characteristics in the following categories: epilepsy, Parkinson’s, Alzheimer’s disease, mental and behavioral disorders (excluding dementia precipitated by Parkinson’s or Alzheimer’s disease), multiple sclerosis, cerebrovascular disease, cancer and tumors, newborns and infants, concussion and injuries, vision disorders, pain and healthy population studies.
In studies where sex and gender information were used interchangeably or inconsistently, we assumed the intended meaning was biological sex. Specifically, if a study referred to “gender” but used the labels “male” and “female,” we recorded it as reporting sex. Similarly, if a study referred to “sex” but used labels “man” and “woman,” we also recorded it as reporting sex (male and female).
Race and ethnicity were categorized based on the labels used in each study (i.e., White, Black, Asian, Middle Eastern, Caribbean, Jewish). Some generalizations were made, such as grouping all instances of African or African-American origin under the category “Black,” Caucasians as “White” and all instances of East Asian, South Asian and Southeast Asian as “Asian.” Additional categories were created: “Other” for cases where race and ethnicity were reported but did not fit into the study’s predefined categories and “Not Specified” for instances where authors attempted to report race and ethnicity but lacked information for a particular participant. These categories differ from “Unreported Ethnicity,” which applies to studies that did not provide any race and ethnicity-related data.
The mean age was recorded when provided and calculated when necessary, such as in studies that reported average ages for multiple participant groups but not an overall mean. Studies that only provided an age range were categorized as having insufficiently reported age data.
For regional analyses, studies were categorized based on Quebec’s 17 administrative regions. Multi-site studies were excluded when the number of participants originating from Quebec was not explicitly provided.
Results
We included a total of 1,549 studies after applying the inclusion and exclusion criteria, including 1,267 MRI studies, 62 PET studies and 220 studies using both modalities. These studies represent 62,510 participants scanned over 33 years (54,904 for MRI, 1,890 for PET, 5,716 for both). Of all MRI and PET neuroimaging studies in Quebec, 92.7% took place in the city of Montreal (Figure 2). This pattern persists when considering MRI or PET studies separately. We identified 0 hybrid PET/MRI studies (which is unsurprising given that the province of Quebec does not currently house a hybrid PET/MRI scanner).
Regional distribution of human MRI and PET studies in Quebec’s 17 administrative regions. Each marker’s geographical position represents the center of the administrative region, independently of the exact location of the study. Each marker’s size is proportional to the number of studies conducted in the region. For the interactive map, and to filter studies by imaging modality, see the reproducible publication: https://preprint.neurolibre.org/10.55458/neurolibre.00035/.

Figure 3 shows the distribution of participant ages in the form of a histogram sorted by average age, with a gray bar indicating studies that did not adequately report age information. The largest concentration of studies (over one-third) falls within the 20–35 age range, with another peak observed between 60 and 75 years of age. Notably, 22.1% of studies, representing 17.7% of participants, either fail to report participant age entirely or provide insufficient details, such as only an age range.
Histogram of studies by average age of participants. For the interactive figure, and to group by number of studies or number of participants, see the reproducible publication: https://preprint.neurolibre.org/10.55458/neurolibre.00035/.

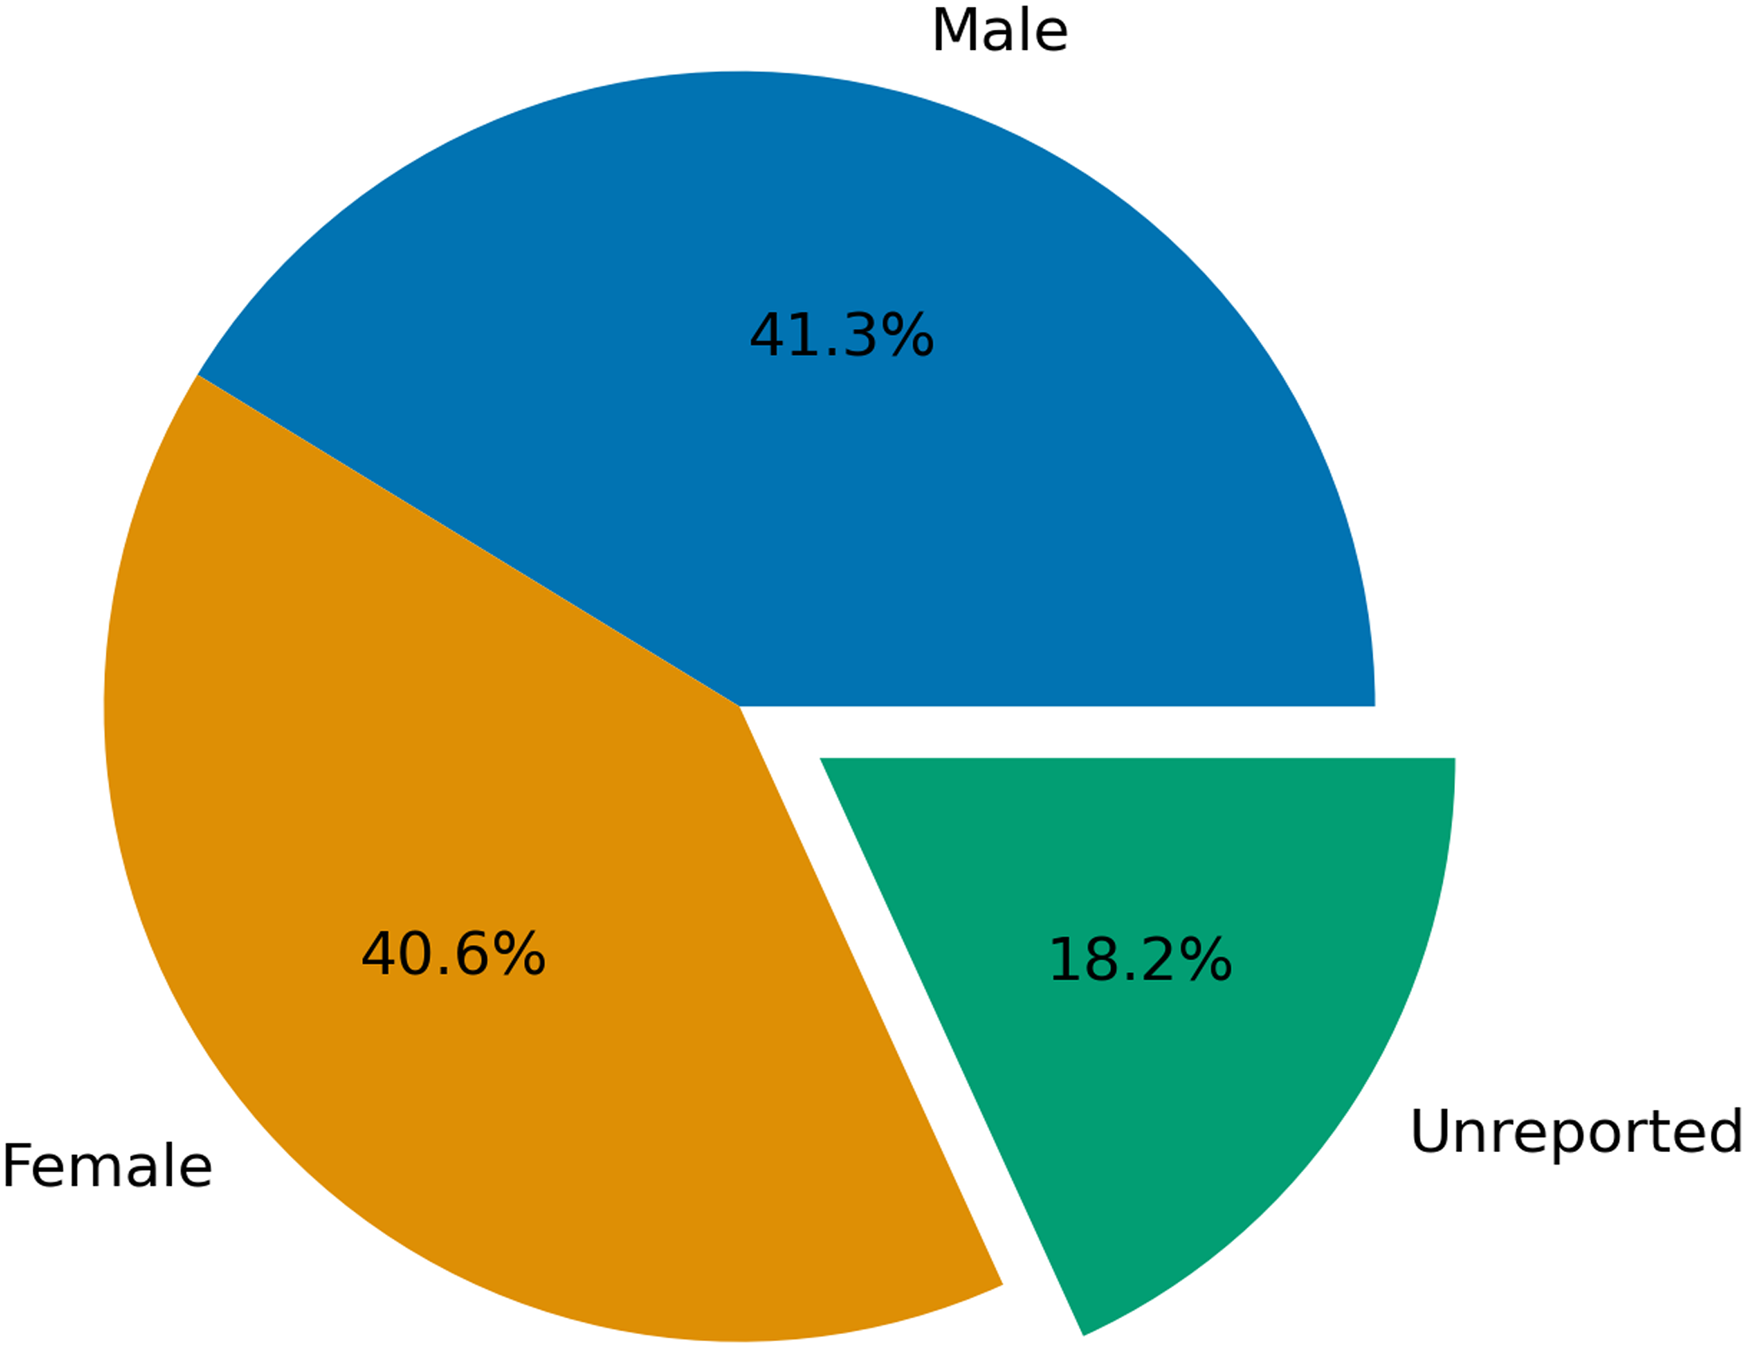
Male and female participants are nearly evenly distributed in studies that report participant sex. Figure 4 is a pie chart showing the breakdown of all (N = 62,510) participants by sex. Sex was not fully reported in 20.3% of studies. This included cases of partial reporting where the sex of only some participants was provided and cases of no reporting at all (which together accounted for 18.2% of participants). Meanwhile, 69.9% of studies (1,083) provided both sex and age information.
Pie chart of reporting of participant sex for all studies in Quebec.

Figure 5 explores the representation of male and female participants across age groups. The scatter plot represents the sex ratio of study participants relative to their average age, with each marker denoting an individual study and its color indicating the number of participants. Among the 1,083 studies that report both sex and age data, 52% have a female-to-male ratio between 40% and 60%, and 107 studies consist entirely of one sex (45 female-only and 62 male-only). The weighted Pearson correlation coefficient (r = 0.079, p = 0.0093) indicates no significant correlation between the average age of participants in a study and the proportion of female to male participants.
Scatter plot of all studies showing the relationship between participant sex and average age. Weighted Pearson correlation coefficient = 0.079. For the interactive figure where a minimum participant number cutoff can be set, see the reproducible publication: https://preprint.neurolibre.org/10.55458/neurolibre.00035/.

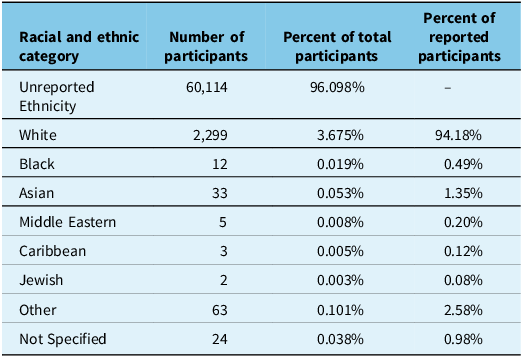
Table 1 summarizes the breakdown of reported ethnicity. Fewer than 4% of participants have any recorded race and ethnicity data. Among those for whom ethnicity is reported, 94.18% of them are categorized as White, a higher proportion than the 81.4% reported in the Quebec population according to the 2021 Canadian census. 36
Participant ethnicity information. For the interactable visual representation of this table, see the reproducible publication: https://preprint.neurolibre.org/10.55458/neurolibre.00035/

Table 1 Long description
The table presents participant ethnicity information with four columns and eleven rows. The columns are labeled 'Racial and ethnic category', 'Number of participants', 'Percent of total participants', and 'Percent of reported participants'. The rows list different ethnic categories and their corresponding data. Row 1: Unreported Ethnicity, 60,114, 96.098 percent, blank. Row 2: White, 2,299, 3.675 percent, 94.18 percent. Row 3: Black, 12, 0.019 percent, 0.49 percent. Row 4: Asian, 33, 0.053 percent, 1.35 percent. Row 5: Middle Eastern, 5, 0.008 percent, 0.20 percent. Row 6: Caribbean, 3, 0.005 percent, 0.12 percent. Row 7: Jewish, 2, 0.003 percent, 0.08 percent. Row 8: Other, 63, 0.101 percent, 2.58 percent. Row 9: Not Specified, 24, 0.038 percent, 0.98 percent.
Figure 6 examines the distribution of male and female participants over time. Studies are grouped by publication year, with the total number of male and female participants shown as stacked bars. The overlaid red line represents the percentage of female participants each year. In most years, participant sex is fairly balanced, with female representation falling within the 40%–60% range. The only exceptions are 1992 and 1996.
Trends in participant sex ratio by year of publication.

Figure 7 is a violin plot with overlaid box and scatter plots, providing insight into the distribution of participant ages in studies conducted in the three main research hubs of Quebec: Montreal, Sherbrooke and Quebec City. The violin plots show the density of studies by average participant age for each city. The box plots show the median (center line) and the first and third quartiles (box edges) of the study average ages. The scatter plots below the combined violin and box plots show the number of studies across average age. We found that the median of the average participant age is significantly lower in Montreal compared to Sherbrooke or Quebec City (Kruskal–Wallis test, p < 0.05; post hoc Dunn test confirmed significant differences for Montreal, p < 0.05). The age distribution in Sherbrooke and Quebec City is relatively uniform, whereas in Montreal, it mirrors the overall trends observed in Figure 3; the greatest concentration of participants falls within the 20–35 age range, with a smaller cluster in the 60–75 age bracket. Additionally, studies with an average participant age below 10 years only took place in Montreal.
Distribution of average participant age for MRI/PET studies in the three major research hubs of Quebec. For the interactive figure which displays statistical information for each distribution including min, max, quartiles, etc., see the interactive publication: https://preprint.neurolibre.org/10.55458/neurolibre.00035/.

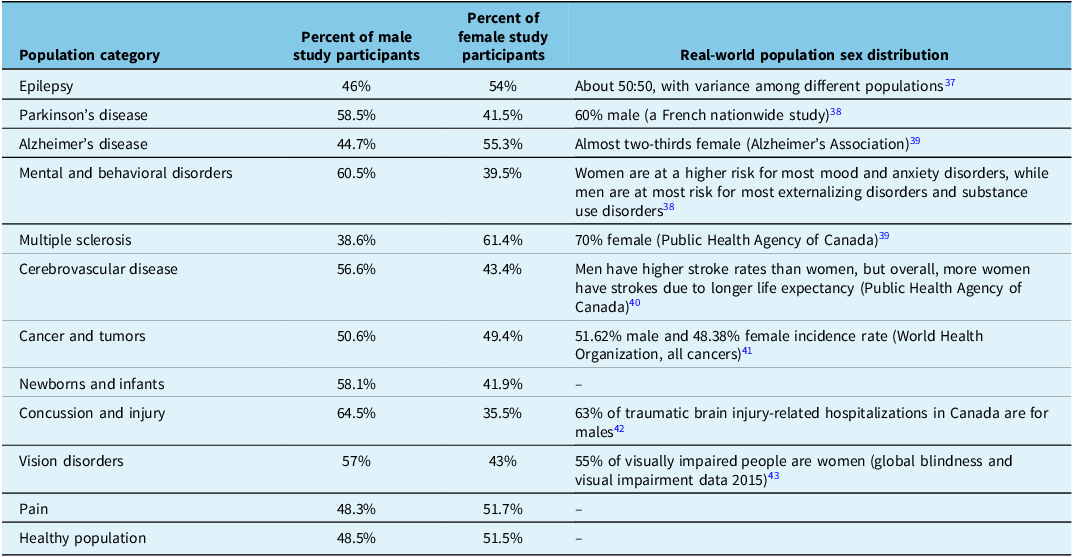
Table 2 summarizes sex distribution by study population category. Where available, the actual sex distribution of the corresponding real-world population is provided for comparison.
Sex ratio by study population category

Table 2 Long description
The table has three columns: Population category, Percent of male study participants, Percent of female study participants, and Real-world population sex distribution. It contains 12 rows, including a header row. Row 1: Epilepsy, 46, 54, About 50:50, with variance among different populations. Row 2: Parkinson's disease, 58.5, 41.5, 60 percent male (a French nationwide study). Row 3: Alzheimer's disease, 44.7, 55.3, Almost two-thirds female (Alzheimer's Association). Row 4: Mental and behavioral disorders, 60.5, 39.5, Women are at a higher risk for most mood and anxiety disorders, while men are at most risk for most externalizing disorders and substance use disorders. Row 5: Multiple sclerosis, 38.6, 61.4, 70 percent female (Public Health Agency of Canada). Row 6: Cerebrovascular disease, 56.6, 43.4, Men have higher stroke rates than women, but overall, more women have strokes due to longer life expectancy (Public Health Agency of Canada). Row 7: Cancer and tumors, 50.6, 49.4, 51.62 percent male and 48.38 percent female incidence rate (World Health Organization, all cancers). Row 8: Newborns and infants, 58.1, 41.9, -. Row 9: Concussion and injury, 64.5, 35.5, 63 percent of traumatic brain injury-related hospitalizations in Canada are for males. Row 10: Vision disorders, 57, 43, 55 percent of visually impaired people are women (global blindness and visual impairment data 2015). Row 11: Pain, 48.3, 51.7, -. Row 12: Healthy population, 48.5, 51.5, -.
Figure 8 is another combined violin, box and scatter plot, showing the distribution of study participants’ average age for each study population category. Notably, the concentration of participants in the senior age bracket is driven mainly by studies of Alzheimer’s disease, Parkinson’s, cerebrovascular disease, and other non-healthy patient populations. Healthy population studies, on the other hand, mostly tend to rely on participants in the 20–30 age bracket.
Distribution of average participant age for each population category. For the interactive figure which displays statistical information for each distribution including min, max, quartiles, etc., see the interactive publication: https://preprint.neurolibre.org/10.55458/neurolibre.00035/.

Figure 9 illustrates trends in demographic reporting over time. Total participant counts per year of publication are shown in bars, with overlaid line plots showing the percentage of studies reporting each demographic variable (sex, age, ethnicity) over time.
Rates of demographic reporting by year of publication.

Discussion
Quebec, whose capital is Quebec City, is Canada’s second most populous province with approximately 8.5 million people and an average age of 42.8 years. 36 About 19% of residents live in rural regions as of 2011. 44 Home to more than a hundred racial and ethnic groups, Quebec reflects a diverse immigrant population. 36 Educational attainment varies significantly, with 5.9% having only primary education and 15.3% having a bachelor’s degree or higher. 45 The unemployment rate stood at 5.2% in 2024, ranking 6th among Canadian provinces. 45 Income varies significantly by age group, with individuals aged 45 and 59 reporting the highest earnings. 36,46 Given Quebec’s demographic and geographic diversity, understanding participant characteristics in neuroimaging research is crucial. This study examined the demographics (age, sex, race and ethnicity, and geographic representation) of participants who underwent brain MRI and/or PET imaging in Quebec over the last three decades.
Our findings indicate that race and ethnicity were the least documented demographics, reported in less than 4% of studies, consistent with previous results. Reference Sterling, Pearl, Liu, Allen and Fleischer27–Reference Gard, Shariq and Albrecht30 The highest reporting rate occurred in 2011 (∼20%), although the reasons for this peak remain unclear. Limited data availability, ethical concerns and privacy considerations may contribute to this gap. Without comprehensive reporting, assessing inclusivity and the applicability of research findings to diverse populations is difficult. Among the 2,299 participants whose race and ethnicity were reported, 94.2% were White, while all other groups each accounted for less than 2%. This stands in contrast to the province’s demographic diversity. 36
Geographically, 92.7% of studies were conducted in Montreal. Outside Montreal, imaging research remained concentrated in major cities, with all 46 studies in the Capitale-Nationale region taking place in Quebec City and all 53 studies in the Estrie region conducted in Sherbrooke. This urban concentration raises concerns about access to imaging technologies and the translatability of results to rural populations. While these cities house most of Quebec’s universities and advanced imaging facilities, their dominance in neuroimaging research may contribute to participation biases. The convenience of recruiting university students further skews study demographics, with more than one-third of studies including participants in the 20- to 40-year-old age bracket. This group is most overrepresented in Montreal, whereas Quebec City and Sherbrooke exhibit a more balanced distribution. Socioeconomic factors linked to urban wealth may further bias recruitment. A 2005 Manitoba study found socioeconomic status correlated with the use of diagnostic imaging, Reference Abate, Adu-Amankwah and Ae-Ngibise47 suggesting that individuals from wealthier backgrounds may have greater access to, or willingness to participate in, imaging studies. Similar biases are evident in large-scale MRI studies; UK Biobank MRI substudy participants are generally more educated, more likely to own a home and overall healthier than the general population. Reference Zucker, Prendergast and Beery48 Although our work does not report any socioeconomic metrics, socioeconomic status remains an important factor in assessing diversity in neuroimaging research. Direct measures, such as participant income, are often difficult to obtain. However, education is a viable alternative, as it is more easily collected and strongly correlated with socioeconomic status. 49 Unfortunately, education levels were inconsistently reported across studies, limiting our ability to assess the relationship between educational attainment and patterns of recruitment and participation in neuroimaging research.
Recently, ultra-low field MRI scanners (e.g., Hyperfine Swoop; https://hyperfine.io/) have gained attention due to their portability and affordability. Reference Altaf, Baqai and Urooj50 Unlike high-field systems, they require less infrastructure, making them suitable for rural or resource-limited settings. Research efforts are increasingly being made to develop advanced sequences and image processing pipelines tailored to ultra-low field MRI. Ultra-low field MRI-based brain morphometric analyses have been found to be in agreement with their high-field counterparts, Reference Váša, Bennallick and Bourke51 paving the way for more sophisticated brain imaging applications. In addition, quantitative MRI techniques sensitive to myelin, such as multi-echo spin-echo for T2 mapping Reference Dvorak, Balaji and Poorman52 and magnetization transfer ratio imaging, Reference Balaji, Wiley and Dvorak53 are now being adapted for ultra-low field systems, further broadening the scope of research. A 2022–2023 Canadian Medical Imaging Inventory 54 survey identified 26 MR-equipped sites in urban Quebec but only 1 in a rural setting. In contrast, the 2016 Canadian Census 55 reports that while 59.2% of Quebec’s population lives in large urban centers, 19.5% reside in rural areas. Ultra-low field MRI scanners may help address this disparity and support more equitable neuroimaging research across Quebec.
Among studies that reported participant sex, the proportion of males and females is nearly equal: 41.3% and 40.6%, respectively. Additionally, over half of the studies that provided both sex and age data have a female-to-male ratio between 40% and 60%. Male and female participation remained relatively stable over the last three decades, reflecting a shift from historical biases favoring male research subjects. Reference Zucker, Prendergast and Beery48 Improved sex representation may be a result of policy mandates by funding agencies (e.g., US National Institutes of Health, Canadian Institutes of Health Research). 56,57 Reporting rates, as far as sex is concerned, have improved over time, dropping from 50% non-reporting in 1992 to approximately 20% in 2023.
Among the categories we assessed, healthy participants were predominantly between 20 and 30 years old, particularly in Montreal. Clinical group age distributions generally matched the conditions’ typical age of onset. Cancer studies tended to include more participants over 40, aligning with Canadian statistics indicating that most cancer diagnoses occur in individuals aged 50 and above. 58 However, early onset cases of conditions such as Alzheimer’s disease, Parkinson’s and stroke can occur before age 50, Reference Jack, Bennett and Blennow59–Reference Yousufuddin and Young61 yet younger participants were underrepresented in studies of these conditions. This is concerning, given increasing recognition that many neurodegenerative diseases involve pathological changes long before clinical symptoms appear. These findings underscore the need for broader age representation in neuroimaging research to better support early detection and prevention efforts. Reference Jack, Bennett and Blennow59,Reference Gaig and Tolosa60
Male-to-female ratios generally matched national statistics, although discrepancies emerged. Studies on vision disorders included a higher proportion of male participants, despite the fact that most vision-related conditions are more prevalent in women. Reference Ackland, Resnikoff and Bourne43 Likewise, studies on Alzheimer’s disease showed a nearly equal sex distribution, although it is well established that approximately two-thirds of individuals affected by Alzheimer’s disease are females. 62
A key challenge of our study was the inconsistency in demographic reporting formats. Many studies omitted key variables like race, ethnicity and education, complicating data extraction and limiting analyses. Education could have provided insights into cognitive resilience and neuroprotection, but inconsistent reporting limited these analyses. Lastly, this review focused only on PET and MRI; including additional imaging modalities could offer a broader perspective on demographic reporting practices in neuroimaging research.
Conclusion
This review highlights demographic gaps in neuroimaging research across Quebec, particularly regarding geographic and racial and ethnic diversity. Most studies were concentrated in urban areas (Montreal, Sherbrooke, Quebec City), potentially limiting generalizability to rural populations. Rural communities have unique healthcare challenges and environmental factors impacting brain health, underscoring the need for inclusive recruitment strategies. The review also highlights a critical underrepresentation of racial and ethnic minorities in neuroimaging studies, an issue exacerbated by inconsistent demographic reporting practices. We recommend adopting standardized formats like the Brain Imaging Data Structure format, Reference Gorgolewski, Auer and Calhoun63 particularly its participants.csv file, to systematically record and share study demographics (age, sex, race and ethnicity, socioeconomic status). This approach could be integrated into existing reporting guidelines, such as the checklist developed by the Committee on Best Practice in Data Analysis and Sharing in Neuroimaging, Reference Nichols, Das and Eickhoff64 enhancing transparency, diversity tracking and future reviews. As large neuroimaging datasets become increasingly available, demographic considerations must guide modeling (e.g., for applications such as age and disease prediction) to ensure the accuracy and generalizability of findings.
Supplementary material
The supplementary material for this article can be found at https://doi.org/10.1017/cjn.2025.10387
Data availability
The data and code used in this study can be found on the following repository: https://github.com/evaalonsoortiz/QC-imaging-demographics. An interactive version of the article’s figures has been published as a preprint here: https://preprint.neurolibre.org/10.55458/neurolibre.00035/.
Author contributions
OO contributed to data collection, analysis, interpretation, writing, review and editing of the manuscript. TS contributed to data analysis, interpretation, visualization, writing, review and editing of the manuscript. UA conceptualized the study and contributed to data collection, writing, review and editing of the manuscript. BL conceptualized the study and contributed to data analysis, interpretation, writing, review and editing of the manuscript. EA conceptualized the study; contributed to data collection and analysis, interpretation and visualization; provided supervision and funding; and reviewed and edited the manuscript.
Funding statement
This work was supported by the QBIN.
Competing interests
All authors have nothing to declare.


 Open access