





1. Introduction
If someone states that ‘a hundred people’ attended an event, as in (1), they may not intend this number as a precise headcount of exactly 100 individuals.
-
(1) There were a hundred people at that ceremony watching me freeze on that stage. (COCA, TV, Station 19, 2019)
In such cases, the round number ‘hundred’ is often used as an estimate; the actual number could very well have been 98 or 103. This tolerance for nearby numbers reflects what Lasersohn (Reference Lasersohn1999) calls a pragmatic halo, a set of values that are acceptable substitutes for a number. By comparison, non-round or ‘sharp’ numbers tend to be used exactly. Swapping the ‘hundred’ in (1) for ‘ninety-seven’, as in (2), strongly suggests that the speaker is specifying an exact headcount.
-
(2) There were ninety-seven people at that ceremony watching me freeze on that stage.
The difference between (1) and (2) highlights the link between round numbers and approximation (Krifka, Reference Krifka2007, Reference Krifka, Hinrichs and Nerbonne2009). Another factor driving the approximate use of numbers is their magnitude, as highlighted by the contrast between (3) and the modified example (4).
-
(3) It was a group of ten people. (COCA, blog, auliffe.blogspot.com, 2012)
-
(4) It was a group of a million people.
In (3), ‘ten people’ could be used either precisely or approximately – perhaps it was actually a group of nine or eleven people – while in (4), an imprecise usage is much more probable. Larger round numbers, particularly ones in the thousands or above, often function more like approximate markers of scale than specific quantities. This vague usage is especially clear in hyperbolic statements like (5).
-
(5) A trillion things happen to a billion people. No one is ever the first one to be anything (...) (COCA, blog, junctivecollapse.com, 2012)
Swapping ‘trillion’ and ‘billion’ in (5) with overtly vague expressions, such as what are known as indefinite hyperbolic numerals (e.g., ‘gazillion’ and ‘bazillion’) (Chrisomalis, Reference Chrisomalis2016; Lavric, Reference Lavric, Kaltenböck, Mihatsch and Schneider2010), does little to change the numerical meaning of the original statement, as demonstrated by (6).
-
(6) A gazillion things happen to a bazillion people. No one is ever the first one to be anything (...)
In this paper, we present a series of quantitative analyses that investigate the link between roundness, approximation and magnitude. We find that people use round numbers more often, and round to a greater degree, at higher magnitudes and that larger round numbers like ‘million’ and ‘billion’ are used in similar linguistic contexts to indefinite hyperbolic numerals like ‘squillion’ and ‘bajillion’. We also analyse a dataset of jigsaw puzzles that affords calculating the pragmatic halo around numbers directly, thereby demonstrating that larger numbers have wider pragmatic halos.
Theoretically, we propose that this interaction between rounding, magnitude and approximation directly results from the base-10 structure of English numerals: within a base-10 system of representing numbers, certain numbers stand out from others by virtue of occupying salient points on the number line, and these salient points are used for special communicative functions, including approximation. We discuss these ideas in light of the approximate number system (ANS), the cognitive system that is thought to underlie our ‘number sense’ (Dehaene, Reference Dehaene1997). Within the ANS, large-magnitude numbers are cognitively represented in a more approximate fashion than small-magnitude numbers (DeWind et al., Reference DeWind, Adams, Platt and Brannon2015; Shepard et al., Reference Shepard, Kilpatric and Cunningham1975a). This magnitude-dependent component of numerical cognition aligns with our findings that the use of numbers becomes more approximate at higher magnitudes.
2. Background
2.1. Round numbers are special
From a mathematical perspective, the number 1,000 is no more special than any other number. It is simply another point on an infinite number line – one integer greater than 999 and one fewer than 1,001. However, in practice, we never engage with mathematical abstractions directly; rather, we interact with symbolic representations of numbers (Zhang & Norman, Reference Zhang and Norman1995), whether as numerals (e.g., 1,000) or number words (e.g., ‘thousand’). Within representational systems, some numbers stand out by virtue of their relation to the system’s structure – specifically, numbers that are directly related to the base are ‘special’. For example, in the Babylonian sexagesimal (base 60) system, numbers mathematically related to 60 – such as 3,600 or 216,000 – were salient (cf. Chrisomalis, Reference Chrisomalis2020; Ch. 1). By contrast, in the widely used Arabic or ‘Western’ (Chrisomalis, Reference Chrisomalis2020) numeral system, the base is 10, and numbers related to this base stand out accordingly. The numeral 1,000 is the first four-digit number and consists of a single leading digit followed by three zeros, thereby marking a transition to a new order of magnitude. This structural distinctiveness is mirrored by the English number word system, where 1,000 is designated a succinct lexical item, ‘thousand’, in contrast to its more grammatically complex neighbours ‘nine hundred and ninety-nine’ and ‘one thousand and one’ (Hurford, Reference Hurford1975).
Precisely because the decimal system is structured around the number 10, numbers that are directly related to this base stand out, including the powers of 10, such as 100 (hundred), 1,000,000 (million) and 1,000,000,000 (billion), as well as numbers derived from these powers through multiplication and division (e.g., 20, 500, 7,500). In this paper, we use the term round number to refer to any number that is structurally salient within a given representational system by virtue of it being directly related to the base, its powers, or multiples and divisors of the base and its powers. This definition entails that the notion of ‘roundness’ is graded because numbers differ in the number of relations they have with the base and its powers. For example, the number 310 is round because it is a multiple of 10, but 300 is even rounder because it is both a multiple of 10 and a multiple of 102 (3 × 100). Furthermore, because Pollmann and Jansen (Reference Pollmann and Jansen1996) argue that humans have a natural propensity for doubling and halving, the number 500 can be thought of as even rounder than 300: both are multiples of 10 and 102, but 500 is also half of 103 (see also Sigurd, Reference Sigurd1988).
Pollmann and Jansen (Reference Pollmann and Jansen1996) proposed what they call ‘the principle of favourite numbers’ (p. 225), according to which certain numbers are preferred in approximate expressions. This proposal was based on an analysis of Dutch number range expressions (compare English ‘ten to fifteen’ or ‘about ten or fifteen’), where they observed that only particular combinations of numbers were acceptable, specifically those related to the base through simple operations such as doubling and halving. These observations were later extended by Jansen and Pollmann (Reference Jansen and Pollmann2001), who showed that numbers conforming to this pattern are also overrepresented across Dutch, English, German and French corpus data. On this basis, they refined the principle of favourite numbers based on four numerical properties: 10-ness,Footnote 1 2-ness, 5-ness and 2.5-ness, as shown in Table 1. A number that falls within any of these sets is round, and the more roundness properties a number has, the rounder it is (Jansen & Pollmann, Reference Jansen and Pollmann2001; see also Woodin et al., Reference Woodin, Winter, Littlemore, Perlman and Matlock2024). For example, the number 500 is characterised by 10-ness (1 × 5 × 102 = 500), 5-ness (5 × 1 × 102 = 500) and 2.5-ness (2.5 × 2 × 102 = 500) and is thus rounder than 300, which is only characterised by 10-ness (1 × 3 × 102 = 300). These roundness properties provide a more precise operationalisation of the idea that numbers related to the base and its powers are special.
Roundness properties adapted from Jansen and Pollmann (Reference Jansen and Pollmann2001)

Table 1. Long description
The table has three columns labeled Property, Definition of set, and Example numbers. The first row under Property is 10-ness, with Definition of set as 1 times open parenthesis k times 10 to the n power close parenthesis, where k is an integer from 1 to 9, and Example numbers are 80, 300, 3,000. The next row is 2-ness, with Definition of set as 2 times open parenthesis k times 10 to the n power close parenthesis, where k is an integer from 1 to 9, and Example numbers are 60, 200, 1,400. The following row is 2.5-ness, with Definition of set as 2.5 times open parenthesis k times 10 to the n power close parenthesis, where k is an integer from 1 to 9, and Example numbers are 50, 125, 50,000. The last row is 5-ness, with Definition of set as 5 times open parenthesis k times 10 to the n power close parenthesis, where k is an integer from 1 to 9, and Example numbers are 100, 4,500, 350,000.
2.2. Functions of round numbers
Due to their structural and psychological salience, round numbers serve diverse functions beyond precisely indexing numerical values. We broadly differentiate between approximate and non-approximate functions (Table 2). On the approximate side, round numbers are used to ‘round’ values when the exact value is deemed communicatively irrelevant, such as when rounding 3:08 to 3:10 when stating the time (Gibbs Jr. & Bryant, Reference Gibbs and Bryant2008; Van der Henst & Sperber, Reference Van der Henst, Sperber, Noveck and Sperber2004; Van der Henst et al., Reference Van der Henst, Carles and Sperber2002), or when reporting the exact figure would seem pedantic (Beltrama et al., Reference Beltrama, Solt and Burnett2023). Round numbers are also used approximately when the language user is uncertain of the precise value but wants to convey a general sense of magnitude, as when estimating that ‘about 1 million’ people live in a city (Ruud et al., Reference Ruud, Schunk and Winter2014). This function of round numbers, reflecting lack of knowledge, is also demonstrated by economics studies that investigate the phenomenon of ‘age heaping’: the over-representation of multiples of 5 in historical census data suggests that, in the past, people may have reported round numbers because they did not know their exact age (A’Hearn et al., Reference A’Hearn, Baten and Crayen2009; Turner, Reference Turner1958). Another approximate function of round numbers is numerical hyperbole, as in phrases like ‘I’ve told you a million times’, where 1 million represents a large, unspecified quantity (Kao et al., Reference Kao, Wu, Bergen and Goodman2014), or in words like ‘millipede’, which literally means ‘a thousand feet’ in Latin, even though all known species had far fewer than 1,000 legs (Lavric, Reference Lavric, Kaltenböck, Mihatsch and Schneider2010) until the discovery of Eumillipes Persephone in 2020 (Marek et al., Reference Marek, Buzatto, Shear, Means, Black, Harvey and Rodriguez2021).
Diverse approximate and non-approximate functions of round numbers
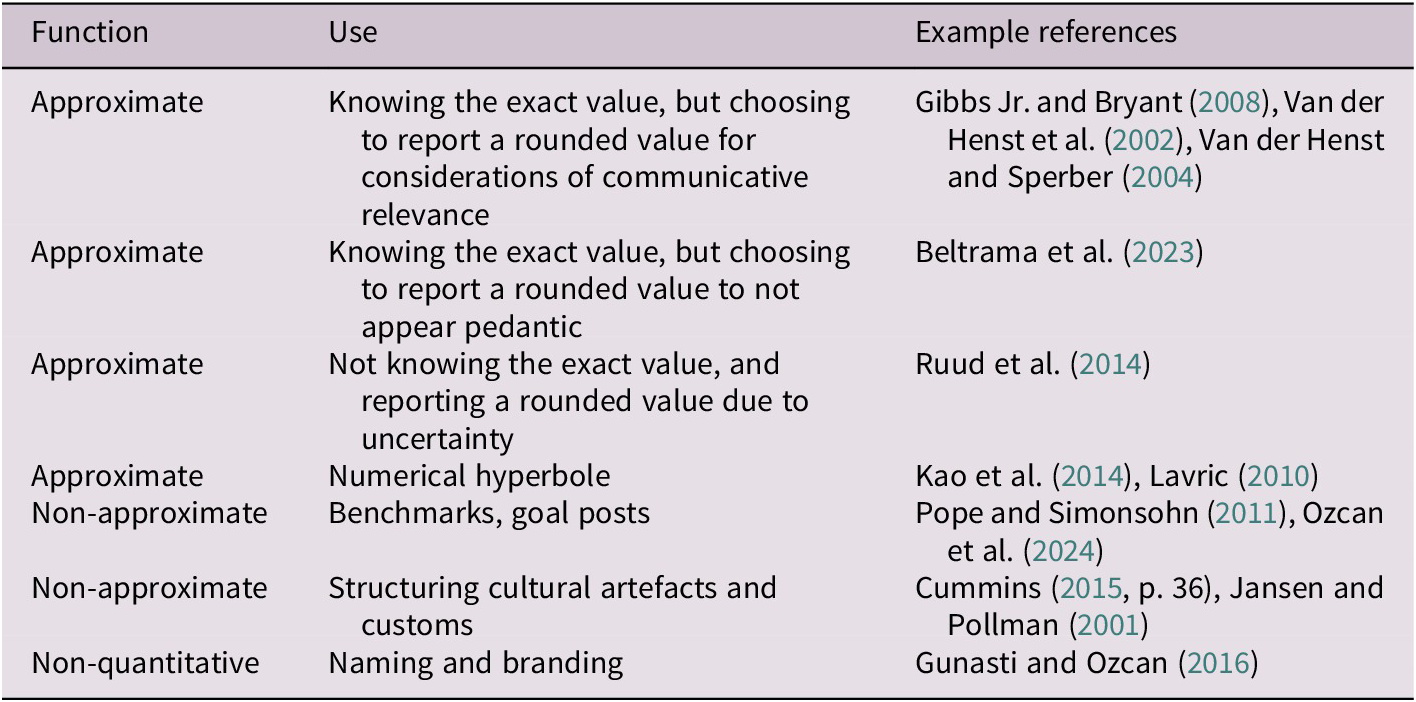
Table 2. Long description
The table has three columns labeled Function, Use, and Example references. From top to bottom, the first four rows under Function are Approximate. Their uses are: reporting a rounded value for communicative relevance, to avoid appearing pedantic, due to uncertainty, and for numerical hyperbole. Example references for these are Gibbs Jr. and Bryant Reference Gibbs and Bryant2008, Van der Henst et al. Reference Van der Henst, Carles and Sperber2002, Van der Henst and Sperber Reference Van der Henst, Sperber, Noveck and Sperber2004; Beltrama et al. 2023; Ruud et al. Reference Ruud, Schunk and Winter2014; and Kao et al. Reference Kao, Wu, Bergen and Goodman2014, Lavric Reference Lavric, Kaltenböck, Mihatsch and Schneider2010, respectively. The next two rows are Non-approximate, with uses as benchmarks or goal posts, and for structuring cultural artefacts and customs. Example references are Pope and Simonsohn 2011, Ozcan et al. 2024; and Cummins Reference Cummins2015 p. 36, Jansen and Pollman 2001. The final row is Non-quantitative, used for naming and branding, with Gunasti and Ozcan 2016 as the reference. A note below the table states this is not an exhaustive list.
Note: This is not intended to be an exhaustive list.
As for non-approximate functions, round numbers can be used as benchmarks or reference points for goals (Ozcan et al., Reference Ozcan, Hair and Gunasti2024; Pope & Simonsohn, Reference Pope and Simonsohn2011), such as when dieters set themselves a weight loss goal of 50 lb, rather than 51.7 lb. The round number in this instance is a target, and the actual number is evaluated relative to this target. Round numbers are also used to structure cultural artefacts and customs: items are often sold in multiples of 10 (Cummins, Reference Cummins2015, p. 36), and jubilee celebrations happen every 5 or 10 years (Jansen & Pollmann, Reference Jansen and Pollmann2001). Used for this function, round numbers actively determine the quantity of items, or the regularity of events, with people organising both the physical world and the temporal structure of their lives around such numbers. Moreover, round numbers are used in contexts where they do not denote quantities at all, but are used in a nominal sense (see Woodin & Winter, Reference Woodin and Winter2024), such as when naming products (e.g., Sony DSC-RX100 camera), fictional characters (e.g., T-1000 in the film Terminator 2: Judgment Day) and artefacts within fictional universes (e.g., Nimbus 2000 in Harry Potter). Such naming choices may be partially motivated by the perception of round numbers as ‘whole’ and ‘complete’ (Gunasti & Ozcan, Reference Gunasti and Ozcan2016).
These diverse functions of round numbers may explain why round numbers are overrepresented in corpus data (Coupland, Reference Coupland2011; Dehaene & Mehler, Reference Dehaene and Mehler1992; Dorogovtsev et al., Reference Dorogovtsev, Mendes and Oliveira2006; Jansen & Pollmann, Reference Jansen and Pollmann2001; Woodin & Winter, Reference Woodin and Winter2024; Woodin et al., Reference Woodin, Winter, Littlemore, Perlman and Matlock2024). Indeed, the fact that round numbers are used and thus encountered so frequently may reinforce their psychological salience, creating a feedback loop that encourages yet more frequent use (Chrisomalis, Reference Chrisomalis2020, p. 35; Cummins, Reference Cummins2015, p. 36). Frequency data thus provide further evidence for the privileged status of round numbers in the decimal system. However, frequencies alone do not allow us to directly reverse-engineer which of the functions summarised in Table 2 is driving the increased use of these numbers. In other words, a number like 1,000 could be more frequent than nearby numbers such as 986, 998 or 1,112 due to any one or a combination of these functions, whether approximate or non-approximate. In a balanced corpus, all of these functions are likely to be in evidence, albeit not necessarily equally often.
2.3. Rounding and magnitude
Crucially, rounding is intrinsically linked to magnitude, both structurally and cognitively. From a structural perspective, the fact that the decimal system is organised around powers of 10 (e.g., 10, 100, 1,000) means that the roundest numbers – those most closely tied to these powers – also become more widely spaced at higher magnitudes. This structural property of the decimal system gives rise to a natural ‘fanning out’ of round numbers: while 10 and 100 differ by 90, 100 and 1,000 differ by 900 and so on. Numbers derived from these powers via doubling and halving (e.g., 50, 500, 2,500) exhibit the same fanning pattern. Therefore, roundness is not only graded (see Section 2.1) but also inherently scale-dependent.
This structural property has direct implications for approximation. As discussed above (Section 2.2), when language users approximate, they tend to use round numbers (Ruud et al., Reference Ruud, Schunk and Winter2014; Van der Henst et al., Reference Van der Henst, Carles and Sperber2002). Since there are fewer round numbers at higher magnitudes, the degree of rounding also tends to increase. For instance, people may round 56 to 60, a difference of 4, but round 556 to 600, a difference of 44. When rounding 556, the number 560 is also available as a target for rounding, but it lacks the 10-ness (1 × 6 × 102 = 600) and 2-ness (2 × 3 × 102 = 600) of 600. From this perspective, round numbers can be seen as being in competition with each other, with rounder numbers being selected more frequently than less round numbers. This competition can be understood via the concept of a pragmatic halo (Lasersohn, Reference Lasersohn1999), where numbers can stand for a range of values beyond their exact mathematical meaning (Cummins, Reference Cummins2015; Krifka, Reference Krifka, Hinrichs and Nerbonne2009). At higher magnitudes, the pragmatic halo of round numbers widens: 600 could plausibly be used to mean 556, but 100 is unlikely to mean 56.
In corpus data, the idea that language users produce round numbers with an intended pragmatic halo that widens with magnitude leads to the expectation that round numbers absorb the frequencies of an increasingly larger set of numbers at higher magnitudes. This notion must be understood relative to a broader and well-established trend, which is that number frequencies tend to decrease with magnitude (e.g., Coupland, Reference Coupland2011; Dehaene & Mehler, Reference Dehaene and Mehler1992): people more often refer to relatively small numbers. Round numbers do not overturn this trend (1,000 is less frequent than 100) but rather create local peaks against it, becoming more frequent at higher magnitudes relative to the surrounding sharp numbers (Woodin et al., Reference Woodin, Winter, Littlemore, Perlman and Matlock2024).
These patterns observed for language use align closely with findings from numerical cognition. When humans judge or compare numbers above three to four items, they rely on the approximate number system (ANS), which represents quantities in an analogue fashion (Cheyette & Piantadosi, Reference Cheyette and Piantadosi2019; McCrink & Wynn, Reference McCrink and Wynn2007; Xu & Spelke, Reference Xu and Spelke2000), with increasingly approximate representations at higher magnitudes (DeWind et al., Reference DeWind, Adams, Platt and Brannon2015; Shepard et al., Reference Shepard, Kilpatric and Cunningham1975a). This increasing imprecision is described by the Weber-Fechner law (e.g., Dehaene, Reference Dehaene2003; DeWind et al., Reference DeWind, Adams, Platt and Brannon2015; Shepard et al., Reference Shepard, Kilpatric and Cunningham1975b), which maintains that people’s ability to discriminate quantities is linearly related to their ratio, rather than their absolute difference. This cognitive phenomenon provides another explanation, compatible with the notion of a pragmatic halo (Lasersohn, Reference Lasersohn1999), for why people might preferentially round 56 to 60, but round 556 to 600: both rounding operations involve similar ratios and hence proportional differences (6.7% vs. 7.3%).
2.4. Overview of analyses
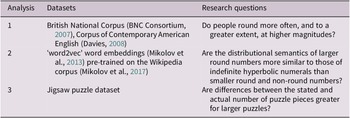
In this paper, we triangulate evidence from three analyses that shed light on the relationship between round number use, approximation and magnitude. Table 3 presents an overview of each analysis. The first analysis is a replication-extension of Woodin et al. (Reference Woodin, Winter, Littlemore, Perlman and Matlock2024), who discussed the fact that in data from the British National Corpus, larger round numbers are relatively more frequent than smaller round numbers compared to the overall magnitude-dependent decline in frequencies (see Dehaene & Mehler, Reference Dehaene and Mehler1992). This pattern is a key prediction of an approximation-based perspective, but it was only discussed descriptively in Woodin et al. (Reference Woodin, Winter, Littlemore, Perlman and Matlock2024). Analysis 1 provides a statistical model to formally test the relationship between increased frequency, rounding and magnitude with the same British National Corpus data. It also replicates the pattern for another corpus, the Corpus of Contemporary American English.
Overview of the three analyses in this paper, including the datasets used and the research questions addressed

Table 3. Long description
The table has three columns labeled Analysis, Datasets, and Research questions. Row one: Analysis 1 uses the British National Corpus and Corpus of Contemporary American English to ask if people round more often and to a greater extent at higher magnitudes. Row two: Analysis 2 uses word2vec word embeddings pre-trained on the Wikipedia corpus to ask if the distributional semantics of larger round numbers are more similar to those of indefinite hyperbolic numerals than smaller round and non-round numbers. Row three: Analysis 3 uses the Jigsaw puzzle dataset to ask if differences between the stated and actual number of puzzle pieces are greater for larger puzzles.
Analysis 2 uses a distributional semantics approach to compare the use of round numbers such as ‘thousand’ and ‘million’ with indefinite hyperbolic numbers such as ‘umpteen’ and ‘squillion’ (Chrisomalis, Reference Chrisomalis2016; see also Burnham, Reference Burnham1951; Pound, Reference Pound1949). Distributional semantics represents word meanings as vectors derived from their usage contexts: words with more similar vectors occur in more similar contexts and are, therefore, likely to have more similar meanings (Lenci, Reference Lenci2008; Lenci & Sahlgren, Reference Lenci and Sahlgren2023), in line with Firth’s (Reference Firth1957, p. 179) assertion that ‘you shall know a word by the company it keeps’. Using this methodology, inspired by Ariel and Levshina’s (Reference Ariel and Levshina2025) distributional semantic analysis of the numerals 2–99, we compare the distributional properties of round and non-round numbers of different magnitudes to those of indefinite hyperbolic numbers. We use these pseudo-numbers for comparison because they are unambiguously inexact – ‘bazillion’, for example, cannot be assigned a precise location on the number line (Rips, Reference Rips2013). Vector similarity between certain large round numbers (e.g., ‘million’, ‘billion’) and indefinite hyperbolic numerals would suggest a shared tendency towards imprecise use.
The final analysis takes a more direct approach to quantifying the extent of rounding by investigating how round numbers are used on the packaging of jigsaw puzzles. Many puzzles advertise neatly round figures such as 500 or 1,000 pieces, yet they do not actually contain the exact number stated on the packaging. In contrast with the corpus analyses (Analyses 1 and 2), where the true value underlying a round expression is unknown, jigsaw puzzles provide a ‘ground truth’ in the form of the actual piece count, which allows direct comparison with the advertised round number. This comparison makes it possible to assess how far the exact value deviates from the round one. Here, too, we demonstrate that magnitude matters: larger puzzles tend to deviate more from their advertised counts.
3. Modelling roundness and magnitude
In this first analysis, we replicate and extend the work of Woodin et al. (Reference Woodin, Winter, Littlemore, Perlman and Matlock2024), who reported that round numbers occur disproportionately often at higher magnitudes, which they interpreted as being consistent with increased frequency and degree (i.e., coarseness) of rounding. However, Woodin et al. (Reference Woodin, Winter, Littlemore, Perlman and Matlock2024) made this observation descriptively. Here, we test this pattern formally in two corpora, the British National Corpus and the Corpus of Contemporary American English. Specifically, we assess whether the interaction between roundness properties and magnitude predicts number frequency.
3.1. Methodology
All data, analysis scripts and additional information about this study can be found at https://osf.io/ct7f8.
3.1.1. Corpora
We analysed numbers in two corpora: the British National Corpus (BNC; BNC Consortium, 2007) and the Corpus of Contemporary American English (COCA; Davies, Reference Davies2008). Both corpora sample a range of texts and genres, intending to be generalisable across different types of language use in their respective varieties of English.
The BNC comprises 100 million words of written and spoken British English compiled during 1991–1994 and revised for rerelease in both 2001 and 2007. Written texts comprise 90% of the BNC and include both fiction and non-fiction writing, including extracts from newspapers, academic books and popular novels. Spoken texts comprise 10% of the BNC and include unscripted informal conversations in addition to more formal contexts, such as radio interviews, university lectures and government meetings.
COCA, a corpus of written and spoken American English, was released in 2008 and has received annual updates since. The version of the corpus to which we had access comprises 440 million words and was released in 2014. COCA is divided roughly equally – 20% in each subcorpus – between unscripted conversations on TV and radio programmes, fiction writing, popular magazines, newspapers and academic journals. In contrast with the BNC, COCA does not include an informal conversation register.
3.1.2. Software
To extract numbers from the BNC and COCA, we used Python (version 3.7; Python Software Foundation, 2021) in the PyCharm-integrated development environment (version 2022.2.3; JetBrains, 2022). Extraction involved the built-in libraries Re (version 2.2.1), IterTools, OS and Time (all by Van Rossum, Reference Van Rossum2020), along with the external libraries NLTK (version 3.7; Bird et al., Reference Bird, Klein and Loper2009), Pandas (version 1.1.5; McKinney, Reference McKinney2010), Word2Number (version 1.1; Batorsky et al., Reference Batorsky, Ledvosky, Yarkoni and Groove2021) and Num2Words (version 0.5.12; Dupras et al., Reference Dupras, Ortiz, Szalaï, Lodato and Harper2021). To assist with number extraction and perform the main statistical analyses, we used the R programming language (version 4.3.2; R Core Team, 2023) in the RStudio integrated development environment (version 2023.6.0.421; Posit Team, 2023), with the packages ‘tidyverse’ (version 2.0.0; Wickham, Reference Wickham2019), ‘car’ (version 3.0.11; Fox & Weisberg, Reference Fox and Weisberg2019), ‘brms’ (Bürkner, Reference Bürkner2017, Reference Bürkner2018), ‘ggmcmc’ (version 1.5.1.1; Fernández-i-Marín, Reference Fernández-i-Marín2016), ‘ggridges’ (version 0.5.4; Wilke, Reference Wilke2022), ‘ggpubr’ (version 0.6.0; Kassambara, Reference Kassambara2023), ‘tidybayes’ (version 3.0.6; Kay, Reference Kay2023), ‘patchwork’ (version 1.3.0; Pedersen, Reference Pedersen2024), ‘fmsb’ (version 0.7.6; Nakazawa, Reference Nakazawa2024), ‘png’ (version 0.1.8; Urbanek, Reference Urbanek2022), ‘magick’ (version 2.8.5; Ooms, Reference Ooms2024)’, ‘lsa’ (version 0.73.3; Wild, Reference Wild2022) and ‘usedist’ (version 0.4.0; Bittinger, Reference Bittinger2020).
3.1.3. Number extraction
We extracted numbers from the BNC and COCA using the procedures described in Woodin et al. (Reference Woodin, Winter, Littlemore, Perlman and Matlock2024) and Woodin and Winter (Reference Woodin and Winter2024), respectively. These procedures aimed to capture numerical expressions from 0 to 1 billion that were transcribed (speech) or written (writing) as numerals (e.g., ‘42’, ‘1.14’), number words (e.g., ‘forty-two’, ‘one point one four’) or a mix of both (e.g., ‘500 million’, ‘7.5 thousand’). We extracted morphologically unmarked numbers only (e.g., ‘3’ and ‘three’, but not ‘3rd’ or ‘third’).
We parsed and part-of-speech tagged each corpus using ‘NLTK’ (version 3.7; Bird et al., Reference Bird, Klein and Loper2009) to identify strings tagged as numbers. Previous studies employed a top-down approach to identify numbers, searching specifically for ‘20’, ‘seven hundred’, etc. (Coupland, Reference Coupland2011; Dehaene & Mehler, Reference Dehaene and Mehler1992; Dorogovtsev et al., Reference Dorogovtsev, Mendes and Oliveira2006; Jansen & Pollmann, Reference Jansen and Pollmann2001). In comparison, our approach was bottom-up: we tagged each individual number string in both corpora. We then treated adjacent numerical strings as a single unit, also incorporating the words ‘and’ and ‘point’, to capture multi-word expressions (e.g., ‘one hundred and two’, ‘two point seven’). This bottom-up method allowed us to capture a greater variety of numerical language. However, it also necessitated more data cleaning: we excluded 146,797 strings from the BNC and 627,596 strings from COCA that contained a mixture of numerals and letters or other characters, including morphologically marked numbers (e.g., ‘10th’), decade ranges (e.g., ‘1970s’) and digital times (e.g., ‘06:00’). We also excluded 9,407 strings from the BNC and 11,010 strings from COCA with a leading 0 that resembled numerical codes (e.g., ‘01760’). For more information about these procedures and all data exclusions, see the OSF repository associated with this paper (https://osf.io/ct7f8) and the descriptions for the BNC in Woodin et al. (Reference Woodin, Winter, Littlemore, Perlman and Matlock2024) and for COCA in Woodin and Winter (Reference Woodin and Winter2024).
Overall, these procedures identified 1,739,398 occurrences of numbers in the BNCFootnote 2 and 8,158,113 occurrences of numbers in COCA that met our search criteria. These occurrences comprised the supersets from which we extracted subsets for statistical modelling.
3.1.4. Statistical models
To model the effect of magnitude on round number frequencies, we implemented Bayesian generalised models using the package ‘brms’ (Bürkner, Reference Bürkner2017, Reference Bürkner2018). Two parallel models were fitted, one for each corpus (BNC and COCA). Frequency was the dependent variable, with the predictors Log10 Magnitude (continuous) and the roundness properties identified by Jansen and Pollmann (Reference Jansen and Pollmann2001) (10-ness, 2-ness, 2.5-ness and 5-ness), in addition to the properties Multiple of 5 and Multiple of 10, which were also found to predict number frequencies by Woodin et al. (Reference Woodin, Winter, Littlemore, Perlman and Matlock2024). Each roundness property was implemented as a categorical variable, where ‘does not have property’ is the reference level and ‘has property’ is the comparison level. In contrast to the analysis of the BNC reported in Woodin et al. (Reference Woodin, Winter, Littlemore, Perlman and Matlock2024), the model fitted here includes terms for the interactions between all roundness properties and magnitude, which is replicated for the novel analysis of COCA.
Number frequencies are unbounded count data (i.e., positive integers with no upper limit), for which Poisson or negative binomial regressions are candidate model types. The latter, negative binomial, is preferred in the case of possible overdispersion, when counts exhibit more variance than what would be expected under the Poisson distribution. For example, some specific numbers may occur hundreds of thousands of times, while others occur just once or not at all. A check of the data indicated high overdispersion (see OSF repository: https://osf.io/ct7f8). We, therefore, fitted Bayesian negative binomial regressions (see Winter & Bürkner, Reference Winter and Bürkner2021) which, unlike Poisson regressions, estimate both the mean and variance in counts.
We modelled number frequencies for integers between 1 and 1 million, excluding decimals (BNC: 70,197 occurrences, COCA: 300,864 occurrences) as well as numbers outside this range (BNC: 24,873 occurrences, COCA: 360,677 occurrences). Zero was excluded as the model included the predictor Log10 Magnitude, and the logarithm of 0 is undefined. Imposing an upper limit of 1 million mitigated the computational demands of fitting Bayesian models, which take more time with increasing dataset size: the dataset per corpus contained 1 million rows, including numbers that are used in each corpus (frequency ≥ 1) in addition to those that are not (frequency = 0).
As negative binomial regressions use the log link function, they model the natural logarithm of the mean frequency. Therefore, the slope estimates reported below reflect changes in log-transformed number frequencies (loge). We used weakly informative priors (normal distribution centred on 0, SD = 0.5) for these slope coefficients. These priors mildly bias coefficient estimates towards zero, especially when there are little data, which makes estimates more conservative, thereby incorporating ‘mild skepticism’ (McElreath, Reference McElreath2016, p. 186) into the model. For all other parameters, we used default priors from the R package ‘brms’ (Bürkner Reference Bürkner2017, Reference Bürkner2018).
3.2. Results
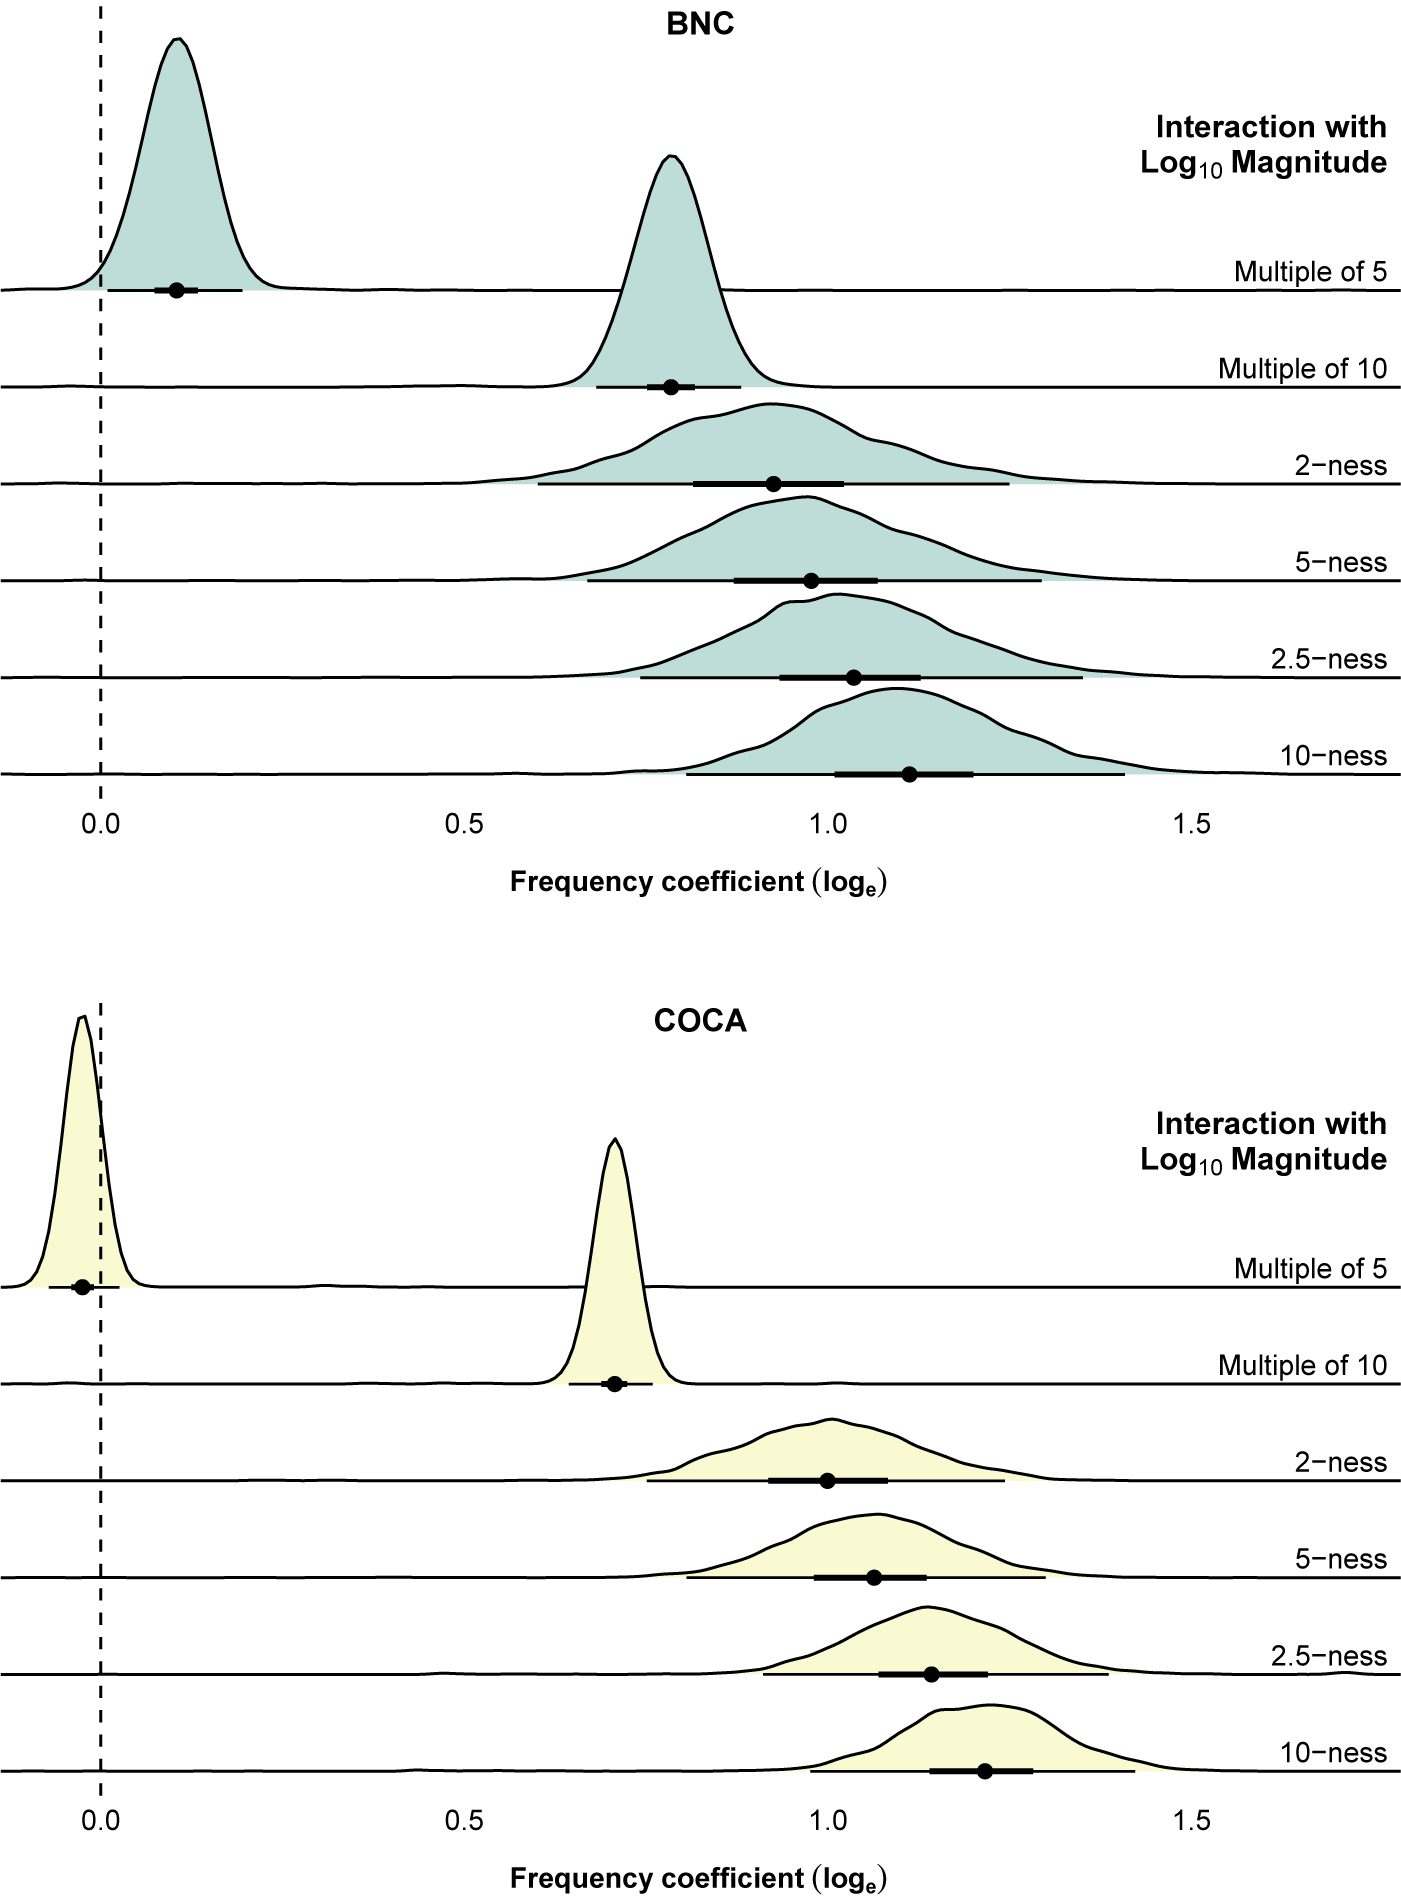
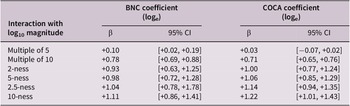
Figure 1 displays the posterior distributions for interactions between the different roundness properties and Log10 Magnitude (interaction coefficients). Numerical values and 95% credible intervals of slope estimates are reported in Table 4. All slopes are positive, which indicates that round numbers are used more frequently at higher magnitudes in both the BNC and COCA. The lowest slope estimate is for Multiple of 5, which has a 95% credible interval that is only marginally above 0 in the BNC, and includes 0 in COCA, indicating considerable uncertainty. For all interaction terms other than Multiple of 5, the 95% credible intervals are well above 0 in both corpora, increasing in the following order: Multiple of 10, 2-ness, 5-ness, 2.5-ness and 10-ness.
Posterior distributions of loge coefficients for interactions between Log10 Magnitude and roundness properties Multiple of 5, Multiple of 10, 2-ness, 5-ness, 2.5-ness and 10-ness in the BNC (top row) and COCA (bottom row). Dots indicate slope estimates (posterior means), thick error bars indicate 50% credible intervals, and thin error bars indicate 95% credible intervals.

Figure 1. Long description
The top panel is labeled B N C and the bottom panel is labeled C O C A. Both panels display six horizontal density plots, each corresponding to a roundness property: Multiple of 5, Multiple of 10, 2-ness, 5-ness, 2.5-ness, and 10-ness, listed from top to bottom. The x axis is labeled Frequency coefficient log sub e, ranging from 0 to approximately 1.5, with a dashed vertical line at 0. Each density plot shows a distribution curve, a central dot for the posterior mean, a thick line for the 50 percent credible interval, and a thin line for the 95 percent credible interval. In both panels, the Multiple of 5 and Multiple of 10 distributions are centered near 0 and 1, respectively, with the other properties showing means between these values. The B N C panel uses blue shading, while the C O C A panel uses yellow. The overall trend is that the distributions for each property are similar in shape and position between the two corpora, with slight differences in spread and central tendency.
Slope estimates (β) and 95% credible intervals (95% CI) for interactions between roundness properties and log₁₀ magnitude in the BNC and COCA

Table 4. Long description
The table has six rows for roundness properties: Multiple of 5, Multiple of 10, 2-ness, 5-ness, 2.5-ness, and 10-ness. For each, two sets of columns report B N C and C O C A coefficients (log base e) and their 95 percent credible intervals. For Multiple of 5, B N C beta is plus 0.10 with interval plus 0.02 to plus 0.19, C O C A beta is plus 0.03 with interval minus 0.07 to plus 0.02. For Multiple of 10, B N C beta is plus 0.78 with interval plus 0.69 to plus 0.88, C O C A beta is plus 0.71 with interval plus 0.65 to plus 0.76. For 2-ness, B N C beta is plus 0.93 with interval plus 0.63 to plus 1.25, C O C A beta is plus 1.00 with interval plus 0.77 to plus 1.24. For 5-ness, B N C beta is plus 0.98 with interval plus 0.72 to plus 1.28, C O C A beta is plus 1.06 with interval plus 0.85 to plus 1.29. For 2.5-ness, B N C beta is plus 1.04 with interval plus 0.78 to plus 1.78, C O C A beta is plus 1.14 with interval plus 0.94 to plus 1.35. For 10-ness, B N C beta is plus 1.11 with interval plus 0.86 to plus 1.41, C O C A beta is plus 1.22 with interval plus 1.01 to plus 1.43. The largest coefficients and intervals are for 2.5-ness and 10-ness, especially in C O C A.
To make the pattern captured by the models more concrete, we can examine the raw frequencies of powers of 10 across magnitudes. In the BNC, for example, the frequency of 100 is 14,819, compared to only 6,975 for 1,000, reflecting the general trend for absolute frequencies to decline with magnitude (see Section 2.3). We can also compare these frequencies to those of numbers within ±10% of each power – 90 and 110 for 100 and 900 and 1,100 for 1,000 – as a rough approximation of the respective pragmatic halos of each number. When we do this, the relative differences between the powers and surrounding numbers become larger: the mean frequency of numbers between 90 and 110 is 849, equivalent to 5.7% of the frequency of 100 itself, while the mean frequency of numbers between 990 and 1,100 is 25, equivalent to only 0.4% of the frequency of 1,000.
3.3. Discussion
The first analysis demonstrates that round numbers are used more frequently at higher magnitudes in both the BNC and COCA, extending results reported descriptively by Woodin et al. (Reference Woodin, Winter, Littlemore, Perlman and Matlock2024) for the BNC. This increasing reliance on round numbers with magnitude may reflect a greater tendency towards approximation. The trends observed are consistent across the two corpora: numbers with 10-ness show the greatest frequency increase, followed by 2.5-ness, 5-ness, 2-ness and then Multiple of 10. Multiple of 5 shows a weaker interaction with magnitude in both corpora, particularly COCA, where there is little evidence of an effect. This result hints that, while divisibility by 5 is sufficient for numbers to be used in lower-magnitude approximate expressions (e.g., ‘about 15 people’), at higher magnitudes, speakers increasingly use numbers more closely associated with the base 10 (e.g., those with 10-ness or 2.5-ness). In other words, the set of numbers speakers use for approximation become more restricted as magnitude increases.
4. Indefinite hyperbolic numbers
Another window into the approximate nature of round numbers is to compare them with numbers that we know to be imprecise. Indefinite hyperbolic numbers like ‘kazillion’ and ‘bajillion’ provide an ideal comparison because they look like numbers and behave like them grammatically, but lack an exact value. In this second analysis, inspired by Ariel and Levshina (Reference Ariel and Levshina2025), we compare the distributional semantics of round and non-round numbers across different magnitudes with those of indefinite hyperbolic numbers. To the extent that certain larger round numbers are used in similar linguistic contexts as indefinite hyperbolic numerals, this pattern would suggest that they are similarly imprecise.
4.1. Methodology
We used ‘word2vec’ word embeddings (Mikolov et al., Reference Mikolov, Chen, Corrado and Dean2013) pre-trained on the Wikipedia corpus (Mikolov et al., Reference Mikolov, Grave, Bojanowski, Puhrsch and Joulin2017). We opted to use word2vec due to its accessibility as a pre-existing database of word embeddings derived from a broad, general-purpose corpus. Additionally, comparative research indicates that these embeddings tend to perform marginally better than several other readily available alternatives across various applications (Baroni et al., Reference Baroni, Dinu, Kruszewski, Toutanova and Wu2014; Beekhuizen et al., Reference Beekhuizen, Armstrong and Stevenson2021; Pereira et al., Reference Pereira, Gershman, Ritter and Botvinick2016).
We extracted word embeddings for English number words, including 1–99, powers of 10 (‘hundred’, ‘thousand’, ‘million’, ‘billion’, ‘trillion’, ‘quadrillion’, ‘quintillion’, ‘sextillion’) and indefinite hyperbolic numbers (‘umpteen’, ‘zillion’, ‘gazillion’, ‘bazillion’, ‘bajillion’, ‘squillion’, ‘skillion’, ‘gajillion’, ‘kazillion’). We focused on single words (e.g., ‘hundred’) and hyphenated numbers (e.g., ‘seventy-two’) and not multi-word expressions (e.g., ‘two thousand’). Hence, the embeddings for single words (e.g., ‘three’ and ‘million’) include their use in multi-word expressions (e.g., ‘three million’). We only analysed number words (e.g., ‘two’ rather than ‘2’) because these are most comparable to indefinite hyperbolic numbers, which lack numeral representations.
The word embeddings extracted are numerical representations of words in a continuous vector space with 300 dimensions. Words with similar embeddings, represented as closer points in this high-dimensional space, tend to appear in similar contexts and thus are semantically related (Lenci, Reference Lenci2008; Lenci & Sahlgren, Reference Lenci and Sahlgren2023; see also Firth, Reference Firth1957). Using these embeddings, we calculated cosine similarities between all the words in our dataset across all 300 dimensions. The cosine similarity for a pair of numbers tells us to what extent a number is used in similar sentence and discourse contexts to the other. To visualise the similarities, we used multidimensional scaling (MDS) (see Shepard, Reference Shepard1962) to reduce the 300 dimensions to 2 dimensions while preserving the high-dimensional similarities as much as possible. As an example of how MDS works, if two words are far from each other in one dimension but close in many others, the MDS algorithm prioritises maintaining their overall closeness in two-dimensional space, at the expense of losing information about the conflicting dimension.
4.2. Results
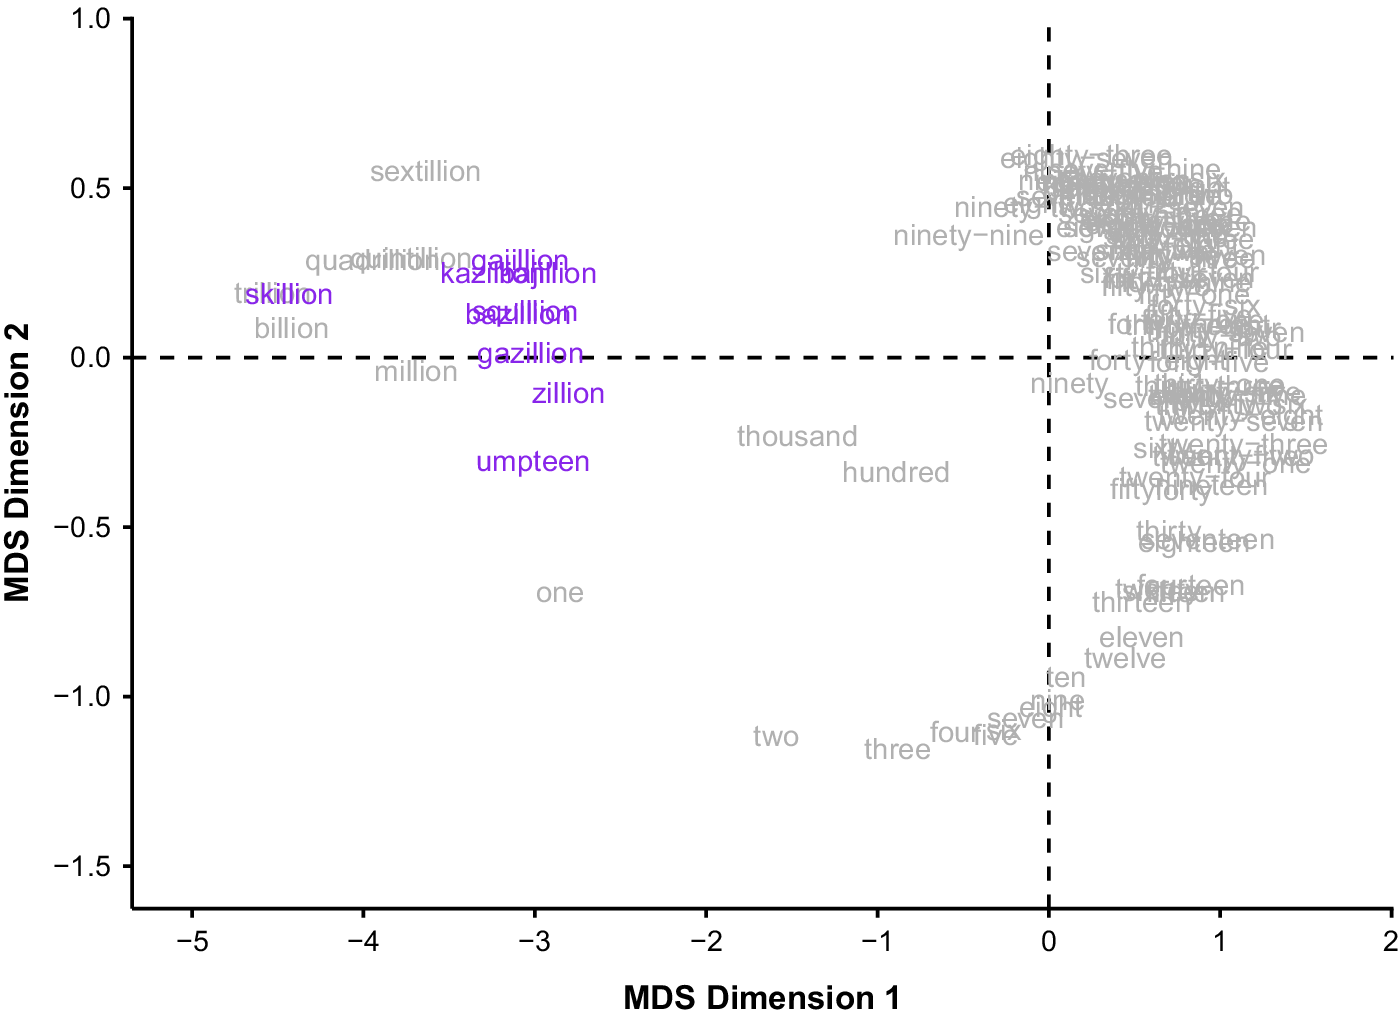
Figure 2 shows the word embeddings projected into two-dimensional MDS space. The numbers from 2 to 99 cluster towards the right side of the space, with magnitude accounting for their vertical distribution – larger numbers are positioned further upwards. The crescent shape of this distribution is more challenging to explain. On the left side of the figure, the indefinite hyperbolic numbers form a distinct semantic cluster, separate from the cloud of smaller numbers towards the right side of the space. Larger powers of 10 – ‘million’, ‘billion’, ‘trillion’, ‘quadrillion’, ‘quintillion’ and ‘sextillion’ – also appear in this left region of the MDS space. Their proximity to indefinite hyperbolic numbers, which have no precise value, suggests that large round numbers like these are similarly used imprecisely. In contrast, smaller powers of 10 – ‘hundred’ and ‘thousand’ – appear in a transitional position between the two clusters. This midway placement suggests that these numbers are more likely to be used imprecisely than smaller numbers, but less so than the larger powers of 10. Therefore, the horizontal axis of the MDS space may be loosely interpretable as a semi-continuous dimension, reflecting the probability of a number being used imprecisely, where this probability increases from right to left in a magnitude-dependent fashion. The number word ‘one’ appears isolated in MDS space, presumably because the word vector for this string also reflects the non-numerical use of ‘one’ as a pronoun (e.g., ‘as one does’, see Woodin et al., Reference Woodin, Winter, Littlemore, Perlman and Matlock2024).
Multidimensional scaling (MDS) based on word2vec cosine similarity: number words (grey) and indefinite hyperbolic numbers (purple). Indefinite hyperbolic numbers occupy the same region of MDS space as larger powers of 10, like ‘trillion’ and ‘million’; smaller numbers from 2 to 99 occupy a separate region of MDS space; and ‘thousand’ and ‘hundred’ appear between these two main clusters.

Figure 2. Long description
The x-axis is labeled M D S Dimension 1, ranging from approximately negative 5.5 to positive 2. The y-axis is labeled M D S Dimension 2, ranging from negative 1.5 to positive 1.0. Number words are shown in grey, indefinite hyperbolic numbers in purple. On the left, indefinite hyperbolic numbers such as umpteen, zillion, gazillion, bajillion, kazillion, and skillion cluster near large number words like million, billion, trillion, quadrillion, quintillion, and sextillion. In the center, thousand and hundred are positioned between the large number cluster and the smaller numbers. On the right, smaller numbers from two to ninety-nine form a dense vertical cluster, with one slightly separated below. The spatial arrangement shows that indefinite hyperbolic numbers overlap with large powers of ten, while smaller numbers occupy a distinct region.
4.3. Discussion
The second analysis indicates that large round numbers like ‘billion’ and ‘trillion’ are used in similar contexts to indefinite hyperbolic numbers like ‘bajillion’ and ‘zillion’. Following the foundational idea of distributional semantics – words used in similar contexts have similar meanings – we can, therefore, conclude that these large round numbers are semantically similar to number-like words that we know to be imprecise. This interpretation suggests that, in many usage contexts, large round number words such as ‘million’ do not denote a precise number, but instead only give a general impression of magnitude, similar to words such as ‘zillion’ and ‘umpteen’. In contrast, smaller round numbers such as ‘hundred’ and ‘thousand’ occupy a position in semantic space that is in between the indefinite hyperbolic numerals and small numbers. This pattern of results is consistent with the idea that approximate uses of round number words (at least the ones analysed here) are magnitude-dependent, with the distributional behaviour of larger round numbers being more similar to that of pseudo-numbers. Conceptually, these results are consistent with Ariel and Levshina (Reference Ariel and Levshina2025), who reported that the relatively more precise numerals 2–99 were more densely clustered in semantic space than words from other lexical fields, such as cooking verbs (e.g., ‘boil’) and precision adjectives (e.g., ‘fixed’), which they argue have less precisely defined meanings. Here, we show a similar pattern, but compare numbers to a more closely related lexical field: fictitious numbers. Our results show that while small numbers are densely clustered together, larger round numbers are closer in semantic space to fictitious numbers.
5. Rounding in jigsaw puzzles
The third and final analysis investigates rounding by comparing the advertised number of pieces in jigsaw puzzles to their actual counts, with the latter serving as a ‘ground truth’ allowing us to assess rounding directly. Because puzzle manufacturers often use rounded values on puzzle boxes, testing whether deviations from the stated number increase with puzzle size can reveal whether the degree of rounding grows with magnitude.
5.1. Methodology
5.1.1. Puzzle counting
We counted the pieces in an opportunity sample of 34 jigsaw puzzles with advertised piece counts ranging from 12 to 13,200 (median = 1,000). These advertised counts were mostly round numbers: all but the two smallest piece counts (12, 49) were round (e.g., 150, 1,500, 6,000; see Table 4). By far the most common advertised piece count was 1,000 (N = 19). Puzzle pieces were counted manually, twice to check for possible miscounts. The puzzles were produced by 14 brands, some of which were frequent in the dataset (e.g., Clementoni, Ravensburger, each: N = 9) and others which were infrequent (e.g., Marks & Spencer, Martin Schwartz, each: N = 1). Crucially, the observed differences were not random: they were usually large, even numbers (e.g., 30, 24, 16) and often were consistent within brands (in fact, Clementoni puzzles include a note specifying how much exact piece counts deviate from cover values). These facts strongly suggest that the differences observed are not mere artefacts of measurement error or missing pieces. For more details about the dataset, see the OSF repository: https://osf.io/ct7f8.
5.1.2. Statistical model
We used Bayesian negative binomial regression to model the effect of magnitude (puzzle size) on the absolute difference between the stated and actual counts, disregarding whether the actual count was lower or higher than the stated value (e.g., both a 994-piece puzzle and a 1,006-piece puzzle that are advertised as having 1,000 pieces would have a deviation of 6). In a negative binomial regression, the shape parameter estimates overdispersion; thus, we can also model this shape parameter as a function of magnitude, allowing us to assess whether variability in the absolute differences changes as puzzle size increases.Footnote 3 For this model, to mitigate against miscounts or missing pieces, we made the conservative choice of recategorising actual counts that differ by only a single piece from the advertised value as having no difference (i.e., 0).
5.2. Results
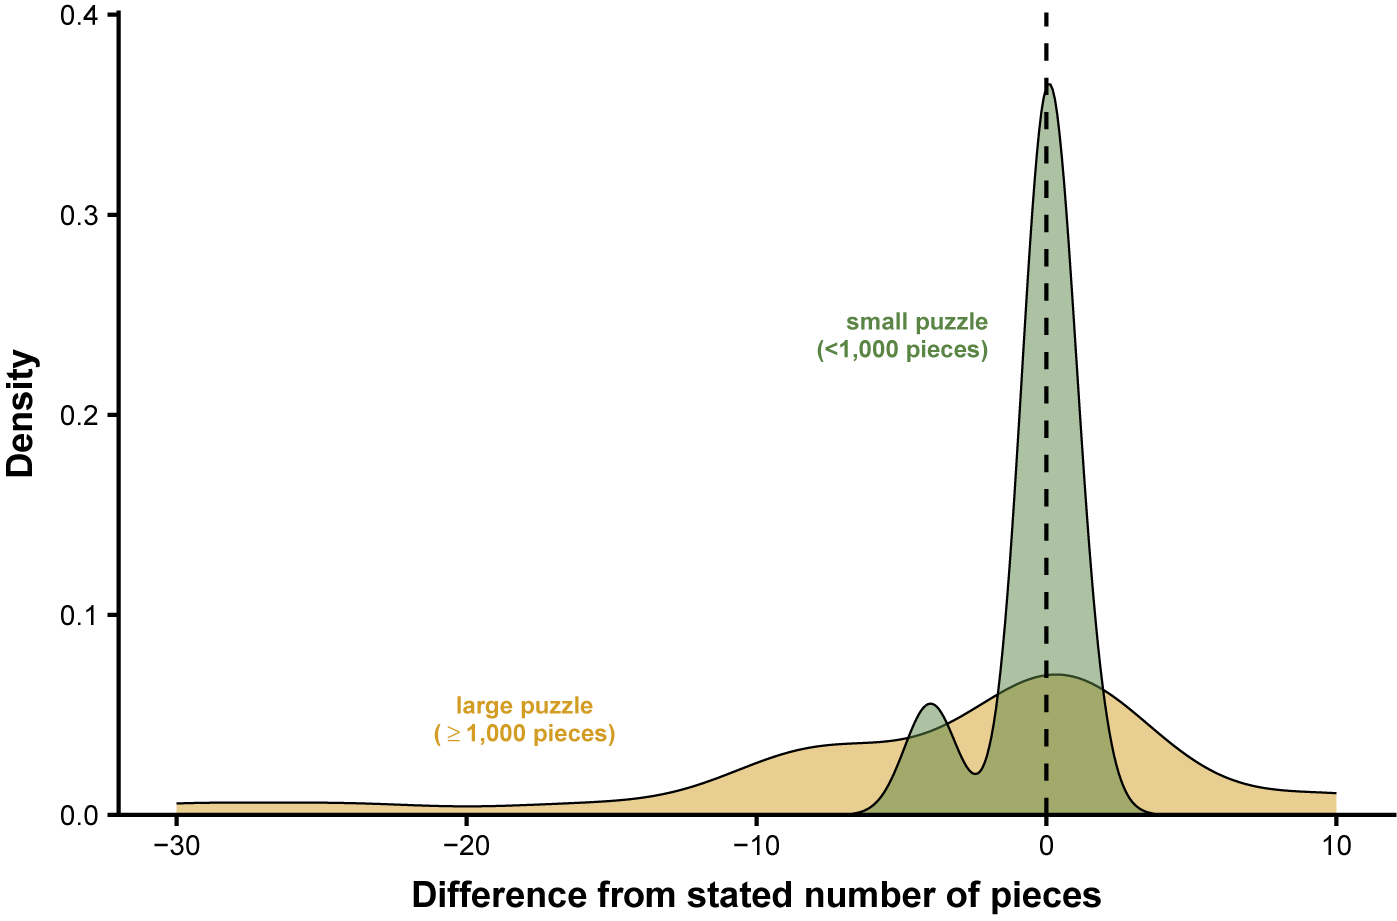
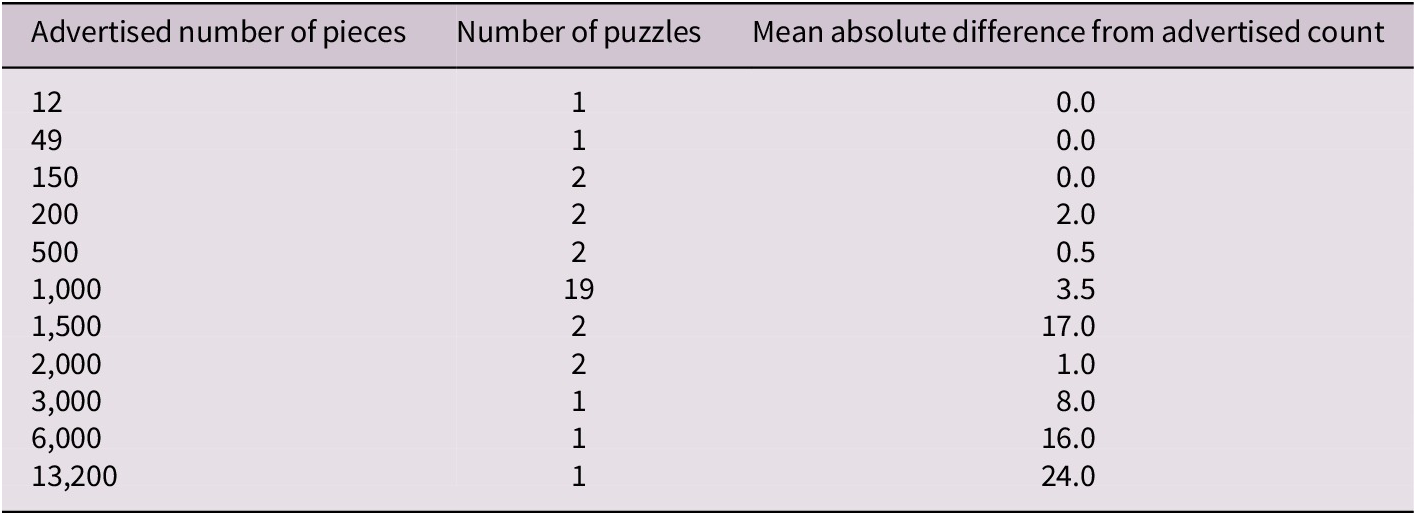
Fewer than half the jigsaw puzzles had the exact number of puzzle pieces stated on the packaging (44.1%, N = 15). The majority (55.9%, N = 19) differed from the stated value, with discrepancies ranging from 1 to 30 puzzle pieces. As shown in Figure 3, the size of these discrepancies varied by puzzle size: the width of the yellow distribution, representing larger puzzles (≥1,000 pieces, i.e., the median piece count advertised or above), is much wider compared to that of the green distribution, representing smaller puzzles (<1,000 pieces). In other words, larger puzzles tended to differ by a greater amount from the advertised value than smaller puzzles. Table 5 shows the mean discrepancies for each puzzle size in our dataset.
Density plot demonstrating that the actual count of larger puzzles (≥1,000 pieces, yellow distribution) tends to differ more from the advertised count, compared with smaller puzzles (<1,000 pieces, green distribution). Note that puzzle size was continuous, rather than discretised, in the regression analysis.

Figure 3. Long description
The x-axis is labeled Difference from stated number of pieces, ranging from negative thirty to ten. The y-axis is labeled Density, ranging from zero to zero point four. The green distribution, labeled small puzzle less than one thousand pieces, is sharply peaked at zero and is narrower, indicating most small puzzles closely match their stated piece count. The yellow distribution, labeled large puzzle greater than or equal to one thousand pieces, is broader and flatter, with a peak near zero but a wider spread, indicating larger puzzles deviate more from their stated count. Both distributions overlap near zero, but the yellow distribution extends further into negative values, showing that large puzzles are more likely to have fewer pieces than stated.
Mean absolute differences from advertised values for each puzzle size in the dataset

Table 5. Long description
The table has three columns. The first column lists advertised number of pieces in ascending order: 12, 49, 150, 200, 500, 1,000, 1,500, 2,000, 3,000, 6,000, 13,200. The second column shows the number of puzzles for each size, ranging from 1 to 19. The third column gives the mean absolute difference from the advertised count. For 12, 49, 150, and 500 pieces, the mean difference is 0.0. For 200 pieces, it is 2.0. For 1,000 pieces, with 19 puzzles, the mean difference is 3.4. For 1,500 pieces, it is 17.0. For 2,000 pieces, it is 1.0. For 3,000 pieces, it is 8.0. For 6,000 pieces, it is 16.0. For 13,200 pieces, it is 24.0. The table note clarifies that for sizes with only one puzzle, the mean absolute difference equals the exact difference, and differences of 1 are adjusted to 0 to account for possible miscounts or missing pieces.
Note: For counts represented by only one puzzle, the mean absolute difference represents the exact absolute difference for that puzzle.
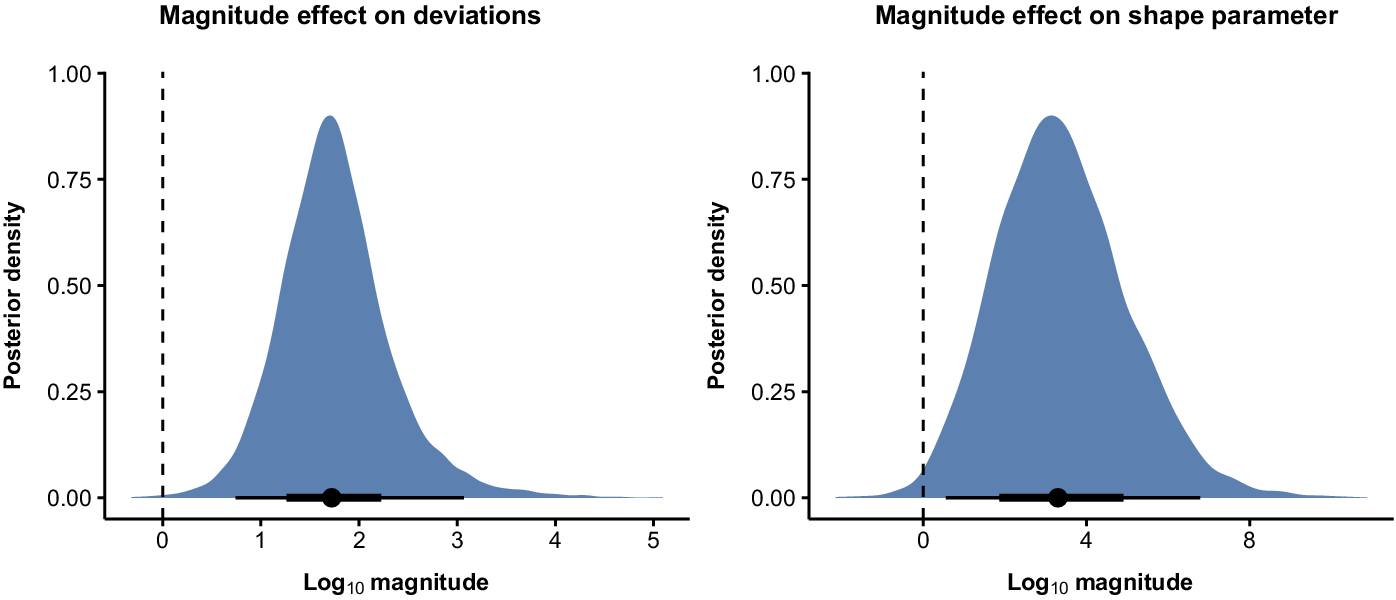
Figure 4 shows the coefficients of the effect of Log10 Magnitude on differences between the stated and actual piece counts (left) and the variability of these differences (right). The coefficients are both positive, demonstrating that deviations between actual and stated counts increase for larger puzzles (β +1.76, 95% CI = [+0.74, +3.07]), and that the variability in these deviations decreases (β +3.40, 95% CI = [+0.56, +6.79]), given the inverse relationship between the shape parameter and variability.
Posterior distributions of loge coefficients for the effect of log10 Magnitude on differences between the actual and stated jigsaw piece counts (left), and the variability in these deviations, represented by the shape parameter of the model (right). Dots indicate posterior medians, thick error bars indicate 50% credible intervals, and thin error bars indicate 95% credible intervals. Both 95% credible intervals are above zero, providing substantial evidence that rounding increases and becomes less variable when jigsaw puzzle size increases.

Figure 4. Long description
The left panel is titled Magnitude effect on deviations. The x axis is labeled Log sub 10 magnitude, ranging from 0 to 5. The y axis is Posterior density, ranging from 0 to 1. A blue posterior distribution is centered near 2 on the x axis, with a black dot at the mean and thick and thin horizontal error bars representing the 50 percent and 95 percent credible intervals, both entirely above zero. The right panel is titled Magnitude effect on shape parameter. The x axis is Log sub 10 magnitude, ranging from 0 to 9. The y axis is Posterior density, ranging from 0 to 1. The blue posterior distribution peaks near 4, with a black dot and error bars as in the left panel, and both credible intervals above zero. Both panels have a vertical dashed line at zero on the x axis, indicating the reference point for the effect.
This analysis has concentrated on absolute deviations from the advertised value. Importantly, when we look at proportional deviations, we do not see any clear systematic magnitude-related patterns. For example, the largest proportional deviation (2.0%) was obtained for a puzzle advertised as having 200 pieces, but also for one advertised as having 1,500 pieces. Some of the larger puzzles – advertised as having 3,000, 6,000 and 13,200 pieces – had proportional deviations of only 0.3%, 0.3% and 0.2%, respectively. The difference between absolute and proportional deviations is expected given the Weber-Fechner law (e.g., Dehaene, Reference Dehaene2003; DeWind et al., Reference DeWind, Adams, Platt and Brannon2015; Shepard et al., Reference Shepard, Kilpatric and Cunningham1975b), which predicts tolerance for imprecision to remain approximately constant in proportional terms even as absolute deviations increase systematically with magnitude.
5.3. Discussion
The third analysis shows that, for larger jigsaw puzzles, the stated – typically round – number of pieces on the packaging deviates by more pieces from the actual count. When a round number such as 1,000, or number word such as ‘thousand’, is considered in the frequency analysis (Section 3) or the distributional semantic analysis (Section 4), we ultimately do not know whether it was used precisely or approximately. Moreover, insofar as rounding has occurred, we have no access to the underlying value from which the round number was derived. As argued above, the patterns we observe are consistent with an approximate function of round numbers, but these analyses lack a clear ‘ground truth’ for what has been approximated. Our analysis of jigsaw puzzles provides more direct evidence of increased approximation at higher magnitudes. The finding that larger advertised counts stand for an increasingly wide range of values is in line with the idea that larger numbers have wider pragmatic halos.
6. General discussion
Numbers are often seen as precise and objective. Our results show, however, that their use in everyday communication is systematically shaped by approximate or even wholly vague use. Across three analyses of British and American English, we identified patterns that link round numbers to approximation or imprecision in a magnitude-dependent fashion. First, corpus analyses show that round numbers occur with increasing frequency at higher magnitudes, relative to nearby values. This increase is strongest for numbers most closely related to powers of 10, suggesting not only more frequent approximation but also coarser rounding at higher magnitudes. Second, larger round numbers (e.g., ‘million’, ‘trillion’) exhibit distributional profiles similar to those of indefinite hyperbolic numbers (e.g., ‘skillion’, ‘bazillion’), which indicates that they similarly do not imply exact values. Third, using jigsaw puzzles as a test case, we show that the discrepancy between advertised (typically round) and actual piece counts increases with magnitude, which provides direct evidence that larger round numbers are used to represent a wider range of values – in other words, they have wider pragmatic halos (Krifka, Reference Krifka2007; Lasersohn, Reference Lasersohn1999). Taken together, these findings show that round number use becomes increasingly approximate as magnitude increases, and in some cases lacks a precise value altogether.
In this respect, round number usage often resembles more explicitly vague ways of communicating about quantities (see Winter & Marghetis, Reference Winter and Marghetis2023), such as vague quantifiers (e.g., ‘many’, ‘a lot’) (Cummins, Reference Cummins2015; Moxey & Sanford, Reference Moxey and Sanford2023), expressions involving nouns (e.g., ‘masses of’, ‘oodles of’) (Channell, Reference Channell1994, Ch. 5), vertical or size-based terms (e.g., ‘skyrocketing’, ‘falling’, ‘growing’, ‘shrinking’ numbers) (Lakoff & Johnson, Reference Lakoff and Johnson1980; Winter et al., Reference Winter, Perlman and Matlock2013), numerical range expressions (e.g., ‘10–15 people’) (Pollmann & Jansen, Reference Pollmann and Jansen1996) and hedge words (e.g., ‘about’, ‘give or take’) (Ferson et al., Reference Ferson, O’Rawe, Antonenko, Siegrist, Mickley, Luhmann, Sentz and Finkel2015). The fact that the English language has so many linguistic devices for approximate or vague reference to numerical information suggests a strong communicative need for this type of information (see Regier et al., Reference Regier, Carstensen and Kemp2016; Winter et al., Reference Winter, Perlman and Majid2018). Indeed, vague quantitative reference appears to dominate even in contexts where precision might be expected, such as academic writing, political discourse, and business communication (Banks, Reference Banks1998; Cutting, Reference Cutting2012); political discourse and news programmes (Alcaraz-Carrión et al., Reference Alcaraz-Carrión, Alibali and Valenzuela2022; Woodin et al., Reference Woodin, Winter, Perlman, Littlemore and Matlock2020); and business contexts (Koester, Reference Koester and Cutting2007). Our results show that this preference for approximation (Solt et al., Reference Solt, Cummins and Palmović2017) extends to the use of numbers: despite their capacity for precision, numbers are often used in approximate or vague ways, especially at higher magnitudes. Seen from this perspective, there is a tension between the cultural status of numbers as hallmarks of objectivity (Porter, Reference Porter1995) and their actual use in practice.
This tension is most directly evidenced by the existence of indefinite hyperbolic numerals, which show that people are drawn to the form of numbers, but often do not care about precise reference (Chrisomalis, Reference Chrisomalis2016; see also Burnham, Reference Burnham1951; Pound, Reference Pound1949). These fictitious numbers are not limited to English: for example, ‘ørten’ in Norwegian (Universitetet i Bergen & Språkrådet, n.d.), ‘milhentos’ in Portuguese (Dicionário Priberam, n.d.), ‘tropocientos/tropocientas’ in Spanish (Real Academia Española, n.d.) and ‘عشرطعش’ (‘ashartaash’) in Palestinian Arabic are similar in etymology and function to the English ‘umpteen’. Whereas these indefinite hyperbolic numerals stand out as informal and playful (Chrisomalis, Reference Chrisomalis2016), our distributional semantics analysis suggests that they may be interchangeable with round numbers such as ‘million’ and ‘billion’ in certain contexts. For instance, it may make no pragmatic difference whether the car was moving at a ‘million’ or ‘bazillion’ miles an hour – the important thing is that it was moving very fast. In communication, then, if not in mathematics, the boundary between round and fictitious numbers seems to be permeable, with both types of number being capable of conveying a vague sense of magnitude.
While the analysis of fictitious numbers shows that their distributional semantics resemble that of larger round numbers, it does not show a continuous magnitude-related pattern, as do the other analyses, because we only looked at the numbers 1–99 and words corresponding to other powers of 10 up to sextillion. In relying on pre-trained word2vec embeddings, this method captured not just isolated uses of ‘billion’, ‘quadrillion’ and so on, but also their use in multi-word numerical expressions, such as ‘one billion and one’. Consequently, this analysis did not differentiate between ‘1 million’ and ‘10 million’ – indeed, the latter may not behave any more like ‘squillion’ than the former, despite its larger magnitude. It is plausible that ‘10 million’ is more often used for relatively more precise numerical reference, given that the lexicalised ‘million’ can flexibly indicate an order of magnitude, while the compositional meaning of ‘10 million’ implies a specific calculation (10 × 1 million). Relatedly, because distributional semantics is based on word co-occurrence, the fact that lexicalised number words can occur in multi-number expressions introduces a source of difference between them and the indefinite hyperbolic numerals. For example, ‘umpteen’ cannot felicitously be modified (e.g., ‘twenty umpteen’), and indeed, it does not occur in the corpus this way. The observation that lexicalised magnitude words still exhibit distributional resemblance to pseudo-numbers therefore suggests that it is their flexible, often imprecise use as indicators of magnitude – rather than their participation in compositional numerical expressions – that contributes most strongly to this resemblance.
This preference for approximation in number use answers a fundamentally different question than that of their interpretation. Indeed, Ariel and colleagues argue that in comprehension, numerals are interpreted as precise by default (e.g., Ariel, Reference Ariel, Mauri, Fiorentini and Goria2021; Ariel & Levshina, Reference Ariel and Levshina2025). Katzir and Ariel (Reference Katzir and Ariel2026) present a series of experiments suggesting that interlocutors are aware that speakers often use round numbers imprecisely, but that this awareness does not necessarily translate across to interpretation. Importantly, the largest number included in Katzir and Ariel’s numerical stimuli was 90, and likewise, the numbers included in Ariel and Levshina’s (Reference Ariel and Levshina2025) corpus analyses were much smaller than those analysed in this paper. Our results suggest that magnitude should be explicitly considered in future studies, particularly in experiments testing whether comprehenders would interpret references to round numbers in the order of millions or billions in a similarly precise fashion.
A central claim of this paper is that the numbers deemed ‘round’, and thus are used for approximation, derive from the structure of the numeral system in operation. In English and many other languages (Comrie, Reference Comrie, Dryer and Haspelmath2013), where the decimal system is dominant, powers of 10 occupy structurally salient positions on the number line, and other ‘special numbers’ are mathematically related to these powers. This way of thinking about roundness develops the graded characterisation of roundness presented by Woodin et al. (Reference Woodin, Winter, Littlemore, Perlman and Matlock2024), which suggests that certain round numbers can be ‘rounder’ than others. Because the roundest numbers in the system are related to powers of 10, they grow further apart with magnitude (Jansen & Pollmann, Reference Jansen and Pollmann2001). This magnitude-dependent aspect of roundness provided us with an opportunity to infer approximate number use from frequency data, even though such data inherently underspecify a number’s function. Round numbers can be used for both approximate functions (e.g., estimating unknown quantities; Ruud et al., Reference Ruud, Schunk and Winter2014) and non-approximate ones (e.g., benchmarking; Ozcan et al., Reference Ozcan, Hair and Gunasti2024; Pope & Simonsohn, Reference Pope and Simonsohn2011). The fact that numbers possessing Jansen and Pollman’s (Reference Jansen and Pollmann2001) roundness properties show particularly pronounced frequency increases with magnitude, above and beyond other multiples of 5 and 10, provides stronger evidence for magnitude-relative effects being attributable to approximation. As these round numbers become sparser, the pragmatic halo (Lasersohn, Reference Lasersohn1999) around them widens, which means that they are used to represent a broader range of values (Cummins, Reference Cummins2015; Krifka, Reference Krifka, Hinrichs and Nerbonne2009).
Whereas our claims about pragmatic halos in relation to aggregated number frequencies were inferred, our analysis of jigsaw puzzles permitted us to measure the pragmatic halo of round numbers more directly. We showed that when the actual value that was rounded is known, it indeed deviates more from the communicated round number at higher magnitudes. An outstanding question in regard to jigsaw puzzles is from where this imprecision originates. During manufacturing, jigsaw puzzles are typically cut out from cardboard using a custom die that produces pieces of roughly uniform size, minimising cues that could reveal where pieces should fit based on their size or shape. It is likely to be more difficult to cut out puzzle pieces in such a way that an exact value of, say, 10,000 is reached. Notwithstanding this explanation for the actual number of pieces not being round, puzzle makers still report rounded values, and the numbers reported diverge further from the real figure at higher magnitudes. The source of imprecision in jigsaw puzzles is thus identical to other instances of rounding: a discrepancy between actual values in the world and the round numbers we preferentially use when communicating. Because our preferred round numbers (e.g., those with 10-ness) become sparser at higher magnitudes, this discrepancy tends to increase as magnitude grows.
Overall, our results suggest a resolution to the apparent contradiction between accounts of numbers as exact by default, which appeal to formal semantic analyses (Ariel, Reference Ariel, Mauri, Fiorentini and Goria2021; Ariel & Levshina, Reference Ariel and Levshina2025), and competing accounts that assume that most numbers cannot have exact representations, which rely more on cognitive explanations based on experimental research on the approximate number system (Dehaene, Reference Dehaene1997). These two positions may correspond to different facets of meaning that can be true simultaneously: numbers do have precise mathematical meanings, but in practice, our results suggest that round numbers, in particular, are often used in an approximate fashion. The dual nature of round numbers is not a paradox, but rather a direct consequence of their role in bridging the precise, abstract world of mathematics with the fuzziness of human cognition and communication.
Data availability statement
All data, analysis scripts and additional information about this study can be found at https://osf.io/ct7f8.
Acknowledgements
Bodo Winter was supported by UK Research and Innovation (Future Leaders Fellowship MR/T040505/1).


 Open access

