


Inadequate iron status during pregnancy may lead to unwanted effects for both the woman and the developing fetus(Reference Scholl1,Reference King2) , including increased risk of preterm birth and low birth weight(Reference Aranda, Ribot and Garcia3–Reference Allen5), as well as adverse effects on child neurodevelopment(Reference Wiegersma, Dalman and Lee6,Reference Lozoff, Beard and Connor7) . According to WHO, iron deficiency (ID) contributes to about half of all anaemia cases globally, which affects about 25–35 % of women of reproductive age(8). Although supplementation initiated in pregnancy can correct a maternal deficiency, it is not necessarily sufficient to reverse or prevent adverse effects on child health(Reference Stephenson, Heslehurst and Hall9,Reference Peña-Rosas, De-Regil and Garcia-Casal10) .
Women of childbearing age may be at risk of ID resulting from inadequate dietary iron intake, blood loss from menstruation and after childbirth due to depletion of maternal reserves(Reference King2). In pregnancy, iron demands increase progressively to support placental and fetal growth(Reference Allen11) and to meet the increase in maternal erythrocyte count(Reference Milman, Byg and Agger12). It has been suggested that a serum ferritin concentration of at least 70 µg/l is required at the time of conception to avoid developing ID or ID anaemia during a normal pregnancy(Reference Milman13). The depletion of maternal iron stores during pregnancy and lactation can therefore have consequences for a subsequent pregnancy if maternal reserves are not sufficiently replaced during the interpregnancy period(Reference King2).
Iron supplementation has for many decades been universally recommended for all pregnant women in many countries(Reference DeMaeyer, Dallman and Gurney14), but not all(Reference Milman, Taylor and Merkel15). In Norway, iron supplementation has historically been recommended at moderate doses for women with ID(16). However, assessment of iron status (ferritin) was not included in the antenatal guidelines between 2005 and 2018. In this period, iron supplements were recommended based on anaemia screening (low Hb)(17), although ID may also exist in the absence of anaemia(Reference Auerbach, Abernathy and Juul18). After revision of the Norwegian guidelines in 2018, ferritin is now again assessed for all pregnant women before gestational week (GW) 16 and moderate doses of iron supplement intake (40–60 mg/d) are indicated at ferritin < 70 µg/l(16).
Given the relatively high prevalence of ID in the Norwegian population(Reference Borch-Iohnsen, Sandstad and Asberg19), efforts should be made to secure an adequate iron status in women not only in the last half of pregnancy but also prior to conception.(Reference Georgieff20) Therefore, identification of factors associated with iron status is important to target vulnerable groups with increased risk of ID. The aims of this study were therefore, in a group of 2990 pregnant women, (1) to describe iron status in mid-pregnancy and (2) to identify sociodemographic and lifestyle predictors of pregnancy iron status.
Materials and methods
Study population
This study is based on The Norwegian Mother, Father and Child Cohort study (MoBa, www.fhi.no/moba), a prospective population-based pregnancy cohort study conducted by the Norwegian Institute of Public Health(Reference Magnus, Birke and Vejrup21). MoBa participants were recruited from all over Norway during 1999–2008, and the participation rate was 40·6 %. MoBa data also include information from The Medical Birth Registry of Norway, which comprises information about pregnancy, delivery and health of the mother and the neonate for all births in Norway(Reference Irgens22). In MoBa, blood samples were collected in GW 18(Reference Paltiel, Haugan and Skjerden23) and biomarkers have been measured in a subsample as part of the Norwegian Environmental Biobank(Reference Caspersen, Thomsen and Haug24). The main analysis in the current study includes 2990 women who were pregnant in 2002–2008, with available iron status measurements from Norwegian Environmental Biobank (see online Supplementary material, Supplementary Fig. S1). In a secondary analysis, we included all participants in MoBa with singleton pregnancies, available birth records from the Medical Birth Registry and available self-registered pregnancy Hb measurement and determinant variables in MoBa (n 39 322). This study is based on version 11 of the quality-assured MoBa data files released for research in 2018.
Ethics approval
The establishment and data collection in MoBa were previously based on a license from the Norwegian Data Protection Agency and approval from The Regional Committee for Medical Research Ethics, and it is now based on regulations related to the Norwegian Health Registry Act. The current study has been approved by The Regional Committee for Medical Research Ethics South East Norway (2015/2393).
Assessment of potential predictors from registry data and questionnaires
Definitions of all potential predictor variables are included in online Supplementary Table S1. Information about age, participation year, parity and time since previous pregnancy (for multiparae women) were obtained from the MoBa linkage to Medical Birth Registry of Norway(Reference Irgens22). Interpregnancy interval (IPI) was calculated as time from date of birth of the previous child to date of conception of the current pregnancy, rounded down to whole months. From the first questionnaire in MoBa (GW 15), we collected information on medical history, hormonal contraceptives use, regularity of menstrual cycle, sociodemographic factors and lifestyle. Chronic disease was defined as any self-reported asthma, diabetes, inflammatory bowel disease, rheumatic disease, epilepsy, multiple sclerosis or cancer, before or during pregnancy.
Diet and dietary supplement use were assessed by a semi-quantitative FFQ answered in mid-pregnancy. The FFQ was designed to capture dietary habits and use of supplements during the first half of pregnancy and has been described previously(Reference Brantsaeter, Haugen and Alexander25,Reference Meltzer, Brantsaeter and Ydersbond26) . We converted food frequencies to food and nutrient intakes based on standard Norwegian portion sizes and using FoodCalc(Reference Lauritsen27) and the Norwegian food composition table. We aimed to include food groups (milk, meat, tea, coffee) and food components (fibre, vitamin C) which are relevant for iron status, according to the literature. The nutrient intake from supplements was estimated using a database with nutrient content of more than 1000 different supplement brands collected from suppliers(Reference Haugen, Brantsaeter and Alexander28). Participating women recorded the frequency and quantity, as well as the name and manufacturer of supplement(s) used.
Assessment of iron status and biomarkers from blood samples
Biochemical analyses were performed at the Finnish Institute for Health and Welfare (THL) in Helsinki, Finland. Non-fasting plasma ferritin (P-Fe) indicates the size of iron stores in the absence of concurrent infection(29). Concentrations <15 µg/l are generally considered to be indicative of depleted iron stores for individuals above 5 years of age(29); however, no cut-offs for ID are established for pregnancy(Reference Milman, Taylor and Merkel15). In this study, we defined depleted iron stores as P-Fe concentrations <15 µg/l and low iron stores as P-Fe <30 µg/l. P-Fe was analysed by a chemiluminescent microparticle immunoassay (ARCHITECT Ferritin assay; Abbott Laboratories). The CV of control samples was 2·7–3·7 %. Plasma transferrin was analysed by an immunoturbidimetric procedure (Architect Transferrin assay; Abbott Laboratories). The CV of control samples was 1·8–1·9 %. As an indicator of inflammation, C-reactive protein (CRP) was measured by the Multigent CRP Vario assay, which is suitable for measuring CRP at variable assay ranges, including the low range requiring high sensitivity. The quantification limit was 0·10 mg/l. The CV of control samples was 1·5–4·2 %. The laboratory participated in an external quality assessment scheme for ferritin, transferrin and CRP was organised by Labquality (Finland). From a questionnaire answered around GW 30, participants transferred Hb measurements results from their maternity record: lowest, highest and latest measurement in pregnancy, with corresponding GW. In this study, we considered lowest Hb as the most clinically relevant indicator when studying low iron status.
Statistical analyses
We used a three-step exploratory approach to identify main predictors of iron status. First, we report descriptive statistics of iron status and prevalence of iron depletion across potentially relevant predictors from literature.
Second, we used elastic net regression to select variables associated with iron status, with natural log-transformed (ln-) P-Fe as the dependent variable. Elastic net is a regularised regression method and a useful variable selection strategy in case of multicollinearity between predictor variables(Reference Zou and Hastie30). To determine the penalty parameter (α) and the amount of penalisation (λ), we minimised the root-mean-squared error of prediction by 10-fold cross-validation. We used λ 1se (largest value of lambda that gives an error within 1 se of the minimum), which gives a more parsimonious model than λ min (gives the minimum mean cross-validated error). Before running elastic net regression, we imputed missing values in independent variables up to the full sample of 2990 with multiple imputation by chained equations. Variable selection by elastic net was then repeated on each of 100 imputed data sets, and variables that were selected in more than half of the models were included in further analysis(Reference Wood, White and Royston31).
In the third step, the variables selected by elastic net regression were included as independent variables in a linear model with ln P-Fe as a dependent variable and in log-binomial models with P-Fe <15 or <30 µg/l as a dependent variable. Continuous independent variables were scaled. All models were adjusted for chronic illness, recent cold, CRP and gestational age at the time of blood sampling (mean 18·5 (sd 1·3) weeks) to account for variation in P-Fe not related to iron status. Effect estimates are reported as relative differences (in %) and risk ratios with 95 % CI. All predictors were included in the regression model and therefore mutually adjusted for each other. Linear and log-binomial models were run on pooled imputed data sets. This third step was repeated in the large study sample (n 39 322) with lowest Hb value in pregnancy as dependent variable in a linear model, to investigate associations between lowest Hb and the main predictor variables selected by elastic net regression with P-Fe.
Associations were examined for non-linearity by non-parametric generalised additive models, using thin plate regression splines as smoothers (see online Supplementary material, Supplementary Fig. S2).
In a secondary analysis, we used plasma transferrin as an alternative measure of iron status and repeated the variable selection by elastic net regression, followed by linear regression models with transferrin as the dependent variable. The variables selected by the elastic net regression to predict transferrin were similar to the variables selected for ferritin; however, age and education were not among selected predictors for transferrin. The transferrin results are presented in online Supplementary Table S3. Statistical analyses were performed using R(32) and packages mice (Reference van Buuren and Groothuis-Oudshoorn33), mgcv (Reference Wood34) and glmnet (Reference Friedman, Hastie and Tibshirani35).
Results
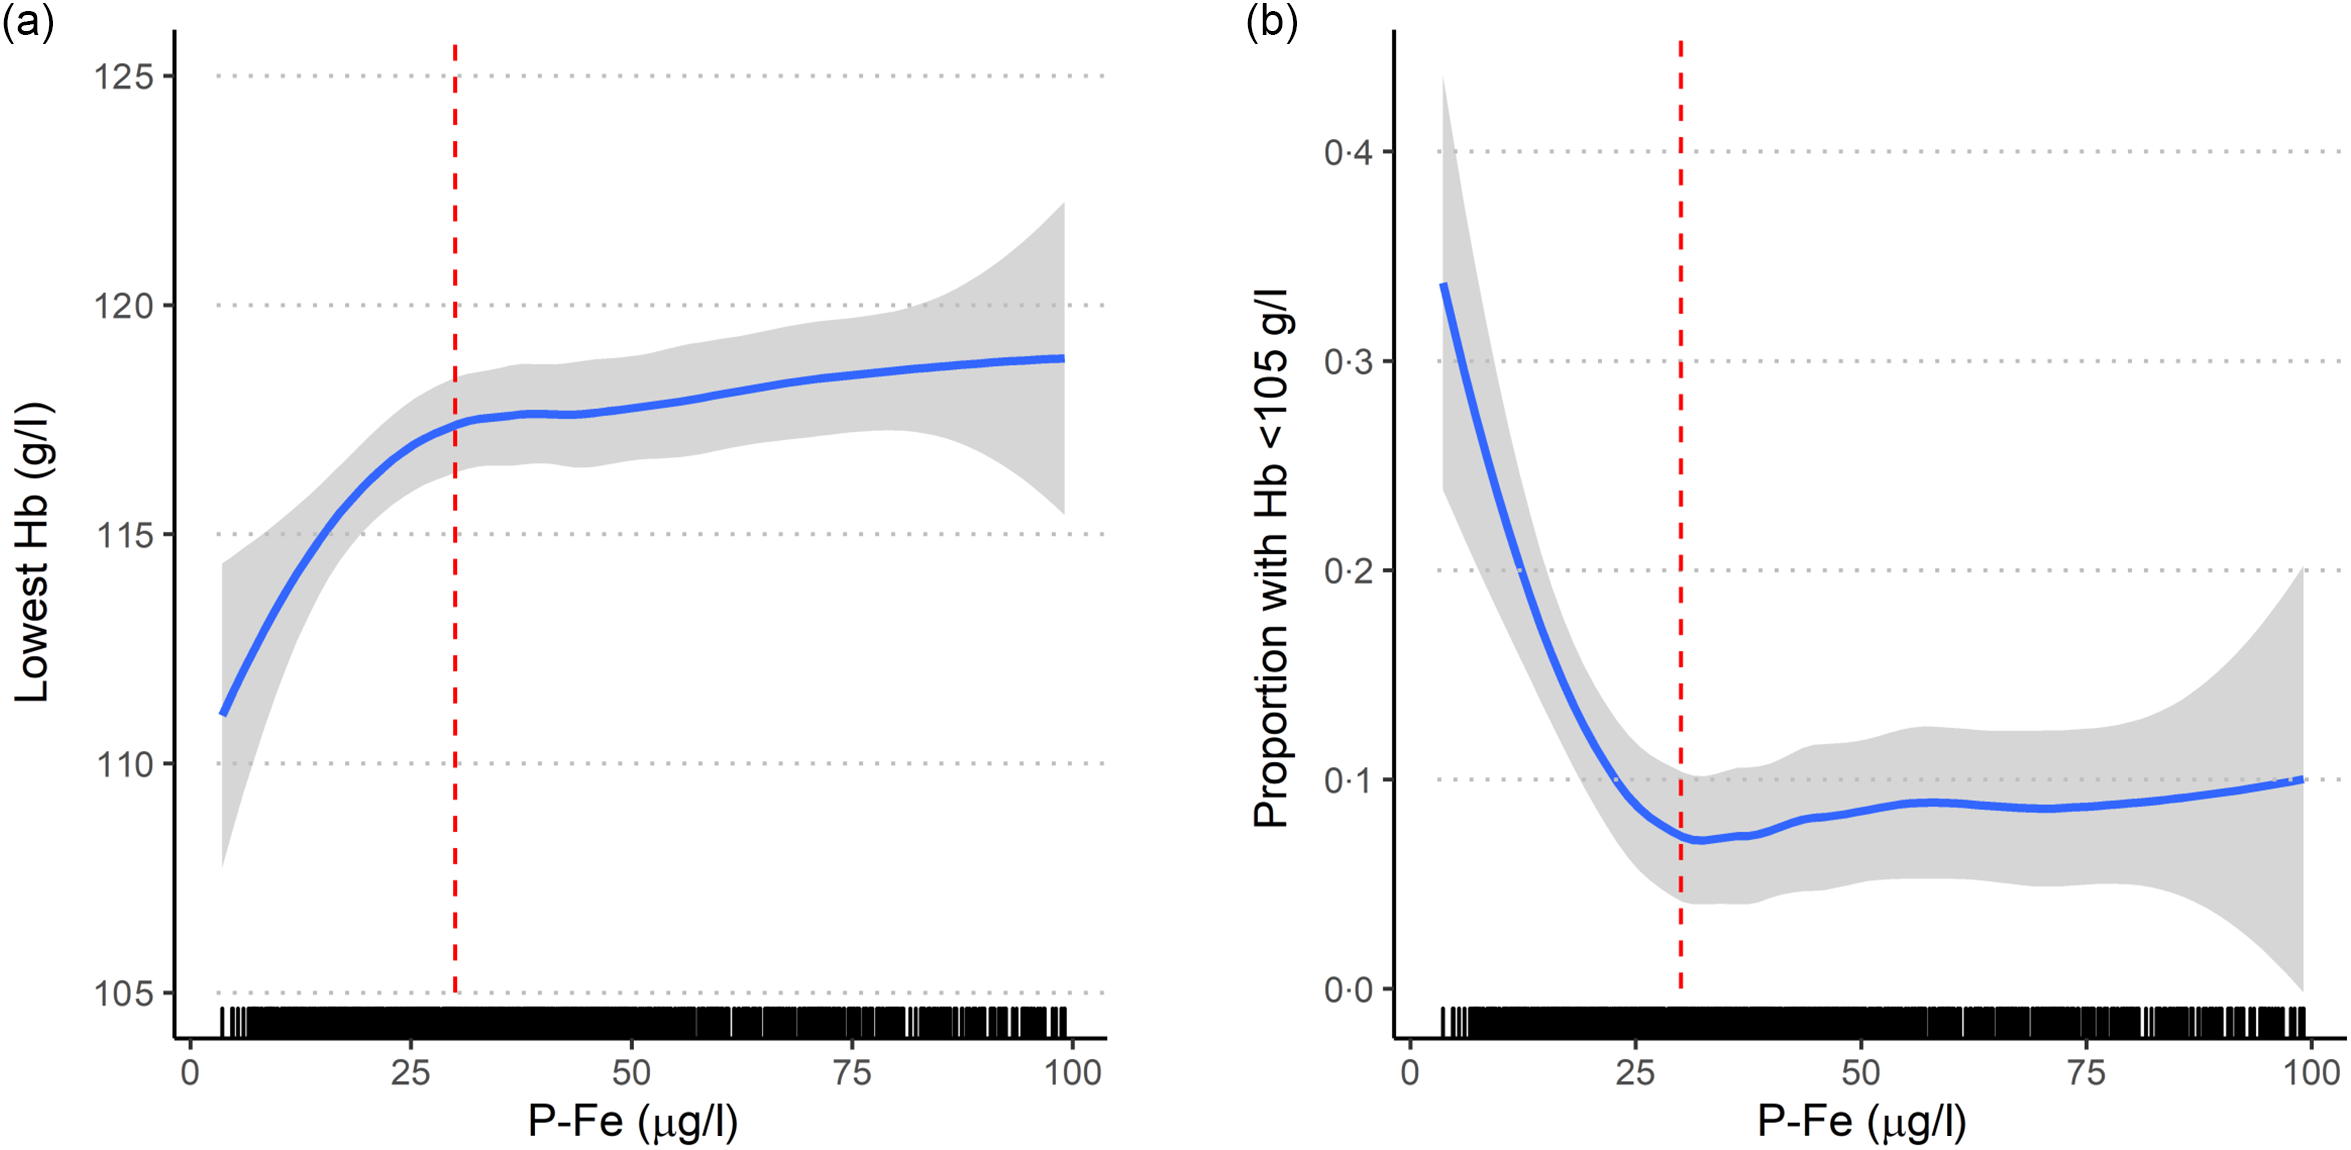
Median P-Fe concentration was 33 μg/l, ranging from 3·2 to 304 μg/l (interquartile range 20–56 μg/l). In total, 84 % had a P-Fe concentration below 70 μg/l, 44 % below 30 μg/l, 14 % below 15 μg/l (Table 1) and 9 % had P-Fe below 12 μg/l. P-Fe concentrations and use of single iron supplement across the study participation years are shown in online Supplementary Table S3. P-Fe was associated with reported lowest Hb measurement, and the reduction in Hb was evident at P-Fe concentrations lower than 30 μg/l (Fig. 1). For the subset with P-Fe< 30 μg/l, Hb increased with a mean difference of 2·8 (95 % CI 1·1, 4·5) g/l per doubling in P-Fe concentration, while no clear association was seen for higher P-Fe concentrations (mean difference 0·6 (95 % CI –0·4, 1·6) g/l per doubling in P-Fe). Among those with P-Fe below 30 μg/l, 17 % reported an Hb measurement lower than 105 g/l. Conversely, among those with an Hb measurement below 105 g/l, 55 % had P-Fe below 30 μg/l.
Plasma ferritin (P-Fe) concentrations by sociodemographic and lifestyle factors
(Numbers and percentages; mean values and standard deviations; medians and interquartile ranges (IQR))
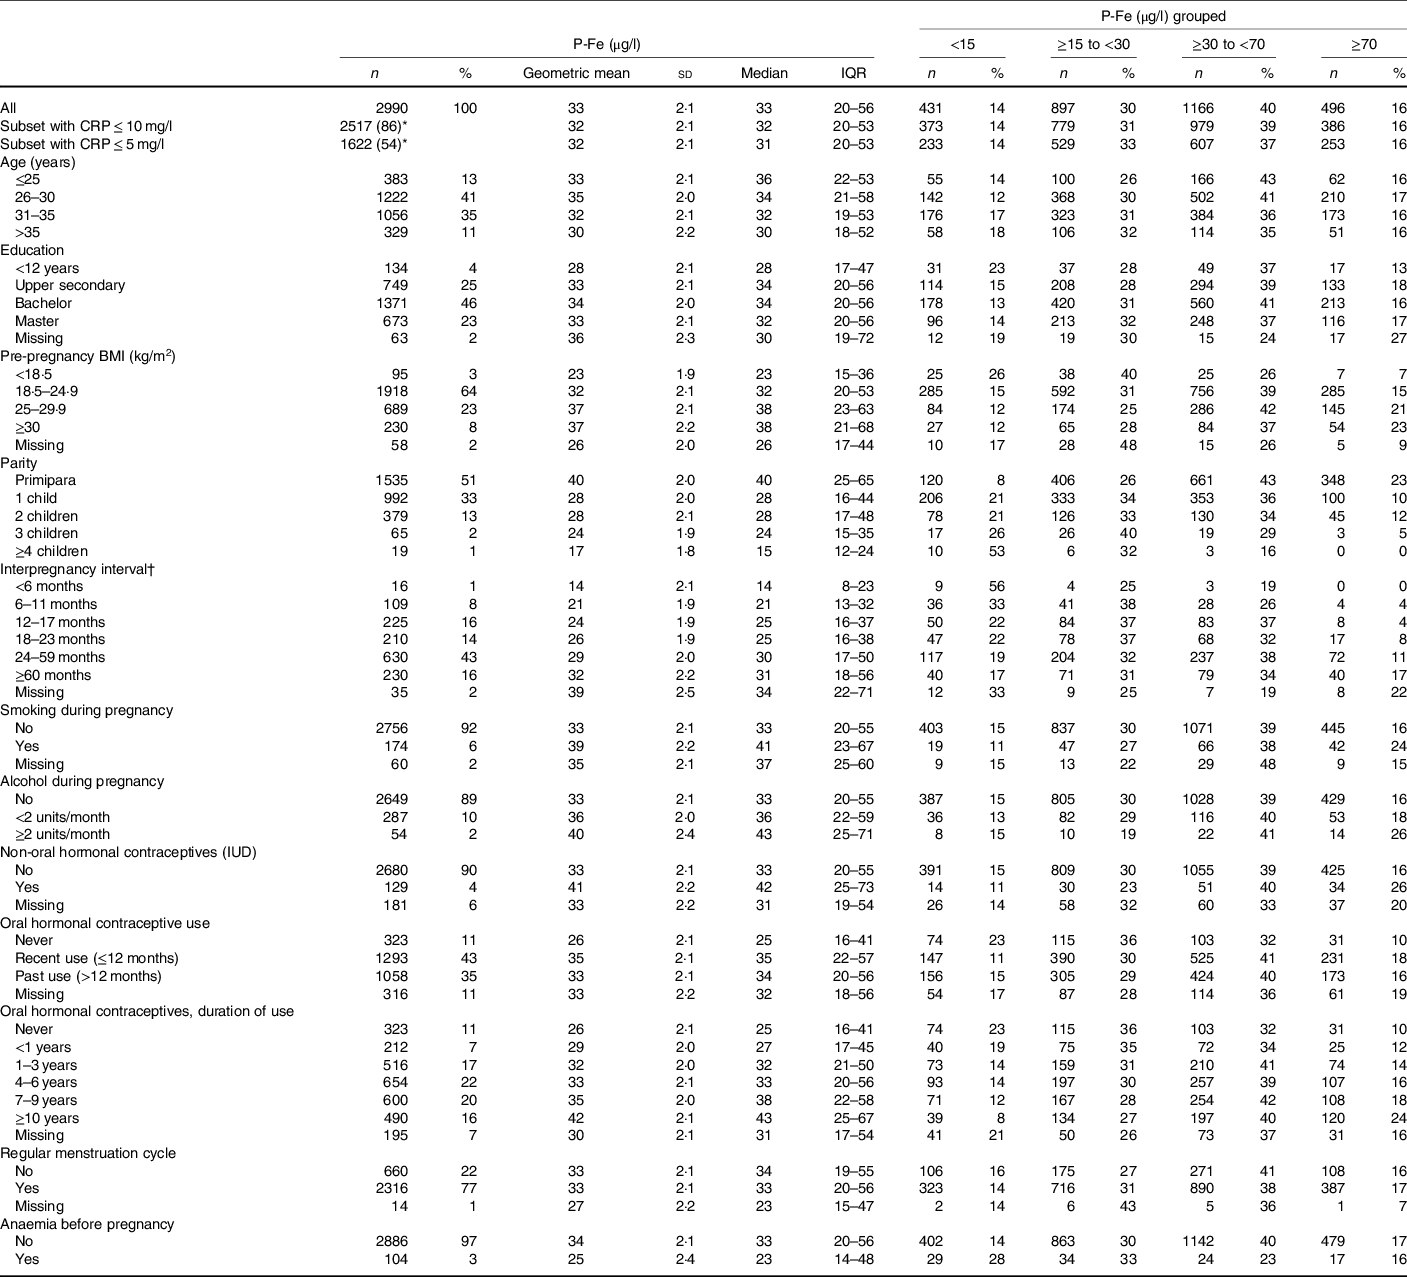
CRP, C-reactive protein; IUD, intrauterine device.
* Percentage of full sample (n 2990).
† Interpregnancy interval is shown for parous women only (n 1456, 49 % of the total sample).
Crude association between ferritin (P-Fe, µg/l) measured in mid-pregnancy (mean 18·5 (sd 1·2) gestational weeks) and (a) lowest Hb (g/l) during pregnancy; (b) proportion with lowest Hb < 105 g/l (measured in mean 23·0 (sd 6·2) gestational weeks), shown for a subset (n 1086) with P-Fe < 100 µg/l. Red dashed vertical line indicates a P-Fe concentration of 30 µg/l. The association is estimated with 95 % CI using local regression (loess) as smoother.
Geometric mean and median P-Fe concentrations suggested a crude positive association with pre-pregnancy BMI (Table 1). P-Fe was lower among non-smokers and non-consumers of alcohol during pregnancy. Median concentrations decreased with increasing parity (40 μg/l for primiparae women to 15 μg/l for women with ≥4 children) and with shorter IPI (31 μg/l for ≥60 months to 14 μg/l for <6 months). Users of hormonal contraceptives, either non-oral or oral, had higher median P-Fe than non-users, and P-Fe increased with longer duration of oral contraceptives use. Moreover, women reporting anaemia before pregnancy (3 %) had lower P-Fe concentrations (median 23 μg/l) than those not reporting anaemia (33 μg/l).
Median intake of iron from the diet (excluding supplements) was 10·8 (interquartile range 8·9–13·2) mg/d, and P-Fe tended to increase with meat intake (Table 2). P-Fe concentrations were lower among consumers of milk and slightly lower for consumers of coffee. Median values of P-Fe did not substantially differ across categories of black tea, herbal tea, vitamin C or fibre intake.
Plasma ferritin (P-Fe) concentrations by dietary intake from food and supplements
(Numbers and percentages; mean values and standard deviations; medians and interquartile ranges (IQR))

GW, gestational week.
* Estimated intake of iron from supplements (single and multi).
† Based on reported time period of single iron supplement use from 26 weeks before conception until GW 28.
‡ Based on reported time period and frequency of single iron supplement use from 8 weeks before conception until GW 20.
Use of iron-containing supplements during the first half of pregnancy was reported by 52 %, and 59 % reported to have used iron supplements between 29 weeks before conception and 28 weeks of gestation. P-Fe was lower for those with iron supplement intake (Table 2), for example, women with high-dose (30–50 mg/d) supplementary iron intakes had lower median P-Fe (30 µg/l), than those taking low dose (≤15 mg/d, 34 µg/l) and those with no iron supplement intake (35 µg/l). The negative association between iron supplement use and P-Fe appeared to be most profound among women who initiated iron supplement use after becoming pregnant. Moreover, P-Fe increased with longer duration of single iron supplement use in the period 8 weeks before conception to GW 20: 23 µg/l for 1–120 d of use v. 29 µg/l for 121–210 d of single iron supplement use. Regarding multi-supplements, women with supplemental iron intake only from multi-supplements (i.e. non-users of single supplements) had higher P-Fe than others. Also, users of multi-supplements without iron had higher P-Fe than users of iron-containing multi-supplements and those not using multi-supplements at all, Table 2.
Eleven variables were selected by the elastic net regression model and subsequently included in linear and log-binomial models while mutually adjusting for each other (Table 3). Parity and IPI were strongly associated with P-Fe; for parous women, an IPI < 6 months was associated with a −50·5 (95 % CI –64·6, –31·0) % reduction in P-Fe compared with 24–59 months. Further, an IPI < 12 months was associated with higher risk of depleted iron stores (adjusted risk ratio 2·40 (95 % CI 1·53, 3·73) for P-Fe < 15 μg/l), compared with 24–59 months. Notably, P-Fe was no longer negatively associated with age in the regression analysis, rather, regression analysis controlling for other variables showed increased P-Fe with increasing age (Table 3 and see online Supplementary material, Supplementary Fig. S2). The regression analysis showed lower P-Fe among underweight women compared with normal weight. Also, overweight and obesity were associated with higher P-Fe compared with normal weight. Further, smoking during pregnancy and use of hormonal contraceptives were also selected as predictors of P-Fe; smokers had 19·2 (95 % CI 7·4, 32·4) % higher P-Fe, while non-oral hormonal contraceptive use was associated with a 45·8 (95 % CI 29·6, 64·0) % increase in P-Fe.
Associations between plasma ferritin (P-Fe) and selected (by elastic net regression) predictor variables, with regression coefficients (adjusted relative difference and risk ratios (RR) with 95 % confidence intervals) from linear and log-binomial models*†
(Numbers and percentages; risk ratios and 95 % confidence intervals, n 2990)
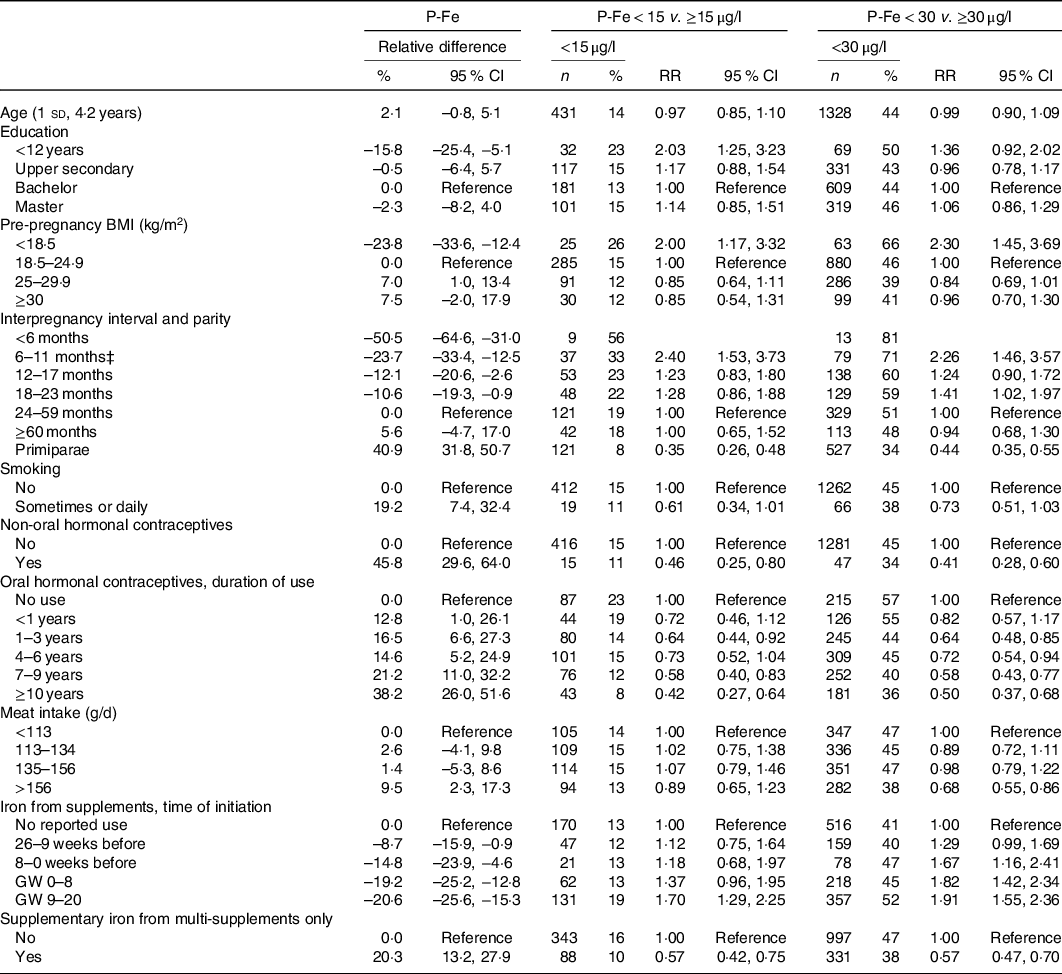
GW, gestational week.
* Models are adjusted for chronic illness, reported recent infections, C-reactive protein and gestational age at the time of blood sampling in addition to mutual adjustment for all variables listed in the table.
† The following variables were included in the elastic net regression, but not selected: Intake of coffee, herbal tea, black tea, milk, fibre, vitamin C intake, total intake of iron, duration of single iron supplement use, cumulative use of single iron supplement (frequency × duration), use of iron-containing multi-supplements, regularity of menstruation cycle, recent use of oral contraceptives (last 12 months, yes/no) and previous smoking.
‡ For log-binomial models, <6 months was collapsed with 6–11 months due to low n.
Dietary variables were also associated with P-Fe in the regression analysis. A meat intake in the highest quartile (>156 g/d) was associated with a 9·5 (95 % CI 2·3, 17·3) % increase in P-Fe compared with being in the lowest quartile (<113 g/d). Initiation of iron-containing supplement in the period before pregnancy or during pregnancy was associated with lower P-Fe compared with no use, and the negative association between supplement use and P-Fe was stronger when the use was initiated after becoming pregnant (–20·6 (95 % CI −25·6, −15·3) % for initiation in GW 9–20, compared with no use). The opposite trend was seen for those with supplementary iron intake from multi-supplements only, which was associated with 20·3 % increased P-Fe concentrations.
The alternative model, using lowest Hb as an outcome, agreed with the P-Fe results for education, pre-pregnancy BMI, use of hormonal contraceptives, meat intake and duration and use of iron-containing supplements, but did not show the same strong association with IPI and parity. Associations were of opposite directions for age and smoking, which were positively associated with P-Fe, but negatively associated with Hb (see online Supplementary material, Supplementary Table S4).
Discussion
A main finding of this study was that a substantial number of women had low iron stores in mid-pregnancy: 14 % had P-Fe below 15 μg/l and 44 % below 30 μg/l. Further, 84 % had P-Fe below 70 μg/l, which is the cut-off for recommending supplements after GW 18–20 in the updated Norwegian antenatal guidelines(16). Our results suggested that a P-Fe concentration below approximately 30 μg/l was associated with reduced Hb in pregnancy (as reported in GW 30). Only 17 % of women with P-Fe below 30 μg/l reported an Hb measurement lower than 105 g/l, suggesting that Hb measurements may not be a sensitive indicator of low iron status in pregnancy. In a larger study in MoBa(Reference Haugen, Brantsaeter and Alexander28), median intake of iron from diet was about 11 mg/d (similar to this study) and half of the pregnant women had an iron intake below the recommendation of 15 mg/d for women(36). Median ferritin concentrations and prevalence of ID in this group of pregnant women were within the same range as in European women of reproductive age, as summarised by Milman et al.(Reference Milman, Taylor and Merkel15). Data from >15 European countries showed an average serum ferritin concentration at 26–38 µg/l, and about 40–55 % had low or depleted iron stores (P-Fe < 30 µg/l).
Another main finding was the identification of factors associated with increased risk of ID among pregnant women. Using an exploratory approach, we identified eleven sociodemographic, reproductive and lifestyle variables as predictors of low iron stores, including short IPI, increasing parity and low BMI. Moreover, prolonged pre-pregnancy use of hormonal contraceptives, particularly non-oral, was associated with higher iron status, together with increasing age and high meat intake. Early initiation of an iron-containing supplement before or early in pregnancy was associated with higher P-Fe compared with initiation after pregnancy was known (GW 9–20). Women who were taking supplementary iron from multi-supplements only (i.e. not from prescribed single high-dose supplements) had higher P-Fe compared with others.
In contrast, users of high-dose iron supplements had lower median P-Fe than non-users in this group of women; however, among those who did take single iron, prolonged use was associated with increasing P-Fe. This finding may reflect that single iron supplements were used mainly by women with known ID, according to prevailing guidelines in the study period. Also, high-dose iron supplements may potentially decrease iron absorption through increased hepcidin(Reference Moretti, Goede and Zeder37). The increase in P-Fe with iron-containing multi-supplement use and prolonged use of high-dose iron supplement suggests a beneficial effect of supplements on iron status, although the direction of causality could not be assessed in this study.
We found a positive association with average meat consumption as reported by the FFQ, and meat consumption was among the selected predictors. Average intakes of other specific foods or beverages were not selected as important predictors. However, median P-Fe was slightly lower among those with high average intake of milk, black tea, coffee and fibre, and slightly higher among those with high vitamin C intake. These foods and beverages are known in the literature to affect the bioavailability of iron in the diet when consumed in the same meal(36,Reference Hallberg, Brune and Rossander38,Reference Hallberg, Rossander-Hulten and Brune39) .
We found that short IPI was associated with lower ferritin concentrations and increased risk of small or depleted iron stores, suggesting insufficient repletion of iron stores after a previous pregnancy. Our findings thus support the recommendation from WHO of at least 24 months between pregnancies in order to reduce risk of adverse maternal, perinatal and infant outcomes(Reference Conde-Agudelo, Rosas-Bermudez and Kafury-Goeta40,41) ; however, a reduction in iron stores was found for all multiparae women compared with primiparae. Indeed, short IPI has been linked to adverse maternal or child outcomes(Reference Conde-Agudelo, Rosas-Bermudez and Kafury-Goeta40,Reference Barclay and Kolk42,Reference Ahrens, Nelson and Stidd43) . Micronutrient depletion of both iron and folic acid has been suggested to play a role(Reference Smits and Essed44), as these stores often remain low for several months after delivery(Reference Scholl and Reilly45). Our results suggest that maternal iron depletion may be a potential mediator of the adverse health outcomes associated with short IPI.
The positive association between use of hormonal contraceptives and iron status may be explained by the reduced menstrual flow quantity caused by modern low-dose hormonal contraceptives(Reference Larsson, Milsom and Lindstedt46,Reference Brynhildsen47) . Oral hormonal contraceptive use has been shown to increase serum ferritin levels especially in women with low iron stores (<10 µg/l)(Reference Larsson, Milsom and Lindstedt46).
Pre-pregnancy BMI was positively associated with P-Fe for underweight, normal-weight and overweight women, but the direction of the association was unclear for obese women, online Supplementary Fig. S2. Low iron status has been related to low BMI(Reference Robinson, Godfrey and Denne48), but more often with high BMI(Reference Jones, Zhao and Jiang49,Reference Bodnar, Siega-Riz and Cogswell50) , although with inconsistent evidence when assessed as serum ferritin(Reference Zhao, Zhang and Shen51). The low-grade inflammation related to obesity has been shown to increase secretion of hepcidin, which in turn decreases iron absorption and thus leads to low iron status(Reference Nemeth, Valore and Territo52,Reference Koenig, Tussing-Humphreys and Day53) .
Smokers tend to have higher ferritin levels than non-smokers(Reference Ghio and Hilborn54), which we also observed in this study. There is substantial evidence that cigarette smoking leads to iron dysregulation, resulting in accumulation of iron both in the lung and systemically(Reference Ghio, Hilborn and Stonehuerner55). The imbalance in iron homoeostasis caused by smoking has been suggested to increase oxidative stress and play a role in pathogenesis, for example, of respiratory diseases(Reference Ghio and Hilborn54,Reference Zhang, Butler and Cloonan56) .
Ferritin has limitations as indicator of iron status, especially during pregnancy due to physiological haemodilution, which also introduces additional inter-individual variation. Moreover, the normal decrease in iron status throughout pregnancy is accompanied with increased intestinal iron absorption(Reference Barrett, Whittaker and Williams57). As women with depleted reserves have higher iron absorption than those with adequate iron status(Reference Barrett, Whittaker and Williams57,Reference O’Brien, Zavaleta and Caulfield58) , this may introduce bias when studying dietary intake as a predictor. However, the increase in iron demands is largest in the second half of pregnancy(Reference Milman13), and we assume that the distribution of P-Fe in week 18 is representative of that earlier in pregnancy. Although most women in this study donated blood for ferritin assessment (around GW 18) prior to filling in the FFQ (around GW 22), studies show that dietary patterns are fairly consistent between the first and second trimester(Reference Rifas-Shiman, Rich-Edwards and Willett59,Reference McGowan and McAuliffe60) . Therefore, we consider this to have minimal influence on the findings. Although we adjusted ferritin for CRP and included transferrin as a second iron status indicator in a sensitivity analysis, additional indicators of iron status, such as transferrin saturation, would have strengthened our study(29).
Second, this study was observational with limitations to external validity. Predictors of iron status vary between populations(61), and important predictors in Norwegian pregnant women will likely differ from those in universally supplemented populations. Also, iron status was measured in a sample of women who had completed all the first six questionnaires in MoBa, possibly introducing selection bias to our study. Still, we expect that important predictors of iron status found in this study are generalisable to the general pregnant population in Norway. Furthermore, ethnic minorities are not well represented in MoBa. Low iron stores have been shown to be more common among pregnant women in certain minority groups in Norway(Reference Naess-Andresen, Eggemoen and Berg62). We had no information of recent blood donations prior to pregnancy, which reduce iron stores(Reference Robinson, Godfrey and Denne48,Reference Milman, Clausen and Byg63) .
A third limitation of this study relates to the estimation of iron intake from food and supplements based on questionnaires, which are, as all dietary assessments, prone to bias due to misreporting. Dietary iron intake is strongly correlated with energy intake (Pearson correlation coefficient, r = 0·8 in this study), and the estimated iron intake in this study will thus be biased by under- or overreporting in the FFQ(Reference Meltzer, Brantsaeter and Ydersbond26). Also, we had no information on meal composition, only on frequency of food consumption, which limits the assessment of dietary intakes as predictors of iron status.
Two main strengths of this study were (i) the large number of women with available ferritin measurements in mid-pregnancy (n 2990) and (ii) the extensive data collection in MoBa, which allows studying a wide range of variables related to sociodemographic factors, medical history, lifestyle including diet and supplement use. Moreover, coinciding CRP measurements enabled control for on-going inflammation in the analysis.
Conclusions
Mid-pregnancy P-Fe in this study suggested that a considerable group of Norwegian women may have low or depleted iron stores. The potential health consequences for mother and child of low ferritin, also at stages where Hb is within a range considered normal for pregnancy, should be elucidated in further research. Main predictors of P-Fe status were related to reproductive factors as IPI, parity and use of hormonal contraceptives in the past. Lifestyle factors, including diet, were of less importance. The presence of depleted iron stores in mid-pregnancy in an assumed well-nourished population like the Norwegian underlines the importance of ferritin measurements in women of childbearing age, and particularly in women with previous and recent childbirths, and among those not using hormonal contraceptives.
Acknowledgements
The Norwegian Mother, Father and Child Cohort Study is supported by the Norwegian Ministry of Health and Care Services and the Ministry of Education and Research. We are grateful to all the participating families in Norway who take part in this on-going cohort study.
The Research Council of Norway funded this work (project number 251 075).
I. H. C. was responsible for the conception of the article, statistical analyses and revision of the manuscript. L. I. V. drafted the manuscript and assisted in interpretation of results. M. H. A. and A. L. B. assisted in conception of the article, interpretation of results and revising the manuscript. V. A. assisted in interpretation of results and revising the manuscript. I. E. was responsible for chemical analysis and assisted with interpretation of results and revising the manuscript. H. M. M. supervised the acquisition of data and assisted with conception of the article, interpretation of results and revision of the manuscript. All authors have approved to publication of the article and accept responsibility for the content of the paper.
The authors declare that there are no conflicts of interest.
Supplementary material
For supplementary material referred to in this article, please visit https://doi.org/10.1017/S0007114521000295


