


Obesity, the prevalence of which is increasing globally(1), is associated with an increased risk of developing chronic diseases such as type 2 diabetes and CVD(Reference Kopelman2, Reference Pantalone, Hobbs and Chagin3). Diet, among other lifestyle factors, potentially contributes to the development of obesity(Reference Karl and Saltzman4). Cereal consumption at breakfast has been associated with a reduced risk of obesity and related diseases, potentially via improved energy balance regulation and metabolism(Reference Schlundt, Hill and Sbrocco5, Reference Williams6).
Whole-grain cereals provide approximately two-thirds of the energy and protein intake in several countries over the entire world, especially in developing nations(Reference Slavin, Martini and Jacobs7, Reference Slavin, Jacobs and Marquart8). Their consumption is thought to have beneficial health effects(Reference Williams6, Reference Fardet9, Reference Kim, Stote and Behall10). These include blunting postprandial glycaemic and insulinaemic responses(Reference Hallfrisch and Behall11), lowering blood pressure, improving serum lipid profile(Reference Mellen, Walsh and Herrington12) and improving long-term weight management via satiating properties(Reference Jonnalagadda, Harnack and Liu13–Reference Isaksson, Tillander and Andersson15), though there is still need for fully powered randomised controlled trials with longer durations assessing cardiovascular events as well as cardiovascular risk factors(Reference Kelly, Hartley and Loveman16). Whole-grain cereals vary in their resilience with respect to growing conditions, an important factor to consider to optimise food supply security and sustainability given their key role in the diet. Breakfast cereal porridges, made from a variety of whole-grain cereals, are consumed commonly and would be expected to result in varied and complex gastrointestinal, biochemical and appetitive responses depending on the specific chemical characteristics of the original grain (such as macronutrient composition, amylopectin-to-amylose ratio and fibre content) and physical characteristics, including differences in the food matrix resulting from various preparation and cooking methods(Reference Meynier, Goux and Atkinson17–Reference Brand-Miller, Holt and Pawlak20). All potentially modulate, in turn, the glycaemic response, gastrointestinal response and appetitive response. Studying specific whole grains is essential to fully understand and exploit the health benefits.
Oats (Avena sativa), an annual crop used both for human (e.g. breakfast porridges) and animal nutrition, are grown mostly in cool, moist climates being adversely affected by hot, dry weather(Reference Sangwan, Singh and Tomar21). Oats are nutritious grains containing most fatty acids, including the essential amino acid linoleic acid(Reference Helnæs, Kyrø and Andersen22, Reference Miller and Fulcher23), and are rich in protein. Whole-grain oats contain dietary fibre (DF), including a high amount of the soluble fibre β-glucan, varying between 2·3 and 8·5 g/100 g(Reference Welch, Brown and Leggett24, Reference Butt, Tahir-Nadeem and Khan25). β-glucan has been suggested to reduce serum cholesterol, a risk factor for chronic heart diseases(Reference Rebello, O’Neil and Greenway26–Reference Granfeldt, Eliasson and Björck29). In addition, oats contain several antioxidants, including vitamin E, phytic acid, phenolic compounds and avenanthramides, some of which are unique antioxidants that are only present in oats(Reference Katz30, Reference Koistinen and Hanhineva31).
Pearl millet (Pennisetum glaucum) is an ancient, small-seeded grain within the Poaceae or Gramineae family. It is nutritionally comparable to major cereals such as wheat(Reference Nambiar, Dhaduk and Sareen32) and may have potential health benefits, particularly with respect to glucose and insulin metabolism(Reference Helnæs, Kyrø and Andersen22, Reference Nambiar, Dhaduk and Sareen32–Reference Taylor, Emmambux and Kruger34). It has the advantage of being gluten-free and provides energy, DF, proteins and also some vitamins and antioxidants(Reference Nambiar, Dhaduk and Sareen32, Reference Dias-Martins, Pessanha and Pacheco35). Furthermore, pearl millet has been targeted for increased iron content and for zinc enhancement(Reference Rai, Gowda and Reddy36). The content of essential amino acids in pearl millet (leucine: 10·7 g/100 g protein; isoleucine: 4·4 g/100 g protein) is higher than that of oats (leucine: 7·6 g/100 g protein; isoleucine: 4·1 g/100 g protein)(Reference Slavin14). However, the phytic acid content of pearl millet (varying from 588 to 1382 mg/100 g) is also higher than that of oats(Reference Gonzalez and Stevenson37).
Pearl millet production covers about thirty million hectares in thirty countries spread across Asia, Africa, the Americas and Australia(Reference Ashwini, Rajiv and Prabhasankar38). The largest land use for this crop is India (about 8·5 million ha). Pearl millet ranks third in production after wheat and rice and is a staple food source in poor countries(Reference Suma and Urooj39). Millet can be grown in areas with water scarcity, low soil fertility and high temperatures(Reference Suma and Urooj39, Reference Devi, Vijayabharathi and Sathyabama40), which could contribute to a more sustainable and resilient agricultural system, with greater plant and dietary diversity(Reference Dwivedi, van Bueren and Ceccarelli41). However, there is surprisingly little research available on the physiological responses to pearl millet consumption, particularly as a breakfast cereal.
In a previous pilot study, a pearl millet porridge (PMP) breakfast appeared to induce lower postprandial blood glucose responses and appetite scores compared with other grains, although the differences were not conclusive(Reference Alyami, Ladd and Pritchard42). The pilot study was instrumental in the subsequent development of the present study, providing a better understanding of issues related to cooking, acceptability of the meals, physical form of the products and participants’ reliability in returning the food diaries. Furthermore, the preliminary data collected from the pilot study were used to power this main physiological study. Appetite ratings are only a proxy measure for what people will actually eat later in the day, which led us to introduce an objective assessment of food intake by providing an ad libitum test meal after the consumption of a whole-grain porridge. Also, it was recognised that the follow-up study should include measurements of insulin and glucose responses as well as the metabolic- and appetite-related gut hormones such as glucagon-like peptide 1 (GLP-1), glucose-dependent insulinotropic polypeptide (GIP) and peptide YY (PYY). We thus planned a larger study to investigate further the glycaemic, gastrointestinal, hormonal and appetitive responses to the consumption of breakfast porridges made from a novel pearl millet flake compared with a commonly consumed porridge oat flakes for which the nutritional composition, as eaten, had been measured. The plasma GLP-1, PYY and GIP concentrations were measured due to their direct physiological effect on gastric emptying, glycaemic response and appetite. Oats porridge was chosen for comparison due to its well-known physiological health benefits as well as being a commonly consumed porridge(Reference Karra and Batterham43–Reference Huda, Wilding and Pinkney46). Millet was selected for comparison, because of our previous results and drawing on the broader context of its potential value due to resilience to harsh growing conditions. The hypothesis underpinning the present study was that a PMP breakfast will cause a smaller rise in blood glucose compared with an isoenergetic and isovolumetric breakfast meal of SOP.
Subjects and methods
Participants
The study was conducted at the Sir Peter Mansfield Imaging Centre located at the University of Nottingham. The study was approved by the University of Nottingham, Medical School Research Ethics Committee (F12072016), and all participants gave written informed consent.
Participants were recruited between August 2016 and April 2017 from the local student and staff population via a poster advertisement. Those who expressed interest were invited to a screening session to establish whether they met the study inclusion criteria, namely age 18–65 years, healthy, BMI ≥18 and ≤24·9 kg/m2, and able to give written informed consent. Exclusion criteria included: using medication which interfered with study measurements, participated in another nutritional or biomedical trial 3 months before this study, not being a habitual breakfast consumer, not usually eating at least three meals a day, not willing to consume all of the foods offered during the study, working night shifts (between midnight and 06.00 hours), doing strenuous exercise for >10 h/week, consuming twenty-one alcoholic drinks in a typical week, following a medically or self-prescribed diet during the 2 weeks prior to and until the end of the present study, contraindications for MRI scanning (e.g. presence of metal implants, an infusion pump and/or a pacemaker) as assessed by a standard MRI safety questionnaire, pregnancy, inability to lie flat, and exceeding the scanner bed weight limit of 120 kg.
At the screening visit, height was measured to the nearest 0·1 cm with the use of a stadiometer (Seca). Body weight was measured with the use of an electronic scale (Seca) to the nearest 0·1 kg. BMI was calculated as weight (kg) divided by the square of height (m2).
A total of thirty-four healthy volunteers were initially assessed for eligibility (Fig. 1). Seven participants were not eligible; another participant, although initially eligible, did not meet the criteria on the study day. Therefore, twenty-six participants, seventeen females and nine males, with a mean age of 28·5 (sd 9·6) years and with a mean BMI of 23·4 (sd 3·2) kg/m2 were included in the data analysis. Written informed consent was obtained from each participant before the trial. The format of the site master file and case report forms was informed by Good Clinical Practice (ICH 2016). The study was registered within ClinicalTrials.gov with identifier NCT03068039. The trial registration name was ‘Gastrointestinal Responses to Millet and Oats Breakfast Interventions Assessed by MRI (MOM)’.
Study participant flow diagram. GIP, glucose-dependent insulinotropic polypeptide; GLP-1, glucagon-like peptide 1; PYY, peptide YY.

Experimental design
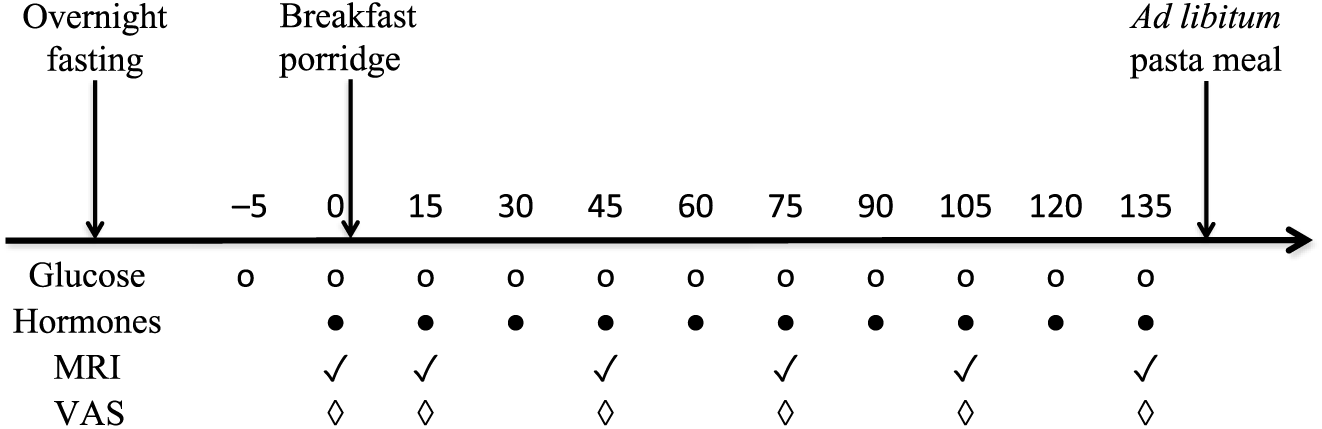
The present study used a single-centre, randomised, two-way crossover design that consisted of two separate test days, approximately 1 week apart. Participants consumed their habitual diet between each visit. The randomisation scheme was generated with the use of the Second Generator Plan from www.randomization.com. Each study visit lasted from 08.00 hours until approximately 13.30 hours. The porridge meals differed in appearance and taste; hence, participants could not be blinded to the intervention although they were not informed of which porridge they were consuming on each visit. The participants were asked to fast overnight (for at least 10 h), but a glass of water was permitted on waking. On arrival they completed the study day eligibility check questionnaire to monitor adherence to study day restrictions, such as overnight fasting. An MRI scan was done to collect baseline images and to ensure that the participants’ stomach was actually empty at baseline. Measurements were taken at baseline and for up to 2 h post-consumption for gastric emptying, blood glucose, insulin, PYY, GIP and GLP-1, and paper-based subjective appetite visual analogue scale (VAS) was completed (Fig. 2). Participants were then given an ad libitum test lunch meal to measure intake. After this, but before discharge, they received instructions on how to record in a food diary that was provided, their food and drink intake over the remainder of the day.
Diagram of the study day protocol. VAS, visual analogue scale.
All the data except the glucose values were blinded prior to analysis, and the blind code was broken only after a blind data review was conducted. The outcome assessor was the one carrying out fingerpricking so the glucose data could not be blinded.
Breakfast porridge intervention
The two breakfast porridges were made from either Scottish oats (own brand of ASDA, a supermarket chain, UK) or a novel pearl millet flake (supplied by Unilever, under a Material Transfer Agreement). Both products were in the form of steam-rolled flakes. Due to differences in physical size between the grains, the millet steam-rolled flakes obtained were smaller in size compared with oat flakes.
The test meals prepared for the study were isoenergetic (920 kJ each) and isovolumetric (640 ml each) (Table 1). Both porridges were cooked in the same way, in that 40 g of flakes were placed in an open glass bowl, gently mixed with 270 ml water at room temperature and heated in a 900 W microwave. This procedure was repeated in parallel using an identical second open glass bowl and a second identical microwave. The porridges were heated for 2 min at full power, stirred gently with a spoon and left to rest for 1 min, heated again for 2 min at full power, stirred gently with a spoon and left to cool for 6 min. By this point the water had all been absorbed into the cooked product. The contents of the two bowls were then combined before a set weight of porridge was given to the participants to eat, namely 400 g for SOP and 415 g for PMP. This was done to match the energy content of the cooked product, flakes plus cooking water, to 920 kJ. The study meals were consumed with a glass of water at room temperature, and the volume of water provided to the participants was used to compensate for volume differences in the portions of cooked isoenergetic product. Therefore, 240 ml of water was provided with SOP and 304 ml of water was provided with PMP, matching the total volumes to 640 ml. The drinking of water was not standardised in aliquots, but the participants were asked to consume all of the porridge and all of the drink within 15 min. The manner in which the participants drank the water and timing was not formally recorded, but they mostly drank the water while eating the porridge, as opposed to consuming all of the water at the end. Other meal characteristics such as appearance and weight necessarily differed between meals (Table 1).
Breakfast porridge test meal characteristics per served portion
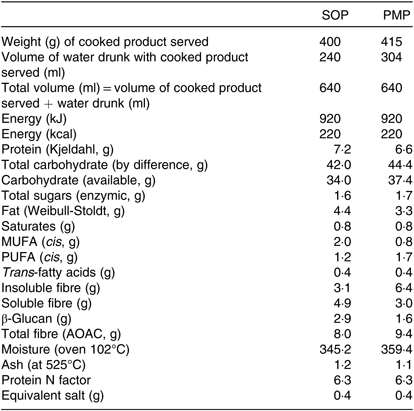
SOP, Scottish oats porridge; PMP, pearl millet porridge.
The composition of the cooked products was analysed for fibre, protein, fat and moisture (Table 1). Fibre analysis was performed via AOAC Method 991.43 by three-stage enzymatic hydrolysis with heat-resistant α-amylase, protease and amyloglucosidase. After hydrolysis the soluble and insoluble fractions were separated using a filtering crusible (Celatom® bed). The insoluble DF (IDF) content was measured by gravimetric analysis. The filtrate fraction containing soluble DF (SDF) was precipitated using 4× volume of 60°C 95 % (v/v) ethanol. The ethanol precipitation of SDF in pearl millet fraction was observed to be markedly different from that in Scottish oats. Upon adding ethanol to pearl millet SDF fraction, a very fine colloid suspension was formed. To enhance the recovery of precipitated fibre, two methods were applied; first, we reduced the volume of the filtrate using a rotary evaporator (60°C, 100 mBar; Rotavapor® R-300, Büchi). Upon evaporation, a higher concentration of solids was achieved, which facilitated precipitation. The second method employed a high-speed centrifuge to separate the SDF precipitate (10 000 g; Jouan CR3i Multifunction Centrifuge, ThermoFisher Scientific). Both methods gave comparable results, and further analysis was performed using the centrifugation method for both oat and millet samples. The SDF precipitate was washed with ethanol, re-dispersed in deionised water, freeze-dried and the amount of SDF was determined by gravimetric method.
The β-glucan content was measured with a Megazyme® β-Glucan Assay Kit (K-BGLU; Megazyme), which follows the AOAC Method 995.16. The method is based on a two-stage enzymatic hydrolysis using lichenase and β-glucosidase, with subsequent determination of reaction products using UV/VIS spectrophotometry.
The available carbohydrate was calculated as the difference between total carbohydrate and fibre (measured by the AOAC method). Total carbohydrate per 100 g was calculated as: (100 – (moisture per 100 g + ash per 100 g + fat per 100 g + protein per 100 g))(Reference Lee, Durst and Wrolstad47). Total energy was calculated assuming that the energy provided by protein, fat, available carbohydrate and fibre was 4, 9, 4 and 2 kcal/g, respectively (analysis and estimations provided by Campden BRI, Chipping Campden, UK).
Outcome measures
Fingerprick blood glucose
The incremental AUC (iAUC) for blood glucose was the primary outcome of the present study. Capillary blood samples were collected at fasting baseline (t = 0), immediately after feeding (t = 15) and every 15 min thereafter until t = 135 min (Fig. 2) via fingerpricking using single-use lancets (Unistix Owen Mumford) and measured using a hand-held device (Accu-Check; Roche Diagnostics)(Reference Freckmann, Schmid and Baumstark48). Participants were requested to warm their hands before fingerpricking to increase blood flow. To extract the blood, the fingertips were gently massaged from the base of the hand, moving towards the tips to minimise plasma dilution.
Glycaemic response was calculated using the protocol described by Brouns et al. (Reference Brouns, Bjorck and Frayn49), which is in line with techniques recommended by the World Health Organization/Food and Agricultural Organization (1998).
MRI of gastric volumes
MRI was carried out on a research-dedicated 1.5 T Philips Achieva MRI scanner (Philips Healthcare). Participants lay in the supine/oblique position with a sixteen-element receiver coil wrapped around their abdomen. MRI scans were collected at baseline (t = 0 min), immediately post-consumption (t = 15 min) and at 30 min intervals until t = 135 min (Fig. 2).
Gastric volumes of the meal and after emptying were measured using a balanced turbo field echo sequence. A total of twenty-five axial slices (10 mm thick) were acquired within one breath-hold for 10 s. Gastric volume was manually measured by a single operator by tracing a region of interest around the meal within the stomach using an intensity-based region-growing algorithm developed in-house and summing the volume across slices(Reference Hoad, Parker and Hudders50). Half gastric emptying times (T50 %) were calculated for each individual and then averaged(Reference Marciani, Cox and Pritchard51).
Blood sampling and analysis of peptides
The sampling and assay protocols were similar to that used in a previous work(Reference Khalaf, Hoad and Menys52). Briefly: on arrival, a 20-G cannula (Intron Saety 3; B Braun Melsungen AG) was sited in a forearm vein of the participants to allow serial blood sampling. Blood samples were collected at baseline (t = 0), immediately after feeding (t = 15) and every 15 min thereafter until t = 135 min for plasma insulin, GLP-1, GIP and PYY. The initial 2 ml dead-space blood sample was discarded to avoid contamination with the saline flush, and a 6 ml experimental sample was then drawn into a vacutainer tube (K2E EDTA, BD, UK) containing 0·5 ml aprotinin (3–7 TIU/mg protein; A6279 Sigma Aldrich) added on the morning of the test. The cannula was flushed with 5 ml 0·9 % sodium chloride (BD PosiFlushTM SP). Blood samples were centrifuged for 10 min before storing them on ice. The plasma was immediately aspirated from the centrifuge tubes, divided into three aliquots, and stored in a freezer (–20°C) within 2 h of collection and transferred to another freezer (–80°C) at the end of MRI study until subsequent analysis. Plasma insulin and PYY concentrations were measured using RIA kits (Millipore). Total GLP-1 and GIP concentrations were each measured using a specific ELISA kit (both kits from EMD Millipore Corporation).
Appetite ratings
Subjective feelings of hunger, satisfaction, fullness, desire to eat and prospective food consumption ratings were assessed using paper-based 100-mm VAS(Reference Flint, Raben and Blundell53, Reference Blundell, De Graaf and Hulshof54). Each end of the line was anchored by statements expressing an extreme sensation. For example, ‘not hungry at all’ and ‘more hungry than have ever been’ (Supplementary Fig. S1). To avoid bias from previous answers, the participants were presented with a new VAS sheet at each time point, and this was removed immediately after completion. Every time they came out of the MRI room (Fig. 2), the participants were requested to make a vertical mark on each scale at the point that best matched how they felt at that time.
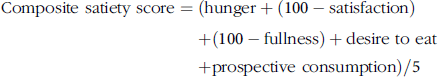
A composite satiety score was calculated for each individual at each time point, without adjusting for baseline data, using the formula:
 $${\rm{Composite\,\,satiety\ score}} = \left( {{\rm{hunger}} + \left( {100 - {\rm{satisfaction}}} \right) \hskip127pt+ \left( {100 - {\rm{fullness}}} \right) + {\rm{desire\,\,to\,\,eat}} \hskip117pt+ {\rm{prospective\,\,consumption}}} \right)/5$$
The range of composite satiety score was, therefore, between 0 and 100 with lower composite scores being in the ‘beneficial’ direction (low hunger, high fullness, low desire to eat) and higher composite scores being in the ‘non-beneficial’ direction (high hunger, low fullness, high desire to eat) in this context(Reference Stubbs, Hughes and Johnstone55, Reference Anderson, Catherine and Woodend56).
Ad libitum test meal
A pasta-based test meal of a large quantity was served at lunch time to assess ad libitum food intake(Reference Hussein, Hoad and Wright57). The ad libitum meal consisted of tomato and mozzarella pasta bake (Tesco). The nutritional composition indicated that it had 129 kcal/100 g, providing 5·5 g protein, 17·0 g carbohydrate, 3·6 g fat and 3·0 g fibre.
Three semi-fresh pasta bake packs (450 g each) were heated in a microwave (900 W) at full power for a total of 10 min and stirred at the end. Participants were given a single weighed portion of approximately 1300 g and 200 ml water. They were told that this portion was deliberately much larger than that normally consumed and to eat from the bowl until satisfied. They were also told to drink the water when they wanted, but they had to finish the entire amount of water. The amount of pasta left over was removed and weighed, and the energy intake was calculated from the amount consumed as an objective measure of food consumption(Reference Hussein, Hoad and Wright57).
Food diaries
Food diaries were given to the participants before discharge from the MRI unit. They were instructed to provide a detailed record of food and beverages consumed over the remainder of the day. They were required to include information such as portion sizes, product brand names and cooking and preparation methods. Furthermore, if the participants prepared composite dishes at home, they were requested to provide the recipe and portion size.
Nutritics software (Nutritics Ltd) was used to analyse the food intake based on information from food diaries. If not on the database, food items were added manually using information on nutrition labels, which was converted to database-equivalent values by the software. Recipes were added to the database, with adjustment made for water and nutrient loss during cooking.
Statistical analysis
Prism version 6.07 (GraphPad Software Inc.) was used to undertake descriptive and statistical analyses. All data are presented as mean values with their standard errors unless otherwise indicated. Data were assessed for normality using the Shapiro–Wilk test. Most data were normally distributed and were analysed using parametric methods; GLP-1, insulin and composite satiety data were non-normally distributed and were analysed using non-parametric methods.
The sample size was calculated using fingerprick glucose pilot data from the previous study on similar porridge breakfasts(Reference Alyami, Ladd and Pritchard42). Using a crossover, paired design it would be possible to detect a change of 27·4 mmol × min/l (or 33 %) in iAUC2h for blood glucose with α = 0·05 and a power of 80 % using n 26 participants. This change is of the same order of magnitude as that reported in a study comparing a rye v. an oat breakfast.
Values of iAUC for blood glucose, gastric volumes, gut hormones and appetite ratings were calculated using differences from baseline. Values were considered positive when they were greater than baseline values, and negative when they were less than baselines values. The area above or below baseline was calculated using the trapezoid rule(Reference Alhussain, Macdonald and Taylor58).
Comparisons of blood glucose, gastric volume, gut hormones, composite satiety score, intake of ad libitum test meal and self-reported daily energy intake between SOP and PMP were made using the Student’s paired t test (two-tailed).
Two-factor repeated-measure ANOVA (factor 1: meal, two levels; factor 2: time, ten levels) were used for blood glucose, gastric volumes, gut hormones and composite satiety score. When an interaction was identified, simple main effects were explored using pairwise comparisons for the different time points, and a one-way ANOVA for within each treatment. When no interaction was seen, the main effects were compared.
An exploratory investigation of correlation was undertaken between gastric volume and glycaemic and insulinaemic responses, gut hormones and appetite scores. Differences were considered significant at P < 0·05.
Results
In the present study, the effects of consumption of porridges (pearl millet and oats) on glycaemic, gastrointestinal (gastric volume), hormonal (insulin, GLP-1, GIP and PYY) and appetite responses were measured. The study procedures were well tolerated, and all twenty-six subjects completed the 2 study days. There were no adverse events during the study. The MRI scanner broke down (quenched) causing exclusion of three MRI data sets from analysis. Failure to sample bloods caused exclusion of four peptide data sets. The composition of products as served is given in Table 1. The behaviour of SDF under conditions of ethanol precipitation was markedly different for pearl millet and Scottish oats.
Glycaemic response
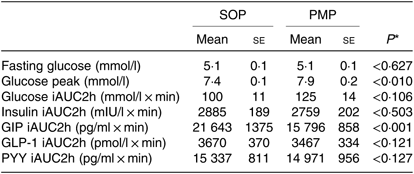
Fasting baseline glucose levels between study arms were not significantly different, as expected. The glucose level rose rapidly after feeding and declined towards baseline level at t = 135 min (Fig. 3). There was no significant difference between the meals in iAUC for glucose (paired t test, P > 0·05), which was the primary outcome of the present study (Table 2).
Plot of blood glucose values with time for healthy participants who consumed two different breakfast porridge test meals. ![]() , Scottish oats porridge;
, Scottish oats porridge; ![]() , pearl millet porridge. The arrow on the horizontal axis indicates meal start time. Values are means (n 26), with their standard errors represented by vertical bars.
, pearl millet porridge. The arrow on the horizontal axis indicates meal start time. Values are means (n 26), with their standard errors represented by vertical bars.

Glucose levels peaked at 7·9 (se 0·2) mmol/l for pearl millet and 7·4 (se 0·1) mmol/l for oats porridge, a modest but significant difference (paired t test, P < 0·05). The ANOVA showed a significant interaction between factors. Glucose levels were higher for PMP breakfast meal at t = 15 min and at t = 30 min (P < 0·05).
Appearance of gastric content and gastric volumes
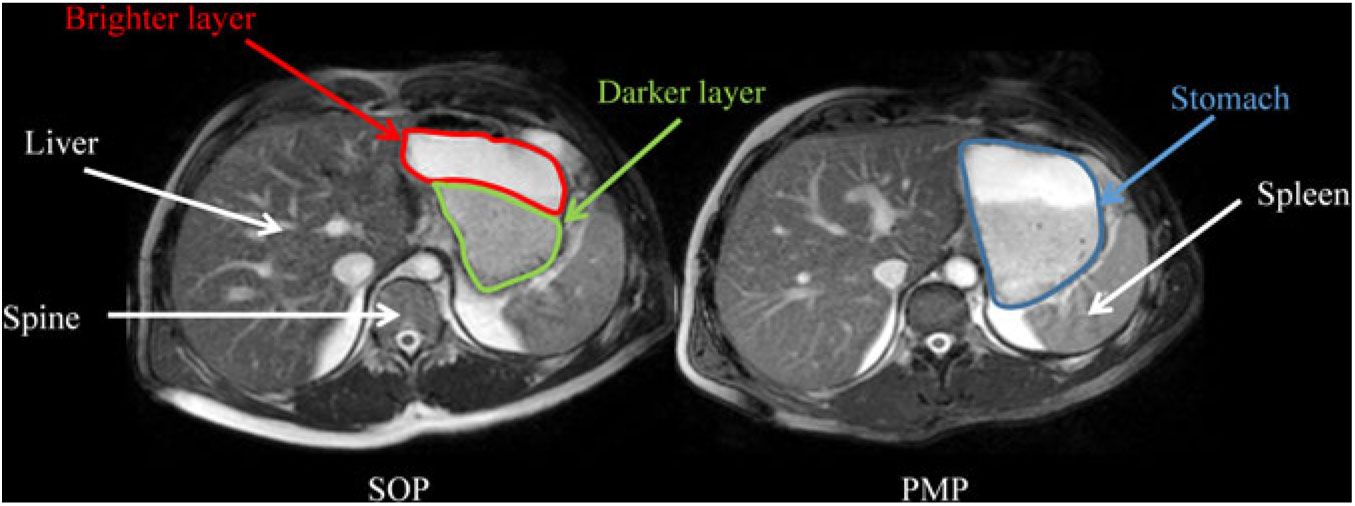
Fig. 4 shows the appearance of gastric content for SOP and PMP immediately after consumption (t = 15 min). Both porridges show clear layering (phase separation), with a brighter layer on top (consistent with a more liquid phase in this type of moderately T2-weighted images) and a darker layer at the bottom (consistent with thicker/particulate material in this type of moderately T2-weighted images). The two layers were present also at t = 45 min. However, at later time points (t = 75–135 min) the top layer was no longer visible.
Representative example of axial MRI images through the same location in the abdomen of a healthy participant who consumed Scottish oats porridge (SOP) or pearl millet porridge (PMP) on two different occasions. Images were taken at t = 15 min after feeding. Anatomical landmarks such as the liver, spine and spleen are indicated by white arrows, whereas the stomach is circled in blue on the panel on the right. Both porridges showed clear layering (phase separation), with a darker layer at the bottom of the stomach (circled in yellow on the panel on the left) and a brighter layer at the top of the stomach (circled in red on the panel on the left).
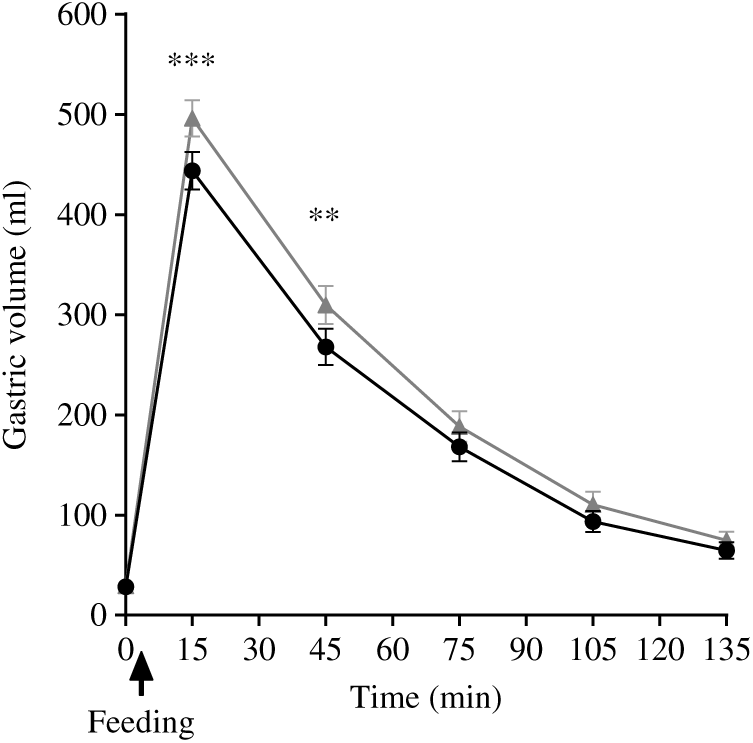
Gastric volumes at baseline (t = 0) for both meals were not significantly different, as expected. These rose immediately after feeding for both meals, and then the volumes declined with time (Fig. 5). The ANOVA showed a significant interaction between factors. Gastric volumes were higher for the PMP breakfast meal at t = 15 min and 45 min (P < 0·05). iAUC for gastric volumes was significantly different between the meals, although both meals were isovolumetric at ingestion (paired t test, P < 0·05). The PMP meal had larger gastric volumes compared with SOP (Table 3). T50 % of SOP and PMP were similar at 47 (sem 4) min and 47 (sem 3) min, respectively (paired t test, P > 0·05).
Plot of gastric volume with time for healthy participants who consumed two different breakfast porridge test meals. ![]() , Scottish oats porridge (SOP);
, Scottish oats porridge (SOP); ![]() , pearl millet porridge (PMP). The arrow on the horizontal axis indicates meal start time. Values are means (n 23), with their standard errors represented by vertical bars. There was a significant difference in gastric volume incremental AUC2h between the meals (paired t test, P < 0·05). Significant difference between SOP and PMP: ** P < 0·05, *** P = 0·002.
, pearl millet porridge (PMP). The arrow on the horizontal axis indicates meal start time. Values are means (n 23), with their standard errors represented by vertical bars. There was a significant difference in gastric volume incremental AUC2h between the meals (paired t test, P < 0·05). Significant difference between SOP and PMP: ** P < 0·05, *** P = 0·002.
Glucose, insulin, glucose-dependent insulinotropic polypeptide (GIP), glucagon-like peptide 1 (GLP-1) and peptide YY (PYY) concentrations measured from healthy participants who consumed two different breakfast porridge test meals (n 26 for blood glucose, n 22 for insulin, GIP, GLP-1 and PYY concentrations)
(Mean values with their standard errors)
SOP, Scottish oats porridge; PMP, pearl millet porridge; iAUC, incremental AUC.
* Paired t test of difference between SOP and PMP.
Blood peptides
Insulin
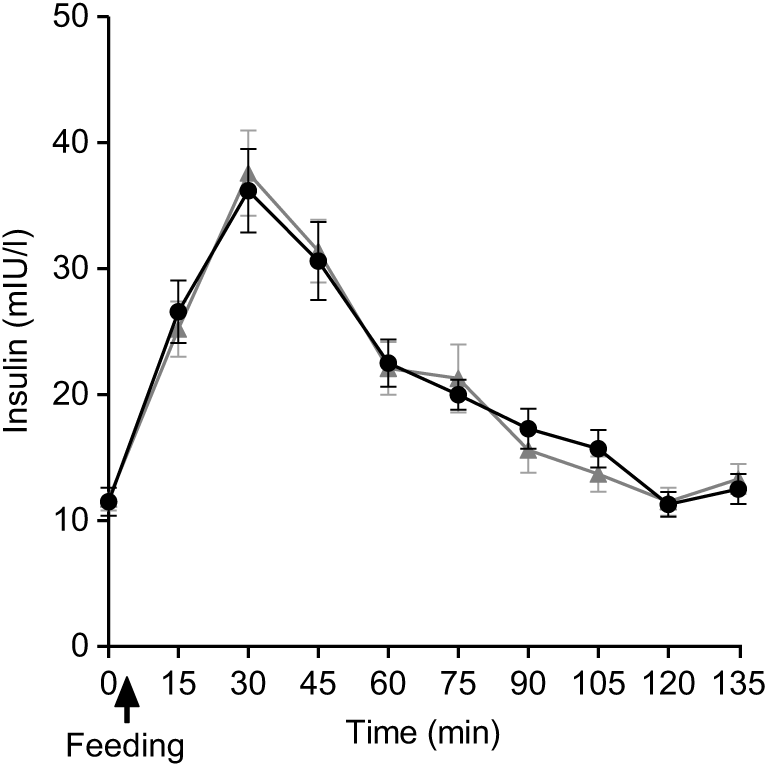
Plasma insulin concentrations increased markedly after both PMP and SOP up to t = 45 min and declined towards baseline at t = 120 min (Fig. 6). There were no significant differences either by iAUC or ANOVA for insulin concentration between PMP and SOP (P > 0·05).
Plot of plasma insulin concentrations with time for healthy participants who consumed two different breakfast porridge test meals. ![]() , Scottish oats porridge;
, Scottish oats porridge; ![]() , pearl millet porridge. The arrow on the horizontal axis indicates meal start time. Values are means (n 22), with their standard errors represented by vertical bars.
, pearl millet porridge. The arrow on the horizontal axis indicates meal start time. Values are means (n 22), with their standard errors represented by vertical bars.
Total glucagon-like peptide 1
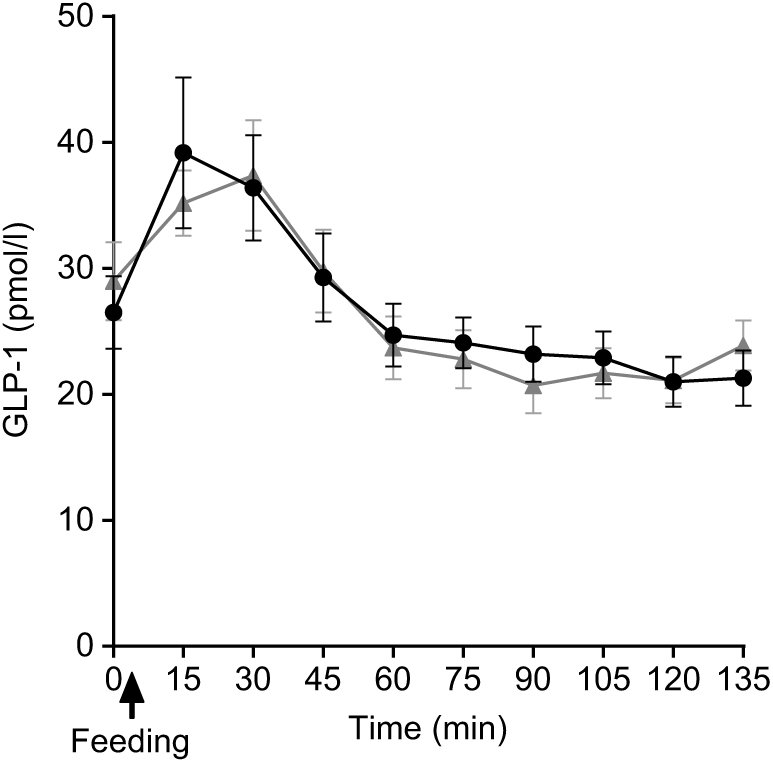
Plasma GLP-1 concentrations following SOP intake rose quickly at t = 15 min compared with PMP. Thereafter, at t = 30 min, the concentration declined to below the fasting value (Fig. 7). There were no significant differences either by iAUC or ANOVA between porridges for GLP-1 concentration between SOP and PMP (P > 0·05).
Plot of plasma glucagon-like peptide 1 (GLP-1) concentrations with time for healthy participants who consumed two different breakfast porridge test meals. ![]() , Scottish oats porridge;
, Scottish oats porridge; ![]() , pearl millet porridge. The arrow on the horizontal axis indicates meal start time. Values are means (n 22), with their standard errors represented by vertical bars.
, pearl millet porridge. The arrow on the horizontal axis indicates meal start time. Values are means (n 22), with their standard errors represented by vertical bars.
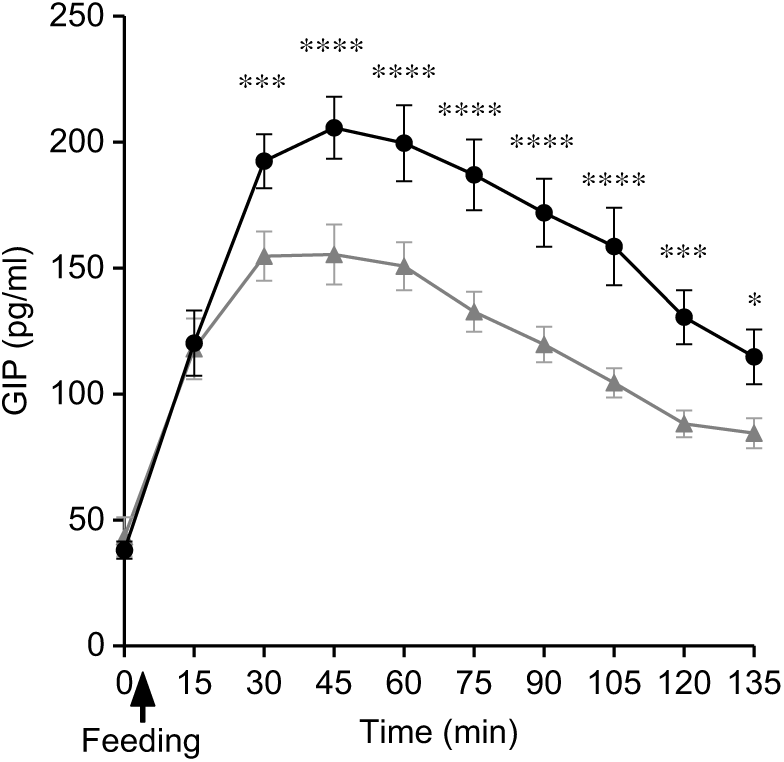
Total glucose-dependent insulinotropic polypeptide
Plasma GIP concentrations rose rapidly from baseline after feeding for both SOP and PMP. At t = 30, the two curves separated with the peak GIP for SOP, being 23 % higher than for PMP. GIP remained higher for SOP than for PMP throughout the remainder of the sampling period, the difference being significant (ANOVA, P < 0·05) (Fig. 8). Accordingly, there was a significant difference in iAUC2h for GIP concentration between the two breakfasts (paired t test, P < 0·05) with SOP being higher. The ANOVA showed a significant interaction between factors. GIP was lower for the PMP breakfast meal at all time points between t = 30 min and 135 min (P < 0·05).
Plot of plasma glucose-dependent insulinotropic polypeptide (GIP) concentrations with time for healthy participants who consumed two different breakfast porridge test meals. ![]() , Scottish oats porridge (SOP);
, Scottish oats porridge (SOP); ![]() , pearl millet porridge (PMP). The arrow on the horizontal axis indicates meal start time. Values are means (n 22), with their standard errors represented by vertical bars. There was a significant difference in GIP incremental AUC2h between the breakfast meals (paired t test, P < 0·05). Significant difference between SOP and PMP: * P < 0·05, *** P = 0·003), **** P = 0·0003.
, pearl millet porridge (PMP). The arrow on the horizontal axis indicates meal start time. Values are means (n 22), with their standard errors represented by vertical bars. There was a significant difference in GIP incremental AUC2h between the breakfast meals (paired t test, P < 0·05). Significant difference between SOP and PMP: * P < 0·05, *** P = 0·003), **** P = 0·0003.
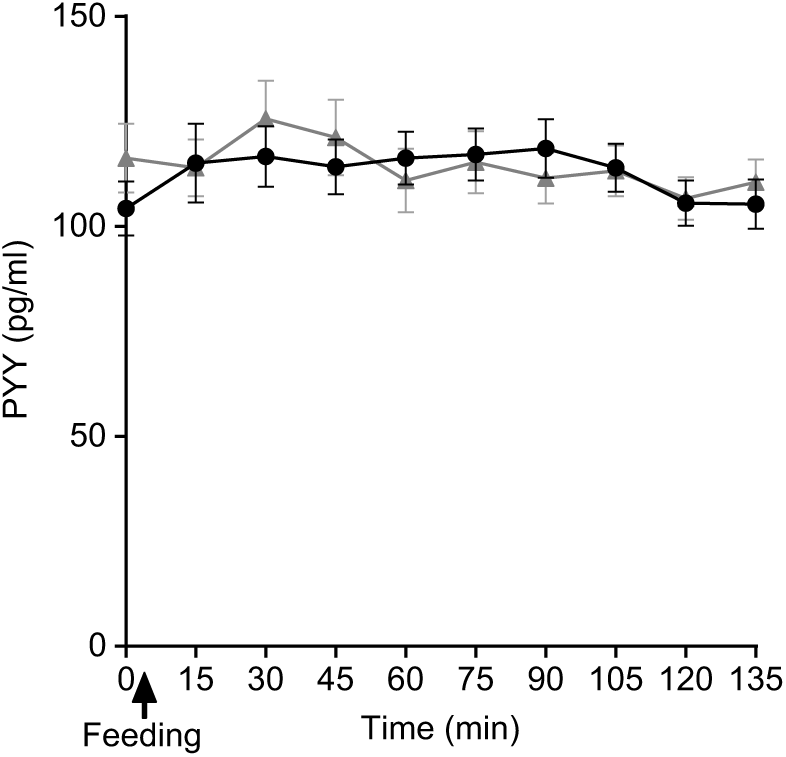
Peptide YY
Plasma PYY concentrations for SOP increased slightly from baseline upon feeding at t = 15 min and remained at the same level until t = 90 min, then dropped towards the baseline level (Fig. 9). Plasma PYY concentrations for PMP remained at the same level as baseline, until t = 30 min when the concentration increased rapidly, before returning to baseline values at t = 60 min. There were no significant differences either by iAUC or ANOVA for PYY concentration between SOP and PMP (P > 0·05).
Plot of plasma peptide YY (PYY) concentrations with time for healthy participants who consumed two different breakfast porridge test meals.
![]() , Scottish oats porridge;
, Scottish oats porridge; ![]() , pearl millet porridge. The arrow on the horizontal axis indicates meal start time. Values are means (n 22), with their standard errors represented by vertical bars.
, pearl millet porridge. The arrow on the horizontal axis indicates meal start time. Values are means (n 22), with their standard errors represented by vertical bars.
Appetite ratings
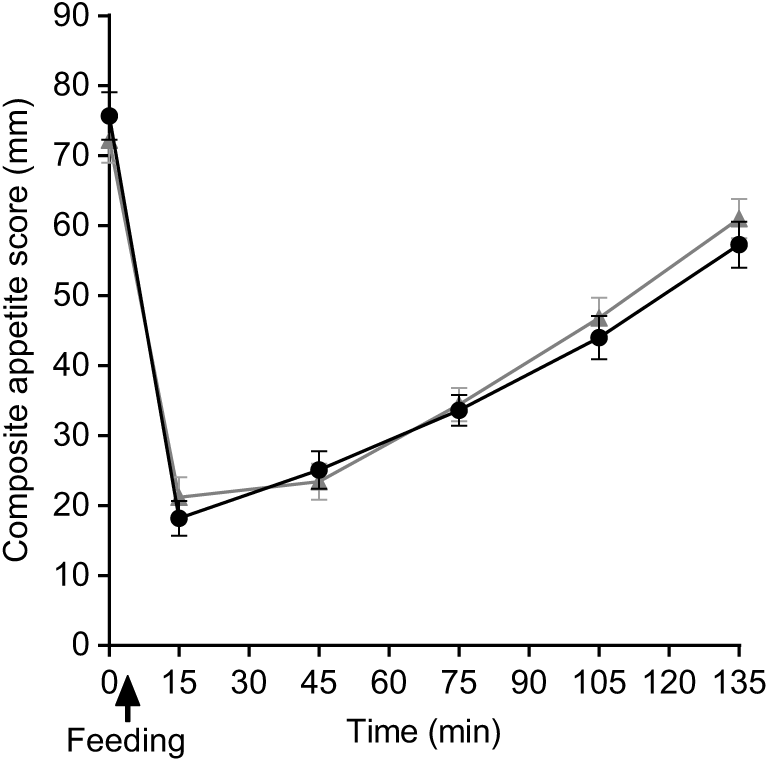
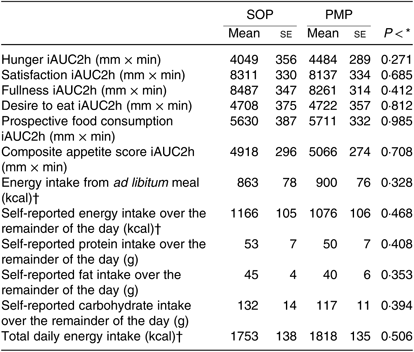
As predicted, the feelings of hunger, desire to eat and prospective food consumption all decreased from fasting baseline following the consumption of breakfast porridges and returned to baseline values 2 h later, whereas the feeling of fullness and satisfaction increased after feeding and returned to baseline values after 2 h. There were no significant differences either by iAUC or ANOVA between porridges for specific appetite ratings (P > 0·05). The composite satiety scores for both meals were not statistically different (Fig. 10) either by iAUC or ANOVA. iAUC for subjective appetite rating are summarised in Table 4. Data for hunger, fullness, satisfaction, desire to eat and prospective food consumption are shown in supplementary materials.
Plot of composite appetite score with time for healthy participants who consumed two different breakfast porridge test meals. ![]() , Scottish oats porridge;
, Scottish oats porridge; ![]() , pearl millet porridge. The arrow on the horizontal axis indicates meal start time. Values are means (n 26), with their standard errors represented by vertical bars.
, pearl millet porridge. The arrow on the horizontal axis indicates meal start time. Values are means (n 26), with their standard errors represented by vertical bars.
Postprandial gastric volumes measured by MRI in healthy participants who were fed two different breakfast porridge test meals (n 23)
(Mean values with their standard errors)
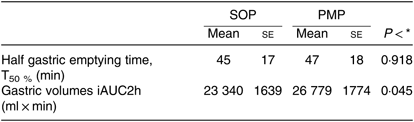
SOP, Scottish oats porridge; PMP, pearl millet porridge; iAUC, incremental AUC.
* Paired t test of difference between SOP and PMP.
Subjective appetite scores by question, energy intake from ad libitum meal and daily energy intakes from healthy participants who were fed two different breakfast porridge test meals (n 26 for appetite scores, energy intake from ad libitum meal and self-reported daily energy intakes)
(Mean values with their standard errors)
SOP, Scottish oats porridge; PMP, pearl millet porridge; iAUC, incremental AUC.
* Paired t test of difference between SOP and PMP.
† To convert kcal to kJ, multiply by 4·184.
Ad libitum test meal
There was no significant difference in energy intakes from ad libitum pasta bake meal following the consumption of PMP and SOP (paired t test, P > 0·05) (Table 4).
Food intake
The recorded food intake during the remainder of the day (Table 4) was not significantly different between the two arms of the study (P > 0·05). There were no significant differences in the self-reported percentage of total energy from carbohydrate, protein and fat following the two meals (paired t test, P > 0·05). The total daily energy intake, including the porridge breakfast, ad libitum pasta meal and recorded intake for the reminder of the day (Table 4), was again not significantly different (paired t test, P > 0·05).
Correlations
For PMP there was a significant correlation between gastric volume iAUC and iAUC for satisfaction (r 0·49, P = 0·03), fullness (r 0·48, P = 0·04) and desire to eat (r –0·54, P = 0·02). For SOP there was a significant correlation between gastric volume iAUC and iAUC for fullness (r 0·47, P = 0·04) and desire to eat (r –0·53, P = 0·02).
Discussion
The present study assessed the nutritional composition and glycaemic, gastrointestinal, hormonal and appetitive responses of isoenergetic and isovolumetric breakfast porridge meals made from novel pearl millet flakes compared with standard, commercial oat flakes. Oats were chosen as the comparator as these are a common breakfast grain with recognised health-promoting characteristics(Reference Butt, Tahir-Nadeem and Khan25, Reference Rebello, O’Neil and Greenway59, Reference Mackie, Bajka and Rigby60). Millet was chosen in this study as the intervention because of potential health benefits indicated by our previous work(Reference Alyami, Ladd and Pritchard42). Furthermore, the potential to exploit human consumption such as millet more fully in developed countries, and the broader context of resilience with respect to growing conditions may enable it to contribute potentially to improving food security and sustainability(Reference Dias-Martins, Pessanha and Pacheco35). The present study is the first randomised controlled trial of a PMP breakfast intervention.
The nutritional composition of the two porridges as served was established to ensure that the their energy content was identical. For fibre, the composition of two porridge preparations was markedly different; while the total DF content of both cereals was comparable, IDF in pearl millet was measured to be almost two times higher compared with Scottish oats. By contrast, the SDF content was measured to be higher in Scottish oats. The β-glucan content was in parallel with the SDF content, with the amount in pearl millet found to be approximately two times lower compared with Scottish oats. It is important to note that SDF under conditions of ethanol precipitation behaved differently for pearl millet and Scottish oats, which promotes the hypothesis that SDF in these two grains may be markedly different in terms of molecular weight, ratio of 1→3/1→4 linkages, as well as polymer structure, which reflects the distribution of 1→3/1→4 linkages within the polymer molecule. Future studies may include more elaborate analysis of β-glucan structure and that of other SDF components as well as IDF, which is a composite structure of plant cell walls containing cellulosic components as well as insoluble glucans and xylans and some soluble fibre trapped within the cellulosic matrix and hence not accessible to enzymes(Reference Gidley and Yakubov61).
No significant differences were seen in glycaemic responses between PMP and SOP either in terms of capillary blood glucose or insulin response. Glycaemic response is influenced by many factors; however, in the present study there were similar glucose and insulin iAUC responses between PMP and SOP. Pearl millet showed a higher glucose peak value compared with oats, although the difference was modest. Considering that the two meals were well matched for energy and volume and that most of the other responses were very similar, one could speculate that the smaller particle size of PMP flakes compared with SOP flakes may have offered an increased surface area for digestion(Reference Tosh and Chu28, Reference Mackie, Bajka and Rigby60). Other factors, such as total fibre content, were fairly similar; however, the grains contained different types of fibre, potentially explaining the slightly different physiological response(Reference Brand-Miller, Stockmann and Atkinson62, Reference Granfeldt, Hagander and Björck63). The macronutrient composition of both meals was comparable (Table 1). Glycaemic response after the consumption of oats is in agreement with many studies that have shown similar peak blood glucose value about 7 mmol/l(Reference Gonzalez and Stevenson37), which is also in agreement with our pilot studies. To our knowledge these are the first human data on glycaemic response after ingestion of pearl millet flakes(Reference Lee, Durst and Wrolstad47).
The gastric appearance of both meals was similar with two separated layers being apparent immediately after feeding. The layers comprised an upper liquid phase and a lower solid/viscous phase that could be seen in the stomach. An hour later, the liquid phase was no longer visible for both meals, suggesting that gastric sieving promoted the emptying of the liquid component in the stomach contents(Reference Marciani, Cox and Pritchard51). These results with flakes are similar to those reported by Mackie et al. (Reference Mackie, Bajka and Rigby60). Half gastric emptying times were also similar for SOP and PMP. This could well relate to the isoenergetic nature of both meals, as energy content may drive gastric emptying to a greater extent compared with volume(Reference Kwiatek, Menne and Steingoetter64, Reference Calbet and MacLean65).
Although both meals were isoenergetic and isovolumetric, iAUC for gastric volumes was significantly higher for PMP than SOP. This is counterintuitive because the total meal volume was matched by requiring the participants to consume more water with PMP because the cooked volume of the isoenergetic PMP product was smaller. Water was not blended into the cooked porridge because of the desire to keep a more ecological validity. The participants were provided with a glass of water to drink with a meal. Blending would have also required additional stirring with possible changes in the food matrix. The additional water volume could be expected to sieve rapidly from the stomach, but this would have resulted in lower volumes for PMP. Larger gastric volumes after PMP ingestion could be due to the characteristics of the meal. It may also be possible that PMP flakes underwent further absorption of water in the gastric lumen, thus causing some additional swelling of PMP volume, though it was not possible to dissect this from MRI images. An alternative hypothesis could be put forward that the presence of IDF in PMP might stimulate (mechanically) the gastric wall, resulting in an increased release of mucus, which can increase the meal’s gastric volume(Reference Meldrum, Yakubov and Gartaula66). The gastric volume results are in keeping with the previous pilot study, which showed a significant difference in gastric volume between different porridges(Reference Alyami, Ladd and Pritchard42). The reasons for this remain to be understood. Increased wall stretch and tension is known to result in increased feeling of fullness(Reference Marciani, Gowland and Spiller67), which correlates with gastric volumes(Reference Marciani, Cox and Pritchard51) and reduces short-term food intake. Positive significant correlations were found here between gastric volumes and appetite ratings.
Plasma GLP-1 and PYY concentrations were measured due to their direct physiological effect on gastric emptying and appetite(Reference Moran, Leslie and McLaughlin44–Reference Huda, Wilding and Pinkney46). However, we were not able to measure other hormones such as CCK, active form of GLP-1 or active form of GIP, which may also have effects on gastric emptying and appetite.
GLP-1 is an incretin hormone released from L cells located in both the small and large intestines in response to food intake(Reference Steinert, Feinle-Bisset and Asarian45). Plasma GLP-1 levels are at their lowest in fasting state (after overnight fast). Plasma levels rise rapidly during meals and usually remain above baseline (morning levels) between meals(Reference Steinert, Feinle-Bisset and Asarian45, Reference Khalaf, Hoad and Menys52). PYY is also secreted from L cells(Reference Moran, Leslie and McLaughlin44). It inhibits gastric motility and increases water and electrolyte absorption in the colon. It has been shown to reduce appetite(Reference Moran, Leslie and McLaughlin44). In the present study, GLP-1 responses were consistent with plasma insulin concentrations, which were comparable following both meals. PYY was not significantly different between the two meals.
Differences in GIP responses between meals were instead marked, with GIP being significantly lower after pearl millet consumption compared with oats. GIP is secreted from intestinal K-cells(Reference Baggio and Drucker68) in response to the absorption of glucose and fat. More specifically, GIP release is stimulated by the rate of nutrient absorption rather than the presence of nutrients in the intestine(Reference Baggio and Drucker68). The primary role of GIP is that of an incretin hormone, in that it binds to its specific receptor on pancreatic β-cells and enhances glucose-dependent insulin secretion(Reference Baggio and Drucker68). Although some studies reported that plasma GIP profiles are consistent with insulin profiles, we found that GIP profiles behaved differently in the present study. Insulin concentrations were comparable between meals; however, GIP was significantly different between meals. GIP in combination with hyperinsulinaemia and hyperglycaemia has been shown to promote TAG absorption in adipose tissue(Reference Asmar, Simonsen and Madsbad69), with high plasma levels of GIP associated with unhealthy body fat distribution(Reference Moller, Vistisen and Faerch70). A lower GIP response from PMP meal may, therefore, suggest an added health benefit if taken on a regular basis, although further studies would be needed to confirm this.
Subjective appetite responses, ad libitum pasta meal intake and food intake for the reminder of the day were similar. Therefore, the two porridges had similar effects on appetite and satiety in this acute test day setting.
The strengths of the study included a direct analysis of porridge meals as served, after carefully controlling for differences in their manufacturing processes. Both grain flakes were cooked identically and in plain water, as different cooking methods may have an effect on the degree of starch gelatinisation(Reference Yiu, Weisz and Wood71, Reference Nayak, Berrios and Tang72) and also to avoid macronutrient confounders from added milk or jam. The exploration of pre- and post-absorptive variables, subsequent appetitive perceptions and behaviours presented here is unique in relation to the study of millet. It is worth noting that the structure of β-glucan is poorly characterised in pearl millet, though some of its properties are similar to those of sorghum(Reference Agu and Palmer73). Therefore, the mass content of β-glucan alone may not reflect fully its functional role. The health benefits of millets can be related also to the nature and characteristics of their starches, proteins and lipids(Reference Annor, Tyl and Marcone74).
Although the participants were having different body masses, and hence would have had varied energy requirements, the test meal portion given was the same for all participants, leading to a higher proportion of total energy intake than needed for some. This may have reduced the potential for differences in energy intake at lunch in participants with a lower energy requirement. Matching for energy, rather than other micronutrients, meant that slight differences in, for example, fat composition may have confounded the results. However, this was felt to be the most clinically relevant approach.
In conclusion, this trial has investigated, for the first time to our knowledge, the glycaemic, gastrointestinal, hormonal and appetite responses of a PMP breakfast intervention compared with a common oats porridge. PMP elicited glycaemic, insulinaemic, GLP-1, PYY and appetite responses comparable to a known breakfast grain with recognised health-promoting characteristics. In addition, PMP had a larger iAUC for gastric volume and a lower GIP responses compared with SOP. Pearl millet could, therefore, represent an alternative breakfast food with similar beneficial effects to those of oats and also sustainable and resilient agricultural credentials.
Acknowledgements
We are grateful for support from the Nottingham Digestive Diseases Centre and National Institute for Health Research (NIHR) Nottingham Biomedical Research Centre. We also thank Sara Brown and Liz Simpson from the David Greenfield Human Physiology Unit in Nottingham for their valuable help with setting up the blood glucose sampling. We are also grateful to Unilever for providing the novel pearl millet flakes under a Material Transfer Agreement with the University of Nottingham.
The study was supported by a research grant from the Department of Diagnostic Radiology, Faculty of Applied Medical Science, King Abdulaziz University, Jeddah, Saudi Arabia.
The authors’ responsibilities were as follows: J. A., M. A. T., H. F. J. B. and L. M. designed the study with contribution from R. C. S. on gastroenterology, P. A. G. on imaging, I. A. M. on metabolic physiology, G. E. Y. on DF analysis and G. P. A. on liver metabolism. C. L. H. set up MRI sequences and analysis. J. A., E. W. and S. E. P. ran the study days and collected and analysed data. K. H. and E. B. collected blood samples. S. M. C. carried out plasma assays. G. E. Y. performed DF and β-glucan analysis, J. A. drafted the manuscript. All authors read and approved the final manuscript.
H. F. J. B. was the lead investigator on a research grant on pearl millet funded by the Newton Fund/Innovate UK. The remaining authors declare that they have no conflicts of interest.
Supplementary material
For supplementary material referred to in this article, please visit https://doi.org/10.1017/S0007114519001880


