


Introduction
Erosion and sediment supply in forested mountain headwaters tend to be highly episodic at a range of temporal scales (Kirchner et al., Reference Kirchner, Finkel, Riebe, Granger, Clayton, King and Megahan2001). This episodicity, combined with temporal fluctuations to fluvial transport capacity, often results in sediment storage over varying time scales in valley-bottom landforms, typically in floodplains, alluvial terraces, and alluvial fans. Temporal variability in erosion and sediment storage can result from such drivers as climatic fluctuations (Ballantyne and Whittington, Reference Ballantyne and Whittington1999; Litchfield and Berryman, Reference Litchfield and Berryman2005), landslide dams (Scherler et al., Reference Scherler, Lamb, Rhodes and Avouac2016; Fan et al., Reference Fan, Dufresne, Subramanian, Strom, Hermanns, Stefanelli and Hewitt2020), wildfire (Moody, Reference Moody2017; Brogan et al., Reference Brogan, Nelson and MacDonald2019), mining (Gilbert, Reference Gilbert1917), mill dams (Walter and Merritts, Reference Walter and Merritts2008), and agriculture (Trimble, Reference Trimble1981; Reusser et al., Reference Reusser, Bierman and Rood2015; Wistuba et al., Reference Wistuba, Sady and Poręba2018). Because sediment deposition and storage, and subsequent excavation and entrainment by streamflow, tend to be asynchronous, sediment storage elements can effectively temporally decouple upland sediment mobilization from downstream sediment yield (Trimble, Reference Trimble1981) to such an extent that fluvial erosion of stored valley-bottom sediments can dominate basin sediment yields (Walter and Merritts, Reference Walter and Merritts2008; Donovan et al., Reference Donovan, Miller, Baker and Gellis2015). Depending on the drivers of fluctuation in sediment supply and transport capacity, sediment storage in low-order valley bottoms can fluctuate about a long-term average condition (Pierce et al., Reference Pierce, Meyer and Rittenour2011), or be progressively depleted, for example post-glaciation (Church and Slaymaker, Reference Church and Slaymaker1989; Tunnicliffe and Church, Reference Tunnicliffe and Church2011; Scott and Collins, Reference Scott and Collins2021), subsequent to co-seismic landsliding (Croissant et al., Reference Croissant, Steer, Lague, Davy, Jeandet and Hilton2019), wildfire effects on landsliding (Benda and Dunne, Reference Benda and Dunne1997) or surface erosion (Moody and Martin, Reference Moody and Martin2001), or an anthropogenic erosional and depositional event (Fryirs and Brierly, Reference Fryirs and Brierley1999; Donovan et al., Reference Donovan, Miller, Baker and Gellis2015).
In China’s Yangtze basin (Fig. 1A), comparison of erosion surveys with suspended sediment records (Wang et al., Reference Wang, Li and He2007) indicates the basin-scale importance of storage of eroded sediments, with 76% of sediment eroded from the upper Yangtze River basin stored in tributaries. Analysis of 38,000 Himalayan valley fills documents millennial lag times between erosion and sediment supply (Blöthe and Korup, Reference Blöthe and Korup2013). However, in smaller Himalayan headwater drainages, neither the time scales nor sources of sediment storage are well understood.
(A) Study area location in the Yangtze River basin. (B) Location of the upper Baiwu River catchment in the Yanyuan Basin, a tributary to the Yalong River. Lakes Erhai, Lugu, and Shayema are locations of paleoclimate data discussed in the text. (C) Upper Baiwu River basin, including the river valley in the lower basin (Figure 2) where valley-bottom stratigraphy and geochronology observations are concentrated.

Human land uses have contributed to the Yangtze’s sediment yield for at least two millennia (Wang et al., Reference Wang, Li, Zhang, Zhuang, Liu, Saito, Xie and Zhao2011); this contribution has increased in the last half century according to sediment-yield studies (Higgit and Lu, Reference Higgitt, Lu, Walling and Webb1996; Lu and Higgit, Reference Lu and Higgitt1999; Zhang and Wen, Reference Zhang and Wen2004) and comparison of contemporary sediment yields to long-term measures of sediment generation based on isotopic measurements of in situ 10Be in river sediments (Schmidt et al., Reference Schmidt, Sosa Gonzalez, Bierman, Neilson and Rood2018). Downstream sedimentation in the Yangtze has been attributed to erosion from headwater land uses and has led to far-reaching, restrictive land use policies (Blaikie and Muldavin, Reference Blaikie and Muldavin2004). The need to inform land use policies and to monitor their effects on downstream sediment yield motivates study of the erosional sources of sediment and the extent and time scale at which storage of that sediment might temporally decouple erosion from sediment yield.
In a reconnaissance-level field study of a 30.5-km2 basin tributary to the Yangtze River in SW Sichuan (Fig. 1), we use the valley bottom sediment archive to infer the basin’s Holocene and recent depositional and erosional history, and to address three questions. (1) What are the sediment storage reservoirs, and their characteristic sediment residence times and temporal patterns of filling and emptying? (2) In context of an understanding of the last 300 years of land use, which was developed in a companion study of land use history and forest productivity in the same basin (Trac et al., Reference Trac, Harrell, Hinckley and Henck2007; Urgenson et al., Reference Urgenson, Hagmann, Henck, Harrell, Hinckley, Shepler, Grub and Chi2010; Hinckley et al., Reference Hinckley, Chi, Hagmann, Harrell, Schmidt, Urgenson and Zeng2013; Harrell et al., Reference Harrell, Schmidt, Collins, Hagmann, Hinckley, Miller, Davis, Lander and Lee2022), what is the role of anthropogenic erosion in the basin’s sediment budget? (3) What inferences can be drawn from the sediment archive about regional Holocene drivers of fluctuations in sediment supply and transport capacity?
We find that sediment eroded by anthropogenic and natural influences is stored in terraces for 101-102 years and alluvial fans for 102–104 years and that the periodic emptying and filling of these sediment-storage reservoirs is important in decoupling hillslope erosion from downstream sediment yield, a finding relevant to understanding the relation between hillslope erosion and sedimentation in low-order headwaters in the Yangtze River basin and more generally.
Study area
The 30.5-km2 upper Baiwu catchment is in Yanyuan County, Liangshan Yi Autonomous Prefecture at elevations of 2500–3800 m (Fig. 1C). Hillslope gradients are generally 20–30° with some steeper slopes (30–40°) in the upper NW basin. The Baiwu River is a third-order stream that flows in a valley, 50–200 m wide and about 5 river kilometers (rkm) long, known locally as Apiladda (Fig. 1C). We intensively studied the downstream-most 3-rkm reach of Apiladda (Fig. 2). While the valley 1 km downstream of our study reach, extending to a confluence with a larger stream near the town of Baiwu (Fig. 1C), is densely farmed and inhabited, the reach we studied contains only a few houses and has a braided channel with natural banks and a bankfull width of 20–25 m. The gradient in our 3-rkm intensive study reach increases from 0.01 to 0.02 over the first 2 rkm to 0.04 in the next 1.5 rkm. Peak flows are during the summer monsoon. The river drains to the Yanyuan Basin and then in a circuitous, clockwise path to the Yalong River (Fig. 1B).
Landforms, sample locations, and field-measured cross sections in Apiladda, the local name for the valley bottom in the lower catchment (Figure 1C). Landforms were mapped from topographic survey, GPS, and interpretation of 2011 Quickbird imagery, which provides the background imagery. Linear features visible on hillslopes are bare-soil chutes eroded by gravity transport of wood from upslope manual tree cutting.

The Triassic bedrock (Burchfiel and Chen, Reference Burchfiel and Chen2012) in our field observations is mostly fine-grained sandstone and siltstone with limestone dominating the northeastern sub-catchment. The study area is about 80 km west of the Anninghe and Zemuhe faults which, along with the Xianshuihe and Xiaojiang faults, form a NNW–SSE-trending left-lateral strike-slip fault system having a total length of over 1100 km and the most frequent seismicity in continental China (Allen et al., Reference Allen, Zhuoli, Hong, Wen, Xueze and Weishi1991; Wen et al., Reference Wen, Ma, Xu and He2008). About 140 km to the east of the study area is the Jinshajiang Fault Zone, which, with the Honghe (Red River) Fault to the south, forms a major, regional NW–SE-trending right-lateral fault system. The study basin itself is transected by a mapped N–S-trending fault (Burchfiel and Chen, Reference Burchfiel and Chen2012) with unknown activity. Mapping in Zhou et al. (Reference Zhou, Lijun, Zhao, Wang, Zheng, Ehlers, Gibbard and Hughes2011, Fig. 70.2) shows that during the most extensive Quaternary glaciation there were a few glaciers about 50 km north and west of the study basin and on a few peaks several tens of kilometers to the east (Cui et al., Reference Cui, Xie and Li1986) and southeast, but not in our study basin, and we observed no field evidence for glaciation.
Mean annual precipitation was 820 mm/yr during 1951–2007 (Yatagai et al., Reference Yatagai, Kamiguchi, Arakawa, Hamada, Yasutomi and Kitoh2012) and is dominated by the South Indian Monsoon, with 80% of annual precipitation falling during June–September. Pollen evidence from Lake Shayema, 130 km NE of the study area (Fig. 1B), indicates a strengthened monsoon in the Early Holocene, weakening to conditions similar to today during 8 ka to 4 ka BP (Jarvis, Reference Jarvis1993). Lugu Lake, 65 km west of our study area (Fig. 1B), has the nearest record of fluctuations to monsoon strength over the last few millennia. There, grain size and carbon/nitrogen ratio in a core from the last 2900 years indicate a relatively dry climate during 750–1167 CE and 1733 CE to present, with relatively wet intervals during 898 BCE–750 CE and 1167–1733 CE (Sheng et al., Reference Sheng, Yu, Xu, Lan, Liu and Che2015), a finding consistent with chironomid assemblages from Lugu Lake that indicate increased erosion, interpreted as increased precipitation, during 250–850 CE (Chang et al., Reference Chang, Zhang, Liu, Sun, Langdon and Shulmeister2018). A multi-proxy study of a 3500-yr core at Lake Erhai, 240 km SW of our study area (Fig. 1B), indicates dry climate during 750–1200 CE and cold, wet climate during 1450–1850 CE (Xu et al., Reference Xu, Zhou, Lan, Liu, Sheng, Yu and Cheng2015). Lake varves in Lake Xinluhai, 510 km to the NW (Chu et al., Reference Chu, Sun, Yang, Li, Yu, Xu and Yan2011), and tree rings, 490 km to the NNE (Xu et al., Reference Xu, Hong and Hong2012), also indicate a drier period since around 1850 CE. Together, the cores from Lugu and Erhai lakes indicate two relatively dry and two relatively wet periods in the last 3ka: (1) wet from 900 BCE to 750 CE or 850 CE; (2) dry from 750 CE or 850 CE to 1170 CE or 1200 CE; (3) wet from 1170 CE or 1200 CE to 1730 CE or 1850 CE; and (4) dry from 1730 CE or 1850 CE to the present.
Forests in the upper Baiwu River catchment are within the Pinus yunnanensis–sclerophyllous broadleaf forest zone (Jarvis and Liu, Reference Jarvis and Liu1993). South-facing hillsides and ridgetops are dominated by Yunnan pine (Pinus yunnanensis) and north-facing hillsides by mixed conifer–broadleaf evergreen and deciduous forests that include alder (Alnus spp.), rhododendron (Rhododendron spp.), oak (Quercus spp.), and Chinese white pine (Pinus armandii) (Jarvis and Liu, Reference Jarvis and Liu1993; Urgenson et al., Reference Urgenson, Hagmann, Henck, Harrell, Hinckley, Shepler, Grub and Chi2010).
Evidence for the earliest anthropogenic influence in the region is limited. At Lake Shayema, 130 km NE of the study basin (Fig. 1B), pollen of disturbance taxa and economic plants become evident, and sedimentation increases, ca. 1000 CE. These changes are attributed to swidden agriculture (Jarvis, Reference Jarvis1993). The diatom record at Lugu Lake, 65 km to the west, indicates intensified anthropogenic disturbance in that catchment about 1450 CE (Wang et al., Reference Wang, Yang, Anderson and Dong2016). In our study area, histories collected by Harrell suggest that prior to 1750, the valley floor was farmed by the original Prmi ethnic group inhabitants of the area and perhaps by Han Chinese farmers. Nuosu people began migrating to the area around 1750. The Nuosu practiced swidden agriculture on the ridgetops and gentle south- and southwest-facing hillslopes. As recalled by elders who practiced the swidden method, they would cut an area of forest, burn the residue to fertilize the fields, and plant buckwheat the first year. The second year, they would typically plant oats, and the third year, potatoes. After this they would allow forest to regrow for seven or eight years before repeating the cycle (Harrell et al., Reference Harrell, Schmidt, Collins, Hagmann, Hinckley, Miller, Davis, Lander and Lee2022, p. 168–169). They also kept sheep and goats for food and fiber, cattle for traction and meat, and pigs for food and fertilizer; animals were pastured in river valleys, on uncultivated slopes, and on fields in the off-season. Nuosu also made use of forest resources, cutting branches and small trees for firewood, logging pines for construction, gathering food and medicinal fungi and plants, and hunting wild game in the agricultural slack season. Homesteads were scattered on the hillsides, with a few related nuclear families living in one spot (Harrell et al., Reference Harrell, Schmidt, Collins, Hagmann, Hinckley, Miller, Davis, Lander and Lee2022).
Between 1900 and 1957, many homesteads remained scattered on the hillsides, while other families, particularly in the upper catchment above the village of Gangou (Fig. 1C) moved to the benchlands and the alluvial plains downstream of the study basin and practiced the same kinds of intensive cultivation long practiced by other ethnic groups in the region. Swiddened area likely decreased during this time, especially in the upstream, higher-elevation areas in the northern part of the catchment. Beginning in 1957, PRC policies led to forests being cut to fuel tile and lime kilns, swiddens were no longer allowed to go fallow but began to be farmed continuously, and the formerly scattered inhabitants of the upper valley were moved into new nucleated villages of Yangjuan and Pianshui (Fig. 1C), concentrating their dispersed forest resource use into areas close to the village. Between 1956 and 2011 the human population grew from about 300 to 1000 (Harrell, field notes from 2000 and 2001; local household registers). Cultivation was stopped on the former swiddens in the 1980s and has not resumed. Further deforestation occurred in the early 1970s during the ‘Grain as a Key Link’ policy. While forest cover increased overall from 1961 (year of the earliest imagery we accessed) through 2011 (year of satellite imagery we obtained for this study), former swiddens in the lower watershed generally remained unforested or sparsely forested (Supplement 1). Our analysis of declassified CORONA imagery from 1961, 1967, 1968, and 1979 (USGS, 2023) combined with field-mapping of formerly stream-side alder stumps in the upper part of our study reach shows riparian forests along the alluvial floor of Apiladda were cut gradually between 1965 and 1986, and the river changed from a forest-lined, anastomosed channel to a braided one with almost no riparian forest beginning in the 1970s. Since 2011, parts of the alluvial valley floor have been farmed, mostly with hybrid corn for sales and with buckwheat, and since 2009 poplar and walnut plantations have been established on some alluvial terraces to stabilize streambanks.
Methods
We visited the basin for several days in November 2009, June 2010 and August 2015. To map and interpret valley-bottom landforms, we used a hand-held GPS, augmented with interpretation of 60-cm-resolution, 2011 Quickbird imagery, and we field-surveyed topographic profiles with a hand level, stadia rod, and tape. We described the sedimentology and stratigraphy of valley-bottom sediments and collected samples for age dating at locations along the valley (Fig. 2), primarily where sediments were exposed by streambanks along floodplains, terraces, and alluvial fans (Fig. 3).
Landforms in Apillada. (A) View upstream of Big Tree Terrace, Old Fan, and Cottonwood Fan in November 2009. (B) Old Fan in August 2009. (C) Bee Tree Terrace and Bee Tree, November 2009. (D) View upstream of Big Tree Terrace and Cottonwood Terrace in August 2015.

Ethnohistory
Our work in the Upper Baiwu catchment began as part of a collaboration between local Nuosu communities and Chinese and foreign outsiders to build and maintain an elementary school. As part of this involvement, we wanted to learn about the history and livelihood of the local people. Harrell is an environmental anthropologist who speaks Chinese and Nuosu and has been conducting ethnographic research in Nuosu and other ethnic minority communities in southwest China since 1988 (Harrell, Reference Harrell2001). Along with Chinese and American associates, he conducted ethnohistory interviews with five elders known to be most knowledgeable about their local history and ecology and with one prominent scholar born and raised in the community. They also asked questions of many people as parts of casual conversations, went on guided walks with elders and other community members in the Apiladda valley and the surrounding hills, and made an educational video about local ecological history. We conducted interviews and inquiries in both the Chinese and Nuosu languages. In the course of our learning about local history and livelihood, we discovered questions about the history of change to the ecology and physical landscape that could be answered only by formal quantitative studies such as those reported here. Specifically, one question that stood out for geomorphologists Collins and Schmidt concerned anthropogenic erosion and sediment delivery, and their effects on the area’s soils, vegetation, and streams.
Geochronology
We used several dating methods to characterize the age of sediment deposition. For radiocarbon analysis we sampled detrital charcoal (40 dates), in-situ stumps (two dates), and detrital wood (three dates), bark (two dates) and twigs (two dates) collected from valley-bottom sediments; of these, two dates were determined radiometrically, and the remaining by AMS (Tables 1 and 2). We calibrated radiocarbon ages to calendar years using CALIB rev. 8 (Stuiver and Reimer, Reference Stuiver and Reimer1993) using the ‘IntCal20’ dataset (Reimer et al., Reference Reimer, Austin, Bard, Bayliss, Blackwell, Bronk Ramsey and Butzin2020) and report the median age to facilitate comparing ages of different locations. Detrital organic material in fluvial settings can have inherited ages from being subjected to repeated floodplain burial and remobilization. Detrital wood, which can be retained in stream systems for up to several thousand years (Hyatt and Naiman, Reference Hyatt and Naiman2001; Guyette et al., Reference Guyette, Cole, Dey and Muzika2002; Montgomery and Abbe, Reference Montgomery and Abbe2006; Guyette et al., Reference Guyette, Dey and Stambaugh2008), is particularly subject to this problem. Ages from detrital charcoal can also substantially overestimate deposition ages (Blong and Gillespie, Reference Blong and Gillespie1978). Frueh and Lancaster (Reference Frueh and Lancaster2014) found in a small catchment in coastal Oregon that correcting for inherited age reduced mean ages of fluvial and debris-flow deposits by 30%. Two of our radiocarbon ages are from stumps, which, unlike detrital materials, are not subject to the inherited age problem, but nonetheless can involve uncertainty about the timing of tree death and burial.
Radiocarbon dates of charcoal and wood samples from alluvial fans. Calibrated ages are from CALIB rev. 8.2 (Stuiver and Reimer, Reference Stuiver and Reimer1993).

a W = detrital wood; B = detrital bark; S = growth-position stump; C = detrital charcoal.
b Date from Oxcal using IntCal 20.
Radiocarbon dates of charcoal and wood samples from terraces and one floodplain. Calibrated ages are from CALIB rev. 8.2 (Stuiver and Reimer, Reference Stuiver and Reimer1993).

a W = detrital wood; B = detrital bark; S = small-diameter stick; ST = growth-position stump; C = detrital charcoal.
b T = alluvial terrace; LT = low alluvial terrace; FP = floodplain.
c Radiometric dates; all others AMS.
d Growth-position stump, 5-cm in diameter, protruding from cohesive gleyed clay layer exposed in streambed; depth is taken as depth to top of cohesive gleyed clay layer exposed in streambank at Cottonwood sampling site, 50 m downstream.
e Dates from Oxcal using IntCal 20.
We sampled sediments in 2009 at 11 locations to determine the timing of sediment deposition using optically stimulated luminescence (OSL) dating and submitted six of these samples for dating (Table 3). Sample depths ranged from 14 to 100 cm; we saw no evidence of bioturbation in any of our samples. We sampled sediment in PVC pipes, enclosed the pipes in black plastic, and sealed them with dark tape. Sediments were dated at the University of Washington Luminescence Lab using a modified single aliquot regenerative dose (SAR) approach on 180–212 µm grains (Murray and Wintle, Reference Murray and Wintle2000). For each of the six samples, 36–56 grains yielded acceptable luminescence signals from which we determined dates (see Table 3 and Supplement 2 for detail).
Luminescence dating results for sediment samples prepared and analyzed at the University of Washington Luminescence Dating Lab. See Supplement 2 for more detail on methods.

a Lab-measured percent moisture content by weight. Percent moisture for UW2427 was measured as 17%; because the sample’s sedimentology, stratigraphic and geomorphologic context was similar to the other three alluvial terrace samples, we have assumed 35% better represents the sample’s moisture content.
b Dose rates (Gy/ka) were calculated using the conversion factors of Liritzis et al. (Reference Liritzis, Stamoulis, Papachristodoulou and Ioannides2013) and are shown rounded to two decimal places; ages were calculated using values prior to rounding; central values are given for dose rates and errors are incorporated into that given for the total dose rate.
c Number of De determinations accepted after screening and the total number of aliquots measured.
d Cosmic dose rates (Gy/ka) are calculated according to Prescott and Hutton (Reference Prescott and Hutton1994). Sample location is 33.2357°N, 103.9043°E, elevation 2535 m.
e Dose rates (Gy/ka) were calculated using the conversion factors of Liritzis et al. (Reference Liritzis, Stamoulis, Papachristodoulou and Ioannides2013) and are shown rounded to two decimal places; ages were calculated using values prior to rounding; central values are given for dose rates and errors are incorporated into that given for the total dose rate.
f Age model: M = minimum age; C = central age.
g Luminescence ages were calculated using DRACv1.2 (Durcan et al., Reference Durcan, King and Duller2015) and are expressed as thousands of years before 2009 (year collected) and rounded to the nearest 10 years; error is 1σ.
We sampled sediment profiles to analyze for 137Cs and 210Pbex content to quantify recent sediment deposition. Globally 137Cs delivery peaked in 1963 after which it declined when the USA and USSR stopped atmospheric testing (Stokes and Walling, Reference Stokes, Walling, Kondolf and Piegay2003). While subsequent Chinese and French nuclear testing and the Chernobyl disaster released 137Cs into the atmosphere, southwest China does not have significant deposits; approximately 3% of Chernobyl radiation fell in countries other than the USSR and Europe (UNSCEAR, 1993) and Chinese and French nuclear testing after 1964 is only 6.3% of the pre-1964 testing (UNSCEAR, 1982). Both 137Cs (Lu and Higgit, Reference Lu and Higgitt2000; Zhang et al., Reference Zhang, Zhang, Wen and Feng2003) and 210Pbex (Yan et al., Reference Yan, Dong and Dong2001; Hu, Reference Hu2009) have been used successfully to date sediment deposition in Sichuan.
We sampled sediments at 5-cm increments for 137Cs and 210Pb analysis at 12 locations that included alluvial terraces, alluvial fans, and floodplains (Tables 4 and 5). Our sampling in terraces extended to a basal coarse alluvial gravel layer that lacks a fine-sediment component; in two alluvial fan surfaces we sampled to a relatively shallow depth. Samples were dried, placed in petri dishes, and sealed for at least three weeks prior to counting to allow for radon ingrowth. 210Pbex and 137Cs were counted at the Exeter radiometry lab. Samples were gamma counted for at least 66,000 seconds. Detector efficiency was determined based on lab standards. Supported 210Pb was calculated based on the activity of 226Ra. Relative uncertainty was determined as 165 times the ratio of √counts/counts. This is likely an underestimate of uncertainty at each energy but was the lab standard at the time samples were counted. We used a 222Rn emanation coefficient of 0.3 to align with other studies (Du and Walling, Reference Du and Walling2012). To determine deposition rates, we used the piece-wise constant rate of supply model (Appleby, Reference Appleby, Last and Smol2002) with the peak 137Cs layer as the 1963 estimate; this method allowed us to make use of the 137Cs data and accommodated uncertainty in some cases about whether our sampling was deep enough to include the entire inventory. Due to high uncertainty in the emanation coefficient of 222Rn, and thus high uncertainty in gamma counted 210Pbex activities (Mabit et al., Reference Mabit, Benmansour and Walling2008), below the estimated total inventory determined from the activity above the 137Cs layer using the piece-wise model, there are some positive values of 210Pbex that we consider to be zero. To apply the piece-wise constant rate of supply model, we needed sediment density, which was not collected in the field. Sediment was relatively compact throughout the study area, and we estimate 1.5 g/cm3 as a uniform sediment density for all samples. Estimating sediment density introduces additional uncertainty into our calculations, and thus our 210Pbex-estimated dates should be considered approximate.
137Cs activity, in Bq/kg, in 5-cm depth-integrated samples. Peak values and totals are bolded. Total inventories in parentheses indicate values may be minimums. For detail see Supplement 4.

a YJ09-04 samples from 100–115 cm omitted from table; 0.0 Bq/kg 137Cs activity recorded from all omitted samples.
b YJ09-25 samples from 100–160 cm omitted from table; 0.0 Bq/kg 137Cs activity recorded from all omitted samples.
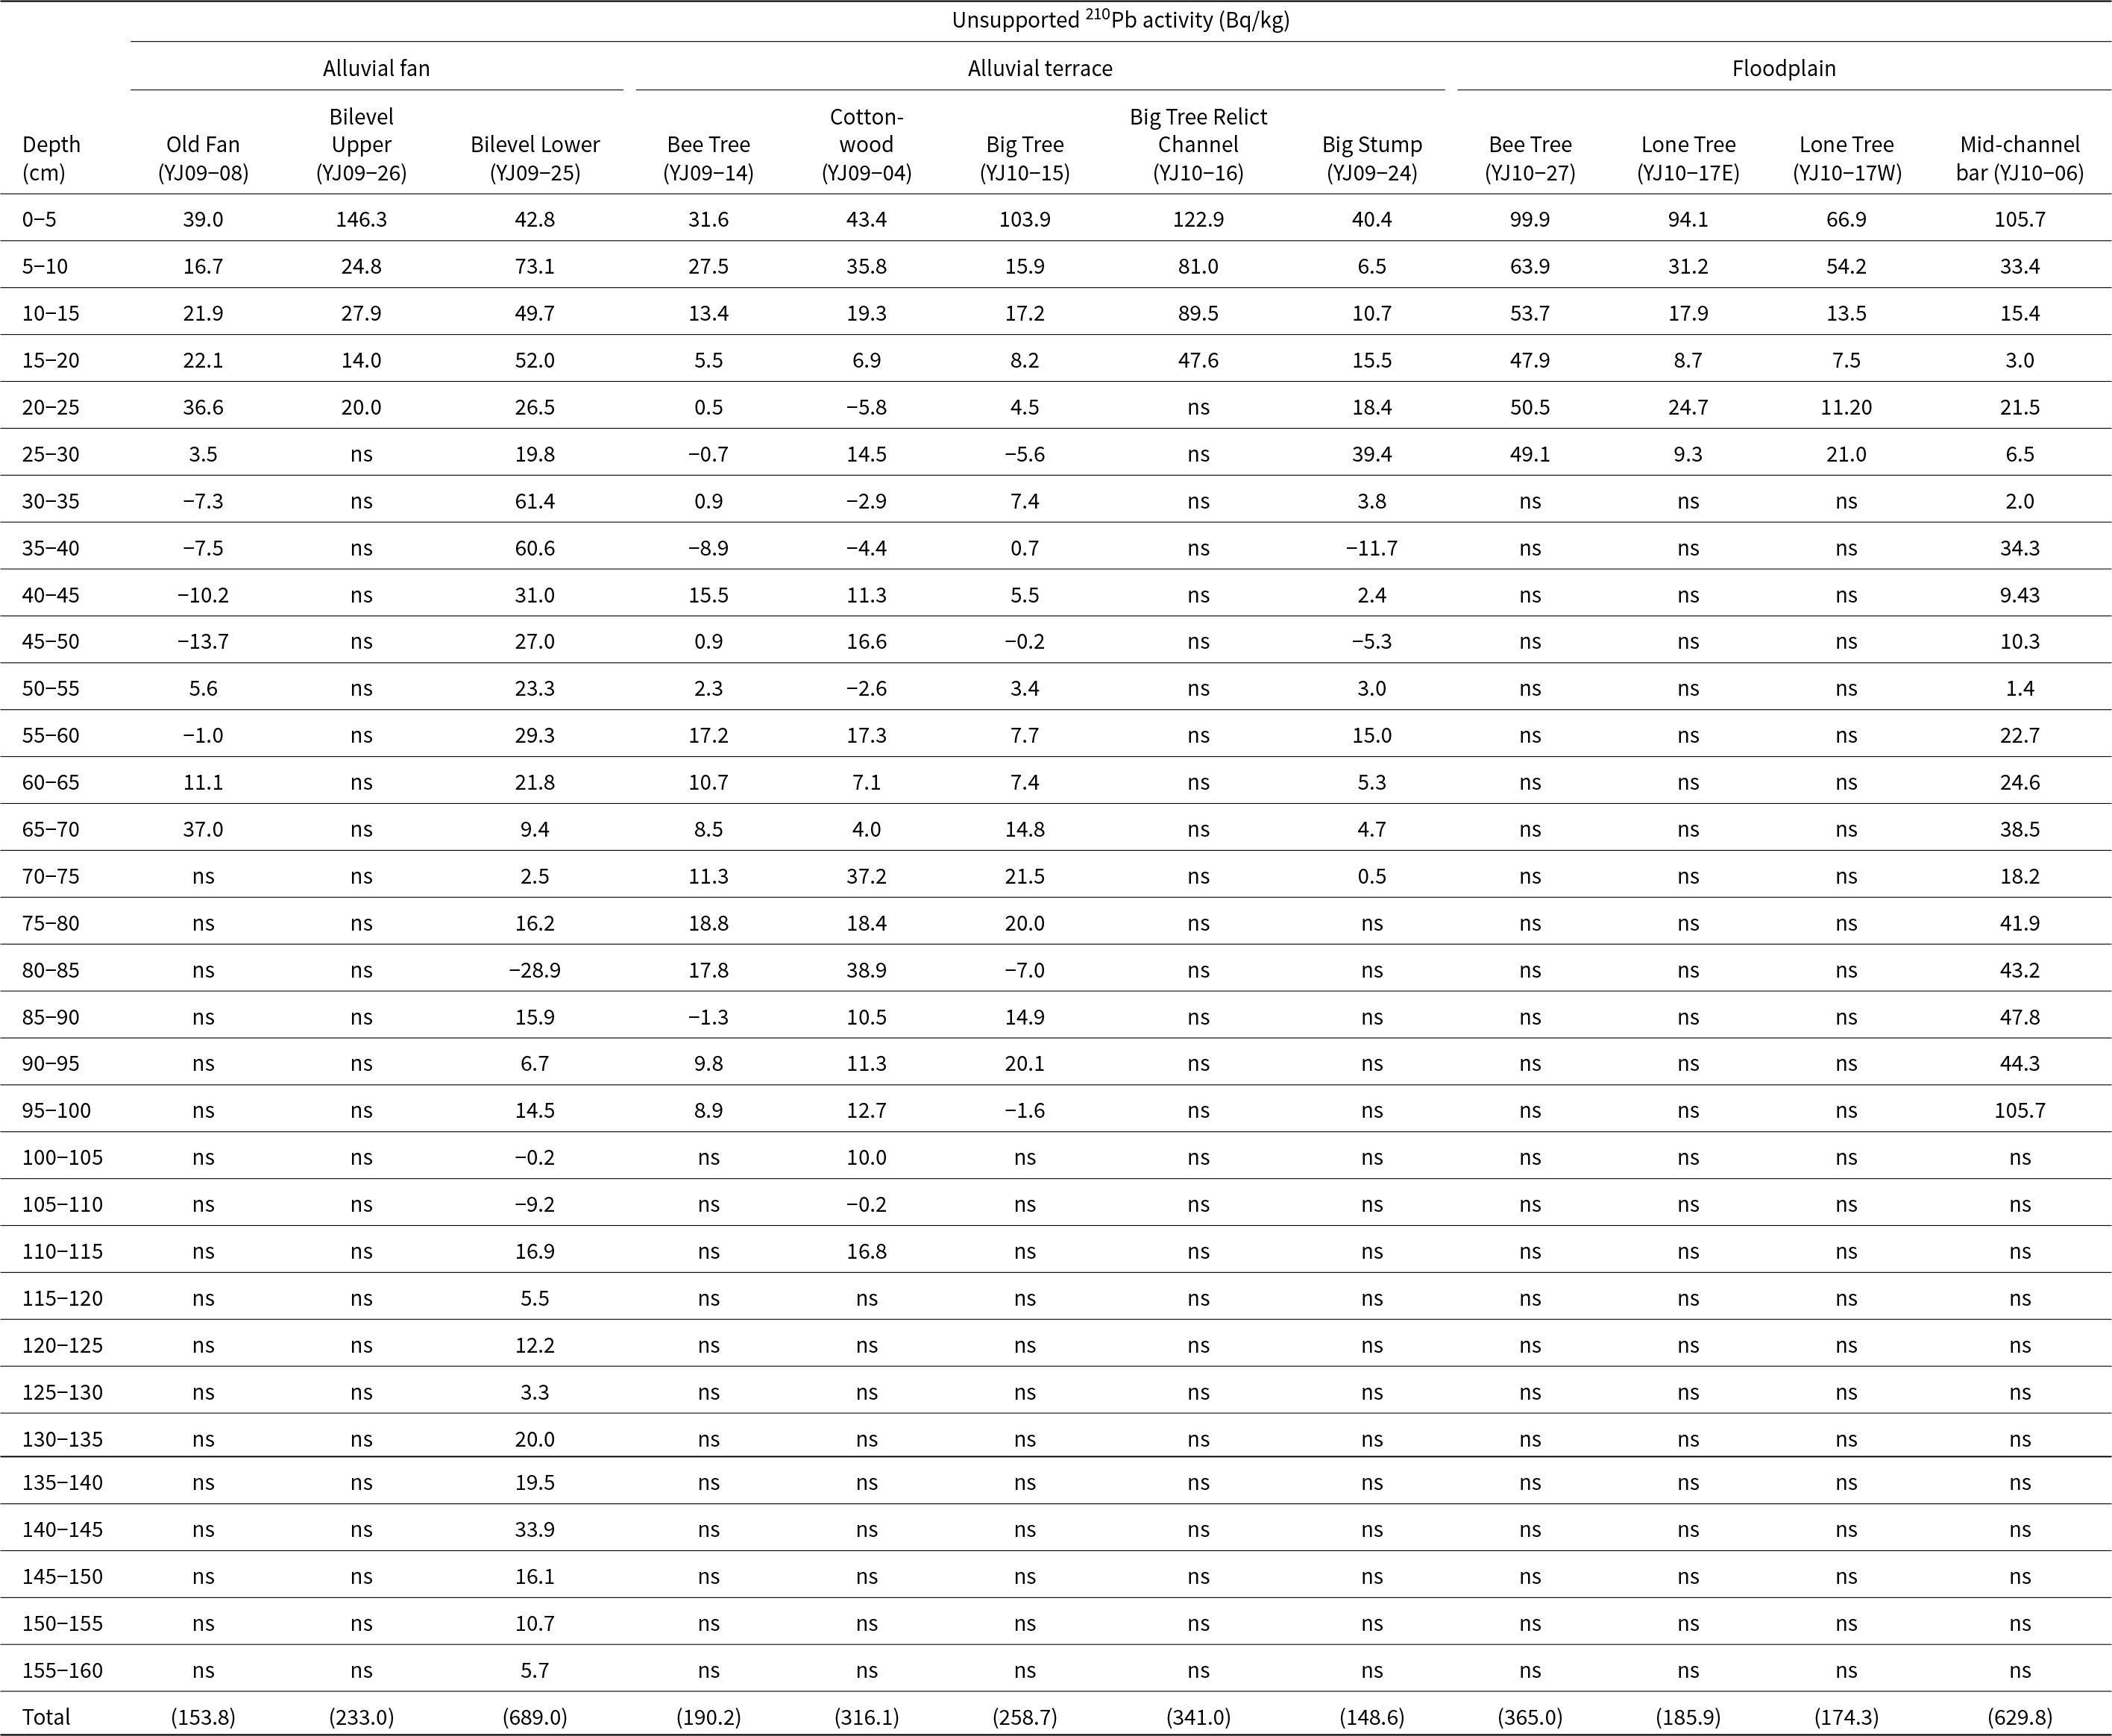
Unsupported 210Pb activity, in Bq/kg, in 5-cm depth-integrated samples. Total inventories are potentially minimums. For more detail see Supplement 4.

CORONA imagery from the 1960s and recollections of local residents indicated a continuous riparian forest until a few decades prior to our field visits, but at the time of our field visits only a handful of alders (Alnus spp.) remained in the valley bottom (Fig. 3). Increment boring of these trees proved infeasible because of their history of intense coppicing; we instead derived broad estimates of tree ages from discussion with valley residents.
Soil profile truncation mapping
To examine for a spatial linkage between the valley-bottom sediment archive and hillslope erosion associated with historical land use, we dug soil pits to measure the depth of forest soil profiles as a proxy for the approximate depth and spatial extent of past erosion. We considered this approach suited to our objectives because our field observations, as well as measurements of soil depth made at 31 locations for a separate 2009 forest ecology study (Harrell et al., Reference Harrell, Schmidt, Collins, Hagmann, Hinckley, Miller, Davis, Lander and Lee2022; see Supplement 1 for plot locations), indicated little to no soil remained on ridge tops and south-facing slopes in the lower catchment whereas soils were deep in the upper catchment. The approach assumes that given similar climate, slope position, aspect, bedrock, vegetation, and land use history, soil profiles should be relatively spatially invariant, and that by controlling for all the other factors, spatial variations in soil depth can be attributed to land-use history (Phillips, Reference Phillips1997). While we could not control for all variables without a much more extensive sampling program than we could undertake, we observed variations in soil depth between catchment areas having different land-use histories to be greater than would be expected from other variables within the study area, as we discuss in our results.
As a measure of past erosion, we measured the thickness of O, A, and B horizons (herein referred to collectively as “topsoil” or “soil”) at 22 hillside pits in June 2010, supplemented with observations from two pits in November 2009 (Supplements 1, 3). In each pit we described soil horizons by depth, color, consistence, texture, and structure type, size, and grade (Schoeneberger et al., Reference Schoeneberger, Wysocki, Benham and Broderson2002). At locations where the C horizon was exposed at the surface or beneath a thin organic layer, and the A and B horizon were entirely absent, the method provides a minimum estimate of past erosion depth.
Because hillslope aspect is a strong control on vegetation, soil characteristics, and historical land uses in our study area, at each pit we measured the slope azimuth and assigned it to one of eight sub-quadrants. For analysis, we grouped 12 sites as “south-facing” (ranging 120–212° azimuth) that faced south and 5 sites facing either southeast or southwest, and we grouped 3 sites as “north-facing” (324–34° azimuth) that faced north and 4 sites facing either northwest or northeast (Supplements 1, 3). Soil profile depths are minimums in five north-facing pits because of practical limitations to our digging at those locations. Elevations at pits were 2540–2890 m and slope angles were 10–52° (Supplement 3). Twelve sites were on the lower third of the slope (measured along slope length), six were on the middle third, and six were on the upper third of the slope. While natural soil production rate likely varies with elevation, and we do not have enough samples to control for this variation, it is likely much less than the strong spatial variation in soil depth that we observed.
Soils in ridge-top swiddens were historically tilled, which would have obscured profile development. We observed soils on former swiddens to be deeply eroded, with an extremely hard, nearly impenetrable surface, and thus likely absent remnant topsoil characteristics, and we did not sample soils in identifiable historical swiddens. For this reason, to the extent our soil profile truncation indicates a land-use influence on erosion, it likely underestimates the magnitude of erosion because it excludes the swiddens themselves. However, by indicating erosion on the heavily managed and used hillslopes adjacent to swiddens and homesteads, it should nonetheless provide an index of anthropogenic erosion. To test whether the intensity of soil loss corresponds to historical land use, because swiddening was concentrated in the lower valley, we used the linear distance from Yangjuan village as a surrogate for historical land-use intensity. Our soil pits ranged between 0.73 and 7.13 km from Yangjuan (average 3.17 km; Supplement 3).
To investigate the timing and further assess the spatial extent of historical hillslope erosion, we computed the basal area (cross-sectional area at breast height, calculated from field-measured circumference) of Pinus yunnanensis near our soil pits on the assumption that tree growth rate correlates with soil depth. This assumption is supported by research showing Pinus yunnanensis growth positively correlates with soil depth elsewhere in Liangshan (Liu, Reference Liu1984). Determining whether there might be an association between tree growth rate and soil depth would provide us with an indicator of the timing of erosion: a positive association would indicate that soil was erosionally stripped before the trees established and matured. At 13 of the pits on south-facing slopes we visually identified the largest Pinus yunnanensis within about 30 m of the pit. We measured the tree’s circumference and extracted a core using an increment borer on which we field-counted rings and used these measurements to determine an approximate age and growth rate, expressed as basal area divided by approximate age (Supplement 3). Of the 17 south-facing sites, 14 appear to have been treeless in the 1961 CORONA imagery (Supplement 1). The low resolution of the imagery did not allow us to unambiguously determine the forest status for the remaining three sites. All of the north-facing sites appeared forested in 1961 CORONA imagery.
Results
Landforms, stratigraphy, and sedimentology
Nearly all tributaries have built alluvial fans of angular, unsorted, or poorly sorted debris flow sediments into the valley bottom. Fans from larger tributaries along the right-bank (west) side of the valley are generally longer along-axis (Fig. 2). Fans are truncated with scarps 2–4 m high (Figs. 3 and 4), are incised, and fan surfaces are generally inactive (Fig. 3B). Bilevel Fan has an upper, inactive surface with a truncated scarp facing the mainstem, and a lower, inset fan surface, built into the valley bottom in the space created by lateral fluvial truncation of the higher surface, which the tributary stream is currently incising (Fig. 5). We described and sampled six fans (Fig. 5). Stonewall Fan, Old Fan, and Snake Valley Fan are incised to the basal fluvial gravels and Bilevel Fan to weathered bedrock. We sampled Old Fan at its apex, 3.2-m above its tributary stream, and at two exposures along the fan’s upstream limb. Cottonwood Fan is much smaller than the other fans and is set back from the current floodplain (Fig. 2). Snake Valley Fan, the upstream-most fan we described, is the most extensive and extends farthest into the valley bottom (Fig. 2). We have created informal place names for this study because local names for tributary valleys are difficult to pronounce for English speakers and can be long in English translation (e.g., Bburryjjoddeladda, Herbal medicine valley; Luohonyihxaidde, Home of the brother of Lord’s Field’s Land; Hxiemga Gaga Hxanuo, Cleared for buckwheat valley).
Representative exposures of two alluvial terraces (A, B) and two alluvial fans (C, D). (A) Big Tree Terrace; (B) Bee Tree Terrace; (C) Stonewall Fan; (D) Bilevel Fan (upper). Horizontal dashed lines are approximate upper limit of gleying and mottling. Photographs from August 2015; vertical 1-m scale is for all photos.

Stratigraphy and geochronology of (A) alluvial fans; (B) alluvial terraces; and (C) floodplains. In each panel, left to right is downstream to upstream. “A” and “B” indicate sampling located within 2 m along-stream. Radiocarbon, OSL, 210Pbex, and 137Cs data are from Tables 1–5. Lowercase letters reference radiocarbon age + 1σ followed by median calibrated radiocarbon age (Tables 1 and 2); uppercase letters reference calibrated OSL ages (Table 3). Horizontal lines in stratigraphic columns are unit boundaries that were field defined primarily by sediment grain size, color, and structure.

In the lower two-thirds of the study reach, alluvial terraces 1.2–1.8 m high and up to 100 m wide (measured perpendicular to the valley axis) flank the river’s floodplain (Figs. 2 and 3). Sediments exposed in terrace risers are dominantly massive silts and sands with occasional gravelly lenses (Fig. 5), indicating a period of aggradation of predominantly overbank sediments. Sediments do not systematically fine or coarsen upward. Upstream, starting about 0.2 rkm downstream of the Snake Valley Fan (Fig. 2), surfaces are intermediate in height between the downstream terraces and the floodplain and sediments are coarser and dominated by gravelly channel deposits. This upper section corresponds to the increase in channel gradient from 0.02 to about 0.04, and is transitional to the upstream, steeper valley segment.
Most exposures where we described and sampled fan and terrace sediments are underlain by fluvial gravels near the elevation of the current riverbed (Fig. 5). The contemporary river alluvium is generally thin, and bedrock was exposed in the streambed at several locations during our field visits. We assume the basal fluvial gravels exposed in fan and terrace exposures are generally thin and overlie bedrock. The lower 10–90% of terrace exposures (exclusive of basal gravels) and the lower 10–40% of fan exposures are commonly gleyed and mottled (Figs. 4 and 5). We interpret this gleying as evidence of a higher groundwater level and streambed elevation when the current terrace sediments were deposited in active floodplains and channels.
Geochronology of alluvial fan sediments
Radiocarbon ages from charcoal in sediments from the six fans range from less than 0.2 ka (1844 CE) to more than 13 ka (11261 BCE) (Figs. 5 and 6, Table 1). Ages from basal or near-basal sediments in the six fans are early Holocene or latest Pleistocene, ranging between 11261 BCE and 7323 BCE. In two fans, the youngest ages cluster from 1744 CE to 1844 CE in Bilevel Fan and the Old Fan’s distal exposure (charcoal at a 12 cm depth from the Snake Valley Fan returned a modern age, but field evidence indicated this sample is likely derived from surface mixing). Deposition was uneven, with episodes of relatively rapid deposition at some fans clustering early and late in the record, and several depositional periods may have been synchronous with deposition at more than one fan (Figs. 5 and 6, Table 1).
Calibrated radiocarbon ages (solid symbols), and one OSL age (hollow circle, from Bilevel Fan), from sediments exposed in alluvial fans. (A) Age versus sample depth from fan surface and (B) fractional depth from fan surface. (C, D) Same data but for 0–2000 CE. Error bars for radiocarbon (Table 1) and OSL (Table 3) dates are 2σ. Shaded bars at base of panels represent periods of relatively wet climate, 898 BCE– 750 CE and 1167–1733 CE, inferred from climate proxies from Lugu Lake, 65 km west of our study site (Sheng et al., Reference Sheng, Yu, Xu, Lan, Liu and Che2015). X-axes shown in thousands of years.

Two of these fans include conflicting dates that we could not resolve without revisiting the field area. Three dates from a charcoal-rich horizon near the base of the Snake Valley Fan exposure appear anomalously young (Fig. 6, Table 1); samples from depths of 182 cm, 180 cm, and 178 cm returned dates of 1778 CE, 1774 CE, and 1836 CE, respectively. The older dates higher in the fan stratigraphy (209 CE at 83 cm and 7323 BCE at 140 cm) are from detrital charcoal and thus unlikely to have substantial inherited ages, so we accept those dates and interpret the four from 165–182 cm as anomalous. All three of these younger samples are within 25 cm of the top of the basal layer of rounded, imbricated cobble-sized fluvial deposits (Fig. 5). A possible explanation for these younger dates at the base of the fan is that at the time the charcoal-containing sediment was deposited, the main channel had incised to near its current elevation near to the bedrock valley floor, at which time fluvial erosion undercut the fan face, and the charcoal-containing sediment infilled the undercut. However, it is possible the Snake Valley Fan is recent if the 209 CE at 83 cm and 7323 BCE at 140 cm represent inherited ages.
The other unresolved ambiguity is from two conflicting dates near the base of Bilevel Fan from which detrital charcoal returned a date of 11261 BCE at 235 cm but 391 BCE at 280 cm. Similar to our reasoning for the Snake Valley Fan ages, because of the improbability of the older date representing a substantial inherited age, we favor that age over the younger age, which could represent contamination from a stratigraphically higher position. However, while for both of these fans the anomalous dates create uncertainty, this uncertainty does not change the overall finding that substantial proportions of fan sediments in the valley date to the earliest Holocene or latest Pleistocene.
Deposition rates, computed from the difference in age and depth of vertically adjacent radiocarbon samples, appear to decline in all fans by one to two orders of magnitude from the Early to Middle Holocene until the last millennium when rates increased (Fig. 7). In two instances, in Old Fan and the distal facies of Old Fan, the middle of three dates falls outside the envelope of the stratigraphically higher and lower dates (Figs. 5 and 6, Table 1). For those two instances we computed rates from the difference between the stratigraphically highest and lowest of the three dates.
Average deposition rates in alluvial fans computed as the depth difference divided by age difference of vertically adjacent radiocarbon samples. Horizontal plotting position is the average of the two ages. See text for more explanation.

We have too few dates to determine with confidence whether deposition decreased throughout most of the Holocene, but a decreasing deposition rate would be consistent with a regionally weakening monsoon (Jarvis, Reference Jarvis1993). Relatively rapid rates in the first half of the last millennium are from Bilevel Fan: two are from three overlapping radiocarbon dates within a 72-yr period (1030 CE, 1034 CE, and 1102 CE) and a depth range of 110–195 cm (Table 1) and could be from a large event or multiple events within several decades. These rates may fall within the early years of a relatively wet period regionally (Fig. 6). Two other relatively rapid rates from Bilevel (1102–1463 CE and 1463–1767 CE) more clearly fall within that period. Relatively rapid rates from the last three centuries from Bilevel Fan (1767–1843 CE) and the distal exposure of Old Fan (1744–1844 CE) are within the period of Nuosu tenure in the catchment and could reflect the erosional effects of Nuosu land uses.
137Cs and 210Pbex results from the near surface of Bilevel Fan bracket the end of fan deposition and onset of incision. On the upper surface of Bilevel, the 137Cs peak, which we take to represent 1963 CE, is at 0–5 cm depth and the 150-yr dating horizon (150 years before 2009, or approximately 1860 CE) estimated from 210Pbex is at 15–20 cm. The previously mentioned radiocarbon date of CE 1843 is at 30 cm depth. These observations suggest no deposition on the upper fan surface since at least 1963. 137Cs and 210Pbex observations on the lower (inset) fan argue that deposition on the upper surface had ceased, and the fan had begun incising earlier than 1963: in Bilevel’s lower surface, the 137Cs peaks (1963) at 35–40 cm, and the 210Pb 150-yr dating horizon is at 75–80 cm (Fig. 5). 210Pbex data from the lower surface support an interpretation that the upper fan surface had already incised by about 1860, and the 137Cs data confirm that incision had occurred prior to 1963.
137Cs and 210Pbex data from Old Fan support two interpretations for when deposition ceased, one of which is consistent with the interpretation at Bilevel Fan. The 210Cs peak (1963) layer is at 10–15 cm depth and the 150-yr dating horizon (150 years before 2009, or approximately 1860) estimated from 210Pb immediately below at 15–20 cm. Below this, the radiocarbon date nearest the surface, at 45 cm depth, is much older, 4017 BCE. One interpretation is up to 20 cm of sediment deposited in the last 150 years, up through and including the atmospheric testing era; an alternate interpretation is that the upper 20 cm represents a plow layer in which sediments, and Pb and Cs fallout, have been mixed. The latter interpretation is consistent with the interpretation from Bilevel Fan that deposition had ceased, and incision had begun before 1860, which is plausible given the very old age at a depth of only 45 cm. The former interpretation would indicate only 15–20 cm of fan deposition since the mid-1800s.
Geochronology of alluvial terrace sediments
We described and sampled four terraces (Fig. 2) at nine exposures (Figs. 2 and 5). Primarily silt-and sand-sized sediments, with occasional gravel lenses, overlie basal fluvial gravels at seven of the nine exposures. Depths to the top of the basal gravel, or to the base of the exposure, range from 0.9 m to 2.4 m. Gleying and mottling are common in the lower several decimeters of all but one exposure (Figs. 4 and 5). We obtained 18 radiocarbon dates from charcoal and wood in six terrace locations (Table 2), four OSL samples at three terraces (Table 3), and we sampled sediments for 137Cs (Table 4) and 210Pbex concentrations (Table 5) at four terraces. Radiocarbon and OSL ages from these terraces are consistent with a period of rapid sedimentation of predominantly overbank sediments beginning in the 1700s.
Wood slices from two growth-position stumps rooted at or near the base of the fine-grained sediment package likely provide an estimate for the onset of fine sediment deposition. A 6-cm-diameter chopped stump protruding from a 10–15-cm thick, cohesive gleyed clay that overlies the basal fluvial gravels, and subaerially exposed in the streambed 50 m upstream of Cottonwood Terrace (Fig. 2) returned an age of 1781 CE (Figs. 4 and 8, Table 2). A second, larger stump, which was rooted in the underlying fluvial gravels and partially buried by gleyed clay and silts and sands, had been cut within the tree’s flare and a diameter could not be confidently measured but was at least 50 cm. Samples from the stump returned a median radiocarbon date of 1758 CE (Figs. 5 and 8, Table 2). The smaller of the two stumps appears to have been growing in the basal layer of fine-grained sediments, and its small diameter indicates an age on the order of 10 years, which suggests the possibility it was cut down in the initial years or decades of the period of fine-grained sediment deposition. The larger stump could have been cut down prior to or after the onset of fine sediment deposition. While the median ages of samples from the two stumps agree within 23 years and average 1770 CE, the large 2σ error ranges allow possible ages between 1525 CE and 1950 CE (Table 3).
Calibrated radiocarbon (solid symbols) and OSL (open symbols) ages from sediments exposed in terrace risers. (A) Age versus depth for individual locations and (B) the same data plotted as a percentage of depth from surface to basal gravels. Plot for Cottonwood Terrace excludes an age from a large piece of wood at 89 cm depth with a calibrated radiocarbon age of 1267 BCE (Table 2). Error bars for radiocarbon (Table 2) and OSL (Table 3) are 2σ. Vertical solid gray line (1758 CE) is median of median radiocarbon ages (n = 13) excluding five dates not shown on plots that were too young for calibration; vertical dashed line (1791 CE) includes those five dates (n = 18). Vertical short-dashed line (1866 CE) is median of OSL dates (n = 5).

The median of radiocarbon ages from detrital charcoal and wood is close to the ages from the stumps. Ages from seven samples of detrital charcoal and five samples of detrital wood range between 1248 CE and 1840 CE (Table 2). Four additional samples were younger than the range allowed for IntCal 20 calibration and had radiocarbon ages ranging from 56 ± 19 to 81 ± 21 radiocarbon yr BP (Table 2). An additional date from a piece of wood in Cottonwood Terrace was much older than the other dates, 1270 BCE. This wood was a dense stick several cm in diameter, making the anomalous age plausibly an inherited age. The median of the median ages of all 11 samples having calibrated ages is 1758 CE (Fig. 8, Table 2); the median of all 16 detrital wood and charcoal samples (i.e., including the five dates younger than the calibration age) is 1791 CE, or within a few decades of the median ages of the two stumps (Fig. 8). There is no discernable trend of age with depth (Fig. 8).
Five OSL samples date the depositional period from about 1740–1940 CE. The depth-age correlation of OSL dates is weak and not statistically significant; five dates from three terraces average 1866 CE (Fig. 8).
We interpret the 137Cs profiles from alluvial terraces to indicate that sediment had generally ceased depositing by 1963. The 137Cs peak, a marker for 1963 CE, is within 5–10 cm of the surface of Bee Tree, Cottonwood, and Big Tree terraces (Fig. 5, Table 4), consistent with surface deposition and downward leaching of fallout cesium. Alternatively, it is plausible these sites had been plowed in the past. The near-surface cesium peaks are also consistent with the 1940 CE ± 20 OSL age at 14 cm at Cottonwood Terrace. The peak cesium activity is deeper at Big Stump, at 25–30 cm, but those sediments are laterally continuous with deposition in the lower Bilevel Fan (Fig. 5). There is also activity at 15–20 cm at the Big Tree relict channel, but sediments at that site were porous, coarse-grained sands and gravel that would facilitate downward leaching.
While our 210Pbex observations have high uncertainty, they are consistent with the inference from radiocarbon dating that deposition had begun in the 1700s, and with the OSL dates that indicate sediments deposited between 1740 CE and 1940 CE. The presumed 150-yr dating horizon (approximately 150 years before the 2009 sampling date, or 1860) at Cottonwood and Bee Tree terraces is 20–25 cm and 15–20 cm below the surface, respectively (Fig. 5, Table 5). The 210Pb dating horizon is undefined for the profiles at Big Tree and Big Stump because of samples with activities that apparently go below zero at a depth less than the total modeled 210Pbex activity based on the amount of 210Pbex above the 1963 horizon.
Geochronology of floodplains
Sampling from two floodplain pits near Lone Tree and Bee Tree was too shallow to include the entire inventory of 210Pbex and possibly too shallow to include the depth at which 137Cs activity peaks (Fig. 5, Tables 3 and 4). However, because 137Cs extends to depths of at least 20–25 or 25–30 cm, sedimentation was post-1963. This supports the inference from terrace geochronology that sediments in terraces had ceased depositing and had begun to incise before 1963.
For additional evidence of the age of terrace incision and formation of the current floodplain, we sought to determine the age of the three remaining alders from the riparian forest—Lone Tree, Big Tree, and Bee Tree. We could not interpret increment cores from these trees because the trees had been intensively coppiced. To estimate the age of Bee Tree, which, like Lone Tree, is growing on the current floodplain, we interviewed two residents who informed us in 2009 that Bee Tree was “30–40 years old,” which would date that tree to 1970–1980 CE and provide a minimum date for the onset of the incision that created the terrace and inset floodplain. While we gathered no information on the age of Big Tree, it was much larger in diameter than the two floodplain trees, which is consistent with the Big Tree terrace surface being older than the Bee Tree floodplain surfaces. A low-resolution 1967 CORONA image shows anastomosing bands of riparian vegetation extending onto the current Big Tree terrace surface and including Big Tree, consistent with incision either soon before or after 1967.
We also sampled a mid-channel surface upstream of, and steeper than, the lower-gradient reach where we intensively sampled terraces and floodplains (Figs. 2 and 5). At this exposure the stratigraphy is dominated by gravel- and cobble-sized bed material sediment rather than the overbank sediments that dominate the downstream terrace deposits. The surface is intermediate in height between floodplain and terrace heights. It is about 1 rkm downstream of a channel knickpoint, and we have interpreted the sediments as channel deposits that have only recently incised. This interpretation of recent or ongoing incision is supported by the remains of a streamside alder forest that appears to have been cut down within the last few decades. The 137Cs peak at 70–75 cm (Fig. 5) supports the inference of active sedimentation since the early 1960s, as does a piece of wood at a 75 cm depth that returned a “modern” age (Table 2). The 210Pb dating horizon is at 80–85 cm, and below this depth the 10–15 cm of sediment overlying basal fluvial gravels is deeply gleyed. While we have relatively low confidence in our lead dating, this would indicate that the fine-grained sediments in a thin layer above the basal gravels are older than 1860 CE, and sediments above are younger than 1950 CE. This is consistent with our interpretation of recent cut and fill at this dynamic, steeper location just above the lower-gradient main study reach.
Soil truncation mapping and Pinus yunnanensis growth rates
The combined depth of O, A, and B horizons on south-facing slopes was highly variable (range 1.5–147.5 cm, median 22 cm). Our best estimate of baseline soil depth in the region is ∼150 cm, which is the soil depth upvalley from the villages and from documented intensive historical land uses (Fig. 9B). In contrast, soils on north-facing slopes were deeper on average than soils on south-facing slopes (p < 0.05) and less variable (20–72+ cm, median 55 cm; Supplement 3).
Representative soil profiles on south-facing hillsides. (A) Soil in a lower catchment location had 7-cm thick O horizon over C horizon. (B) Soil in an upper catchment location had 12-cm thick O horizon, 45-cm thick A horizon, and 90-cm thick B horizon for a total depth of 147 cm. See Supplements 1 and 3 for detail and locations.

Soils on south-facing hillslopes are deeper farther from the villages of Yangjuan and Pianshui: both the combined A and B horizons (R 2 = 0.60, p < 0.005) and the combined O, A, and B horizons (y = 0.0135 − 9.05, R 2 = 0.61, p < 0.005) (Fig. 10A) increase in depth with distance from the village, accounting for about three-fifths of variation in soil depth. This upvalley-increasing soil depth is consistent with land-use influence on erosion because past land-use intensity was greater in the lower valley. Because elevation also varies with distance from the villages, it is possible the observed distribution of soil depths on south-facing slopes could reflect a natural increase in soil depth with elevation and associated climatic gradients; however, available data suggest that forest soil depths generally vary with elevation by much less than the amount we documented. Soil thickness on north-facing hillslopes, in contrast, does not vary with distance from the villages. Interviews with elders confirm that cleared fields on steep slopes were subject to erosion. The historical Nuosu practice of only clearing fields on ridgetops and south-facing slopes likely protected soils on north-facing slopes from eroding.
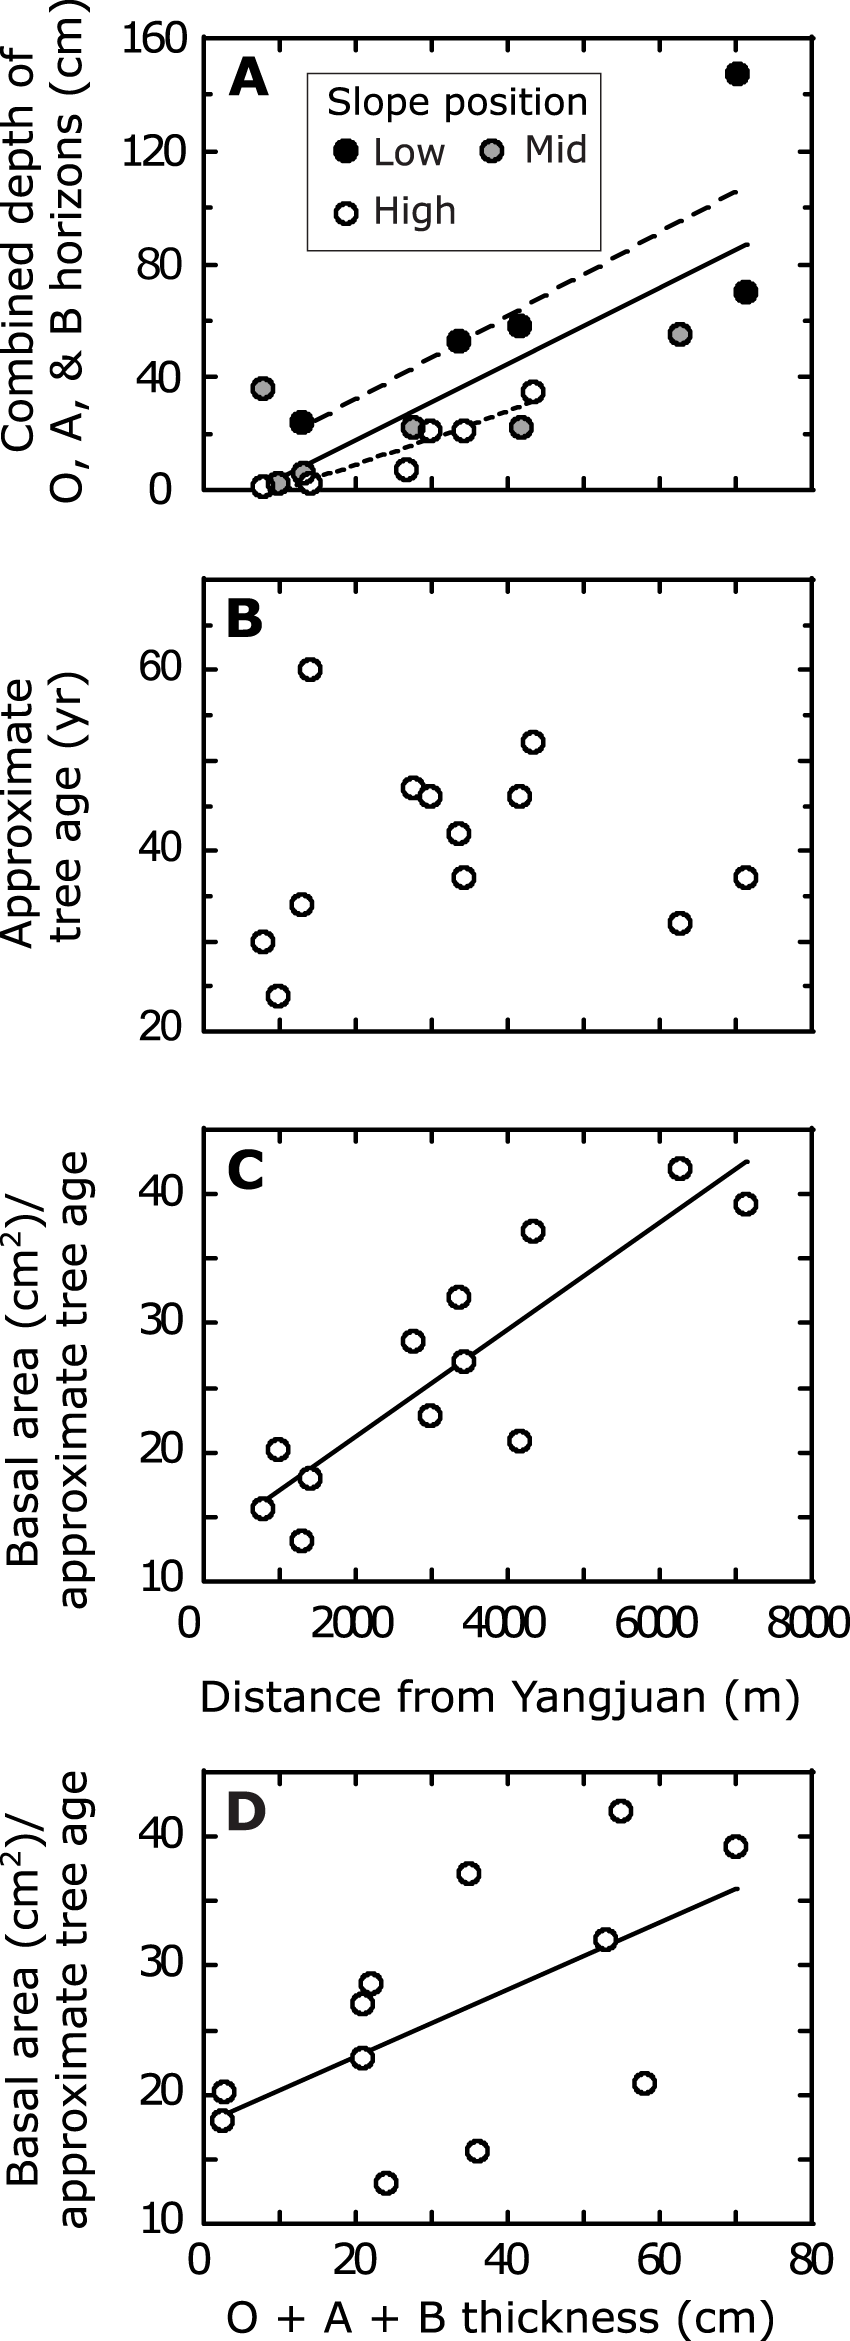
Soil depths and associated tree data from south-facing hillsides. (A) Variation in topsoil depth (combined depth of O, A, and B horizons) with distance from Yangjuan village. Measurements are grouped by their “lower,” “middle,” or “upper” position along hillsides. Solid line is linear regression of all points (y = 0.013x − 9.1, R 2 = 0.61), long-dashed line is linear regression of low-slope soil depth (y = 0.015x + 3.1, R 2 = 0.63), and short-dashed line is linear regression of soil depth on upper slopes (y = 0.0095x + 9.9, R 2 = 0.87). (B) Variation in approximate age of largest diameter Pinus yunnanensis near soil pits (range 24–60 yr, median 39.5 yr) with distance from Yangjuan. (C) Variation of tree growth rate (basal area, in cm2, divided by approximate tree age) with distance from Yangjuan (y = 0.0041x + 13.0; R 2=0.77). (D) Variation of tree growth rate with depth, in cm, of combined O, A, and B soil horizons (y = 0.260x + 17.7, R 2 = 0.35).

Soils on south-facing hillslope were substantially thinner on upper slopes than on lower slopes (Fig. 10A; Supplement 3), with the combined A and B horizon averaging 12.1 cm on upper slopes and 64.8 cm on lower slopes, and the combined O, A, and B horizon averaging 14.7 cm and 70.5 cm depth on upper and lower slopes, respectively. This finding is also consistent with land-use influence because land use, and presumed associated erosion, was more intense near hilltop swiddens and homesteads. When slope position and distance from Yangjuan are combined in a multiple regression, the two variables together account for three-quarters of the variability in topsoil depth (R 2 = 0.73, p < 0.0001 for combined A and B horizons; R 2 = 0.74, p < 0.0001 for combined O, A, and B horizons) on south-facing hillsides. Further supporting an interpretation that past land use accounts for observed patterns of soil depth is that soil depth on south-facing slopes did not correlate with slope angle. If erosion and spatial variation in soil depth reflected solely the history of erosion by overland flow or rainsplash and not land use, erosion would be expected to increase with slope angle.
The approximate ages of Pinus yunnanensis trees in our sample did not vary systematically with distance up-basin (Fig. 10B; 24–60 yr, median 39.5 yr), indicating that trees established in 1950–1986, regardless of distance upvalley, which is consistent with the extensive forest clearing throughout the basin visible in 1961 imagery (Supplement 1). However, tree growth rate did increase with distance upvalley, accounting for 77% of the variation in growth rate in our sample (Fig. 10C). Soil depth accounts for part of this variability, weakly but significantly correlating with distance (Fig. 10D), suggesting both that erosion occurred prior to tree establishment (i.e., prior to 1950–1986) and that other factors that vary with distance up-basin and, presumably, with land-use intensity, also influenced growth rate (Harrell et al., Reference Harrell, Schmidt, Collins, Hagmann, Hinckley, Miller, Davis, Lander and Lee2022). In addition, we did not observe exposed tree roots or soil pedestals, which supports the interpretation that A and B horizons had eroded prior to tree establishment in 1950–1980. The influence of an elevational gradient in climate on tree growth rate could potentially confound the correlation between tree growth and soil depth, but three studies conducted nearby showed that Pinus yunnanensis growth declined with elevation (Liu, Reference Liu1984; Yang et al., Reference Yang, Fan, Li and Wen2018; Bi et al., Reference Bi, Whitney, Li, Yang and Yang2020), making it unlikely that climate confounds our analysis.
Summary of interpreted erosion and sedimentation history
Basal deposits in tributary alluvial fans overlie thin alluvial gravels, which in turn rest on bedrock (Fig. 5), indicating the riverbed was on or near bedrock at times in the Early Holocene, as it was at the time of our field visits. Subsequent fan deposition, with sediments spanning from the Early Holocene or latest Pleistocene to the mid-nineteenth century (Fig. 6, Table 1) appears non-uniform (Fig. 7). While more dates are needed to confidently define a trend, deposition appears to have slowed since the Early Holocene, which would be consistent with a weakening South Asian Monsoon. Rates increased in the last millennium, with some of this increase plausibly reflecting the effects of erosive land uses.
Radiocarbon and OSL dates from predominantly overbank sediments preserved in valley-bottom terraces date the depositional onset (Figs. 5 and 8, Tables 2 and 3) to about 1700. This timing, and the fine grain size, suggest the strong possibility that these sediments are from hillslope soil erosion promoted by what local ethnohistorical tradition indicates was the rapid intensification, with the arrival of Nuosu people in about 1700, of swidden agriculture on ridge tops and gently sloping south slopes, and associated grazing. The partial or full stripping of topsoil from south-facing hillslopes in the lower catchment (Fig. 10A), where land use was historically intensive, supports the association of Nuosu land use with hillslope erosion. Rapid fan deposition (Fig. 7) during the Nuosu era, indicated by radiocarbon dates from the upper 60 cm of Bilevel Fan and the distal facies of Old Fan (Figs. 5 and 6, Table 1) also supports the causal association. In this interpretation, terrace sediments and the upper strata of some fans are thus “legacy sediments” (James, Reference James2013) from anthropogenic hillslope erosion promoted by historical land uses.
Evidence from terraces, fans, floodplains, and hillslopes indicate that this depositional period had ceased, and incision had begun, by the mid-1900s: a terrace near-surface OSL date of 1940 (Fig. 8, Table 3) and terrace-surface peaks of 137Cs (Fig. 5, Table 4) indicate that terrace sediments had ceased accreting by the early 1960s. 137Cs peaks in fans similarly constrain the cessation of fan deposition to before the early 1960s. The presence of 137Cs in floodplains, trees apparently dating to at least the 1970s-1980s on those floodplains, and the spatial pattern of riparian vegetation visible in 1967 aerial imagery also indicate that incision leading to terrace formation had begun by the early 1960s. On hillslopes, the absence of soil pedestals at the bases of trees and the positive correlation between tree growth rate and soil depth (Fig. 10D) are consistent with hillslopes having eroded prior to the mid-twentieth century. Thus, multiple types of evidence from different landforms indicate that hillslope erosion and valley-bottom sedimentation that began around the time of the Nuosu’s arrival to the catchment in the 1700s had ceased by the mid-1900s, either because erosion rates had reduced below the river’s transport capacity, or the river’s discharge and transport capacity had increased, or both, and terraces and fans incised.
Discussion
Landforms in a third-order headwaters valley-bottom can function as sediment storage capacitors
Sediments and landforms in the valley reveal a history of filling and emptying of two sediment reservoirs having different residence times. Alluvial fan sediments have a relatively long residence time of 102–104 years while that of alluvial terrace sediments is a comparatively short 101–102 years. The fan and terrace deposits rest on thin alluvial cover above bedrock, which indicates the river had excavated the valley sediments to bedrock before fan deposition in the Early Holocene and did so again a few hundred years ago before deposition of the fluvial overbank sediments that comprise the alluvial terraces. Another cycle of incision and sediment evacuation began in the middle of the twentieth century. There may have been other cycles of filling and excavation of valley sediments during the Holocene. While the apparent periodicity of the valley being emptied of fan deposits is long (thousands of years) and the periodicity of the valley being emptied of fluvial deposits is relatively short (tens or hundreds of years), both landforms function as “capacitors” for sediments mobilized by hillside erosion in the catchment and as buffers between hillslope erosion and sediment production to the mainstem and the Yangtze River system.
Contemporary sediment production is decoupled from hillslope erosion
Our field observations indicate that lateral fluvial erosion of stored valley sediments is currently the dominant source of sediment to the river. For example, on our August 2015 visit during the summer monsoon, in a storm and runoff event thought by valley residents to have been the biggest in at least 60 years, we observed dramatic lateral retreat of alluvial terraces and alluvial fans along the mainstem. While there is evidence for local hillslope erosion associated with chutes created to transport cut trees down slopes (see 2011 imagery in Fig. 2 and Supplement 1) and with footpaths, we did not observe significant delivery of sediment from these local hillslope erosion sources to streams. In addition, during the 2015 flood event, water in the mainstem was highly turbid while water from tributaries, which would have collected sediment from logging chutes or footpaths, remained clear.
While our observations are confined to a single catchment, in this catchment sediment is dominantly supplied to the river by lateral fluvial erosion of sediments stored for hundreds to thousands of years in alluvial fans or tens to hundreds of years in alluvial terraces, and not by contemporary hillslope erosion. While a number of suspended-sediment studies have inferred that contemporary headwater forest clearing is an important source of sediment observed downstream in the Yangtze River network (Lu and Higgit, Reference Lu and Higgitt1998, Reference Lu and Higgitt1999; Chen et al., Reference Chen, Li, Shen and Wang2001; Lu et al., Reference Lu, Ashmore and Wang2003; Zhang and Wen, Reference Zhang and Wen2004; Yan et al., Reference Yan, Wang and Chen2011), that this is not the case in our study basin motivates study of the links among hillslope erosion, sediment storage, and sediment delivery to streams in other Yangtze headwater catchments.
Implications of rapid hillslope erosion and valley-bottom sediment storage for measuring erosion using 10Be
The decoupling of hillslope erosion from sediment production means that assumptions underlying the basin-average 10Be erosion rates technique are violated in this catchment and others like it. Assumptions that are not met, and which are assumed to be met for basins of this size, include that any anthropogenic erosion was not deep enough to strip more than 20–30 cm of soil from the surface, that erosion is in steady state, and that there is minimal valley-bottom storage (Brown et al., Reference Brown, Stallard, Larsen, Raisbeck and Yiou1995; Bierman and Steig, Reference Bierman and Steig1996; Granger et al., Reference Granger, Kirchner and Finkel1996). In this location, the loss of up to 1.5 m of soil over ca. 200 years means that nuclide concentrations in sediment leaving the hillslopes will imply significantly faster erosion than actual long-term erosion rates (Hewawasam et al., Reference Hewawasam, von Blanckenburg, Schaller and Kubik2003; von Blanckenburg et al., Reference von Blanckenburg, Hewawasam and Kubik2004; Schmidt et al., Reference Schmidt, Neilson, Bierman, Rood, Ouimet and Sosa Gonzalez2016). Even prior to the arrival of the Nuosu to the basin, 10Be-determined erosion rates might have been biased by sediment being stored in alluvial fans for extended periods of time. Material near the top of the fans would have accumulated extra 10Be, thus making the erosion rate appear slower, while material near the bottom of the fans would have maintained the original concentration of 10Be because storage is not long enough for significant 10Be decay. Thus, although small watersheds are often assumed to not have significant valley storage, which contributes to both 10Be production and decay, depending on the depth of storage (Ouimet et al., Reference Ouimet, Whipple and Granger2009; Hippe et al., Reference Hippe, Kober, Zeilinger, Ivy-Ochs, Maden, Lukas Wacker, Kubik and Wieler2012; Hippe, Reference Hippe2017; Bierman et al., Reference Bierman, Bender, Christ, Corbett, Halsted, Portenga and Schmidt2021), we found that storage in watersheds as small as 30 km2 can be significant. Finally, just the cycles of filling and excavating mean that the valley is not in steady state over timescales that 10Be-derived erosion rates integrate (Ouimet et al., Reference Ouimet, Whipple and Granger2009). The basin-average long-term erosion rate for the larger drainage basin Apiladda flows into, the Yalong River, is 250 m/Ma (Chappell et al., Reference Chappell, Zheng and Fifield2006). This erosion rate implies that erosion rates measure ca. 2500 years of erosion, which is on the order of the valley-bottom sediment-storage timescales we report here. In short, the human disturbance to soils, widespread sediment storage on the valley bottom, and clear periodicity to that storage all suggest that caution must be applied in such catchments when collecting samples to measure 10Be-derived basin-average erosion rates.
Anthropogenic drivers of erosion
One motivation for this study was to investigate the erosional effect of land-use policies associated with the Great Leap Forward (1958–1961) and subsequent policies in the first decades of the PRC. The valley-bottom sediment archive does not record evidence of substantial deposition during the 1950s and 1960s; instead, other than deposition on an inset fan surface from one tributary, a period of incision began prior to the early 1960s. In our study basin, this incision could imply either a decrease in the sediment supply or an increase in the stream discharge, from, for example, enhanced runoff of overland flow from hillslopes. If sediment supply was reduced, such a reduction could plausibly reflect the limits to hillslope sediment supply imposed by the stripping of topsoil by earlier hillslope erosion in the previous centuries (Gale and Haworth, Reference Gale and Haworth2005). It’s also plausible that hillslope runoff was enhanced by increased forest clearing in combination with erosion and exposure of subsoil from earlier hillslope erosion. While there is clear evidence of erosion of cultivated fields on the sloping plains downstream of our steep, forested study valley, the depositional record in our study area does not provide evidence for widespread delivery of sediments from anthropogenic hillslope erosion in the PRC era, but instead a period of lateral fluvial excavation of valley-stored sediments eroded from hillslopes and deposited in the valley bottom in the two centuries prior to the PRC period.
The onset of valley-bottom and alluvial-fan deposition in the last few hundred years coincides with the introduction of swidden cultivation to hillsides and ridge tops with the arrival of the Nuosu people to the catchment, which was previously inhabited by the Prmi ethnic group, who probably confined land use to the valley bottom (Harrell, Reference Harrell2001). An increase in sedimentation has been associated with the arrival of swidden elsewhere in Liangshan. For instance, in a lake core from Lake Shayema, 130 km NE of our study basin, Jarvis (Reference Jarvis1993) observed accelerated sediment deposition along with pollen associated with swidden agriculture 1000 14C yr BP and attributed that accelerated deposition rate to swidden agriculture.
Sediments stored in valley-bottom terraces appear to result from a two-century period of enhanced hillslope erosion during the Nuosu’s use of traditional swidden practices. Such legacy sediments from anthropogenically induced erosional periods have been widely documented on six continents (for review, see James, Reference James2013; James et al., Reference James, Beach and Richter2021). In China, while the human imprint on erosion in the last two millennia is evident in river deltas of the Yangtze (Wang et al., Reference Wang, Li, Zhang, Zhuang, Liu, Saito, Xie and Zhao2011; Sun et al., Reference Sun, Li, Kuiper, Zhang, Gao and Wijbrans2016) and Yellow (Shi et al., Reference Shi, Dian and You2002) rivers, and numerous studies document the anthropogenic increase to sediment yields in the last century, we are not aware of other studies that have documented the storage of legacy sediments and the time scale and rate at which these legacy sediments enter the fluvial system in China. This finding motivates investigating whether such legacy sediments occur elsewhere in the region and, if so, whether and how they contribute substantially to contemporary sediment production.
Alluvial fans could provide archives for evaluating potential regional drivers of erosion
The alluvial fan sediment archive has the potential to provide insight into how erosion rates have varied over time due to changes to climate, land use, or tectonism. For example, Li et al. (Reference Li, Armitage, Stevens and Meng2018), using OSL to date alluvial fan sediments from the 20-km2 Goulinping River, a tributary to the Bailong River, 750 km NNE of our study area, found that an aggradational period from 47 ± 5 ka to 7.1 ± 0.7 ka was followed by incision to the present (Li et al., Reference Li, Armitage, Stevens and Meng2018, fig. 9), a trend they ascribed to the weakening East Asian Monsoon. Near our study site, at Lake Shayema, Jarvis (Reference Jarvis1993) found palynological evidence for a weakening monsoon since the Middle Holocene. Our study was not designed to develop sufficient data to investigate climate influence on erosion, but our limited fan ages show deposition rates may have declined from the Middle Holocene until the last millennium (Fig. 7), suggesting the possibility of a climatic signal, which more extensive and intensive sampling (Pierce and Meyer, Reference Pierce and Meyer2008) might confirm. The potential may also exist in tectonically active areas, such as our study area, to relate more exhaustively documented alluvial fan sedimentary records to past episodes of co-seismic landsliding (Yin et al., Reference Yin, Wang and Sun2009).
Conclusions
In the valley bottom of a third-order stream draining the margins of the Tibetan Plateau, sediment is stored in alluvial fans and alluvial terraces for 102–104 and 101–102 years, respectively, before being eroded by streams. These landforms thus function as sediment “capacitors” that temporally decouple hillslope erosion from sediment yield, as illustrated by lateral fluvial erosion of these landforms dominating contemporary sediment production to streams. The record of non-continuous alluvial fan deposition suggests that rates of hillslope erosion may have declined along with regional weakening of the Asian Monsoon that began in the Middle Holocene. The depositional age of predominantly fluvial overbank sediments in alluvial terraces corresponds to a period of intensive hillslope erosion associated with swidden agriculture, motivating additional study of whether such legacy sediments from earlier land uses may be widespread in China or elsewhere in Asia.
Supplementary material
The supplementary material for this article can be found at https://doi.org/10.1017/qua.2025.22.
Acknowledgments
We gratefully acknowledge funding from the University of Washington (Quaternary Research Center, China Studies Program, and UW Worldwide), Oberlin College (Oberlin Department of Geosciences, Oberlin College Powers Travel Award, Oberlin College Grant in Aid, Oberlin Shansi In-Asia Grant to field assistant Megan Curiel, and Oberlin Doris Baron Environmental Studies Student Research Fund Award to field assistant Megan Curiel). We are deeply grateful to the people of Yangjuan and Pianshui villages for welcoming us, sharing their intimate knowledge of local landscapes and history, assisting in data collection, providing for us during our field visits, and for their friendship; we particularly thank Ma Lunzy, Mgebbu Ashy, Hxisse Vuga, Lurlur Adda, Ma Fagen, Sha Kaiyuan, Ma Vuga, and Ma Jyjy. For their help in the field, we thank Josh Schmidt and students Christine Trac, Mark Ingman, and David Mailhot (University of Washington); Elizabeth Whitcher, Megan Curiel, and Philip Swanson (Oberlin College); and Wang Xiuli (Sichuan University); for productive conversations about interpreting OSL data, we thank Amanda Keen-Zebert and Kathleen Rodridgues. The authors declare no competing interests.


 Open access