


Ageing is an event characterised by deterioration of the physiological functions of the cell and organisms due to progressive accumulation of changes over time that lead to loss of physiological homoeostasis and organismal integrity(Reference Lopez-Otin, Blasco and Partridge1). Calorie restriction (CR) is known to be one of the effective methods to delay ageing and ageing-related diseases including neurodegeneration by modifying metabolic processes, satiety, energy balance and promoting cognitive function(Reference Hadem, Majaw and Kharbuli2,Reference Morgan, Andrews and Davies3) . CR ameliorates the effects of ageing by inhibiting cell proliferation, glycolysis, inflammation and increasing autophagy, antioxidant expression as well as improving mitochondrial physiology in animal models and human(Reference Lopez-Lluch and Navas4–Reference Dogan, Ray and Cleary9). Studies have reported that people who consumed lower calories than their required daily intake had lower neurological disease incidence rates and other chronic diseases compared with the control group(Reference Flanagan, Most and Mey5,Reference Most, Tosti and Redman6,Reference Kagawa10,Reference Hursting, Dunlap and Ford11) . For example, Rubotovich and colleagues showed that short term CR and intermittent fasting (less than 12 months) eliminated the negative effects of traumatic brain injury and protected against neuronal damage in a traumatic brain injury mouse model(Reference Rubovitch, Pharayra and Har-Even12). Although the roles of various molecular pathways such as leptin/adiponectin, Insulin-like growth factor-1 (IGF-1) and cytokines have been investigated in attempts to understand these responses, recent studies have focused on the roles of epigenetic modifications including microRNA (miRNA) and/or DNA methylation to understand the exact protective mechanisms of CR(Reference Wood, van Dam and Craig13–Reference Golbidi, Daiber and Korac16).
miRNA, 18–25 nucleotides in length, are non-coding RNA that regulate gene expression by inhibiting mRNA activity by base-pairing at the 3’UTR region in eukaryotes. One-third of all human protein expression is suggested to be regulated by miRNA(Reference Lin and Gregory17,Reference Cui, Zhou and Ross18) . Regulation of gene expression via miRNA is reported to be important in several biological processes related to health and lifespan including neurogenesis, neuroprotection, neurodegeneration and cognition through regulating synaptic plasticity, neural differentiation, nutrient sensing, mitochondrial function and DNA repair mechanisms(Reference Bielefeld, Mooney and Henshall19–Reference Reddy, Williams and Smith21). For example, expression of let-7b, miR-9, miR-34a, miR-145 inhibits and miR-137, miR-25b promotes activation and proliferation of neural stem cells(Reference Bielefeld, Mooney and Henshall19). Moreover, miR-29a/b, miR-34a, miR-137 expression is shown to regulate neuronal apoptosis(Reference Nampoothiri and Rajanikant22).
Physiologically, CR improves nutrient sensing, cognitive function, neuronal network activity, Ca homoeostasis and redox status and inhibits neurodegeneration and neuroinflammation via different signalling pathways in the brain(Reference Hadem, Majaw and Kharbuli2,Reference Morgan, Andrews and Davies23) . In addition, CR plays roles in ageing and ageing-related diseases by modulating certain miRNA levels in blood, liver, brain tissues of mice, rat and rhesus monkeys(Reference Wood, van Dam and Craig13,Reference Lee, Jeong and Bang24–Reference Makwana, Patel and Velingkaar28) . For example, it was reported that 40% chronic calorie restriction (CCR) for 2 years decreased expression levels of miR-34a, miR-30e and miR-181a* in brain of Bcl-2 overexpressed mouse model in an age-dependent manner(Reference Khanna, Muthusamy and Liang29). The researchers concluded that CR could mediate neuronal survival via the regulation of miRNA in long-lived CR mice(Reference Khanna, Muthusamy and Liang29). In addition, Wood et al. reported that 45% CR of male Brown Norway rats for up to 26 months decreased expression of miR-98-3p that is important in regulation of histone deacetylase and histone acetyltransferase activity in brain samples(Reference Wood, van Dam and Craig13). Wood et al. claimed that CR increased longevity and promoted neuroprotection via histone deacetylase/histone acetyltransferase homoeostasis(Reference Wood, van Dam and Craig13). Although the roles of numerous molecules have been investigated in the preventive effects of CR in ageing, there are limited reports on the roles of miRNA in the brain of mice with intermittent CR (ICR). Thus, the aim of the present study was to investigate and compare the effects of long-term application of two different types of CR (ICR v. CCR) on the miRNA profile in the brain of ageing mice.
Materials and methods
Animals
In the present study, Dr. Margot Cleary from Hormel Institute Medical Research Center, University of Minnesota kindly donated MMTV-TGFα (Mouse Mammary Tumor Virus-Tumor Growth Factor-α) (C57BL/6) mice strain to form a breeding colony at Yeditepe University Animal Facility (YUDETAM). MMTV-TGFα positive male mice were bred with TGFα negative female mice (C57BL/6) to obtain heterozygote MMTV-TGFα female offspring(Reference Matsui, Halter and Holt30). All mice had free access to water and were accommodated in conditioned environment at room temperature (20–25 °C) and 12 h light/dark cycle. The present study was conducted under the guidelines of Turkish Ministry of Forestry and Water Affairs and approved by Yeditepe University Animal Care and Use Committee. Health status of all animals was checked by the researchers and a veterinarian regularly.
At 10 weeks of age, female MMTV-TGF-α mice were randomly enrolled into three different dietary groups: ad libitum (AL), or ICR. Mice were fed with Altromin TPF1414 diet (Kobay A.Ş.). Food access of mice was determined according to the diet regimens throughout the study. Mice assigned to AL group had free access to food and weekly average food consumption per mouse was calculated in an age-matched manner. Compared with the AL group, 15 % daily CR was applied to mice in the CCR group and these mice daily consumed 85 % of food consumed by AL mice. In the ICR group, 60 % CR was applied for one week, followed by three weeks of AL consumption also resulting in 15 % CR over each of the 4-week intervals. This feeding regimen was applied in a cyclic manner until mice were killed at designated age points. The ICR group was divided into two groups according to feeding periods. ICR mice killed after three weeks of AL feeding were referred to as ICR-refed (ICR-RF) and those killed after one week of 60 % CR were referred to as ICR-restricted (ICR-R). AL feeding was chosen for mice in the ICR group for three weeks and 60 % CR or one week since this protocol would more closely mirror a human dietary feeding style. In our previous studies (Margot Cleary’s group), two weeks of AL followed by two weeks of 50 % CR or three weeks AL and three weeks of 50 % CR was used for approximately 75 weeks in mice(Reference Cleary, Ray and Rogozina31–Reference Dogan, Johannsen and Grande33). We hypothesised that 60 % CR for one out of every four weeks in a cyclical manner could be more applicable to human dietary patterns than the previous protocols. All mice were sacrificed after overnight fasting at designated ages: 10 or 81/82 weeks of mouse age. For the AL and CCR groups, body weight, physiological and other conditions of the mice did not differ between week 81 and 82, thus samples (n=3 per group) obtained at these weeks were combined as one-time point (week 81/82)(Reference Dogan, Johannsen and Grande33–Reference Omeroglu Ulu, Ulu and Dogan36). The reason the 81/82 weeks were decided is because we wanted to apply the longest possible CR application for the mice without having any serious health problems or loss of life.
Homogenisation and total RNA isolation
Brain samples were cut into pieces and washed three times with PBS to remove residues and debris. Then, whole brain samples were homogenised in sterile PBS buffer with 0·5 mm zirconium oxide beads using a bullet blender (Next Advance, BBX24B). Total RNA was extracted from 50 μl homogenised samples using Direct-zol RNA MiniPrep Kit (Zymo Research, R2052) according to manufacturer’s instructions. Total RNA concentration was measured using a NanoDrop 2000 spectrophotometer (Thermo Fisher, ND2000) and integrity of total RNA was checked by 1 % agarose gel electrophoresis. Then, isolated RNA samples were stored at −86 °C freezer until its use.
Detection of microRNA transcriptome profile in brain samples
In the present study, miRNA profiles in brain samples were done in three different mice (n=3). Affymetrix GeneChip miRNA 4.1 Array strips (Applied Biosystems, 902404) were used to profile miRNA in whole brain samples. This array strip includes 30 424 mature miRNA probes from 203 organisms according to miRBase v20 (www.mirbase.org). This probe includes 1908 mature miRNA and 1255 pre-miRNA for mouse. Briefly, a total of about 500 ng RNA samples from three different mice for each dietary group was used (n 3). Samples were incubated in 37 °C for 15 min for poly(A) tailing and then labelled using FlashTag Biotin HSR RNA Labelling Kit (Applied Biosystems, 901911). After the biotin HSR ligation, samples were denaturised in Hybridisation Master Mix at 95 °C for 5 min, followed by an incubation at 45 °C for 5 min. Denaturised and labelled RNA samples were randomly hybridised using the GeneChip miRNA 4.1 array strips for 20 h at 48oC at the GeneAtlas Hybridization Station. Array strips were then washed and imaged on Affymetrix GeneAtlas Imaging Station. Results were obtained using Transcriptome Analysis Console 4.0.1 using miRNA-4_1 array type, Expression (Gene) analysis type and RMA + DABG (Mouse Only) summarisation. Differentially expressed (DE) miRNA with higher than 2-fold change and with P-values smaller than 0·05 were included in the analysis.
Analyses of target prediction, gene ontology enrichment, KEGG pathway and functional enrichment analysis
Target prediction analyses were performed to identify the predictive and validated target genes of the DE miRNA. Validated targets of DE miRNA were determined using multiMiR R package using Tarbase, miRTarbase and miRecords databases(Reference Ru, Kechris and Tabakoff37). Predicted targets of DE miRNA were determined using Diana microT CDS 5, Targetscan Mouse 7.2 and miRDB 6.0 databases(Reference Paraskevopoulou, Georgakilas and Kostoulas38–Reference Liu and Wang40). Genes which were common in the three different databases were considered as predictive targets.
To reveal the biological significance of predicted target genes, gene ontology (GO) enrichment analysis was performed using Cytoscape plug-in ClueGO v2.5.4 and Cluepedia 1.5.4(Reference Shannon, Markiel and Ozier41,Reference Bindea, Mlecnik and Hackl42) . Predictive target genes were analysed in the plug-in using Mus Musculus (10090) marker list. Biological process, cellular component, immune system and molecular function ontologies were selected to assess GO functions of predicted targets. Analysis was performed using enrichment/depletion (two-sided hypergeometric test) with Bonferroni step-down P value correction, and corrected P values < 0·05 were considered as significantly enriched. GO terms were grouped and leading group term was determined according to the highest significance. Data were obtained and central nervous system-related target genes of DE miRNA in GO were determined.
KEGG pathway analysis was performed using DAVID 6.8 to identify the pathways of predictive targets(Reference Huang da, Sherman and Lempicki43). List of terms in functional annotation of predictive targets was observed, and Bonferroni corrected P value < 0·05 was considered as significantly enriched. Data were obtained and neurogenesis-related target genes of DE miRNA in KEGG pathway were determined.
ClueGO functional enrichment (FE) analysis was performed using GO biological process, cellular component, immune system process and molecular function ontologies UniProt gene ontology annotation, KEGG, proteome pathway and Wikipathways databases. DAVID FE analysis of predicted target genes was performed using default settings of DAVID 6.8. Enrichment scores higher than 2 considered as significantly enriched in common groups.
K means clustering and diagram generation
Morpheus matrix visualisation software was used to visualise DE miRNA in comparisons and form K means cluster(Reference Liu and Wang40,Reference Cakmak, Dundar and Acikgoz44) . Venny Venn diagram maker tool was used to create Venn diagram between DE miRNA and their targets in comparisons(Reference Oliveros45).
Validation of microRNA microarray
cDNA synthesis was performed using 100 ng total RNA and preamplified with miRCURY LNA RT Kit (Qiagen, 339340) according to the manufacturer’s protocol. 3 µl of preamplified cDNA template for each replicate was loaded into a 96-well plate. 10 µl of qRT-PCR reaction was performed in duplicate using miRCURY LNA SYBR Green PCR Kit (Qiagen, 339347) and read using qRT-PCR (BioRad, CFX96 Touch) according to the manufacturer’s protocol. Primers for mmu-miR-713 (MIMAT0003504) were designed and selected using miRprimer2 programme(Reference Busk46). Then, results were normalised via ΔCt method using Qiagen 5S rRNA (YP00203906) as housekeeping. Expression data were calculated using BioRad CFX Maestro software.
Statistical analysis
Microarray results were normalised, and quality controlled with miRNA QC tool of Affymetrix Expression Console 1.4 software. Samples were analysed with ebayes ANOVA and results were filtered with fold changes bigger than 2 and P-values smaller than 0·05 parameters in the Affymetrix Transcriptome Analysis Console 4.0.1 software. In summary, mice only RMA-DABG with default TAC 4.0.1 preferences were used. Targets of DE miRNA were transferred into Cytoscape plugin ClueGO 2.5.4 and Cluepedia 1.5.4 and GO analysis was performed with enrichment/depletion (two-sided hypergeometric test) with Bonferroni step-down P value correction which were accessed in May 2019. For KEGG analysis, DAVID 6.8 was used which was accessed in May 2019. Quantitative real-time PCR expression data were analysed by ΔCt method with Excel 2019 and GraphPad Prism 7 using one-way ANOVA and Tukey post hoc test. Outliers were removed using ROUT method with 2 % Q value. P value smaller than 0·05 accepted as significant. Graphics were represented as mean values with their standard error of means.
Results
To compare the effects of two different types of CR protocols, ICR and CCR, on the miRNA profile of brain tissue, a total of 1237 pre-miRNA (precursors) and 1926 mature miRNA were analysed. Among these 1237 pre-miRNA (precursors) and 1926 mature miRNA, we found that fifty-five of them were DE (> 2-fold, P < 0·05) either by different CR protocols or by ageing. Average expression (log2) of these DE miRNA in all comparisons was given in five sub-grouped K means clusters in online Supplementary Fig. S1. These five sub-groups were baseline (week 10), AL, CCR, ICR-R and ICR-RF at week 81/82 of mouse age (n 3 per group).
Effects of calorie restriction or ageing on microRNA profile in brain
Effects of calorie restriction on microRNA profile in brain
A total of twenty-eight unique miRNA and two unique precursors were DE in comparisons of the AL, CCR and ICR groups (Table 1A). Compared with the AL mice, CCR mice had four miRNA which were up-regulated and two miRNA were down-regulated, while in the ICR-R group, two miRNA were up-regulated and two miRNA were down-regulated. In the ICR-RF group, three miRNA were up-regulated and nine miRNA were down-regulated compared with the AL group (Table 1A). In addition, compared with the CCR group, one miRNA was up-regulated and seven miRNA and one precursor were down-regulated in the ICR-R group while, in ICR-RF, only two miRNA were down-regulated. Moreover, compared with the ICR-R group, one miRNA and one precursor were up-regulated while one miRNA and one precursor were down-regulated in the ICR-RF group at week 81/82. Names of DE miRNA and expression levels compared with different dietary groups are provided in Fig. 1(a).
Numbers of DE miRNA among CR application (A) and ageing (B)

List of DE miRNA between CR (a) and ageing (b) groups. miRNA are listed alphabetically. Lowest and highest fold changes are −3·84 and 4·33 for CR, and −3·48 and 2·58 for ageing. Lowest and highest fold changes represented with blue and red colours, respectively. When the comparison is done between the two groups (Group 1 v. Group 2), the first written group (Group 1) is compared with the second group (Group 2). AL, ad libitum; CCR, chronic calorie restriction; ICR, intermittent calorie restriction; ICR-RF, intermittent calorie restriction-refeeding.

Common miRNA were determined between or among the dietary groups at week 81/82 in Fig. 2(a) and (b). Compared with the AL group, there were no common miRNA found among CCR, ICR-R and ICR-RF groups; however, mmu-miR-6900-5p was common between CCR and ICR-RF compared with the AL mice (Fig. 2(a)). Specifically, compared with the AL group, mmu-miR-6900-5p levels were significantly higher in CCR and ICR-RF groups (Fig. 1(a)). Compared with the CCR mice, mmu-miR-713 was common between AL, ICR-R and ICR-RF groups (Fig. 2(a)). Level of mmu-miR-713 was significantly higher in the CCR group compared with the AL group (Fig. 1(a)). Also, the level of mmu-miR-713 was significantly lower in ICR-R and ICR-RF groups compared with the CCR group (Fig. 1(a)). In addition, mmu-miR-3075-5p was common between AL and ICR-R groups compared with the CCR group (Fig. 2(b)). Compared with the AL group, the expression level of mmu-miR-3075-5p was significantly higher in CCR mouse brain samples (Fig. 1(a)). Compared with the brain of ICR-R mice, there were no common miRNA between AL, CCR and ICR-RF groups, however, mmu-miR-503-5p was common between AL and CCR compared with the ICR-R mice. Expression of mmu-miR-503-5p was significantly lower in ICR-R mice compared with the AL and CCR groups (Fig. 1(a)). Furthermore, mmu-mir-1983 was similar between CCR and ICR-RF groups compared with the ICR-R mice and its expression was significantly lower in ICR-R mice compared with the CCR group (Fig. 1(a)). Compared with ICR-RF mice, only mmu-miR-380-5p was similar between AL and CCR mice (Fig. 2) and the expression level of mmu-miR-380-5p was significantly lower in the ICR-RF group compared with the AL and CCR groups (Fig. 1(a)).
Venn schematics represents the numbers of miRNA (a), (b) and (c) and numbers of predicted targets (d), (e) and (f) compared with the AL, CCR and compared with baseline (week 10) among CR groups. (a) and (d) miRNA and their targets compared with AL, respectively. (b) and (e) miRNA and their targets compared with CCR, respectively. (c) and (f) miRNA and their targets compared with baseline respectively. AL, ad libitum; CCR, chronic calorie restriction; ICR, intermittent calorie restriction; ICR-RF, intermittent calorie restriction-refeeding; BL, baseline.

Effects of ageing on microRNA profile in brain
Compared with week 10, a total of twenty-nine miRNA and one precursor miRNA were DE in all dietary groups at week 81/82 (Table 1B). Due to ageing, nearly all DE miRNA expression levels were decreased compared with week 10. Specifically, compared with week 10, three miRNA and one precursor were down-regulated in the older AL group, while two miRNA were up-regulated and five miRNA were down-regulated in the CCR group at week 81/82. In addition, thirteen miRNA and one precursor were down-regulated in the ICR-R group while one miRNA was up-regulated and ten miRNA were down-regulated in the ICR-RF group (Table 1B). Names of DE miRNA and their expression levels for each dietary group are given in Fig. 1(b).
Comparisons of common miRNA between specific dietary groups with ageing are shown in Fig. 2(c). Compared with week 10, there was no common miRNA found between AL, CCR, ICR-R and ICR-RF groups (Fig. 2(c)). However, at week 81/82 mmu-mir-1983 precursor miRNA was common between AL and ICR-R groups compared with their respective week 10 group (Fig. 2(c)), while its expression level was significantly lower in AL or ICR-R compared with week 10 (Fig. 1(b), P < 0·05). In addition, mmu-miR-184-3p and mmu-miR-351-5p were common between CCR and ICR-R mice compared with week 10 (Fig. 2(c)). Both mmu-miR-184-3p and mmu-miR-351-5p levels were significantly lower in CCR or ICR-R groups compared with week 10 (Fig. 1(b), P < 0·05). Moreover, mmu-miR-7019-3p expression was similar between CCR and ICR-RF groups with significantly higher expression levels compared with week 10 (Fig. 1(b), P < 0·01). Furthermore, mmu-miR-1983 and mmu-miR-7071-5p expression levels were similar between ICR-R and ICR-RF groups with significantly lower expression levels compared with their respective week 10 levels (Fig. 1(b), P < 0·05).
Targets of microRNA changed with the application of calorie restriction or by ageing
Detailed information about the number of genes targeted by DE miRNA including their validated and predicted target numbers is summarised in online Supplementary Table S1.
Targets of microRNA changed with the application of calorie restriction
Expression of several miRNA was differentially changed in both the CCR and ICR groups compared with the AL group. However, for better understanding the effects of DE miRNA in mice subjected to either ICR or CCR, it is critical to determine the targets of these miRNA. Compared with the AL group, fifty-six validated targets were identified in the CCR group. In ICR-R mice, 211 different validated targets were determined compared with the AL mice (calculated by subtracting the common miRNA from total up-regulated and down regulated miRNA) and fourteen of these were common in up-regulated and down-regulated validated targets. In ICR-RF, 104 validated targets were determined compared with the AL mice (online Supplementary Table S1A). Compared with the CCR mice, seventy-seven and thirty-one validated targets were determined in the ICR-R and ICR-RF groups, respectively (online Supplementary Table S1A). Compared with the ICR-R group, seventeen validated targets were determined in the ICR-RF mice (online Supplementary Table S1A).
On the other hand, 1036 different predicted targets were determined and 324 of these genes were up-regulated by down-regulation of miRNA and 757 were down-regulated by up-regulation of miRNA compared with the AL group. Forty-five of these predicted targets were common in up-regulated and down-regulated predicted targets. In the ICR-R mice, 1173 predicted targets were determined and 211 of which were up-regulated and 994 down-regulated compared with the AL mice. In the ICR-R group, thirty-two of these predicted targets were common in up-regulated and down-regulated targets in comparison with the AL group. For ICR-RF mice, a total of 1738 predicted targets were determined and 1210 of them were up-regulated, while 625 of them were down-regulated compared with the AL mice. In the ICR-RF group, ninety-seven of the predicted targets were common in up-regulated and down-regulated targets compared with the AL mice (online Supplementary Table S1A). Compared with the CCR mice, in ICR-R mice, a total of 1010 different predicted targets were determined and 930 of them were up-regulated and eighty-four of them were down-regulated. Four of these predicted targets were common in the ICR-R group compared with the CCR mice (online Supplementary Table S1A). In the ICR-RF mice, 289 predicted targets were determined and all of them were up-regulated compared with CCR mice (online Supplementary Table S1A). Compared with the ICR-R group, a total of 257 different predicted targets were determined and 133 of them were up-regulated and 130 of them were down-regulated in the ICR-RF group. Six of these predicted targets were common in up-regulated and down-regulated predicted targets in the ICR-RF group compared with the ICR-R group (online Supplementary Table S1A).
Comparisons of common predicted targets are shown in Fig. 2(d) and (e). Specifically, compared with the AL mice, eighty-seven of the predicted targets were common among CCR, ICR-R and ICR-RF groups and seventy-five of the predicted targets were common between CCR and ICR-R groups. In addition, 389 of the predicted targets were common between CCR and ICR-RF and 192 of the predicted targets were common between ICR-R and ICR-RF (Fig. 2(d)). Moreover, compared with the CCR group, 236 of the different predicted targets were the same among AL, ICR-R and ICR-RF groups. Two hundred and forty of these were common between AL and ICR-R groups. Three of them were common between AL and ICR-RF groups (Fig. 2(e)).
Targets of microRNA changed by ageing
Regarding the roles of DE miRNA in ageing, it is important to know their target genes in order to determine affected pathways. Compared with week 10, a total of 234 validated genes were targeted by a total of twenty-nine of the DE miRNA and one precursor in all dietary groups (online Supplementary Table S1B). Specifically, a total of two, fifty-three, 148 and thirty-one validated targets were determined to be up-regulated in AL, CCR, ICR-R and ICR-RF groups, respectively (online Supplementary Table S1B). On the other hand, a total of 3220 predicted genes were targeted by twenty-nine DE miRNA and one precursor in all dietary groups (online Supplementary Table S1B). Specifically, 426, 1562, 1521 and 889 predicted targets were determined in AL, CCR, ICR-R and ICR-RF groups, respectively (online Supplementary Table S1B).
Common predicted targets in comparisons are presented in Fig. 2(f). Compared with week 10 (BL, baseline), eleven of the predicted targets were common among the AL, CCR, ICR-R and ICR-RF groups (Fig. 2(f)). A total of thirty-three of the predicted targets were common among the AL, CCR and ICR-R groups, while a total of eleven predicted targets were common among the AL, CCR and ICR-RF groups. In addition, twelve predicted targets were common among the AL, ICR-R and ICR-RF groups, while eighty-five of the predicted targets were common among the CCR, ICR-R and ICR-RF groups (Fig. 2(f)). When two dietary groups were analysed to determine common predicted target genes, thirty-eight predicted targets were common between AL and CCR groups while thirty-seven were common between AL and ICR-R groups. On the other hand, twenty-one predicted targets were common between AL and ICR-RF groups and 394 were common between CCR and ICR-R groups (Fig. 2(f)). Moreover, 158 predicted targets were common between CCR and ICR-RF groups, while 132 of predicted targets were common between ICR-R and ICR-RF groups (Fig. 2(f)).
Gene ontology of predicted targets of microRNA with the application of calorie restriction or by ageing
In GO analysis, GO terms were grouped under biological processes, immune system process, cellular component and molecular function. Different types of CR application in mice changed several GO terms. Ageing had also modified the miRNA profile in mice brain.
Gene ontology of predicted targets of microRNA dependent upon the type of calorie restriction
Compared with the AL group, 271, 420 and 568 GO terms were significantly enriched in CCR, ICR-R and ICR-RF groups, respectively (online Supplementary Table S1C). Of these GO terms, 217 of them were common among the CCR, ICR-R and ICR-RF groups compared with the AL which includes terms like nervous system development, neurogenesis and generation of neurons. On the other hand, compared with the CCR dietary group, 227 GO terms were significantly enriched in the ICR-R group while only fifteen GO terms were significantly enriched in the ICR-RF group. Of these GO terms, presynaptic membrane terms were common among AL, ICR-R and ICR-RF groups compared with the CCR mice. The top central nervous system-related GO terms are presented in Table 2 and online Supplementary Table S2.
Gene ontology of predicted targets of miRNA in CCR group compared with the AL group. GO terms were given with their GO ids, sources, levels, percentage of associated genes and number of predicted genes that found in GO term

Gene ontology of predicted targets of microRNA affected by ageing
MicroRNA expression of AL, CCR, ICR-R and ICR-RF dietary groups was compared with week 10 results which was used as the baseline in the present study. In GO analysis, GO terms were grouped under biological processes, immune system process, cellular component and molecular function. Compared with week 10, at week 81/82 of age 20, 296, 552 and 218 GO terms were significantly enriched in AL, CCR, ICR-R and ICR-RF groups, respectively (online Supplementary Table S1C). Of these GO terms, cell morphogenesis, cell morphogenesis involved in differentiation and plasma membrane bound cell projection morphogenesis terms were common in AL, CCR, ICR-R and ICR-RF groups compared with week 10. In addition, nine GO terms including neuron development and regulation of neuron differentiation were common among AL, CCR and ICR-R groups (data were not shown). On the other hand, 157 GO terms including nervous system development and neurogenesis were common between CCR and ICR groups, while there was no common term between AL and ICR groups compared with week 10. Top central nervous system-related GO terms are provided in online Supplementary Table S3.
Pathway analysis of predicted targets changed with calorie restriction or by ageing
KEGG pathway analysis of predicted targets of DE miRNA revealed several pathways in each comparison. Several KEGG terms were changed in mouse brains by either ICR or CCR.
Pathway analysis of predicted targets changed with the calorie restriction
Five KEGG pathways including glutamatergic synapse and circadian entrainment were significantly enriched according to Bonferroni P value correction when the brain samples from the CCR group were compared with those of the AL group (Table 3). In the ICR-R group, six KEGG pathways including signalling pathways regulating pluripotency of stem cells and axon guidance were significantly enriched while in ICR-RF, sixteen KEGG pathways including mTOR and AMPK signalling pathways were significantly enriched compared with the AL diet. On the other hand, compared with the CCR mice, Jak-STAT and sphingolipid signalling pathways were significantly enriched in the ICR-R group (online Supplementary Table S4). In ICR-RF, dopaminergic and glutamatergic synapse pathways were significantly enriched compared with ICR-R. Top KEGG pathways are shown in Table 3 and online Supplementary Table S4.
KEGG pathway analysis of predicted targets of DE miRNA in CCR group compared with the AL group. KEGG pathways were given with their term ID, number of predicted genes that found in KEGG pathway, percentage of associated genes and genes

Pathway analysis of predicted targets changed by ageing
Compared with week 10, there were no significantly enriched pathways found in AL, CCR and ICR-RF groups at week 81/82. However, compared with week 10, a total of nineteen KEGG pathway terms including axon guidance and neurotrophin signalling pathways were significantly enriched according to Bonferroni P value correction in the ICR-R group at week 81/82. The top ten KEGG pathways for the ICR-R group are given in online Supplementary Table S5.
Functional enrichment analysis of common predicted targets changed with either calorie restriction or ageing
Functional enrichment analysis of common predicted targets changed with calorie restriction
Various miRNA and their predicted targets were common in each dietary group. There were 236 common predicted targets of miRNA among the dietary groups (Fig. 2(e)). Compared with the AL group, FE analysis of common predicted targets between CCR and ICR-R groups revealed that the ones identified are mainly important in transcription regulation and dendritic synapses (online Supplementary Table S6). FE analyses revealed that predicted targets involved in transcription regulation and nervous system development were changed in brains of CCR mice compared with the AL, ICR-R or ICR-RF groups (online Supplementary Table S6). In addition, compared with the CCR and ICR-R groups, ClueGO enrichment on common predicted targets including regulation of dendritic spine development and Alzheimer’s disease related terms and pathways was significantly enriched (online Supplementary Fig. S2) in the AL group. On the other hand, compared with the CCR group, ClueGO enrichment on common predicted targets among AL, ICR-R and ICR-RF groups revealed that there are seventeen different significantly enriched targets including dopaminergic synapse, regulation of dendrite development and Alzheimer’s disease related terms and pathways which are listed in online Supplementary Fig. S3.
Functional enrichment analysis of common predicted targets changed by ageing
Regarding the ageing effect, numbers of miRNA and their predicted targets were common in each dietary group. FE of predicted targets was performed in common predicted targets of CCR and ICR-R dietary groups at week 81/82 compared with week 10 as indicated in Fig. 2(f) and revealed that these common predicted targets were involved in transcription regulation, Zn finger ion interaction, cell cycle, cell division, differentiation and chromatin regulation (online Supplementary Table S7). Additionally, ClueGO enrichment of common predicted targets of CCR and ICR-R dietary groups at week 81/82 compared with week 10 indicated that twenty-five different clusters including mitogen-activated protein kinase (MAPK) signalling, insulin and cytokine signalling related terms and pathways were significantly enriched (online Supplementary Fig. S4).
Functional enrichment analysis of mmu-miR-713
Both types of CR and ageing resulted in differential expression of fifty-three miRNA and two precursors in the present study. Of the fifty-three mature miRNA, twenty-eight of them and two precursors were DE with CR (Table 1). In these twenty-eight miRNA, expression of mmu-miR-713 which had 233 predicted targets was significantly higher in the CCR group compared with the AL, ICR-R and ICR-RF groups at week 81/82 (Fig. 1, P < 0·05). In addition, the level of mmu-miR-713 in the CCR group at week 81/82 was similar to that of week 10 (Fig. 1, P > 0·05). In other words, mmu-miR-713 level in the CCR group was not altered by ageing.
In this context, transcription regulation, Golgi apparatus, neurogenesis, endoplasmic reticulum and fibronectin functions were functionally enriched as predicted targets of mmu-miR-713. The top three enrichment results for mmu-miR-713 are listed in online Supplementary Table S8. In addition, predicted target genes for mmu-miR-713 that were functionally enriched in ClueGO revealed that regulation of axonogenesis, dopaminergic synapse, prolactin signalling, presynaptic membrane and several other pathways and terms were significantly enriched (online Supplementary Fig. S5).
In addition to mmu-miR-713, mmu-miR-184-3p and mmu-miR-351-3p expressions were significantly lowered with either CCR or ICR-R interventions compared with values obtained at week 10 (Fig. 1(b)). FE of these common predicted targets in CCR or ICR-R compared with week 10 indicated that transcription regulation, cell cycle, differentiation, chromatin regulator, axonogenesis, cytokine, vascular endothelial growth factor (VEGF), MAPK, insulin signalling and several other pathways/terms were significantly enriched. Out of 394 targets, 359 common predicted targets were indicated for mmu-miR-184-3p and mmu-miR-351-5p. VEGF and insulin signalling were up-regulated by down-regulation of mmu-miR-184-3p and mmu-miR-351-5p in the CCR and ICR-R groups.
Validation of mmu-miR-713
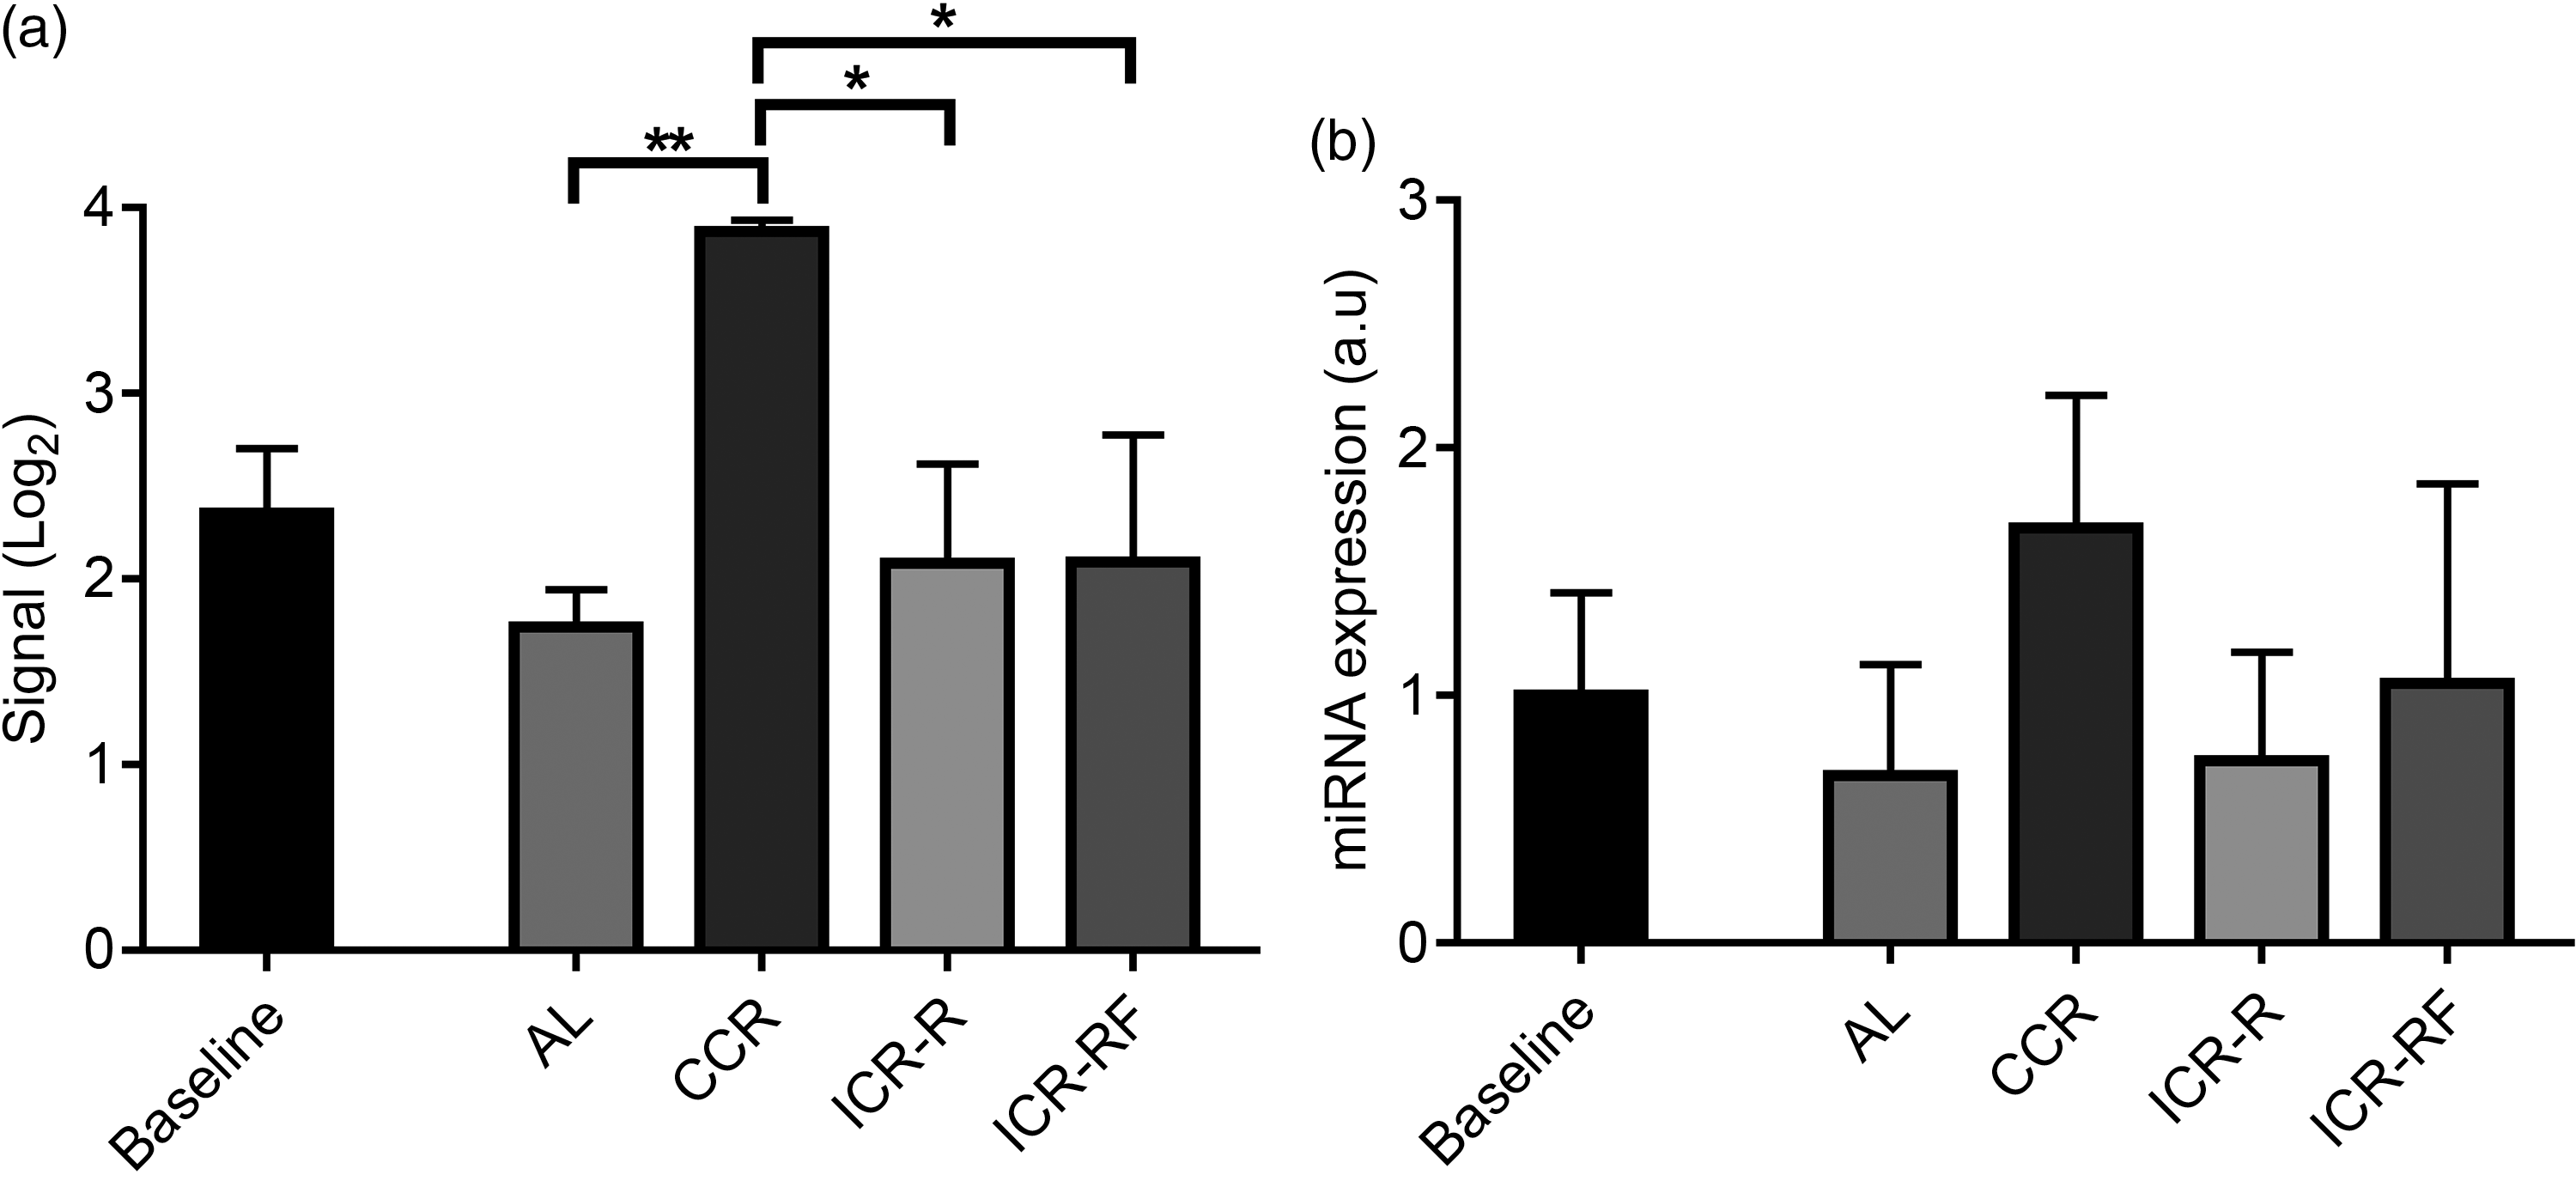
Because results of FE analysis results showed that the target genes for mmu-miR-713 were related to neurogenesis, mmu-miR-713 was selected for miRNA validation. Results of miRNA array showed significantly higher mmu-miR-713 levels in the brain of CCR mice compared with any of AL, ICR-R or ICR-RF groups at week 81/82 (Fig. 3(a), P < 0·05). In the CCR group, mmu-miR-713 level was also increased with ageing while there was no change of its level in other dietary groups by ageing from week 10 to week 81/82 (Fig. 3(a), P < 0·05). In line with these results, validation performed by RT-PCR analyses confirmed that mmu-miR-713 levels were higher in the CCR group compared with the other dietary groups although it was not statistically significant (Fig. 3(b)).
Validation of miRNA array result for mmu-miR-713 levels using RT-PCR. Levels of mmu-miR-713 were measured using miRNA array (a, n 3) and RT-PCR (b, n 3–5) at 10 (baseline) and 81/82 weeks of mouse age. Results were given as mean values with their standard error of means, and P < 0·05, and < 0·01 were represented as * and **, respectively. AL, ad libitum; CCR, chronic calorie restriction; ICR, intermittent calorie restriction; ICR-RF, intermittent calorie restriction-refeeding.
Discussion
In the present study, the effects of two different long-term CR protocols (CCR or ICR) on miRNA profiles in mouse brain were studied to better understand the impact of CR on miRNA expression levels in this tissue. We also assessed genes and signalling pathways that might be involved in the protective mechanism of CR on brain functions. In addition, the expression of miRNA at a young adult age (10 weeks old) and an old age (81/82 weeks) was determined to understand possible mechanisms and regulated genes in mouse brain tissue due to ageing. Results from our group previously revealed that CCR displays better preventive effects than that of ICR for neurodegeneration(Reference Atalay47). Similar results were reported in the literature. For example, research conducted in Brown Norway rats and C57BL/6 mice demonstrated that CR more than 50 weeks positively regulated neuroprotection and enhance lifespan by regulating chromatin and histone-related genes via miRNA including miR-98-3p and miR-34 in brain and as well as liver(Reference Wood, van Dam and Craig13,Reference Green, Huang and Dou26) . These researchers concluded that CR-regulated expression of miRNAs might be important for longevity and neural survival(Reference Hadem, Majaw and Kharbuli2,Reference Dogan, Johannsen and Grande33,Reference Shetty, Hattiangady and Shetty48,Reference Victoria, Nunez Lopez and Masternak49) . Furthermore, Csiszar et al. showed that 2 years of 40 % CR in male F344xBN rats decreased expression of miR-144 that targeted Nrf2 in cerebromicrovascular endothelial cells, thus preserving a young phenotype by retaining anti-inflammatory, antioxidative and pro-angiogenic effects(Reference Csiszar, Gautam and Sosnowska50). Finally, it has been shown that 2 years of 40 % CCR decreased expression of miR-34a, miR-30e and miR-181a* in an age-dependent manner in brain and mediated neuronal survival via regulation of these miRNA in long-lived CR mice(Reference Khanna, Muthusamy and Liang29). Although, recent studies suggested that CR has protective effects on ageing by regulating miRNA in brain, which and how miRNA in brain are regulated due to the type of CR restriction has not been studied. In addition, our results suggest that CR, specifically 15 % CCR has better protective effects on whole brain compared with 15 % ICR implemented by 1 week of 60 % CR followed by AL feeding for 3 weeks in a cyclical manner from 10 to 81/82 weeks of age.
To investigate the effects of two types of CR in mouse brain on the mRNA profile and the correlation between miRNA and its target mRNA expression, Gene Expression Omnibus datasets were investigated. There is limited research using brain samples obtained from CR mice(Reference Barger, Vann and Cray51–Reference Schafer, Dolgalev and Alldred53). Two of the previous studies used the hippocampus while the other one used neocortex(Reference Barger, Vann and Cray51–Reference Schafer, Dolgalev and Alldred53). In C57BL/6 mice 25 % CR starting at 8 weeks of age for 6 six weeks followed by 40 % CR until 22 weeks of age did not change mRNA levels in neocortex compared with the control group(Reference Barger, Vann and Cray51). However, in another study, mice were calorie restricted by 30 % by reducing carbohydrate consumption starting at two and a half months of age until 15 months of age. It was reported that 30 % CR modulated Ca signalling and axonal guidance signalling-related genes and suppressed age-dependent transcriptional changes by regulating transcription factors(Reference Schafer, Dolgalev and Alldred53). Likewise, our study conducted in whole brain samples showed that CCR modulated expression of miRNA that target axonogenesis and Ca signalling-related pathways. In another study, CR increased neuroprotective factors, heat shock proteins and improved learning and memory-related genes. Moreover, it was reported that CR ameliorated and suppressed hippocampal ageing especially in the CA1 sector. In another study, 20 % CR in mice starting at 3 months until 15 months of age positively regulated longevity, dendrite morphogenesis, synapse functioning and neuronal development-related gene expressions with up-regulation of 237 genes and down-regulation of 238 genes in hippocampus of mice compared with those fed AL(Reference Wahl, Solon-Biet and Wang52). In addition, CR had beneficial effects on nutrient sensing pathways with increasing SIRT1 expression and decreasing mTOR activation compared with AL fed C57BL/6 mice 12–15 months of age(Reference Wahl, Solon-Biet and Wang52). Moreover, dendritic spine density in the dentate gyrus was increased and cognitive and behavioural functions were improved by CR(Reference Wahl, Solon-Biet and Wang52). It should be noted that all these studies applied CCR, not the ICR type. In the majority of studies, changes in hippocampal gene expression levels and positive regulation of neurogenesis and neuroprotection-related gene expressions following CR have been reported. These results are in line with our current findings which indicate CR regulates gene expression and ameliorates ageing effects by regulating the miRNA profile in the brain. We cannot compare the effects of ICR on the miRNA profile in brain in the present study with the previous findings because no study has been reported using this type of protocol. It should be also noted that there are no standard feeding protocols for the ICR application in studies. The better application protocol is still being investigated. However, to our knowledge, the present study is the first one to report the effects of ICR on the miRNA profile in brain.
In the present study, CCR mice had lower mammary tumour incidence rate, mammary tumour weight and higher survival rate compared with either the AL or ICR groups(Reference Dogan, Cicekdal and Ozorhan35). Because of improved effects of CCR on animal health and longevity, we investigated whether the beneficial effects of CCR types of CR were related to miRNA regulation in the brain. It should be noted that in the present study brain samples from mice which did not develop mammary tumour were used. However, all these mice had overexpressed TGFα gene in their mammary tissue. Our results revealed that several miRNA including mmu-miR-713 that target neurogenesis and synapse formation were higher in the CCR mice compared with the AL and ICR groups in the brain tissue. These DE miRNA and previous results indicated that CCR showed better protective effects compared with the ICR application.
In a previous study, increased expression levels of mmu-miR-713 were reported in serum samples of diet-induced obesity male mice fed a high-fat diet for 12 weeks compared with the normal diet fed C57BL/6 mice(Reference Hsieh, Rau and Wu54). Another study performed in cell culture reported a down-regulation of mmu-miR-713 by oxidative stress in primary mouse hippocampal neuron culture and they indicated that mmu-miR-713 could play an important role in neurodegenerative diseases such as Alzheimer’s disease(Reference Xu, Zhang and Niu55). However, the previous studies have been carried out with either neuronal cell culture or serum samples, not in tissue samples. Moreover, mmu-miR-184-3p and mmu-miR-351-5p were significantly lower in the CCR and ICR-R groups compared with the week 10 baseline values. It is reported that exosomal mmu-miR-184-3p levels were significantly increased in blood of 12-month-old compared with 3-month-old C57BL6 mice. These authors proposed that mmu-miR-184-3p is a candidate for ageing(Reference Lee, Kim and Choi56). However, in our research expression level of mmu-miR-184-3p was lower in both CCR and ICR-R mice compared with the young 10-week-old mice which could indicate a positive effect of CR on ageing. In addition, research conducted on intestinal ischaemia in Wistar rats reported that mmu-miR351-5p decreases expression of MAPK13 and sirtuin 6 and promotes inflammation and apoptosis as well as causing oxidative stress. Our results indicate that CCR and ICR-R could provide beneficial effects including anti-ageing effects by down-regulating mmu-miR-184-3p and mmu-miR-351-5p. On the other hand, results from the present study show that mmu-miR-713, mmu-miR-184-3p and mmu-miR-351-5p in brain could be important in neuroprotection by regulating neurogenesis and other related pathways. Regulation of these miRNA may also play important roles in the protective effects of CR and also could be potential targets for the drug development for use in neurodegenerative and ageing-related diseases.
Conclusion
In conclusion, regulation of miRNA in brain may play important roles in the protective effects of CR for ageing and age-related health problems. Results from our group previously have revealed that CCR has a better preventive effect than that of ICR for neurodegeneration. In addition, the present study suggests that CCR may exert its protective effects by increasing expressions of mmu-miR-713 and decreasing expression of mmu-miR-184-3p and mmu-miR-351-5p, since they are shown to play roles in neurogenesis, neuronal survival, axon guidance, chromatin and histone regulation. These three miRNA could be potential targets for drug development for use in neurodegenerative and ageing-related diseases. However, further studies are needed to confirm and elucidate the roles of these miRNAs in the protective effects of CR in brain, especially by ICR.
Acknowledgements
The authors thank Emre C. Tuysuz for his technical support during miRNA analyses. The authors also thank Batuhan M. Kalkan, Burak Demir, Ozan Şen, Büşra T. Kazan, İlker Çoban, Göktug Karabıyık and Mustafa E. Özer for helping daily mice feeding and handling. Finally, the authors thank the veterinarian and animal technicians who handled the animals at Yeditepe University Animal Facility (YUDETAM).
This work was financially supported by Scientific and Technological Research Council of Turkey (TUBITAK grant # 119S238). No other support from any commercial or not-for-profit sectors.
S. D., B. G. T., M. P. C., O. F. B., A. K. and P. B. D. conceived the study and designed the experiments. M. B. C., U. O. and S. D. performed experiments and acquired data. U. O., M. B. C., S. D., B. G. T., O. F. B. and B. Y. analysed and interpreted data. S. D., M. B. C., U. O., B. G. T. and O. F. B. wrote the first draft of the manuscript. P. B. D., A. K. and M. P. C. critically revised the manuscript. S. D. and B. G. T. supervised the project.
There were no conflict of interest to declare by any of the authors.
Supplementary material
For supplementary material referred to in this article, please visit https://doi.org/10.1017/S0007114521001239


 Open access