


The Lower Mississippi Delta (LMD) region is a sparsely populated and highly agricultural area encompassing the alluvial plain of the Mississippi River in the states of Arkansas, Louisiana and Mississippi. The highly impoverished LMD region has long suffered from disproportionately high rates of obesity, diabetes, hypertension and other chronic diseases. Behavioral Risk Factor Surveillance System (BRFSS) data from the early 1990s revealed that 31·3 % of residents in the LMD region were obese, 6·9 % reported diabetes and 28·9 % reported hypertension(Reference Smith, Lensing and Horton1). A 2007 BRFSS oversample of LMD counties in Mississippi revealed that obesity, diabetes and hypertension rates had risen to 37·0 %, 12·2 % and 36·5 %, respectively(Reference McAnally2).
The high prevalence of obesity and chronic disease in the LMD may be due in part to dietary patterns among LMD residents, which differ from those of the US population as a whole(Reference Tucker, Maras and Champagne3). For example, both African American (AA) and white LMD residents consume fewer servings of fruits and vegetables compared to national averages for their respective races(Reference Champagne, Bogle and McGee4). Additionally, twenty-four regional foods contributing at least 0·5 % to energy and selected nutrient intakes were found among LMD residents that were uncommon in the overall US diet(Reference Tucker, Maras and Champagne3).
Designing dietary modifications to increase adherence to the Dietary Guidelines for Americans (DGA) in a given population requires not only measurement of DGA adherence, but also knowledge of the top food sources corresponding to specific DGA inadequacies for that population. This information is critical for developing culturally sensitive dietary modifications that will be acceptable to the target population. Furthermore, dietary interventions need to be tailored to account for differences in food choices that may be related to sex, race/ethnicity, education and income if interventions are to have a broad impact in the target region. The objectives of the present study were to evaluate diet quality among LMD residents using the Healthy Eating Index-2005 (HEI-2005) and to determine the top five dietary sources contributing to HEI-2005 components. Demographic differences in HEI-2005 scores were also investigated.
Experimental methods
Study population
Analyses were performed using data from the Foods of Our Delta Study 2000 (FOODS 2000), a cross-sectional telephone survey of residents in the thirty-six-county LMD region which was conducted from January to June 2000(Reference Champagne, Bogle and McGee4). FOODS 2000 used list-assisted random-digit dialling and a two-stage stratified cluster sampling plan. Demographic information was collected during an initial interview. Dietary intake data were collected using the US Department of Agriculture (USDA) 24 h recall multiple-pass methodology at an unscheduled follow-up telephone interview with the assistance of a foods measurement guide. FOODS 2000 collected dietary intake data on 1751 adults and 485 children. A more detailed description of the FOODS 2000 methodology may be found elsewhere(Reference Champagne, Bogle and McGee4). The procedures followed in FOODS 2000 were in accordance with ethical standards and approval was obtained from the institutional review board of Westat, Rockville, MD. For the present study, only the adult data (participants 18 years of age or older) were analysed. Additionally, only plausible dietary records were used in the analyses. Dietary intake plausibility was based on the following criterion: 2093 kJ (500 kcal) ≤ intake ≤ 25 121 kJ (6000 kcal)(Reference Willett5).
The Healthy Eating Index-2005
The Healthy Eating Index-2005 (HEI-2005) is a scoring method designed to measure adherence to the 2005 DGA(Reference Guenther, Reedy and Krebs-Smith6). The HEI-2005 is composed of twelve components corresponding to total fruit (including 100 % fruit juice), whole fruit, total vegetables, dark green and orange vegetables and legumes (GOV&L), total grains, whole grains, milk, meat and beans, oils, saturated fat, sodium, and energy from solid fats, alcoholic beverages and added sugars (SoFAAS). The total score, calculated as the sum of the component scores, has a maximum value of 100. Component scores are calculated using a density approach per 4187 kJ (1000 kcal) or as a percentage of energy, and range from 0 to 5 for fruit, vegetables and whole grains components; from 0 to 10 for milk, meat and beans, saturated fat and oils components; and from 0 to 20 for the SoFAAS component. For each component, higher scores reflect better adherence to DGA recommendations corresponding to that component. For fruit, vegetables, grains, meat and beans, and milk components, each score is based upon MyPyramid equivalents consumed per 4187 kJ (1000 kcal). Oils and sodium component scores are calculated based upon grams consumed per 4187 kJ (1000 kcal). Saturated fat and SoFAAS component scores are calculated based upon percentage of energy intake attributed to these energy sources. MyPyramid equivalents were derived using version 1·0 of the MyPyramid Equivalents Database, which provides equivalents per 100 grams for each unique USDA six-digit food code(Reference Friday and Bowman7).
Identification of top food sources overall and by demographic characteristics
For HEI-2005 component scores corresponding to total fruit, total vegetables, total grains, whole grains and SoFAAS, the top five food sources for the LMD adult population were identified by estimating and ranking the mean number of MyPyramid equivalents consumed from each food source category. This was done for the adult sample as a whole and within specific demographic groups. These five HEI-2005 components were chosen due to their relevance to obesity prevention and their potential for modification in this population. Food sources were categorized based on food groupings corresponding to three-digit USDA food codes(8). Food codes were combined only for the four categories identified as ready-to-eat (RTE) cereals since the cereals within these four categories were very similar.
Data analysis
All statistical analyses were performed using SAS® version 9·2 (SAS Institute, Inc., Cary, NC, USA) and SUDAAN® version 10·0·1 (Research Triangle Institute, Research Triangle Park, NC, USA) statistical software packages. SAS survey and SUDAAN procedures were used to compute frequencies, means and their associated confidence intervals, as well as to perform the regression analysis. These procedures are tailored to account for the complex sampling design used in FOODS 2000. Hence the results are weighted and should be considered representative of the adult LMD population. The population ratio method was used to compute mean HEI-2005 scores and corresponding 95 % confidence intervals using jackknife variances for the overall population. This method computes scores using the ratio of the weighted sum of MyPyramid equivalents for the relevant HEI-2005 component to the weighted sum of energy intake for the entire population. It is the least biased way to estimate a mean HEI-2005 score for a population(Reference Freedman, Guenther and Krebs-Smith9).
Using linear models, HEI-2005 total and component score least-squares means were estimated for each demographic group while simultaneously adjusting for all other demographic variables. Demographic variables included sex (male or female), age group (18–29, 30–39, 40–59 or ≥60 years), race (white or AA), income level (<$US 15 000, $US 15 000–29 999 or ≥$US 30 000) and education level (<high school (did not graduate high school), high school (high school graduate) or >high school (any college or technical school)). The computation of the multivariable-adjusted HEI scores was based on the mean of individual scores rather than the mean of the population. This method tends to underestimate most HEI-2005 component scores compared to the population ratio method(Reference Freedman, Guenther and Krebs-Smith9). For the demographic variables with more than two levels (age, income and education), post hoc pair-wise comparisons were performed using least-squares means with Tukey–Kramer multiple comparisons adjustments.
Results
Results are presented for the 1689 LMD adult respondents in FOODS 2000 with plausible dietary records. This LMD population was composed of 47·5 % males, 42·8 % AA, and 20·7 % were less than 30 years of age while 23·3 % were greater than 60 years of age. Almost a quarter (23·1 %) of the population earned less than $US 15 000 per annum and 23·2 % had less than a high school education. The HEI-2005 total score for the population was 54·5 (Table 1).
Healthy Eating Index-2005 (HEI-2005) multivariable-adjusted total and component scores for Lower Mississippi Delta adults overall and by demographic characteristics (n 1689)

GOV&L, dark green and orange vegetables and legumes; SoFAAS, solid fats, alcoholic beverages and added sugars; AA, African Americans.
Mean values for the total sample were computed using the population ratio method.
Mean values are least-squares means of individual scores adjusted for all other demographic variables.
a,b,c,dMean values within a column for categories of a characteristic with unlike superscript letters were significantly different using the Tukey–Kramer method for multiple comparisons (P < 0·05). Mean values without superscript letters were not compared with one another owing to non-significance of the effect in the model.
Demographic differences in Healthy Eating Index-2005 scores
As shown in Table 1, HEI-2005 total mean scores were higher for females (48·9) and older adults (53·9 for ≥60 years of age) compared to males (46·6) and younger adults (44·5 for 18–29 years of age), respectively. Total fruit mean scores were higher for females (1·8), AA (2·0), older adults (2·7 for ≥60 years of age) and those with at least a high school education (1·8 for high school education and 2·0 for >high school education) compared to males (1·6), whites (1·4), younger adults (1·4 for 18–29 years of age) and those without a high school education (1·4), respectively. Whole fruit mean scores also differed by sex and age in a manner similar to total fruit. Total vegetables mean scores were higher for the oldest age (2·5) compared to the youngest age group (2·1) and for those with more than a high school education (2·5) compared to those with less than (2·2) or a high school education (2·2). Higher mean scores for GOV&L, total grains and whole grains were associated with older age. Additionally, total grains mean scores were higher for AA (4·2) compared to whites (4·1), while whole grains mean scores were associated with a higher education level. Higher milk mean scores were observed for whites (4·2) compared to AA (3·1) and for both younger (3·8) and older adults (4·5) compared to middle-aged adults (3·2 for 30–39 years of age and 3·1 for 40–45 years of age). Meat and beans, saturated fat and sodium mean scores did not differ demographically among LMD residents. Oils mean scores were higher for whites (6·1) and younger adults (5·9) compared to AA (5·1) and older adults (5·1), respectively. Higher SoFAAS mean scores were observed for females (7·7) compared to males (6·6), older (10·3) compared to younger adults (5·2) and those in the highest income group (7·9) compared to the middle group (6·7).
Top food sources for selected Healthy Eating Index-2005 components overall and by demographic characteristics
Total fruit and total vegetables components
The top five sources for total fruit (Table 2) were citrus juices (35·6 %), non-citrus fruits (excluding berries; 32·4 %), non-citrus juices (10·5 %), citrus fruits (7·8 %) and fruit drinks (4·7 %) for the LMD adult population as a whole. While these remained the top five sources across demographic groups, differences existed in the ranking of the sources. Sex and income differences occurred in the order of the top two sources, while racial differences were seen in the order of the top four sources. Age differences were observed for the order of these top sources, while the only education differences were in the order of the third and fourth sources.
Top five dietary sources contributing to the Healthy Eating Index-2005 (HEI-2005) total fruit component score in Lower Mississippi Delta adults overall and by demographic characteristics (n 1689)
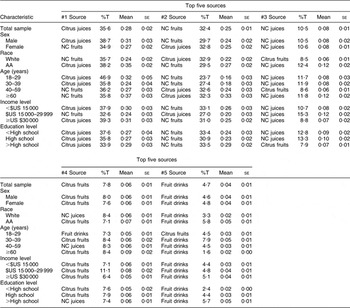
%T, percentage of HEI-2005 component MyPyramid equivalents; AA, African Americans; NC, non-citrus (excludes dried fruits and berries).
The top five sources for total vegetables (Table 3) were cooked vegetables (13·2 %), raw vegetables (12·3 %), fried potatoes (8·6 %), grain mixtures (including burritos, tacos, pizza, spaghetti, and pasta and rice dishes; 8·1 %) and potato chips (and sticks; 5·9 %) for the LMD adult population as a whole. Two of the top five sources for males and AA consisted of fried potato variations, fried potatoes (10·2 % and 9·7 %, respectively) and potato chips (7·0 %, and 10·2 %, respectively). For females and whites, only one of the two variations was fried, fried potatoes (6·8 % and 7·9 %, respectively); the other was mashed potatoes (5·4 %) and baked/boiled potatoes (6·3 %), respectively. For the three younger age groups, three of the five top sources consisted of some type of potato or grain mixture, while four of the five top sources were some type of vegetable or vegetable soup for the oldest age group. Three of the top five total vegetables sources were potato-based for the lowest income group, while only two top sources were potato-based for the two higher income groups. Four of the top five sources were the same for all three education groups except for their orders.
Top five dietary sources contributing to the Healthy Eating Index-2005 (HEI-2005) total vegetables component score in Lower Mississippi Delta adults overall and by demographic characteristics (n 1689)

%T, percentage of HEI-2005 component MyPyramid equivalents; AA, African Americans; veg, vegetables (other than white potatoes, dark green and deep yellow vegetables, tomatoes, lettuce, green beans, corn, peas, lima beans and their mixtures); DGL veg, dark green leafy vegetables.
Total grains and whole grains components
The top five sources for total grains (Table 4) were white breads (and rolls; 23·6 %), grain mixtures (10·2 %), sandwiches (with meat; 8·1 %), cooked cereals and rice (7·1 %) and salty snacks (including corn/tortilla chips, popcorn, and pretzels; 6·3 %) for the LMD adult population as a whole. The only sex difference was in the order of the sources. Racial differences existed in the third, fourth and fifth sources, which were sandwiches (7·3 %), salty snacks (6·2 %) and biscuits (5·2 %) for whites and cooked cereals and rice (9·2 %), sandwiches (9·2 %) and cornbread (6·4 %) for AA. The only age differences among the three younger age groups were in the order of the fourth and fifth sources. In the oldest age group, the third, fourth and fifth sources – wheat breads, cornbread and biscuits – were not top sources for the other three age groups. The top five sources were the same for both the middle and highest income groups, while the lowest income group differed from the other two in the order of the second, third and fourth sources. Additionally, for the lowest income group, the fifth source was wheat breads, while it was cooked cereals and rice for the other two income groups. Four of the top five sources were the same for all three education groups except for their orders.
Top five dietary sources contributing to the Healthy Eating Index-2005 (HEI-2005) total grains component score in Lower Mississippi Delta adults overall and by demographic characteristics (n 1689)

%T, percentage of HEI-2005 component MyPyramid equivalents; AA, African Americans; B&R, breads and rolls; CC&R, cooked cereals and rice.
The top five sources for whole grains (Table 5) were cooked cereals and rice (24·0 %), RTE cereals (22·5 %), salty snacks (20·7 %), wheat breads (and rolls, not whole wheat; 15·1 %) and pancakes (2·9 %) for the LMD adult population as a whole. Four of the top five sources were similar for males and females except for their ranking. The fifth top source was pancakes for males and whole wheat breads for females. The top four sources were the same for whites and AA except for their order. The fifth top source was non-sweet crackers for whites and pancakes for AA. The top source for the two youngest age groups was RTE cereals (44·2 % and 29·8 %, respectively), while the top source was salty snacks (26·6 %) for adults aged 40–59 years and cooked cereals and rice (36·4 %) for those ≥60 years of age. Whole wheat breads were a top source only for those ≥60 years of age. The top source was cooked cereals and rice for the lowest and highest income groups (25·9 % and 26·5 %, respectively), while the top source was salty snacks for the middle income group (28·3 %). The four top sources were the same for all three education groups except for their ranking. The fifth source was pancakes for the lowest education group, sweet crackers for the middle education group and non-sweet crackers for the highest education group.
Top five dietary sources contributing to the Healthy Eating Index-2005 (HEI-2005) whole grains component score in Lower Mississippi Delta adults overall and by demographic characteristics (n 1689)
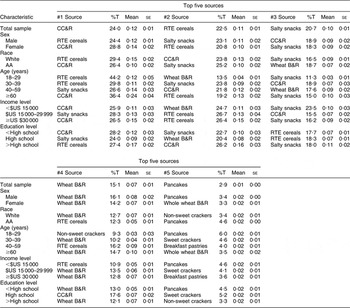
%T, percentage of HEI-2005 component MyPyramid equivalents; AA, African Americans; CC&R, cooked cereals and rice; RTE, ready-to-eat; B&R, breads and rolls.
Solid fats, alcoholic beverages and added sugars component
The top five sources for SoFAAS (Table 6) were soft drinks (19·0 %), beers and ales (4·7 %), processed meats (including frankfurters, sausages, luncheon meats and meat spreads; 4·0 %), grain mixtures (3·9 %) and cakes (3·6 %) for the LMD adult population as a whole. Soft drinks remained the top source for all demographic groups, ranging from 10·3 % for adults ≥60 years of age to 24·3 % for those 18–29 years of age. Similar to the total sample, beers and ales were the second top source for males, whites, adults aged 30–59 years, the highest income group and the lowest education group. For females, AA, the lowest income group and the middle education group, the second top source was processed meats. Fruit drinks, milk, cakes and grain mixtures were the second top source for adults aged 18–29 years, those ≥60 years of age, the middle income group and the highest education group, respectively. The third, fourth and fifth top sources varied across groups and included: cakes, fried potatoes and processed meats for males; grain mixtures, cookies and fruit drinks for females; tea, cakes and grain mixtures for whites; fruit drinks, beers and ales, and grain mixtures for AA; grain mixtures, fried potatoes and sandwiches for those 18–29 years of age; grain mixtures, tea and fried potatoes for those 30–39 years of age; processed meats, cakes, and cookies for those 40–59 years of age; processed meats, frozen milk desserts and cakes for those ≥60 years of age; beers and ales, fruit drinks and cookies for the lowest income group; processed meats, beers and ales, and sugars for the middle income group; grain mixtures, fried potatoes and tea for the highest income group; candies, processed meats and fruit drinks for the lowest education group; beers and ales, tea and grain mixtures for the middle education group; and cakes, beers and ales, and fried potatoes for the highest education group.
Top five dietary sources contributing to the Healthy Eating Index-2005 (HEI-2005) solid fats, alcoholic beverages and added sugars (SoFAAS) component score in Lower Mississippi Delta adults overall and by demographic characteristics (n 1689)

%T, percentage of HEI-2005 component energy intake; AA, African Americans; Proc meats, processed meats (frankfurters, sausages, luncheon meats and meat spreads); FM desserts, frozen milk desserts.
Discussion
While adherence to the DGA 2005 using the HEI-2005 has been estimated within the US population as a whole and among demographic subsets(Reference Guenther, Juan and Lino10–Reference Juan, Guenther and Kott12), few studies have applied the HEI-2005 to regional US populations(Reference Savoca, Arcury and Leng13). When examining total and component HEI-2005 scores by demographic characteristics within the LMD population, younger age was the most important determinant of low diet quality. HEI-2005 total, total fruit, whole fruit, total vegetables, GOV&L, total grains, whole grains and SoFAAS scores declined with decreasing age. Previous studies in the LMD have focused on dietary pattern differences by race, income or food security status, with less attention given to the implications that age has on dietary intake(Reference Champagne, Bogle and McGee4, Reference Champagne, Casey and Connell14, Reference McCabe-Sellers, Bowman and Stuff15). The present study's findings suggest that race and income may have smaller effects on diet quality when considered in conjunction with other demographic characteristics, such as age. Tailoring educational messages to age-specific groups may be more critical to the success of a dietary intervention than targeting groups delineated by race or socio-economic status in the LMD region.
Unlike previous applications of HEI-2005 that simply focus on total and component scores(Reference Guenther, Juan and Lino10–Reference Savoca, Arcury and Leng13), the current unique investigation of top dietary sources contributing to HEI-2005 components provides insight into strategies and messages that could improve the diet quality and health of a region. Although some messages are appropriate for the entire LMD population, others may be more appropriate for specific demographic groups. All five of the demographic variables considered had an effect on food consumption patterns. For sex and race, ten of thirty and twelve of thirty-one top foods differed between males and females, and between whites and AA, respectively. For age, twenty-one of forty-two top foods differed among the four age groups. For income and education, fourteen of thirty-five and fourteen of thirty-three top foods differed among the three income groups and the three education groups, respectively. Interestingly, one food (biscuits) and one beverage (sweet tea), identified as regional foods for the LMD(Reference Tucker, Maras and Champagne3), were top dietary sources for the total grains and SoFAAS components, respectively. This highlights the importance of taking cultural food preferences into account when designing dietary interventions.
Regarding the targeting of dietary modifications, the substitution of more healthful foods or preparations for less healthful ones may work well in this population. Substitutions should account for not only the type of food, but the timing and location of meals as well. For example, the consumption of more whole fruits and less fruit juices and drinks should be encouraged for the entire LMD adult population, with perhaps stronger emphasis for males, AA and those less than 40 years of age. Substituting whole fruits for fruit drinks is an especially important message since fruit drinks contain little fruit juice while contributing a significant amount of added sugar to the diet. Similarly, the consumption of vegetables other than white potatoes, particularly French fries and potato chips, should be encouraged for the entire LMD population, with added focus on those less than 30 years of age and those in the lowest income group. This substitution will not only help to reduce the amount of saturated fat in the diet, a DGA 2010 recommendation(16), but also help to increase the variety of vegetables being consumed, particularly if the consumption of healthy preparations of culturally acceptable vegetables such as sweet potatoes and collard greens are encouraged. However, because foods such as French fries are often consumed outside the home, typically at fast-food restaurants, a more suitable substitution may be a side salad, which is available at most fast-food establishments. In a large, prospective cohort of middle-aged women, the intake of fruit juice was found to be positively associated with the development of diabetes, while the intake of whole fruit and leafy green vegetables had an inverse association(Reference Bazzano, Li and Joshipura17). Further, evidence suggests that eating whole fruit (v. fruit puree or juice) at the start of a meal can be an effective strategy for increasing satiety and decreasing energy intake(Reference Flood-Obbagy and Rolls18).
The presence of salty snacks as a top food source for both total and whole grains deserves particular attention since such foods add to the overabundance of sodium and saturated fat in the American diet. The consumption of lower-sodium, lower-fat, wholegrain snack foods should be encouraged, particularly for those 30–39 years of age and those in the middle income and education groups. Increasing intake of whole grains, a DGA 2010 recommendation(16), has been associated with lower adiposity in adults(Reference McKeown, Troy and Jacques19). However, those investigators caution that emphasis should be placed on the substitution of refined grains with whole grains rather than the addition of whole grains to a diet already high in refined grains(Reference McKeown, Troy and Jacques19).
The SoFAAS category appears to provide the most opportunity for improving the diet of adult LMD residents. Indeed, the DGA 2010 gives special attention to solid fats and added sugars, two components of the SoFAAS category, because they are consumed in excessive amounts by Americans(16). The fact that the top five sources accounted for only 35 % of the SoFAAS component attests to the ubiquitous presence of SoFAAS in the American food supply. In this study, only eleven of the 165 food and beverage groups did not contribute to the SoFAAS category (data not shown). The consumption of soft drinks requires special focus since these drinks are a significant source of added sugars in the diet of LMD adults, particularly younger adults. Consumption of soft drinks and other sugar-sweetened beverages (SSB; e.g. fruit drinks and sweet tea) should be strongly discouraged. Intervention and social marketing strategies should focus on social norms associated with beverage consumption patterns among younger adults. Alternatives such as water and artificially sweetened soft drinks and teas should be encouraged as more healthful substitutes. Results from women participating in a weight-loss intervention suggest that replacing SSB with water may be an effective method to lower total energy intake in free-living individuals(Reference Stookey, Constant and Gardner20). In another study conducted in both men and women, investigators found that reduction of SSB intake was significantly associated with weight loss(Reference Chen, Appel and Loria21). Hence, advocating the replacement of less healthy foods and beverages with more healthful ones is a viable strategy to improve the diet quality and health of individuals.
The present study is not without limitations. The data were collected in 2000 and may not fully represent current dietary intake of LMD adults. For example, anecdotal evidence through discussions with Delta residents suggests that intake of wholegrain breads may have increased since the time the data were collected. Furthermore, because the populations of most LMD counties have been declining in recent decades, the demographic profile of this region may have also changed since 2000. Nevertheless, the FOODS 2000 data set was collected using a highly sophisticated stratified sampling plan and the same multiple-pass dietary recall methodology used by the National Health and Nutrition Examination Survey (NHANES). Finally, the impact of food availability on diet quality or food sources was not assessed because this information was not collected. The low availability of supermarkets and healthy food in the region has been highlighted in previous research as possible determinants of diet quality(Reference Blanchard and Lyson22, Reference Connell, Yadrick and Simpson23).
In conclusion, the findings of the present study showed that the assessment of diet quality and identification of top dietary sources revealed the presence of demographic differences in selected HEI-2005 components, information that is necessary for tailoring nutrition interventions in the LMD region. Not only do these findings allow for identification of food patterns and culturally appropriate messaging that could reach the entire population through social marketing and media approaches, they also highlight the difficulties of treating this region as a homogeneous population. The assessment of dietary pattern quality and adherence to dietary guidelines, as well as the determination of top food sources, are critical steps in the development of culturally appropriate dietary modifications for a given population. To improve adherence to DGA in the LMD population, intervention studies are needed to promote culturally familiar foods of higher nutritional quality.
Acknowledgements
This work was sponsored in part by the USDA Agricultural Research Service Projects 6251-53000-004-00D and 6401-53000-001-00D. None of the authors declared a conflict of interest. The authors’ contributions were as follows. J.L.T. assisted with study design, performed statistical analysis and prepared manuscript and tables; S.J.O. oversaw the study design and statistical analysis, and assisted in manuscript preparation; C.L.C. assisted with study design and manuscript preparation, especially the development of dietary modifications; J.M.Z. assisted with study design, manuscript preparation and tables; L.M.T.-H. assisted with study design, manuscript preparation and tables; M.L.B. assisted with formulation of the study design; K.Y. assisted with study design, manuscript preparation and tables.



