


Cardiometabolic diseases, such as hypertension, dyslipidaemia and diabetes, are significantly prevalent in the adult population(Reference Benjamin, Muntner and Alonso1). At the same time, the consumption of added sugars (high-fructose corn syrup and sucrose), mainly from sweetened drinks and refined products, has grown over the past few years(Reference Benjamin, Muntner and Alonso1–Reference Martins, Levy and Claro3). Data collected in Brazil show that the consumption of sweetened beverages still remained high in adult population in 2015, with an average amount of consumption of these products around 300–400 ml per day, reaching quantities greater than 1 liter (90th and 95th percentiles)(Reference Kovalskys, Rigotti and Koletzko4). In this context, cardiometabolic diseases have been associated with high consumption of sweetened beverages. In a meta-analysis of ten prospective cohort studies and 294 617 participants evaluated(Reference Malik, Popkin and Bray5), it was identified that individuals who ingested greater quantities of these products (≥ 1 to 2 doses per day) had a 24 % higher risk of developing cardiometabolic diseases. Sweetened beverages are one of the main sources of fructose in the diet and several studies indicate that the high consumption of this monosaccharide may result in several risk factors for cardiometabolic diseases, such as hyperuricaemia, dyslipidaemia, insulin resistance, inflammation, endothelial dysfunction and hypertension(Reference Gatineau, Polakof and Dardevet6–Reference Macedo, Vieira and Moritz8).
Fructose metabolism may stimulate the production of uric acid, which occurs because of the rapid phosphorylation of the fructose molecule by the fructokinase enzyme in the liver(Reference Stanhope7,Reference King, Lanaspa and Jensen9) . In addition to production, some evidence points to the possibility of a fructose-induced reduction in the excretion of uric acid, contributing to the increase in its concentrations(Reference Caliceti, Calabria and Roda10). It is widely known that hyperuricaemia is related to several diseases, being considered an indicator of metabolic syndrome, chronic renal disease, CVD and diabetes mellitus(Reference Zhang, Li and Zhang11). These disorders may occur by various mechanisms, including endothelial dysfunction(Reference El Ridi and Tallima12). It is suggested that hyperuricaemia is able to contribute to the production of the superoxide anion by activating the enzymes xanthine oxidase and nicotinamide adenine dinucleotide phosphate oxidase (NADPH oxidase), which may cause changes in endothelium-dependent vasodilation by reducing the bioavailability of nitric oxide(Reference Huang, Hong and Zhang13–Reference Papežíková, Pekarová and Kolářová15). In addition, evidence indicates that the increase in uric acid concentrations may result in negative responses in blood pressure, through this and other mechanisms(Reference King, Lanaspa and Jensen9,Reference Feig, Madero and Jalal16,Reference Tran, Yuen and McNeill17) .
By contrast, regular physical exercise is considered a non-drug strategy for the prevention and rehabilitation of disorders related to cardiometabolic diseases(Reference Lin, Zhang and Guo18). The beneficial influence of aerobic training on metabolic and cardiovascular health, including improvements in the lipid profile(Reference Wang and Xu19), insulin sensitivity(Reference Mann, Beedie and Balducci20,Reference Swift, Houmard and Slentz21) , inflammatory state(Reference Hayashino, Jackson and Hirata22), endothelial function(Reference Goto, Higashi and Kimura23,Reference Pearson and Smart24) and blood pressure(Reference Cornelissen and Smart25), is widely recognised. Therefore, physical training may attenuate the negative effects of fructose. Several animal studies have shown that regular fructose consumption causes impairment in the risk factors for cardiometabolic diseases, but aerobic training prevented or reversed these consequences(Reference Boa, Costa and Souza26–Reference Stanišić, Korićanac and Ćulafić30). In humans, physical activity(Reference Bidwell, Fairchild and Redmond31) or aerobic exercise(Reference Egli, Lecoultre and Theytaz32) supressed the fructose-induced deleterious effects, especially in outcomes related to the lipid profile.
Despite the positive results related to the increase in physical activity and inclusion of aerobic exercise that were found in these investigations, to the best of our knowledge there is no study that has evaluated the effects of aerobic training associated with fructose consumption on vascular outcomes. Thus, there are little data in the literature regarding high-fructose diet effects on endothelial function, since endothelial dysfunction may cause several impairments in cardiometabolic health such as increased blood pressure, and regarding whether aerobic training may be able to prevent metabolic and cardiovascular disorders induced by this monosaccharide in humans. Therefore, the aim of this study was to verify the effect of 4 weeks of high-fructose diet associated with aerobic training on the risk factors for cardiometabolic diseases, especially the pathways related to uric acid concentrations and endothelial function (nitrite/nitrate (NOx) and endothelin-1 (ET-1) concentrations, and flow-mediated dilation (FMD)). Our hypothesis is that fructose consumption would promote impairment in the risk factors for cardiometabolic diseases evaluated and aerobic training would prevent these damages.
Methods
Participants
The study was characterised as a randomised, double-blind, parallel clinical trial, with an allocation ratio of 1:1:1. Prior to recruitment, a sample calculation was performed based on studies by Stanhope et al. (Reference Stanhope, Medici and Bremer33) and Sandri et al. (Reference Sandri, Viehmann and Adams34) for the outcomes of uric acid (effect size (ES): 0·52) and FMD (ES: 0·48), respectively. The calculation was performed based on an F-test for repeated measures within–between interaction, using the GPOWER program version 3·1, in which α = 0·05 and 95 % power were adopted. Thus, the need for a total ‘n’ of eighteen volunteers for uric acid and twenty-one volunteers for FMD was demonstrated. Anticipating possible sample losses throughout the applied interventions, accounting for a 25 % drop-out the total sample of twenty-eight individuals was recruited.
The sample consisted of twenty-one individuals of both sexes, aged between 19 and 35 years, BMI between 18 kg/m2 and 30 kg/m², healthy, non-smokers and not engaged in regular physical exercises (< 150 min per week). For this, the initial physical activity level of each subject was measured using the International Physical Activity Questionnaire during the preliminary tests. Participants had no metabolic or orthopedic complications. In addition, they could not use drugs and/or nutritional supplements that could interfere with the study outcomes. In relation to women, all blood collections (before and after the 4 weeks of intervention) were performed within the first 7 d of the menstrual cycle to minimise the possible hormonal effects on the variables(Reference Mumford, Dasharathy and Pollack35–Reference Williams, Kingwell and Blombery37). Recruitment took place through disclosures on social networks and telephone contact. The volunteers who agreed with all the study procedures signed two copies of the Free and Informed Consent form. The protocol was approved by the research ethics committee of the Federal University of Rio Grande do Sul (UFRGS) (nº 84642318.8.0000.5347) and was performed in accordance with The Code of Ethics of the World Medical Association (Declaration of Helsinki) for experiments involving humans. The study was registered on clinicaltrials.gov as NCT03939130. There were not any changes in methods and outcomes after the beginning of the trial.
Participants visited the Exercise Research Laboratory (LAPEX) at the Federal University of Rio Grande do Sul (UFRGS) for collecting the following data: anamnesis, food record, physical activity level, body mass and height. After the aforementioned preliminary assessments, the participants were scheduled for a second visit to perform the analysis of the basal metabolic rate (BMR), blood collection, body composition assessment, and maximum exercise test on an ergometric bike with gas analysis for the determination of peak oxygen consumption (VO2peak).
Subsequently, the participants were submitted to a standard diet (SD) prescribed by the researchers (dietary advice calculated individually for each participant) for 2 weeks, with the aim of maintaining body mass and standardising dietary consumption throughout the study.
Study protocols
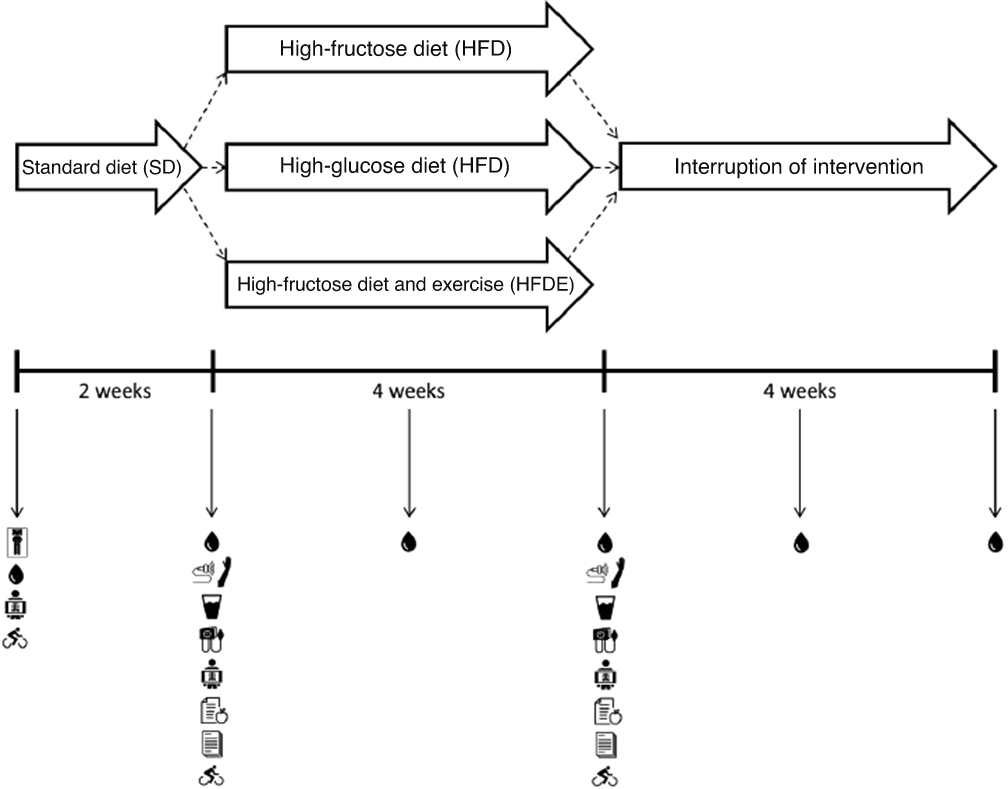
After the 2-week period of adaptation to SD, the participants returned to the laboratory for pre-intervention evaluations, including blood collection, oral glucose tolerance test, FMD, body composition, VO2peak, blood pressure, food record and physical activity level. Then, in a randomised manner, the individuals were allocated to one of three different interventions (groups) (Fig. 1).
Study design. BMR, basal metabolic rate; FMD, flow-mediated dilation; OGTT, oral glucose tolerance test; IPAQ, International Physical Activity Questionnaire; VO2peak, peak oxygen consumpition. ![]() , BMR,
, BMR, ![]() , blood collection;
, blood collection; ![]() , FMD;
, FMD; ![]() , OGTT;
, OGTT; ![]() , blood pressure;
, blood pressure; ![]() , body composition;
, body composition; ![]() , food record;
, food record; ![]() , IPAQ;
, IPAQ; ![]() VO2peak
VO2peak
For randomisation, blocks of three were used according to VO2peak observed on the first day of tests, and the procedure was performed by a researcher who was not directly involved in the study (https://www.randomizer.org/). Participants were randomised to groups based on VO2peak because the literature shows that the greater the oxygen consumption of the individual, the greater the cardiometabolic protection(Reference Grundy, Barlow and Farrell38). Therefore, it is possible to suggest that individuals with lower values of VO2peak would be more vulnerable to the effects of fructose consumption(Reference Goyaram, Kohn and Ojuka39,Reference Gonçalves, Cavaletti and Pasqualucci40) . In addition, researchers and outcome assessors who were not involved in the preparation and delivery of drinks to volunteers were blinded throughout the data collection and analysis period.
The protocols consisted of maintaining SD with the replacement of part of the carbohydrates from the previous diet (1 g/kg of body mass) with carbohydrates from a sweetened drink (10 % fructose or glucose solution, 1 % powdered flavouring and water) for 4 weeks. The individuals did not know the content of the drink and were instructed to return the empty bottles at least twice a week in order to ensure adherence to the intervention. The following conditions were met: (1) high-fructose diet (HFD), the participants received 1 g/kg of fructose per day; (2) high-glucose diet (HGD), participants received 1 g/kg of glucose per day and (3) high-fructose diet and exercise (HFDE), participants received 1 g/kg of fructose per day and performed 3 weekly sessions of 60 min of aerobic exercise at 65 % of heart rate obtained at VO2peak on an ergometric bike.
After the conclusion of interventions, the evaluations were conducted following the same procedures adopted in the pre-intervention period. Furthermore, the volunteers were followed up for more 4 weeks in order to verify the effects of interrupting the consumption of sweetened drinks on some outcomes.
Dietary control
Participants were instructed to adhere to prescribed SD throughout the study period and to avoid drinking sweetened drinks other than those provided by the researchers. The diet was calculated from the value obtained by the BMR of each individual multiplied by the activity factors 1·5 (HFD and HGD) or 1·7 (HFDE) and was composed of approximately 55 % carbohydrates, 30 % lipids and 15 % proteins(Reference Egli, Lecoultre and Theytaz32,Reference Cox, Stanhope and Schwarz41) . Thereafter, each subject received their personalised dietary recommendations, and they could make their own food choices based on the prescribed diet (quality and quantities of food). The main instruction was to avoid the consumption of sweetened beverages as much as possible during this period(Reference Le, Faeh and Stettler42). SD was introduced with the objective of maintaining body mass throughout the study and to standardise the dietary intake of the participants in order to minimise the influence of the diet on the outcomes analysed.
In every weekly meetings for the sweetened drinks delivery, the participants were asked about their eating habits and were instructed to perform the SD according to the prescription. Three-day food records were filled by the participants before and after the interventions and analyzed in order to verify possible differences in diet. The records were collected in-person by the participants, and the data were reviewed by the researchers together with the participants during the visits. The volunteers were instructed to register all foods and drinks consumed during 2 d of the week and 1 d of the weekend. For data analysis, the Dietwin® (Brubins) Professional version (2014) software was used.
Basal metabolic rate
On the day of the BMR test, the participants were instructed not to perform physical activities of moderate to high intensity 24 h before the test, to get a night of sleep of at least 8 h, and fast for 12 h, as well as to not consume alcohol, caffeine or any type of medication in this period without prior communication to the research team. All BMR tests were performed between 06.30 and 08.30 in an air-conditioned room between 20 and 25°C, with controlled noise and low light. The protocol consisted of 10 min of rest on a bed in the supine position, followed by 30 min of capture of expired gases. VO2 and VCO2 values were obtained using a computerised gas analyser (Quark CPET, Cosmed, Italy). For data analysis, the mean values of VO2 and VCO2 (l/min) of the final 20 min of each collection were used. The equation proposed by Weir was used to obtain the kcal/d values(Reference Weir43).
Body composition
Body mass and height were measured using a stadiometer and scale (Urano, Brazil). Lean mass, fat mass and body fat percentage were determined using a dual-energy X-ray absorptiometry machine (DEXA) (GE Healthcare Lunar, Bedford, USA). Briefly, after 12 h of fasting, 24 h without exercise, and wearing only light clothes, the participants lay on the DEXA table in a supine position with their arms adequately separated from the trunk. Thereafter, they were instructed to remain immobile throughout the procedure.
Control of physical activity
The participants were instructed not to perform physical exercises before the beginning of the study (–2 weeks) and during the study period (0–4 weeks), with the exception of the HFDE group that performed the exercise sessions related to the intervention. The level of physical activity was measured using the International Physical Activity Questionnaire short version. This instrument was applied at the first visit, before and after the intervention, in order to verify the initial level of the participants and possible changes throughout the study.
Oxygen consumption
VO2peak was determined using an open-circuit ergospirometry system with a gas analyser (Quark CPET, Cosmed, Italy). The progressive load tests were performed on an ergometric bike (Ergofit 167, Germany) using a ladder protocol. The initial load was 25 W, with an increase of 25 W every minute. A telemetric band was positioned to continuously monitor the participants’ heart rate (S610, Polar Electro Oy, Finland). The volunteers were verbally encouraged to take maximum effort during the test. The test lasted 8–12 min according to the recommendations of the American College of Sports Medicine, and it was interrupted when the participants met the following criteria: (a) heart rate ≥ that predicted for age; (b) respiratory exchange rate value > 1·15 and (c) subjective perception of effort > 18 or when the participant voluntarily interrupted the test. The test was carried out on the first visit to verify the participants’ initial cardiorespiratory capacity and for the exercise prescription to participants of the HFDE group. In addition, before and after the intervention, reassessments were performed to examine possible changes throughout the study.
Aerobic training protocol
The volunteers in the HFDE group, during the 4 weeks of intervention, performed three sessions a week of 60 min aerobic exercise on an ergometric bike. The exercise protocol was conducted at LAPEX/UFRGS. Each session consisted of 5 min of warm-up, 50 min of main part with an intensity of 65 % of the heart rate corresponding to the VO2peak (obtained in an incremental test), and 5 min of cool down. Thus, aerobic exercise was prescribed using a continuous method, without any changes in intensity or duration during the 4 weeks. Throughout the exercise period, the heart rate was monitored to verify the intensity of the effort.
Blood outcomes
Six 12-h fasting blood collections (5–10 ml each) were performed in the vein of the antecubital region of the participants’ forearms throughout the study. Before and after 4 weeks, uric acid, thiobarbituric acid reactive substances, superoxide dismutase, NOx, lipid profile (total cholesterol, LDL, HDL, TAG), glucose, insulin, C-reactive protein and ET-1 concentrations were analysed in order to evaluate the effects of interventions on these outcomes. Before the start of the study (–2 weeks), in the middle of the intervention (2 weeks), and 2 and 4 weeks after the interruption of beverage consumption (6 and 8 weeks), uric acid, lipid profile and glucose concentrations were assessed in order to observe the behaviour of these blood markers in view of the inclusion and exclusion of sweetened beverages over time. The blood collections of the HFDE group volunteers were performed between 48 and 72 h after the last exercise session.
In order to prepare the blood samples, the tube was of the vacutainer type containing EDTA. The blood was centrifuged at 1500 g for 10 min, and the plasma was aliquoted and stored at −80°C. The analyses of uric acid, total cholesterol, TAG, HDL and C-reactive protein concentrations were performed by a colorimetric method using an automated biochemical analyser (Cobas C111 – Roche). LDL levels were estimated(Reference Friedewald, Levy and Fredrickson44). Thiobarbituric acid reactive substances formation(Reference Ohkawa, Ohishi and Yagi45) and the activity of the superoxide dismutase isoforms(Reference Misra and Fridovich46) were assessed as previously described. The measurements of plasma insulin concentrations (DRG International, Springfield, IL, USA) and ET-1 concentrations (BosterBio, Pleasanton, USA) were performed by ELISA using kits for humans. NOx concentrations (Cayman Chemical, Michigan, USA) were analysed by fluorescence assay using kits for humans, as instructed by the manufacturer.
Oral glucose tolerance test
To determine the insulin sensitivity index by oral glucose tolerance test, the individuals performed the basal blood collection after 12 h of fasting, and then received a solution containing 75 g of glucose. New blood samples were collected 90 and 120 min after ingesting the solution. Insulin sensitivity index values were obtained based on insulin levels (baseline and 120 min after solution) and glucose levels (90 min after solution) using an equation (insulin sensitivity index = 0·157 – 4·576 × 10−5 × Ins120 – 0·00519 × Gluc90 – 0·000299 × Ins0)(Reference Stumvoll, Mitrakou and Pimenta47).
Insulin resistance and functional capacity of pancreatic beta cells indices
The insulin resistance index (homeostatic model assessment 2 – insulin resistance (HOMA2-IR)) and the functional capacity of pancreatic beta cells index (homeostatic model assessment 2 – β-cell function (HOMA2-%B)) were calculated from the values of fasting glucose and insulin(Reference Matthews, Hosker and Rudenski48,Reference Wallace, Levy and Matthews49) .
Flow-mediated vasodilation
The FMD test was performed in a quiet room with participants in abstinence from alcohol and caffeine for at least 12 h. High-resolution ultrasound was used to image the brachial artery at rest and after 5 min of ischaemia. All the FMD tests were performed with the participant in the supine position, with the non-dominant arm extended at an angle of ∼90° from the torso. The brachial artery was imaged in the DUPLEX mode using the high-resolution ultrasound system LOGIQ-E ultrasound Doppler system (General Electric Medical Systems, Milwaukee, WI, USA). The ultrasound Doppler system was equipped with a 7–12 MHz linear array transducer. The brachial artery was imaged 5–10 cm above the antecubital fossa in the longitudinal plane, and the diameter was determined at a 60° angle along the central axis of the scanned area. When an optimal image was acquired, the position was maintained for the whole test, and all scans were stored for later analysis. After baseline brachial artery imaging, a blood pressure cuff was placed around the forearm and inflated to 240 mmHg for 5 min. Brachial artery images and blood velocity were obtained continuously 30 s before and 3 min after cuff release. The brachial artery images were analysed by a blinded investigator using FloWave.US. Arterial diameter was measured as the distance (mm) between the intima–lumen interfaces for the anterior and posterior walls. To calculate the percentage variation of the dilation, the peak diameter was used in response to reactive hyperaemia in relation to the baseline diameter: FMD (%) = (peak diameter – baseline diameter) × 100 ÷ baseline diameter(Reference Coolbaugh, Bush and Caskey50,Reference Thijssen, Black and Atkinson51) .
Blood pressure
Ambulatory blood pressure monitoring was performed to check the behaviour of blood pressure during nighttime and daytime. The equipment (Meditech ABPM-04, Budapest, Hungary) was installed on the participants, and the participants returned to their normal activities outside the laboratory. Every 15 min during the waking period and every 30 min during the sleeping period, the monitor recorded the pressure obtained for 24 h. After this period, the individuals visited the laboratory again to remove the equipment and the registered data were analyzed using the HyperView for Windows (Micromed) program.
Statistical analysis
The data were structured and analysed using the statistical package IBM SPSS statistics (Statistical Package for Social Sciences) version 22.0 (IBM, USA) for Windows. Continuous data are presented as means ± standard deviation, and categorical data are expressed as absolute frequencies. The Shapiro–Wilk test was performed to verify the assumption of normality, and the analysis of the homogeneity of the variances was performed using the Levene test. The comparison between the groups regarding the outcomes of sample characterisation and composition of the prescribed diet was performed by one-way ANOVA and χ 2 test. The comparison of data before and after the first two weeks of SD (weeks −2 and 0) was performed using a paired sample t test. The other comparisons were performed using the generalised estimation equations (GEE), adopting group (three stratifications) and time (6, 3 and 2 stratifications) as factors. The missing values were estimated using maximum likelihood estimation by the automatic regression imputation method within the GEE analysis. Maximum likelihood estimation is a common estimation method in statistics contingent upon finding estimates of the treatment differences that maximise the probability of the observed data(Reference Dziura, Post and Zhao52). Methods as likelihood-based approaches produces unbiased estimates of the intervention effect and correct P-values. Furthermore, it makes weaker assumptions about the missing data compared with complete case analysis. In addition, GEE can handle with missing data in longitudinal studies under the assumption that such data are missing completely at random(Reference Ballinger53,Reference Liu, Wei and Zhang54) . The method for estimating the missing data used by GEE consider the covariance matrix and the correlation parameters.
When necessary, the least significant difference post-hoc test was conducted. The level of significance adopted was 5 %. For all variables, the ES was calculated (Cohen d corrected by Hedges) and classified as small (0·2), moderate (0·5) or large (≥ 0·8)(Reference Sullivan and Feinn55).
Results
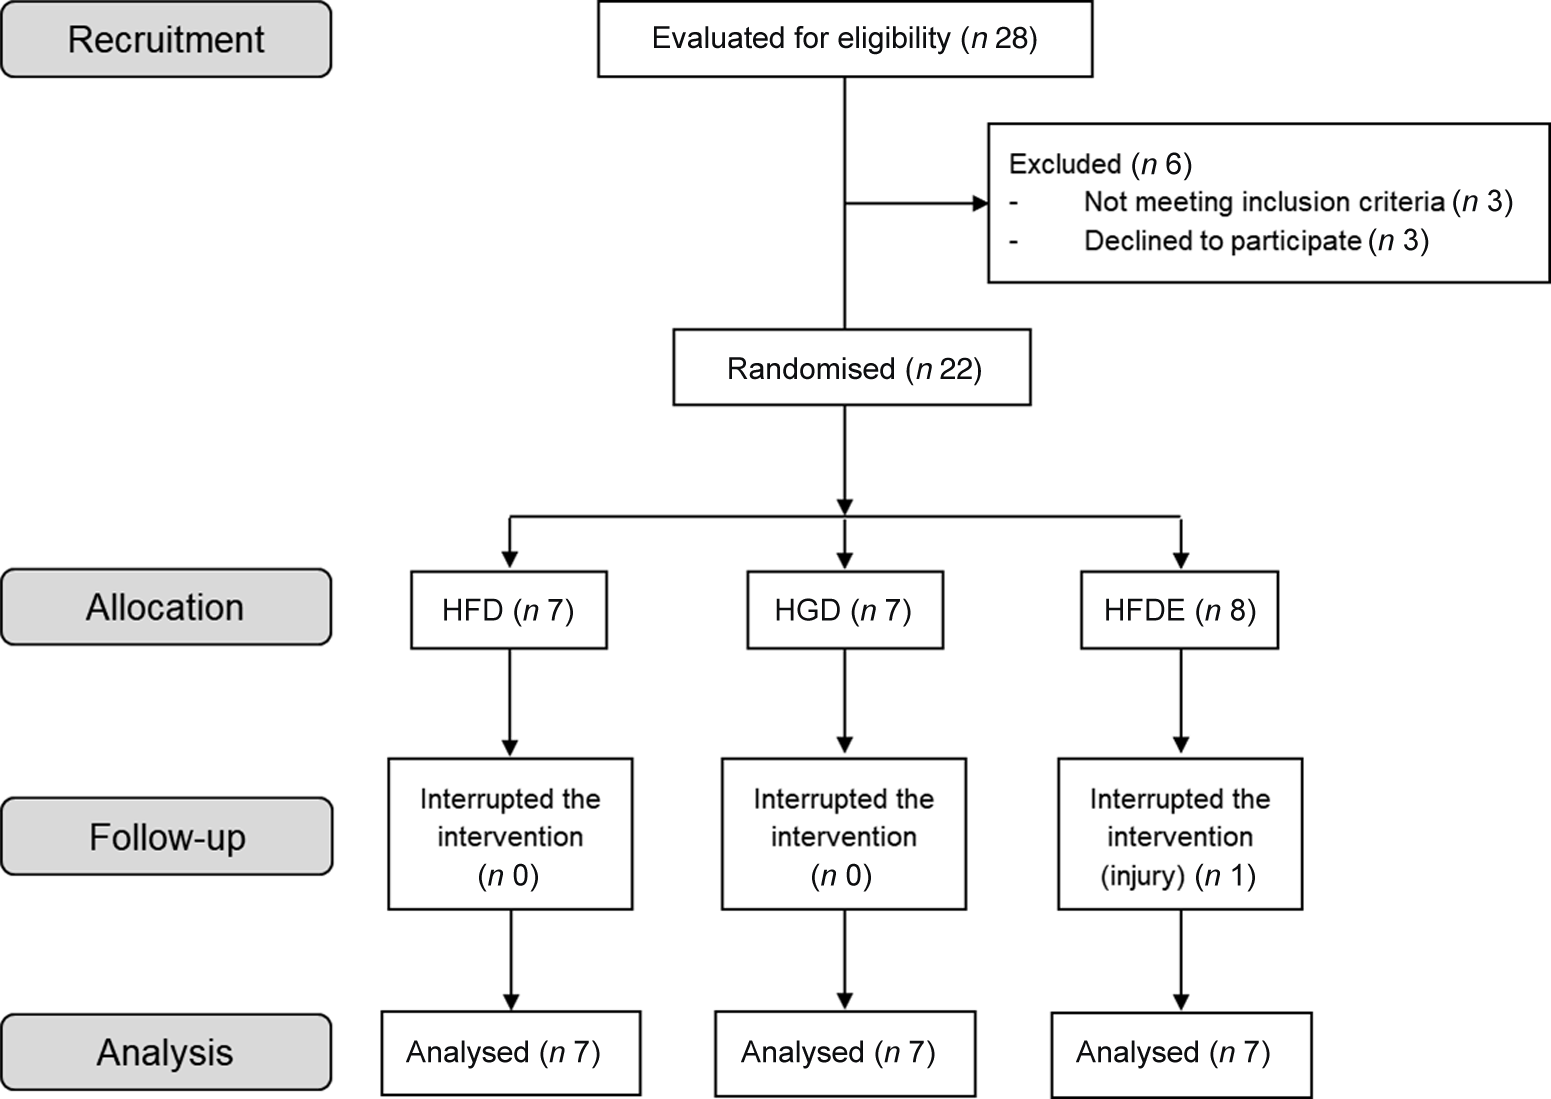
Of the twenty-eight participants recruited to participate in the study, twenty-one individuals (nine men and twelve women) completed the interventions (HFD: n 7; HGD: n 7; HFDE: n 7) (Fig. 2). Participants were recruited from May 2018 and the trial ended in January 2019, when the sample size goal was reached.
Flowchart of the recruitment, allocation, follow-up and analysis of participant’s data processes. HFD, high-fructose diet; HGD, high-glucose diet; HFDE, high-fructose diet and exercise.
Unintended effects related to sweetened drinks (taste, constipation and diarrhoea) were reported by some participants. In the HFDE group, individuals performed approximately twelve exercise sessions throughout the experiment, with 100 % adherence to training. As described in Table 1, there were no differences between the characteristics of the participants before the intervention. Regarding the prescribed diet, there were no differences between the three groups regarding the energy value, the amount of macronutrients and sugars related to the intervention (fructose or glucose) (Table 2). In addition, individuals did not change body mass, body fat mass, lean body mass or diet composition over the intervention period (Table 3). The HGD (P = 0·031) and HFDE (P ≤ 0·001) groups exhibited increases in VO2peak after the intervention and, in relation to the levels of physical activity, the HGD group showed lower results than did the other groups since the initiation of the intervention, but without differences over the 4 weeks (Table 3). Stratifying the levels of physical activity by the different domains, all groups showed increases in walking activity, evidenced by the significant difference found only in the time factor for this outcome (52·64 ± 55·88 mets.min to 187·63 ± 155·49 mets.min; P = 0·015), considering the sum of the means of HFD, HGD and HFDE.
Characteristics of participants
(Mean values and standard deviations)
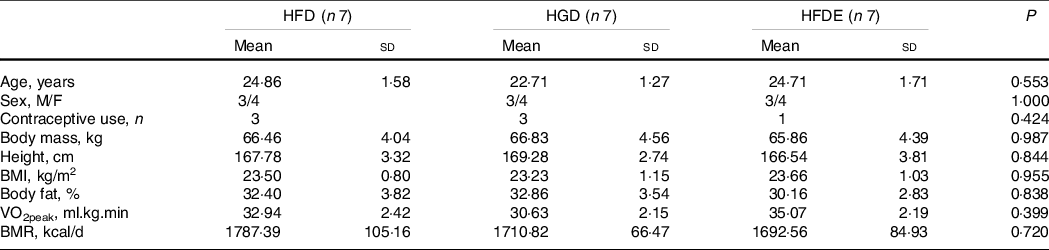
Data expressed as mean ± standard deviation or absolute frequencies. VO2peak, peak oxygen consumption; BMR, basal metabolic rate; HFD, high-fructose diet; HGD, high-glucose diet; HFDE, high-fructose diet and exercise.
Composition of the prescribed daily dietary intake throughout the intervention
(Mean values and standard deviations)
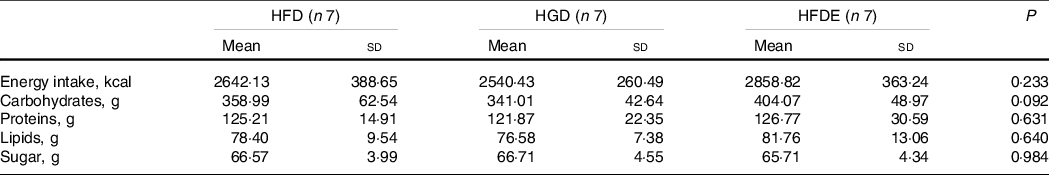
HFD, high-fructose diet; HGD, high-glucose diet; HFDE, high-fructose diet and exercise.
Control outcomes throughout the interventions: HFD (n 7), HGD (n 7), HFDE (n 7)
(Mean values and standard deviations)
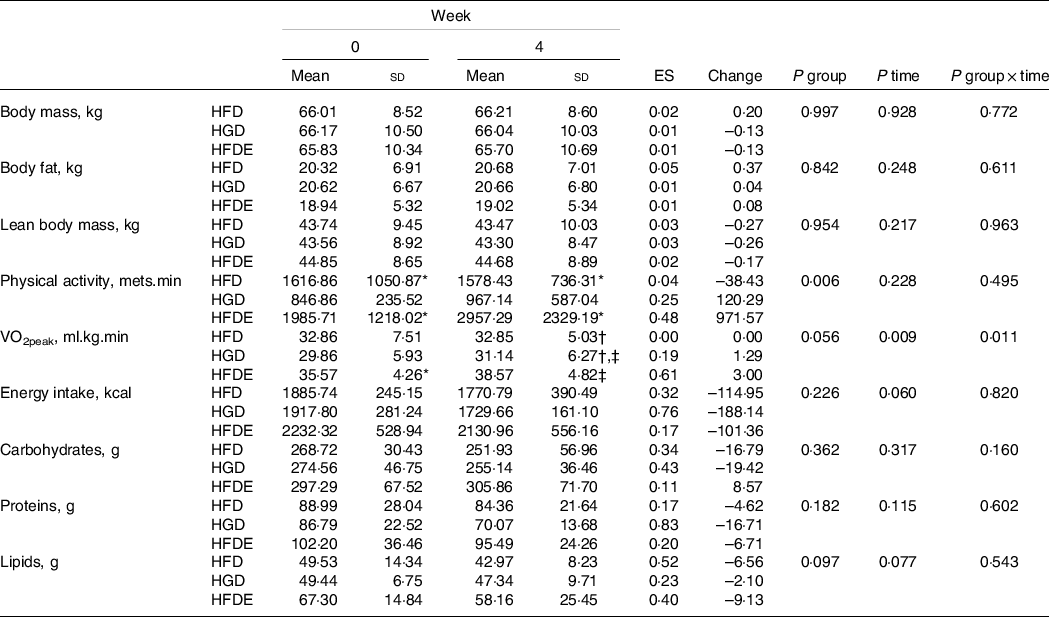
Data expressed as mean ± standard deviation. VO2peak, peak oxygen consumption; HFD, high-fructose diet; HGD, high-glucose diet; HFDE, high-fructose diet and exercise; ES, effect size (week 0 to week 4); Change: absolute (week 0 to week 4).
* Difference relative to HGD group.
† Difference relative to HFDE group.
‡ Difference to week 0.
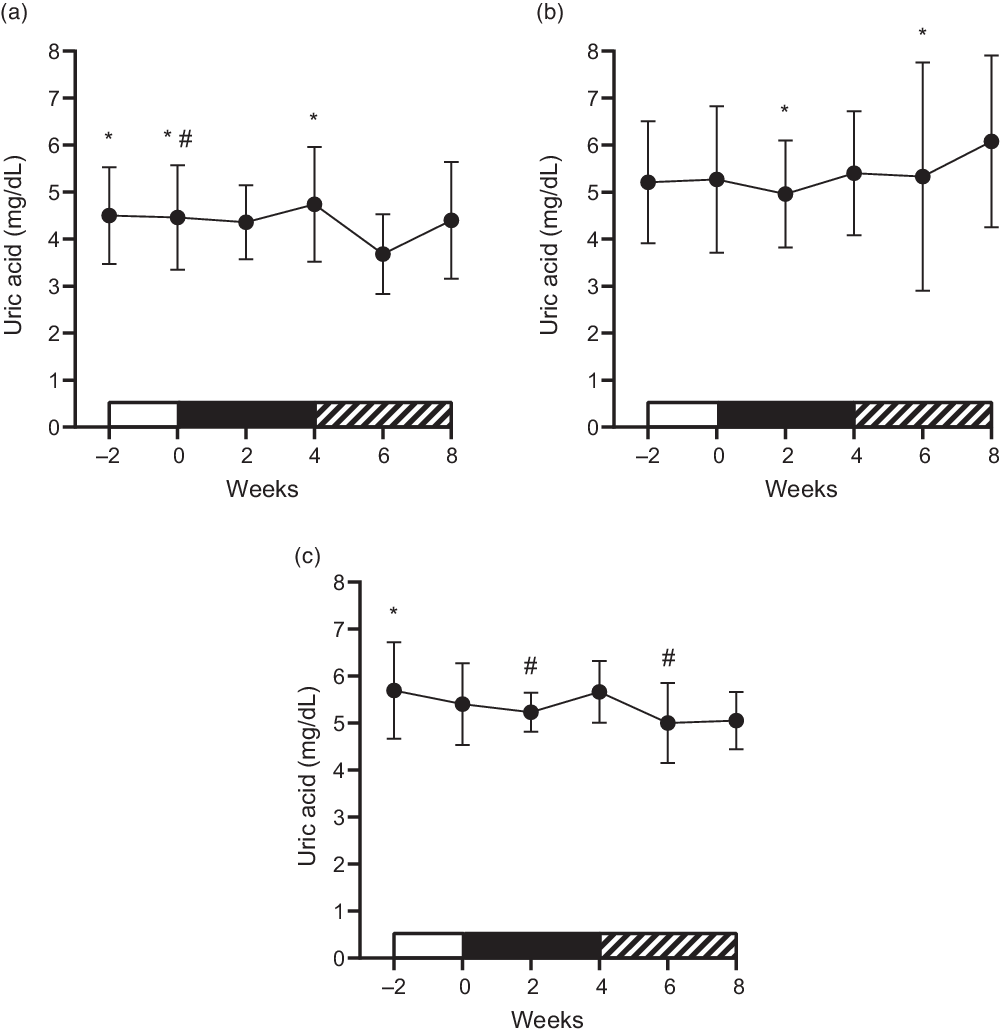
Figure 3 represents the behaviour of uric acid concentrations over time, in which it was possible to identify significant interactions between group and time (P = 0·035). In the HFG group, there was an increase between the pre- and post-intervention periods (week 0 to week 4) (4·46 ± 1·11 mg/dl to 4·74 ± 1·22 mg/dl; ES: 0·22; P = 0·040) and a decrease two weeks after stopping the consumption of drinks containing fructose (week 6), compared with weeks −2 (P = 0·021), 0 (P = 0·021) and 4 (P = 0·004). Regarding the HGD group, the intervention did not cause significant changes between the pre- and post-intervention periods (5·27 ± 1·56 mg/dl to 5·40 ± 1·32 mg/dl; ES: 0·08; P = 0·573), but there were differences between weeks 2 and 8 (P = 0·011) and between weeks 6 and 8 (P = 0·045). The HFDE group showed an increase in uric acid concentrations between the middle and after intervention periods (week 2 to week 4) (5·23 ± 0·42 mg/dl to 5·66 ± 0·66 mg/dl; P = 0·013), with a fall occurring two weeks after the interruption of the intervention (week 4 to week 6) (P = 0·20). This reduction was maintained at week 8, which was demonstrated to be different from that at week −2 (P = 0·010). Between the pre- and post-intervention periods, there were no significant changes (5·40 ± 0·87 mg/dl to 5·66 ± 0·66 mg/dl; ES: 0·31; P = 0·220). The HFD group showed lower values compared with the HFDE group at weeks −2 (P = 0·030), 2 (P = 0·011) and 6 (P = 0·004), and at week 8 in relation to the HGD group (P = 0·045) (Fig. 3).
Mean ± standard deviation of the behaviour of uric acid concentrations. (a) High-fructose diet (HFD); *difference for week 6; #difference for week 4. (b) High-glucose diet (HGD); *difference for week 8. (c) High-fructose diet and exercise (HFDE); *difference for week 8; #difference for week 4.
As shown in Table 4, there was a significant interaction between group and time with regard to glucose concentrations (P ≤ 0·001), with no changes between the pre- and post-intervention periods for all groups. However, there was an increase between weeks 2 and 4 in the HFD group (P = 0·037) and, in the HFDE group, an increase from week 0 to week 2 (P = 0·019), followed by a reduction from week 2 to week 4 (P = 0·003). Considering all groups, only a significant time effect was demonstrated for total cholesterol (P ≤ 0·001), LDL (P ≤ 0·001) and TAG (P = 0·002) concentrations. The other outcomes did not show significant differences (Table 4 and Table 5).
Lipid profile and glucose metabolism outcomes throughout the interventions: HFD (n 7), HGD (n 7), HFDE (n 7)
(Mean values and standard deviations)
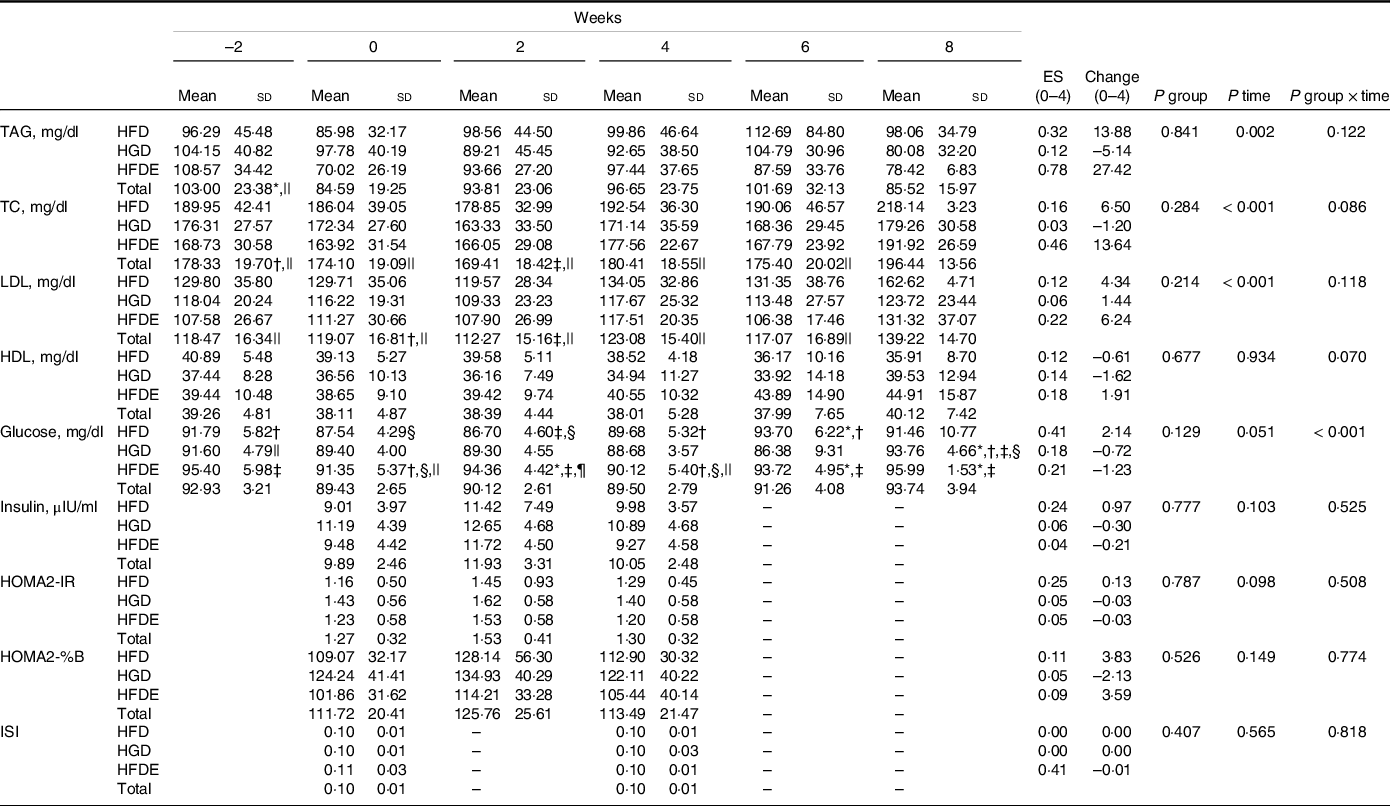
Data expressed as mean ± standard deviation. TC, total cholesterol; HOMA2-IR, insulin resistance index; HOMA2-% B, functional capacity of pancreatic beta cells index; ISI, insulin sensitivity index; HFD, high-fructose diet; HGD, high-glucose diet; HFDE, high-fructose diet and exercise; ES, effect size (week 0 to week 4); Change: absolute (week 0 to week 4).
* Difference to week 0.
† Difference to week 2.
‡ Difference to week 4.
§ Difference to week 6.
|| Difference to week 8.
¶ Difference to HFD and HGD at week 2.
Metabolic and vascular outcomes throughout the interventions: HFD (n 7), HGD (n 7), HFDE (n 7)
(Mean values and standard deviations)
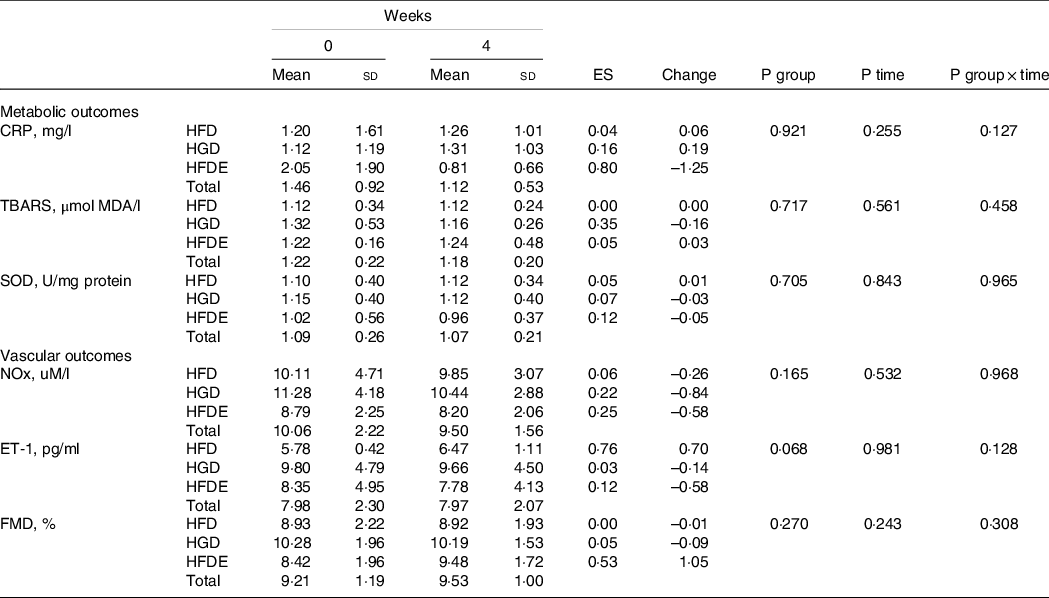
Data expressed as mean ± standard deviation. CRP, C-reactive protein; TBARS, thiobarbituric acid reactive substances; SOD, superoxide dismutase; NOx, nitrite/nitrate; ET-1, endothelin-1; FMD, flow-mediated dilation; HFD, high-fructose Diet; HGD, high-glucose diet; HFDE, high-fructose diet and exercise; ES, effect size (week 0 to week 4); Change: Absolute (week 0 to week 4).
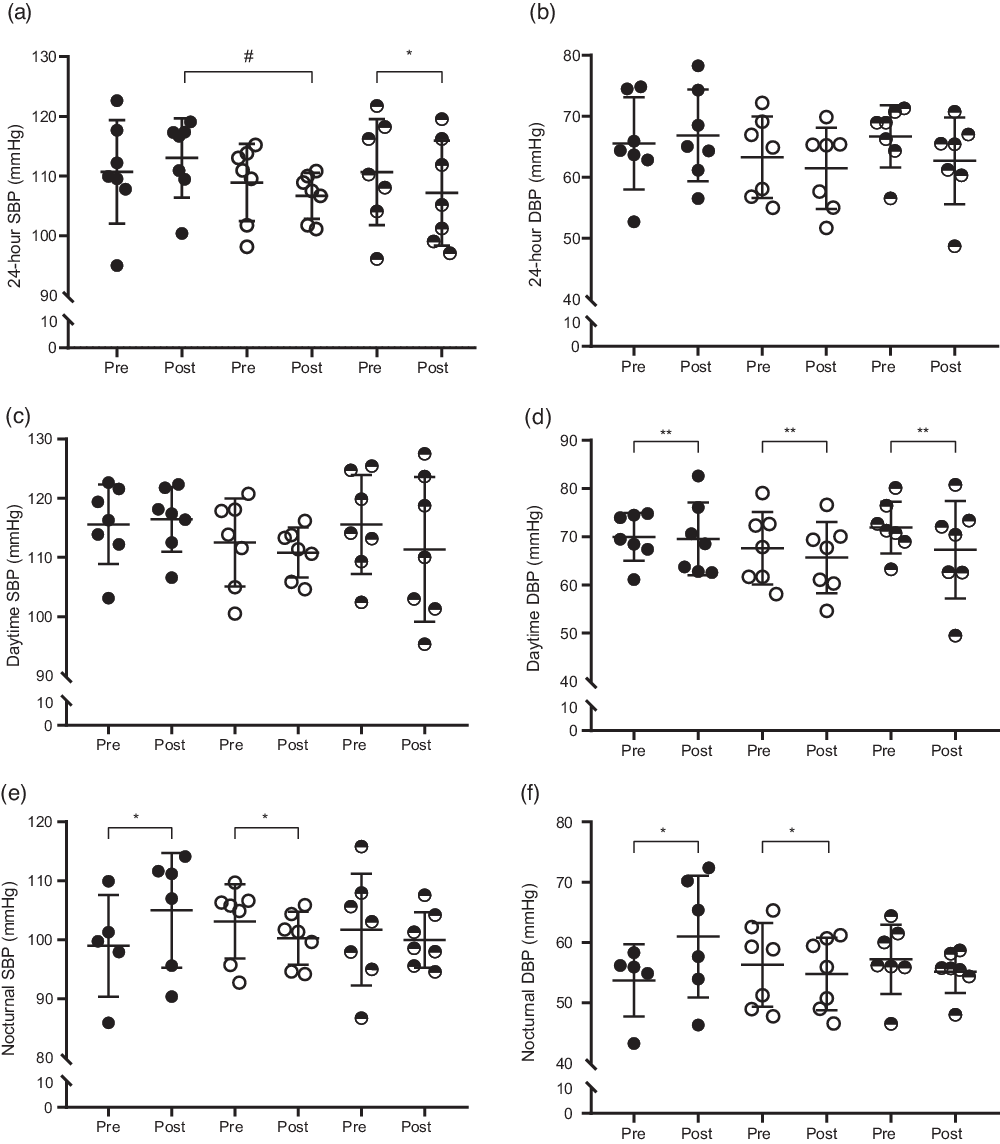
On the other hand, a significant interaction was found for 24-h systolic blood pressure (SBP) (P = 0·029), in which the HFDE group showed a reduction from the pre- to the post-intervention period (110·68 ± 8·20 mmHg to 107·17 ± 8·15 mmHg; ES: 0·40; P = 0·018), and the HFD group exhibited higher values than those found in the HGD group after 4 weeks (P = 0·018). The 24-h SBP was not significantly changed in the other groups (HFD: 110·70 ± 8·02 mmHg to 113·04 ± 6·14 mmHg; ES: 0·30; P = 0·177, HGD: 108·93 ± 6·01 mmHg to 106·70 ± 3·57 mmHg; ES: 0·42; P = 0·075). No significant differences were found in the 24-h diastolic blood pressure (DBP) (HFD: 65·55 ± 7·01 mmHg to 66·89 ± 6·96 mmHg; ES: 0·18, HGD: 63·29 ± 6·16 mmHg to 61·47 ± 6·16 mmHg; ES: 0·27, HFDE: 66·72 ± 4·74 mmHg to 62·70 ± 6·59 mmHg; ES: 0·65) and daytime SBP (HFD: 115·58 ± 6·22 mmHg to 116·44 ± 5·08 mmHg; ES: 0·14; HGD: 112·50 ± 6·88 mmHg to 110·81 ± 3·92 mmHg; ES: 0·28, HFDE: 115·56 ± 7·75 mmHg to 111·36 ± 11·30 mmHg; ES: 0·40). With respect to daytime DBP (HFD: 69·97 ± 4·58 mmHg to 69·56 ± 7·01 mmHg; ES: 0·06, HGD: 67·63 ± 6·96 mmHg to 65·69 ± 6·85 mmHg; ES: 0·26; HFDE: 71·92 ± 4·97 mmHg to 67·32 ± 9·34 mmHg; ES: 0·57), only significant effect of the time factor was found among all groups (69·84 ± 3·23 mmHg to 67·52 ± 4·50 mmHg; P = 0·029). Regarding the values of nocturnal blood pressure, significant interactions were found for SBP (P = 0·010) and DBP (P = 0·008) outcomes. The HFD group showed increases in nocturnal SBP (98·98 ± 9·13 mmHg to 104·99 ± 9·58 mmHg; ES: 0·59; P = 0·022) and in nocturnal DBP (53·71 ± 6·32 mmHg to 60·98 ± 9·95 mmHg; ES: 0·80; P = 0·009) after 4 weeks. By contrast, the HGD group exhibited decreases in nocturnal SBP (103·12 ± 5·82 mmHg to 100·26 ± 4·15 mmHg; ES: 0·52; P = 0·028) and nocturnal DBP (56·29 ± 6·43 mmHg to 54·80 ± 5·56 mmHg; ES: 0·23; P = 0·031) throughout the intervention. The HFDE group did not show significant changes for nocturnal SBP (101·73 ± 8·76 mmHg to 99·96 ± 4·34 mmHg; ES: 0·24; P = 0·552) and nocturnal DBP (57·21 ± 5·29 mmHg to 55·15 ± 3·25 mmHg; ES: 0·43; P = 0·223). There were no differences between groups for either variable (Fig. 4).
Mean ± standard deviation of blood pressure before and after the interventions. (a) 24-h systolic blood pressure (24-h SBP), ![]() , HFD;
, HFD; ![]() , HGD;
, HGD; ![]() , HFDE; (b) 24-h diastolic blood pressure (24-h DBP),
, HFDE; (b) 24-h diastolic blood pressure (24-h DBP), ![]() , HFD;
, HFD; ![]() , HGD;
, HGD; ![]() , HFDE; (c) daytime systolic blood pressure (daytime SBP),
, HFDE; (c) daytime systolic blood pressure (daytime SBP), ![]() , HFD;
, HFD; ![]() , HGD;
, HGD; ![]() , HFDE; (d) daytime diastolic blood pressure (daytime DBP),
, HFDE; (d) daytime diastolic blood pressure (daytime DBP), ![]() , HFD;
, HFD; ![]() , HGD;
, HGD; ![]() , HFDE; (e) nocturnal systolic blood pressure (nocturnal SBP),
, HFDE; (e) nocturnal systolic blood pressure (nocturnal SBP), ![]() , HFD;
, HFD; ![]() , HGD;
, HGD; ![]() , HFDE; (f) nocturnal diastolic blood pressure (nocturnal DBP),
, HFDE; (f) nocturnal diastolic blood pressure (nocturnal DBP), ![]() , HFD;
, HFD; ![]() , HGD;
, HGD; ![]() , HFDE. HFD, high-fructose diet; HGD, high-glucose diet; HFDE, high-fructose diet and exercise. Pre: week 0; Post: week 4. *Difference between pre and post; #difference between groups; **difference between pre and post considering all groups.
, HFDE. HFD, high-fructose diet; HGD, high-glucose diet; HFDE, high-fructose diet and exercise. Pre: week 0; Post: week 4. *Difference between pre and post; #difference between groups; **difference between pre and post considering all groups.
Discussion
The main findings of the present study demonstrate that the consumption of 1 g/kg of fructose daily for 4 weeks increases uric acid concentrations and blood pressure in healthy adults, regardless of body mass and body fat gains. Additionally, aerobic training attenuated fructose-induced increase in uric acid concentrations and changes in glucose concentrations, as well as prevented the impairment of nocturnal blood pressure. These results were obtained using doses of fructose similar to the average consumption of the population (∼35–60 g per day)(Reference Marriott, Cole and Lee2,Reference Siqueira, Mill and Velasquez-Melendez56,Reference Sluik, Engelen and Feskens57) . However, the American Heart Association recommends that the intake of this monosaccharide should not exceed 50 g per day(Reference Miller, Stone and Ballantyne58). The literature suggests that amounts above this value may cause metabolic changes and, consequently, increase the risk for associated diseases(Reference Livesey and Taylor59,Reference Tappy, Morio and Azzout-Marniche60) .
There is a relationship between high-fructose diets and risk of hyperuricaemia(Reference Zhang, Li and Zhang11). After fructose intake, uric acid accumulates in liver cells and their serum concentrations increase rapidly, within approximately 30–60 min(Reference Akhavan and Anderson61,Reference Carran, White and Reynolds62) . Although a meta-analysis demonstrated that daily consumption of fructose under isoenergetic conditions does not seem to increase uric acid concentrations(Reference Wang, Sievenpiper and de Souza63), some studies have shown a fructose-induced raise effect. Most studies that found an increase in uric acid used high doses of fructose (100–200 g per day)(Reference Johnson, Perez-Pozo and Lillo64–Reference Perez-Pozo, Schold and Nakagawa68). However, interventions with moderate amounts of fructose a day, similar to the doses provided by the present study, were also able to promote short(Reference Brymora, Flisiński and Johnson69) and long term(Reference Bruun, Maersk and Belza70) increases in this outcome. Stanhope et al. (Reference Stanhope, Medici and Bremer33) demonstrated that the consumption of different amounts of high-fructose corn syrup (10 %, 17·5 % and 25 % of the energy intake) for two weeks promotes negative changes in uric acid concentrations, and the magnitude of the increase is dose dependent. The group that consumed a daily amount of 17·5 % of high-fructose corn syrup from the energy intake (111 g, 61 g of fructose) showed a significant increase of 0·30 mg/dl in uric acid concentrations after the intervention. These results are in line with those observed in the present study, in which the HFD group exhibited increments of, on average, 0·28 mg/dl with daily doses of ∼66 g of fructose. Furthermore, the literature indicates that uric acid has a strong relationship with cardiometabolic diseases(Reference King, Lanaspa and Jensen9). A meta-analysis showed that an increase of 1 mg/dl in uric acid concentrations generates an increase of 13 % in the risk of hypertension in young adults(Reference Grayson, Young Kim and Lavalley71). Based on these results, the significant increase in uric acid concentrations caused by moderate doses of fructose, in just 4 weeks, may be considered clinically relevant. In contrast, despite the statistical significance, an increase of 0·28 mg/dl associated with an ES of 0·22 was found, which suggests the possibility of this result does not generate clinical changes. Although some studies consider that changes in uric acid concentrations of 0·113 mg/dl may reflect the minimally important difference for harm or benefit for uric acid(Reference Ayoub-Charette, Chiavaroli and Liu72), these data must be observed with caution.
On the other hand, the HFDE group showed a significant increase in uric acid concentrations from the middle of the intervention (week 2) to the post-intervention period (week 4), but there was no difference between the pre- and post-intervention periods. Therefore, it appears that aerobic training was not able to completely prevent fluctuations in uric acid concentrations caused by fructose, but it has avoided the increase found in the HFD group. Aerobic training improves uric acid concentrations(Reference Lamina73,Reference Sandor, Nagy and Toth74) ; however, the period of 4 weeks, with a weekly frequency of three sessions, may be insufficient for this adaptation to be developed and for the effects caused by fructose consumption to be totally prevented. In addition, both groups (HFD and HFDE) exhibited a drop in uric acid concentrations after discontinuing the consumption of drinks sweetened with fructose. This result suggests that exercise performed for 4 weeks cannot avoid fructose-induced fluctuations in uric acid concentrations, but the suspension of its consumption may be a way to inhibit this alteration. In addition, this effect may be achieved after two weeks without regular intake of ∼66 g of fructose.
One of the consequences of lipogenesis promoted by fructose is the possible accumulation of TAG in liver cells and the subsequent formation of toxic metabolites, such as diacylglycerol and ceramides. These substances derived from lipids, when stored, are responsible for causing damage to the action of insulin(Reference Stanhope, Schwarz and Keim75,Reference Dornas, de Lima and Pedrosa76) . In the HFD group, no significant changes were observed in the glucose concentrations from the pre- to the post-intervention period. However, this outcome increased from the middle to 4 weeks. Most studies that demonstrated negative effects of chronic fructose consumption on blood glucose used high doses of this sugar (> 100 g per day)(Reference Le, Faeh and Stettler42,Reference Johnston, Stephenson and Crossland65,Reference Stanhope, Schwarz and Keim75,Reference Silbernagel, MacHann and Unmuth77–Reference Swarbrick, Stanhope and Elliott79) . On the other hand, through intervention with doses of fructose and duration similar to that applied in the present study, Aeberli et al. (Reference Aeberli, Gerber and Hochuli80) demonstrated an increase of 4·50 mg/dl and 3·42 mg/dl in glucose concentrations with the consumption of 40 g and 80 g of fructose, respectively, after 3 weeks. In addition to the changes found in the HFD group, the HFDE group showed an increase in glucose concentrations from the beginning to the middle, followed by a reduction from the middle to the end of the intervention. These results suggest that aerobic exercise was able to prevent the increase in blood glucose that started to occur after two weeks of fructose consumption, since this training modality may be able to promote a decrease in this outcome in the short term(Reference Robinson, Durrer and Simtchouk81).
To our knowledge, this is one of the few studies performed in humans evaluating the effect of chronic fructose consumption on vascular outcomes and, in addition, is the first study that verified its effects on FMD. Nier and colleagues(Reference Nier, Brandt and Rajcic82) found a significant reduction in NOx concentrations after a HFD (∼160 g). Although the authors used a protocol of only 3 d, the dose of fructose used was much higher than that used in the present study, which may explain the contradiction to our result. However, studies using animal models have demonstrated that fructose-rich diets are capable of promoting endothelial dysfunction, evidenced by both a reduction in the NOx vasodilator and an increase in the ET-1 vasoconstrictor(Reference Medeiros, Gaique and Bento-Bernardes83,Reference Tran, MacLeod and McNeill84) . Contrary to these results, although similar to the result found in another study performed in humans(Reference Nier, Brandt and Rajcic82), no significant changes were found in the ET-1 outcome. However, despite the absence of statistical differences, the HFD group showed an increase in ET-1 concentrations with an ES of 0·76, suggesting a possible association of fructose on this marker and corroborating data from interventions performed on animals. Nevertheless, the HFDE group also presented moderate ES (0·53) in the FMD outcome, indicating the effect of exercise on vasodilation. Because the individuals showed high FMD values, expressive changes were not expected for this variable(Reference Green, Maiorana and O’Driscoll85). Therefore, it is suggested that our training protocol was able to produce a certain positive effect on FMD even in healthy individuals, since fructose did not induce damage to endothelial function during the intervention period.
Another consequence of fructose consumption, as pointed out in the literature, is its ability to induce hypertension. A series of mechanisms promoted by fructose may contribute to increases in blood pressure, such as stimulating Na retention in the body, impairing endothelial function by reducing the bioavailability of nitric oxide and increasing vasoconstrictors (ET-1, thromboxane A2 and angiotensin II), and chronic stimulation of the sympathetic nervous system(Reference Klein and Kiat86). This increase in blood pressure may occur in a short time of treatment with fructose (4–8 weeks), being dependent on the dose and duration of the intervention and independent of body fat gain, as evidenced in animal models(Reference Tran, Yuen and McNeill17). In this sense, in just 4 weeks of intervention, the HFD group showed increases in nocturnal SBP and DBP with ES of 0·59 and 0·80, respectively, consuming moderate doses of fructose (∼66 g) and without an increase in body fat. Corroborating our results, several authors have indicated a strong relationship between increased uric acid concentrations and negative changes in blood pressure(Reference King, Lanaspa and Jensen9,Reference El Ridi and Tallima12,Reference Grayson, Young Kim and Lavalley71) . Nguyen et al. (Reference Nguyen, Choi and Lustig87) demonstrated that an increase of 0·18 mg/dl in uric acid concentrations, associated with a high consumption of sweetened drinks, may be accompanied by increases in systolic blood pressure (2 mmHg) in adolescents. However, another study found that uric acid is related to increases in blood pressure in healthy, non-obese and normotensive men. In addition, an increase of 1 mg/dl in its concentrations predicts elevations of 27·5 mmHg in SBP and 15·2 mmHg in DBP for 5 years(Reference Masuo, Kawaguchi and Mikami88). Based on these results, an increase of 0·28 mg/dl in uric acid concentrations, as evidenced in the present study, may be responsible for the mean changes of 6·02 mmHg and 7·27 mmHg in the nocturnal SBP and DBP, respectively. On the other hand, Perez-Pozo et al. (Reference Perez-Pozo, Schold and Nakagawa68) showed that the association of allopurinol with the consumption of 200 g of fructose per day for 2 weeks prevents the increase in blood pressure caused by fructose in healthy adults. Therefore, the literature suggests that uric acid is capable of causing oxidative stress, inflammation, endothelial dysfunction, insulin resistance, activation of the renin angiotensin system and greater stimulation of the sympathetic nervous system, which are known to influence the increase in blood pressure(Reference King, Lanaspa and Jensen9,Reference El Ridi and Tallima12,Reference Feig, Madero and Jalal16,Reference Tran, Yuen and McNeill17,Reference Saladini, Mos and Fania89) . As the HFD group did not show changes in NOx, FMD, C-reactive protein, thiobarbituric acid reactive substances and HOMA2-IR throughout the intervention, the increase in nocturnal blood pressure may have been influenced by the renin angiotensin system and the sympathetic nervous system by increasing uric acid concentrations. Although these markers have not been evaluated, studies suggest that these changes mediated by uric acid may occur in the early stages of increased blood pressure(Reference Feig, Madero and Jalal16,Reference Masuo, Kawaguchi and Mikami88,Reference Mazzali, Kang and Kivlighn90) . On the other hand, despite the absence of statistical differences, an ES of 0·76 was observed in ET-1 concentrations, suggesting a tendency of increase after 4 weeks of intervention. Because fructose-rich diets cause changes in this marker in animals(Reference Tran, Yuen and McNeill17) and for the evidence that uric acid may favour its expression(Reference Cheng, Lin and Chao91), it is suggested that the increase in plasma ET-1 concentrations may have contributed to the negative effects of blood pressure. In humans, in addition to our study, few experiments were able to detect increases in blood pressure after daily fructose consumption(Reference Perez-Pozo, Schold and Nakagawa68,Reference Brymora, Flisiński and Johnson69) . Despite methodological differences, one point in common between interventions was the use of 24-h ambulatory blood pressure monitoring as an assessment method. Therefore, the evidence regarding this outcome must be observed with caution, since most studies have used traditional methods to assess blood pressure, and this factor may be related to the controversial results available in the literature.
By contrast, the HGD group showed decreases and the HFDE group showed no differences in nocturnal SBP and DBP, suggesting maintenance of the behaviour of these outcomes with the association of exercise. From the pre- to the post-intervention period, all groups showed an increase in walking activity, evidenced by the difference in time effect. From these results, it is possible to speculate that higher levels of walking may have contributed to the reduction in blood pressure observed in the HGD group, since an increase in physical activity acts positively on this outcome(Reference Beijer, Lampa and Sundström92,Reference Medina, Lobo and Souza93) , and this increase was not enough to inhibit the effects of fructose. In addition, the HGD group showed a small (ES: 0·19), but significant, increase in VO2peak, which may also have influenced the improvement in blood pressure(Reference Faselis, Doumas and Kokkinos94,Reference Sharman, La Gerche and Coombes95) . About this increase in VO2peak, it is possible to speculate that two mechanisms may have contributed to the result. Although there was no statistical difference between the three groups, the individuals in the HGD group started the study with lower values of VO2peak, which may be more vulnerable to suffer changes. Moreover, this group also showed an increase in walking levels throughout the intervention, which may contribute to improvements in physical fitness(Reference Dyrstad, Anderssen and Edvardsen96). Therefore, it is suggested that the increase in VO2peak may have been influenced by the combination of these factors found in the HGD group. On the other hand, structured aerobic exercise, performed three times a week, was able to prevent negative alterations generated by fructose in the nocturnal blood pressure. In addition, the HFDE group showed improvements in the 24-h SBP, in which it was not influenced by daily fructose consumption even with an increase in uric acid concentrations. Saladini et al. (Reference Saladini, Mos and Fania89) demonstrated, based on data from a cohort study, that adults engaged in regular physical activities did not present a risk of hypertension, regardless of uric acid concentrations. However, the authors suggest that exercise may modulate the mechanisms involved in increasing blood pressure. Of these mechanisms, the present study observed an increase in FMD with moderate ES and a reduction in C-reactive protein concentrations with large ES. Although both did not present significant differences over the intervention, the literature demonstrates that exercise has the capacity to cause improvements in these outcomes(Reference Ramos, Dalleck and Tjonna97,Reference Fedewa, Hathaway and Ward-Ritacco98) , and, furthermore, these positive effects are largely related to lowering blood pressure(Reference Edwards, Ziegler and Mills99).
This study has some limitations, such as the inability to evaluate outcomes related to the sympathetic nervous system and the renin angiotensin system, to better explain the results found, and the absence of dietary control after 4 weeks of intervention. In addition, the control of physical activity was not performed using activity trackers although it was evaluated through the International Physical Activity Questionnaire. However, this is the first study evaluating the chronic effect of fructose consumption associated with structured aerobic exercise on vascular parameters performed in humans. In addition, moderate doses of fructose were used, which are quantities that approximate those consumed by the population(Reference Marriott, Cole and Lee2,Reference Siqueira, Mill and Velasquez-Melendez56,Reference Sluik, Engelen and Feskens57) , contributing to the results found to become more relevant clinically.
This clinical trial demonstrated that the daily consumption of ∼66 g of fructose promotes increases in uric acid concentrations and nocturnal blood pressure within 4 weeks in healthy adults, regardless of body mass and body fat gains. The association of aerobic exercise with fructose consumption attenuates the increase in uric acid concentrations, the fluctuations in glucose concentrations and is able to prevent damage to blood pressure. These results confirm that humans are also sensitive to the metabolic effects of fructose, even when consumed in moderate amounts. In addition, aerobic exercise may be a strategy to minimise the impairments caused by the regular consumption of sweetened drinks.
Acknowledgements
This work was supported by Coordenação de Aperfeiçoamento de Pessoal de Nível Superior (CAPES), Conselho Nacional de Desenvolvimento Científico e Tecnológico (CNPQ) and Fundação de Amparo à Pesquisa do Estado do Rio Grande do Sul (FAPERGS).
A. F. V.: Conceptualisation, methodology, formal analysis, investigation, writing – original draft, visualisation, project administration; C. E. J. M.: investigation; T. R. R.: investigation, writing – review & editing; F. P. B.: investigation; G. C. dos S.: investigation; S. C. L.: investigation; J. L. T.: investigation; R. R. C.: formal analysis; R. C. O. M.: conceptualisation, writing – review and editing; A. R-O.: resources, supervision and funding acquisition.
There are no conflicts of interest.


