


Regular breakfast consumption has been inversely associated with BMI(Reference Cho, Dietrich and Brown1), yet it is not clear whether this association is due to differences in energy expenditure, metabolism or energy intake. Although the ostensible benefits of regular breakfast consumption could be due to improved diet composition with breakfast cereals(Reference Cho, Dietrich and Brown1), rather than meal pattern per se, acute consumption of breakfast can enhance glucose tolerance, insulin sensitivity and subjective and physiological satiety responses to a test drink(Reference Astbury, Taylor and Macdonald2).
A recent position statement concluded that further research is required in regular exercisers with regards to meal pattern, metabolism and appetite regulation(Reference La Bounty, Campbell and Wilson3), as research in exercising individuals in this area is sparse. However, this population do use diet/exercise strategies, such as training in the fasted state, to control body fat/mass and improve metabolic adaptations to training(Reference Morton, Robertson and Sutton4). Exercise attenuates adverse dietary outcomes such as fat-induced glucose intolerance(Reference Van Proeyen, Szlufcik and Nielens5), and the nutritional state in which exercise is performed can modulate the magnitude of these improvements(Reference Van Proeyen, Szlufcik and Nielens5). Exercise in the fasted state results in a greater reliance on fat as a substrate(Reference Enevoldsen, Simonsen and Macdonald6) and has led to its use as a tool to reduce body fat by athletes(Reference Morton, Robertson and Sutton4). Training in the fasted state also leads to enhanced fat transporter protein mRNA content(Reference Van Proeyen, Szlufcik and Nielens5), mitochondrial enzyme activity and maximal aerobic capacity(Reference Stannard, Buckley and Edge7), making exercise in the fasted state an attractive proposition for both recreational and elite athletes. On the other hand, high carbohydrate availability during exercise training may result in improved body composition, as gains in fat-free mass are amplified, whilst fat loss is similar(Reference Nybo, Pedersen and Christensen8). Hence, although there is a suggestion that exercise in the fasted state can maximise some benefits already associated with exercise, ensuing effects on appetite and metabolism are not entirely clear.
The regulation of acute energy balance involves (not exclusively) the exposure and sensitivity to the circulating hormonal and metabolic milieu(Reference Suzuki, Simpson and Minnion9), which underscores the importance of determining these changes concomitant with measuring energy balance. Exercise training improves glucose tolerance(Reference Van Proeyen, Szlufcik and Nielens5), yet acute exercise effects are less lucid(Reference Folch, Peronnet and Massicotte10–Reference Long, Wells and Englert13). Muscle glucose uptake is increased after exercise(Reference Goodyear, King and Hirshman14), as assessed in rat hindlimb muscle. However, both this method and the most commonly used technique for assessing insulin sensitivity in human subjects (the euglycaemic–hyperinsulinaemic clamp) possess some caveats. First, they ignore the gastrointestinal response to food ingestion. Direct contact of nutrients with L-cells in the intestine stimulates secretion of glucagon-like peptide 1 (GLP-1), which potentiates insulin secretion and sensitivity and reduces food intake(Reference Suzuki, Simpson and Minnion9). GLP-1 exists in two active forms; in human subjects, the primary circulating form is GLP-17–36(Reference Suzuki, Simpson and Minnion9). Acute exercise has been shown to increase GLP-1 concentrations in the fed state(Reference Martins, Morgan and Bloom15). Therefore, GLP-1 may be an important mediator in the acute regulation of energy homeostasis regarding breakfast consumption and exercise.
Second, provision of nutrients other than glucose can influence glucose tolerance and insulin sensitivity. Protein, for example, stimulates insulin and/or incretin hormone secretion(Reference Frid, Nilsson and Holst16). Flavoured milk providing mixed macronutrients is an increasingly consumed post-exercise drink due to its recovery-enhancing potential(Reference Thomas, Morris and Stevenson17). Therefore, assessing the whole-body metabolic and endocrine response to an orally ingested mixed-nutrient load provides more applicable findings to regular exercisers. Acute exercise can transiently suppress hunger(Reference Martins, Morgan and Bloom15, Reference King, Miyashita and Wasse18), possibly via changes in appetite-related hormones(Reference Martins, Morgan and Bloom15, Reference King, Miyashita and Wasse18, Reference Burton, Malkova and Caslake19). Subsequent relative energy intake is usually also reduced(Reference King, Miyashita and Wasse18, Reference Burton, Malkova and Caslake19). The influence of nutritional status on appetite regulation and energy intake following exercise is not entirely understood. Of the studies investigating appetite responses to fasted v. fed exercise, one used a high-fat (70 %) meal(Reference Cheng, Bushnell and Cannon20), which is not representative of a typical breakfast, and another compared meal-exercise sequence rather than omission of breakfast per se (Reference Borer, Wuorinen and Chao21).
Accordingly, the aim of the present study was to explore the interaction of breakfast consumption and exercise on the metabolic, endocrine and appetite responses to a commonly consumed post-exercise drink, and to assess subsequent energy intake and macronutrient balance in physically active males.
Materials and methods
Participants
A group of twelve healthy males was recruited from the student and staff population at Northumbria University between December 2010 and April 2011. All participants gave informed written consent and completed the entire study. Participants who self-reported as physically inactive, defined by less than 30 min of moderate activity, five times per week by the International Physical Activity Questionnaire(Reference Craig, Marshall and Sjostrom22); restrained eaters, defined by a score of >11 on the Three Factor Eating Questionnaire(Reference Stunkard and Messick23); or those with any metabolic disorders or on medications were omitted. The protocol was approved by the School of Life Sciences Ethics Committee at Northumbria University.
Preliminary measurements
Participants undertook preliminary tests to establish: (1) the relationship between O2 uptake and running speed on a flat treadmill (Woodway ELG, Woodway) using a four-stage, 16 min test; (2) their VO2peak using an incremental treadmill test, whereby the gradient was increased by 1 %/min to exhaustion, as described previously in detail(Reference Williams, Nute and Broadbank24). The duration of the exercise period in the main trials was calculated from submaximal O2 uptake and CO2 values in order to expend 2·9 MJ (693 kcal) of energy whilst running at a speed estimated to elicit 60 % VO2peak. This value was chosen to equate to approximately 1 h on average, whilst maintaining similar energy expenditure across participants. On the same day, participants were familiarised with the visual analogue scales (VAS) to assess subjective appetite sensations in main trials, and it was verbally confirmed that participants did not have any particular disliking of foods contained in the test meals.
Experimental design
All participants completed four trials in a randomised (performed by J. T. G with Research Randomizer version 3.0; http://www.randomizer.org/), crossover design separated by ≥ 7 d comprising a continued overnight fast followed by: (1) rest without breakfast (FR); (2) exercise without breakfast (FE); (3) breakfast consumption (1859 kJ) followed by rest (BR); and (4) breakfast consumption followed by exercise (BE). By necessity of the design (food intake and exercise), the intervention was not blinded. All trials were performed under similar laboratory conditions (ambient temperature, humidity and pressure; all P>0·05; data not shown). Food and fluid diaries were kept for the day preceding the first trial and participants were instructed to replicate this for all subsequent trials. Alcohol, caffeine and vigorous activity were prohibited for 24 h prior to trials.
On trial days, participants arrived in the laboratory at 07.30 hours after a 10–14 h fast and a cannula was inserted into an antecubital vein for blood sampling. After baseline samples of expired gas and VAS were taken, in breakfast trials (BE and BR), participants consumed a porridge breakfast. In fasting trials (FE and FR), participants were permitted to consume water only, which was consumed ad libitum on the first exercise and non-exercise trials, and water consumption was replicated for the following exercise and non-exercise trials (Fig. 1). Following 120 min of rest, during exercise trials (BE and FE), participants ran on a treadmill at 61·1 (sem 0·6) % VO2peak for 59 (sem 2) min based on the a priori estimated energy expenditure. Treadmill speed was adjusted accordingly on the first trial to obtain the appropriate VO2. Changes in speed were noted for duplication in subsequent exercise trials. In resting trials (BR and FR), participants rested for the equivalent amount of time as the exercise trials.
Schematic representation of trials.  , Breakfast consumption;
  , blood sample.

Within 20 min of exercise termination, participants ingested a chocolate milk test drink. Following a 90 min postprandial period, a homogeneous ad libitum test lunch was provided. Participants were provided with an initial 430 g (3694 kJ; 882 kcal) portion of the test meal, which was replaced upon completion. The test meal was terminated when the participant instructed that they felt ‘comfortably full’. Participants were constantly reminded to follow this instruction and were always presented with fresh, warmed portions before participant-induced termination to ensure that the end of a portion was not the reason for meal termination. Remaining food was then removed and weighed out of the sight of the participants to determine energy intake.
Anthropometric measurements
Body mass was determined to the nearest 0·1 kg using balance scales (Seca) upon arrival at the laboratory, immediately prior to and following exercise, where participants wore only light clothing. Height was measured to the nearest 0·1 cm using a stadiometer (Seca).
Test meals
The breakfast consisted of 72 g oats (Oatso Simple Golden Syrup, Quaker Oats) and 360 ml semi-skimmed milk (Tesco) and provided 1859 kJ of energy (444 kcal; 17 % protein, 60 % carbohydrate and 23 % fat). The test drink was 500 ml of chocolate milk (Yazoo, Campina Limited) and contained 1500 kJ of energy (358; 18 % protein, 63 % carbohydrate and 19 % fat). The test lunch comprised pasta (Tesco), tomato sauce (Tesco), cheddar cheese (Tesco) and olive oil (Tesco) and provided 859 kJ of energy per 100 g of food (205 kcal; 14 % protein, 52 % carbohydrate and 34 % fat).
Blood sampling and analysis
Blood samples, 10 ml, were collected at baseline, immediately prior to and following exercise (or the equivalent points in resting trials) at 15, 30, 50, 70 and 90 min following consumption of the test drink (immediately prior to the test meal). All samples were obtained whilst participants were seated upright to control for postural changes in plasma volume. Additional 5 ml samples were collected at 5, 10, 20 and 25 min following test drink ingestion, where blood glucose was determined immediately by a glucose analyser (Biosen C_line, EKF Diagnostics). From the 10 ml samples, a 20 μl capillary tube was filled with whole blood to determine blood glucose concentrations, 4 ml was dispensed into an EDTA vacutainer containing 100 μl aprotinin and immediately centrifuged at 3000 rpm at 4°C for 10 min. Plasma was stored for later determination of GLP-17–36 using an immunoassay (Phoenix Pharmaceuticals, Inc.). Remaining whole blood from 10 ml samples was allowed to stand for 30 min in a non-anticoagulant tube before being centrifuged at 3000 rpm at 4°C for 10 min. Aliquots of serum were then stored for later determination of NEFA (WAKO Diagnostics) and insulin (DIAsource ImmunoAssays S.A.) concentrations in duplicate. All plasma/serum samples were stored at − 80°C. The intra-assay CV were 5·6 and 7·2 % for NEFA and insulin, respectively. Inter-assay CV were 8·1, 3·6 and 18·5 % for NEFA, insulin and GLP-17–36, respectively. In order to reduce the inter-assay variation, samples from each participant were analysed during the same run where possible. It was decided that it was unnecessary to adjust analyte concentrations to account for plasma volume changes, as exercise of a similar and greater intensity and duration does not result in changes in plasma volume(Reference Martins, Morgan and Bloom15, Reference Burns, Broom and Miyashita25).
Energy expenditure and substrate oxidation
Expired gas samples were collected using an online gas analysis system (Metalyzer 3B, Cortex) calibrated using gases of known concentrations and a 3 l syringe. Participants wore a facemask and after a 2 min stabilisation phase, 5 min samples were obtained and averaged at baseline, at every 30 min after breakfast consumption (or equivalent time in breakfast omission trials) and at 5, 15, 30, 50, 70 and 90 min following consumption of the test drink. Expired gas was continuously sampled throughout the exercise and averaged over each 5 min period, ignoring the first 5 min to allow for steady-state values.
Substrate metabolism was calculated, assuming negligible protein oxidation, with VO2 and CO2 production values using stoichiometric equations and was adjusted during exercise to account for the contribution of glycogen to metabolism(Reference Jeukendrup and Wallis26):
 $$\begin{eqnarray} Rate\,of\,fat\,oxidation\,at\,rest\,and\,during\,exercise\,(g/min) = (1.695\times V_{O2}) - (1.701\times V_{CO2}). \end{eqnarray}$$
 $$\begin{eqnarray} Rate\,of\,carbohydrate\,oxidation\,at\,rest\,(g/min) = (4.585\times V_{CO2}) - (3.226\times V_{O2}). \end{eqnarray}$$
 $$\begin{eqnarray} Rate\,of\,carbohydrate\,oxidation\,during\,exercise\,(g/min) = (4.210\times V_{CO2}) - (2.962\times V_{O2}). \end{eqnarray}$$
VO2 and VCO2 are measured in litres/min.
Energy expenditure was calculated based on fat, glucose and glycogen concentrations providing 40·81, 15·64 and 17·36 kJ/g of energy, respectively. At rest, calculations were based on glucose providing all of the carbohydrate for metabolism, whereas during moderate-intensity exercise, carbohydrate oxidation is met by both glucose and glycogen providing a 20 and 80 % contribution, respectively(Reference Jeukendrup and Wallis26).
Subjective ratings
Paper-based 100 mm VAS were completed at baseline, prior to and immediately following breakfast and at every 30 min thereafter until exercise (or equivalent time points in breakfast omission trials); further, VAS were completed immediately following exercise and after test drink consumption and at 30 min intervals thereafter. Final VAS were completed following termination of the test meal. Questions asked were used to determine hunger, fullness, satisfaction and prospective food consumption. An overall appetite score was calculated using the following formula, as previously used(Reference Anderson, Catherine and Woodend27):
 $$\begin{eqnarray} Overall\,appetite = (hunger + prospective\,food\,consumption + (100 -- fullness) + (100 -- satisfaction))/4. \end{eqnarray}$$
Statistical analysis
Due to difficulties associated with blood collection, data for GLP-17–36 are presented from ten participants and, for all other blood analytes, from eleven participants. After the consumption of the test drink, glucose, insulin, GLP-17–36 and NEFA concentrations and appetite sensations were converted into AUC using the trapezoidal rule. Indices of insulin secretion and sensitivity, post-test drink serum insulin AUC to blood glucose AUC ratio (AUCINS/GLU) and Matsuda insulin sensitivity index (ISIMatsuda) were calculated as described previously(Reference Retnakaran, Shen and Hanley28, Reference Matsuda and DeFronzo29). Unless otherwise stated, all data are presented as mean values with their standard errors. One-way, repeated measures ANOVA was used to determine differences at baseline, between all AUC values and total fat and carbohydrate oxidation and energy expenditure between trials. Two-way repeated measures ANOVA (trial × time) was used to detect differences for all variables, and following a significant interaction effect, simple main effects analyses were employed. This approach allowed for a comparison between the four conditions (FR, FE, BR and BE) across time to determine the most appropriate diet/exercise strategy. The Holm–Bonferroni step-wise post hoc test was utilised to determine the location of the variance, and all P values reported have already been adjusted for multiple comparisons. Differences were considered significant at P< 0·05.
Results
The participants' age, height, body mass, BMI and peak O2 uptake (VO2peak) were 23·2 (sd 4·3) years, 178·0 (sd 7·0) cm, 77·2 (sd 5·3) kg, 24·5 (sd 2·0) kg/m2 and 53·1 (sd 5·5) ml/kg per min, respectively.
Blood glucose
Blood glucose concentration displayed a trial × time interaction effect (Fig. 2(A); P< 0·001). Breakfast consumption reduced time to reach peak blood glucose concentration following test drink ingestion by 10 and 4 min during rest and exercise trials, respectively (P= 0·012 and P= 0·02, respectively). Peak blood glucose concentration was unaffected by breakfast consumption during resting trials (FR: 5·95 (sem 0·20) mmol/l, BR: 5·75 (sem 0·14) mmol/l; P= 0·20). No difference was observed in peak or in time to peak blood glucose concentrations in FR v. FE trials (P= 0·73 and P= 0·28, respectively). However, in BE, blood glucose concentration reached 6·66 (sem 0·24) mmol/l, significantly greater than FE (5·89 (sem 0·17) mmol/l; P= 0·06) and BR (P= 0·030). The difference between the BR and FR trials in AUC for blood glucose approached statistical significance (Fig. 2(B); P= 0·09); but it was not significantly different between the FR and FE trials (P= 0·65); and was greater in BE v. BR trials (P= 0·012).
(A) Blood glucose concentration in response to test drink consumption in the overnight fast followed by rest without breakfast (FR, ○), overnight fast followed by breakfast and rest (BR, ●), overnight fast followed by exercise (EX) without breakfast (FE, Δ) and overnight fast followed by breakfast and EX (BE, ▲) trials. BL, baseline; PE, pre-EX. Values are means, with their standard errors represented by vertical bars. * Mean value for the FE trial was significantly different from that of BR trial (P< 0·05). † Mean value for the FR trial was significantly different from that of FE trial (P< 0·05). ‡ Mean value for the FR trial was significantly different from that of BE trial (P< 0·05). § Mean value for the BR trial was significantly different from that of FE trial (P< 0·05). ∥ Mean value for the BR trial was significantly different from that of BE trial (P< 0·05). ¶ Mean value for the FE trial was significantly different from that of BE trial (P< 0·05). (B) Time-averaged blood glucose AUC following test drink consumption. a,b,c Values with unlike letters were significantly different (P< 0·05).

Serum insulin
A trial × time interaction effect was observed for serum insulin concentrations (P< 0·001), where peak concentrations occurred at 37 (sem 3) min in the FR trial, and the delay compared with BR (29 (sem 1) min; P= 0·09) and FE (30 (sem 4) min; P= 0·10) approached statistical significance. Serum insulin concentrations rose after test drink consumption (Fig. 3(A)) to a similar peak between trials (FR: 682 (sem 71), BR: 607 (sem 46), FE: 570 (sem 72) and BE: 586 (sem 64) pmol/l; P= 0·21). The greater AUC for serum insulin in FR v. all other trials approached statistical significance (Fig. 3(B); P= 0·07, P= 0·12 and P= 0·09 for BR, FE and BE, respectively).
(A) Serum insulin concentration in response to test drink consumption in the overnight fast followed by rest without breakfast (FR, ○), overnight fast followed by breakfast and rest (BR, ●), overnight fast followed by exercise (EX) without breakfast (FE, Δ) and overnight fast followed by breakfast and EX (BE, ▲) trials. BL, baseline; PE, pre-EX. Values are means, with standard errors represented by vertical bars. * Mean value for the FE trial was significantly different from that of BR trial (P< 0·05). † Mean value for the FR trial was significantly different from that of FE trial (P< 0·05). ‡ Mean value for the FR trial was significantly different from that of BE trial (P< 0·05). § Mean value for the BR trial was significantly different from that of FE trial (P< 0·05). ∥ Mean value for the BR trial was significantly different from that of BE trial (P< 0·05). ¶ Mean value for the FE trial was significantly different from that of BE trial (P< 0·05). (B) Time-averaged serum insulin AUC following test-drink consumption.

Indices of insulin secretion and sensitivity
The AUCINS/GLU was similar between FR and BR trials (82 (sem 7) and 80 (sem 6) pmol/mmol; P= 0·45), but was reduced by exercise compared with the FR trial (FE: 70 (sem 7) and BE: 67 (sem 6) pmol/mmol; P= 0·03 and P= 0·04 for FE and BE trials, respectively). ISIMatsuda was similar between the trials (12 (sem 4), 12 (sem 4), 12 (sem 4) and 13 (sem5) arbitrary units for FR, BR, FE and BE respectively; all P>0·05).
Serum NEFA
Test drink consumption transiently suppressed NEFA concentrations and a significant trial × time interaction effect was observed (Fig. 4(A); P< 0·001). The time at which the nadir of NEFA concentrations was reached was delayed in the FR trial (81 (sem 3) min) compared with all other trials (BR: 65 (sem 3) min, P= 0·019; FE: 57 (sem 3) min, P< 0·001; and BE: 55 (sem 6) min, P= 0·007). The AUC for BR was lower than that for FR and BE trials (Fig. 4(B); P= 0·019 and P= 0·004, respectively).
(A) Serum NEFA concentration in response to test drink consumption in the overnight fast followed by rest without breakfast (FR, ○), overnight fast followed by breakfast and rest (BR, ●), overnight fast followed by exercise (EX) without breakfast (FE, Δ) and overnight fast followed by breakfast and EX (BE, ▲) trials. BL, baseline; PE, pre-EX. Values are means, with standard errors represented by vertical bars. * Mean value for the FE trial was significantly different from that of BR trial (P< 0·05). † Mean value for the FR trial was significantly different from that of FE trial (P< 0·05). ‡ Mean value for the FR trial was significantly different from that of BE trial (P< 0·05). § Mean value for the BR trial was significantly different from that of FE trial (P< 0·05). ∥ Mean value for the BR trial was significantly different from that of BE trial (P< 0·05). ¶ Mean value for the FE trial was significantly different from that of BE trial (P< 0·05). (B) Time-averaged serum NEFA AUC following test-drink consumption. a,b,cValues with unlike letters were significantly different (P< 0·05).

Plasma glucagon-like peptide 17–36
There was no trial × time interaction effect or main effects of trial on GLP-17–36 concentrations (Fig. 5(A); both P>0·05). There was also no difference in AUC (Fig. 5(B)), peak or time to peak GLP-17–36 concentrations (P= 0·17, P= 0·27 and P= 0·45, respectively).
(A) Plasma glucagon-like peptide-17–36 (GLP-17–36) concentration in response to test drink consumption in the overnight fast followed by rest without breakfast (FR, ○), overnight fast followed by breakfast and rest (BR, ●), overnight fast followed by exercise (EX) without breakfast (FE, Δ) and overnight fast followed by breakfast and EX (BE, ▲) trials. BL, baseline; PE, pre-EX. (B) Time-averaged GLP-17–36 AUC following test drink consumption. Values are means, with standard errors represented by vertical bars.

Energy intake, metabolism and balance
Energy expenditure, fat oxidation and carbohydrate oxidation did not differ at baseline (P= 0·43, P= 0·13 and P= 0·57, respectively).
In the breakfast postprandial period, energy expenditure was not significantly different between the trials (Table 1). Less fat and more carbohydrate were utilised during the breakfast postprandial period in the breakfast trials (i.e. BE and BR) v. fasting trials (i.e. FE and FR) (Table 1; P= 0·005 and P< 0·001, respectively).
Energy expenditure and substrate metabolism during the breakfast postprandial period, exercise or the equivalent rest period and the recovery period following test drink consumption (Mean values with their standard errors)

EE, energy expenditure; FO, fat oxidation; CO, carbohydrate oxidation; FR, overnight fast followed by rest without breakfast; BR, overnight fast followed by breakfast and rest; FE, overnight fast followed by exercise without breakfast; BE, overnight fast followed by breakfast and exercise.
* Mean value was significantly different from FR (P< 0·05).
† Mean value was significantly different from BR (P< 0·05).
‡ Mean value was significantly different from FE (P< 0·05).
The exercise bout lasted for 59 (sem 2) min and mean O2 uptake was similar between the FE and BE trials during this period (2·52 (sem 0·11) and 2·50 (sem 0·11) litres/min; P= 0·54). In spite of the equivalent amount of external work performed, exercise increased energy expenditure more during the breakfast trials (3279 (sem 50) kJ) compared with that during the fasting trials (2627 (sem 43) kJ; P< 0·01). Breakfast consumption reduced the reliance on fat as a substrate and subsequently raised carbohydrate metabolism in the exercise period, an effect which was independent of exercise/rest (Table 1). This resulted in similar carbohydrate balance (intake minus oxidation) post-exercise between FE and BE, in spite of a large difference in carbohydrate balance prior to exercise (pre-exercise: − 17 (sem 2) and 43 (sem 2) g, P< 0·001; post-exercise: − 108 (sem 7) and − 102 (sem 8) g, P= 0·38 for FE and BE trials, respectively). Following consumption of the test drink, energy expenditure and fat oxidation were greater in both exercise trials compared with rest trials, yet carbohydrate oxidation was similar (Table 1).
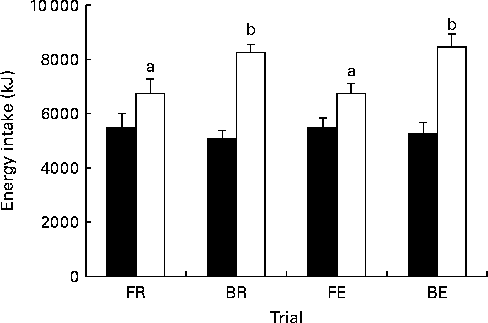
There was no detectable difference in ad libitum energy intake at lunch (Fig. 6; P= 0·78). Hence, when energy intakes from the breakfast and the test drink are taken into consideration, breakfast trials produced a greater total energy intake (Fig. 6; P< 0·001). The variation in the compensation of energy intake to account for the increase in energy expenditure (energy intake on exercise trials minus energy intake on resting trials) ranged from − 1916 to 3749 kJ ( − 458 to 895 kcal) in the fasting trials and from − 1447 to 3683 kJ ( − 346 to 880 kcal) in the breakfast trials. A total of seven individuals consumed less in the FE v. FR trial, four individuals partially compensated for exercise, consuming more in the FE v. FR trial, but not enough to overcome the exercise-induced energy expenditure. Only one participant over-compensated for exercise, consuming more than the exercise-induced energy expenditure in the FE v. FR trial. In breakfast trials, six individuals consumed less in the BE v. BR trial, five partially compensated and only one over-compensated for the exercise-induced energy expenditure. No significant relationship was present between the compensation on fast days and the compensation on breakfast days (r − 0·07, P>0·05).
Energy intake. Energy intake at lunch (■) and throughout the whole trial (□). FR, overnight fast followed by rest without breakfast; BR, overnight fast followed by breakfast and rest; FE, overnight fast followed by exercise without breakfast; BE, overnight fast followed by breakfast and exercise. Values are means, with standard errors represented by vertical bars. a,bValues with unlike letters were significantly different (P< 0·05).
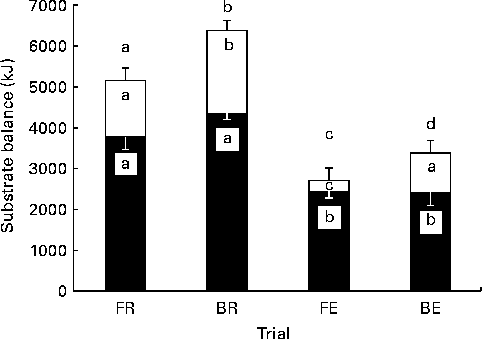
Energy balance post-lunch was most positive with BR and least positive with FE trials (Fig. 7). There was no detectable difference in carbohydrate balance when breakfast was omitted v. consumed, although the difference at rest approached significance (FR v. BR, P= 0·06; FE v. BE, P= 0·95; Fig. 7). Yet, fat balance was significantly different between all trials, apart from the FR v. BE trial, albeit in BE, a reduction which approached statistical significance was observed (P= 0·06).
Substrate balance. Carbohydrate (■), fat (□) and energy (■ and □ combined) balance at the end of the trial. FR, overnight fast followed by rest without breakfast; BR, overnight fast followed by breakfast and rest; FE, overnight fast followed by exercise without breakfast; BE, overnight fast followed by breakfast and exercise. Values are means, with standard errors represented by vertical bars. a,b,c,dValues with unlike letters were significantly different (P< 0·05).
Subjective ratings
Feelings of hunger during the exercise period were suppressed in FE v. FR (P= 0·015) and BE v. BR trials (P= 0·016). This was still the case immediately post-exercise in the FE v. FR trial (P= 0·002), yet, in the BE v. BR trial, there was no detectable difference (P= 0·45). FE also reduced ratings of prospective consumption during and after exercise v. FR (P= 0·028 and P= 0·032, respectively), whereas BE did not significantly affect prospective consumption ratings compared with BR (P= 0·67 and P= 0·15, respectively). Overall appetite rating showed similar findings (Fig. 8(A)), where the change from pre- to during the exercise period was significantly different between the FR and the FE trials (2 (sem 1) v. − 11 (sem 4); P= 0·048), but not between the BR and BE trials (6 (sem 2) v. 0 (sem 4); P= 0·21).
Overall appetite. Overall appetite sensations during (A) the breakfast postprandial and exercise (EX) periods and (B) following test drink consumption in the overnight fast followed by rest without breakfast (FR, ○), overnight fast followed by breakfast and rest (BR, ●), overnight fast followed by EX without breakfast (FE, Δ) and overnight fast followed by breakfast and EX (BE, ▲) trials. BL, baseline; DE, during EX; EE, end of EX; PL, post-lunch. Values are means, with standard errors represented by vertical bars. * Mean value for the FE trial was significantly different from that of BR trial (P< 0·05). † Mean value for the FR trial was significantly different from that of FE trial (P< 0·05). ‡ Mean value for the FR trial was significantly different from that of BE trial (P< 0·05). § Mean value for the BR trial was significantly different from that of FE trial (P< 0·05). ¶ Mean value for the FE trial was significantly different from that of BE trial (P< 0·05).

Breakfast did not influence hunger immediately pre-lunch during exercise trials (P= 0·11), but did reduce hunger in resting trials (P= 0·006). The same pattern was observed with prospective consumption (FR v. BR: P= 0·005; BR v. FE: P= 0·005; FE v. BE: P= 0·10). However, immediately prior to lunch, overall appetite was suppressed in the BR trial compared with that in both fasting trials (i.e. FE and FR) (P= 0·001 and P= 0·005, for rest and exercise, respectively; Fig. 8(B)).
There was no detectable difference in AUC for hunger between exercise and rest (P= 0·47 and P= 0·71 for FR v. FE and BR v. BE trials, respectively). The AUC for overall appetite following consumption of the test drink was greater in the FR trial v. the BR trial (Table 2; P= 0·006), and this pattern was still apparent, although it was attenuated when exercise was performed (Table 2; P= 0·029). Similar patterns were shown for hunger and prospective consumption AUC and mirrored by fullness and satisfaction AUC (Table 2).
Time-averaged AUC values for subjective appetite responses to consumption of the test drink (Mean values with their standard errors)
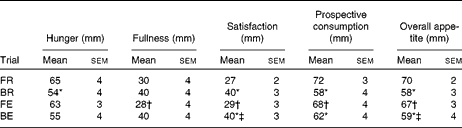
FR, overnight fast followed by rest without breakfast; BR, overnight fast followed by breakfast and rest; FE, overnight fast followed by exercise without breakfast; BE, overnight fast followed by breakfast and exercise.
* Mean value was significantly different from FR (P< 0·05).
† Mean value was significantly different from BR (P< 0·05).
‡ Mean value was significantly different from FE (P< 0·05).
Discussion
The present study attempted to examine the cumulative effects of breakfast consumption and exercise on the metabolic and appetite responses to foods consumed later in the day and on subsequent energy and macronutrient balance. The main findings were that acute breakfast consumption is likely to reduce postprandial glycaemia and insulinaemia at rest. Acute exercise did not affect glucose tolerance when breakfast was omitted, but reduced glucose tolerance when breakfast was consumed; the pertinence of this chronically should be noted with caution, given the benefits of exercise training. Exercise in the fasted state led to a greater transitory reduction in appetite compared with exercise in the fed state. Energy and fat balance were least positive following exercise in the fasted state.
Acute breakfast consumption has been shown to improve glucose tolerance(Reference Astbury, Taylor and Macdonald2). The present findings in physically active males somewhat support the previous data, although the effect may be more trivial in these aerobically fit individuals, with magnitude-based inferences(Reference Batterham and Hopkins30) indicating 41 and 59 % likelihoods of beneficial and negligible effects, respectively, on glucose tolerance. This could be due to the fact that subjects in the present study are regular exercisers and therefore displaying better basal glucose tolerance(Reference Van Proeyen, Szlufcik and Nielens5). Lower fasting blood glucose concentrations (approximately 4·5 v. 4·8 mmol/l) support this proposition. Lower NEFA exposure prior to consumption of the test drink in the BR trial compared with the FR trial is a possible cause of the potential improvement in glucose tolerance, as prolonged NEFA elevations reduce insulin-stimulated glucose disposal by inhibiting insulin signalling(Reference Hirabara, Silveira and Abdulkader31). The (non-significant) increase in insulinemia and delay in peak insulin concentrations do support this proposition.
Muscle contraction stimulates insulin-independent glucose uptake(Reference Goodyear, King and Hirshman14), and thus explains why glucose uptake is augmented following an acute bout of exercise in spite of increased NEFA concentrations, which was observed in the FE and BE trials. Increased glucose uptake is a well-established observation at the muscle(Reference Goodyear, King and Hirshman14) and whole-body level(Reference Mikines, Sonne and Farrell32). Thus, based on insulin clamp studies, it may seem surprising that there was no difference in glucose tolerance between the fasted rest and exercise trials, but this does, in fact, corroborate with studies using oral glucose tolerance tests. Until now, studies in healthy participants have shown either decreases(Reference Folch, Peronnet and Massicotte10, Reference Folch, Peronnet and Massicotte11, Reference O'Connor, Pola and Ward33–Reference Rose, Howlett and King37) or no difference(Reference Venables, Shaw and Jeukendrup12, Reference Long, Wells and Englert13, Reference Englert, Wells and Long38) in glucose tolerance following acute endurance exercise. In those displaying no difference, the tests were either performed in the fasted state(Reference Long, Wells and Englert13, Reference Englert, Wells and Long38) or glucose tolerance was assessed more than 2 h after exercise(Reference Venables, Shaw and Jeukendrup12). The present study is the first to demonstrate that when nutrients are ingested immediately post-exercise, the effect on acute postprandial glucose kinetics may depend on the nutritional state (fasted or fed) prior to exercise. It may be the accrual of this acute effect that contributes to the attenuated improvements in glucose tolerance seen during exercise training when carbohydrate availability is high(Reference Van Proeyen, Szlufcik and Nielens5).
Regarding the effects of exercise when fasted, endurance exercise increases the rate of appearance of endogenous glucose(Reference Rose, Howlett and King37). Therefore, the increase in muscle glucose uptake after exercise(Reference Goodyear, King and Hirshman14) (affecting rate of disappearance) could ostensibly be offset by the increase in splanchnic glucose output (affecting rate of appearance) and, hence, result in an increase in flux, but there was no difference in the systemic concentrations of glucose after exercise compared with that after rest when fasted. Future studies are needed to address whether this is indeed the mechanism at play.
Food consumption prior to exercise also increases splanchnic blood flow during exercise(Reference Enevoldsen, Simonsen and Macdonald6). As mesenteric blood flow is positively associated with intestinal glucose absorption(Reference Williams, Mager and Jacobson39), it can be speculated that the increase in blood flow (from breakfast consumption), combined with increased passive absorption (from exercise), results in the greater peak blood glucose concentration in the BE trial compared with the FE trial. However, recent evidence associates the increase in intestinal absorption with reduced gut blood flow occurring during intense exercise and may result in intestinal damage(Reference van Wijck, Lenaerts and van Loon40), indicating faster entry of glucose into the circulation when gut blood flow is reduced (which occurs when exercising after fasting compared with after feeding(Reference Enevoldsen, Simonsen and Macdonald6)). This adds to the confusion in the previous conjecture, as the putative increase in splanchnic blood flow in BE would result in less intestinal cell damage and reduced passive absorption, leading to a lower blood glucose AUC (assuming that endogenous glucose production and glucose disappearance remain constant, which can be presumed due to similar carbohydrate balance post-exercise and thus similar whole-body glycogen concentrations).
The present study used an exercise intensity that was lower (61 % VO2peakv. 70 % of maximum power output) than that of van Wijck et al. (Reference van Wijck, Lenaerts and van Loon40). At lower intensities (55 % VO2peak), the exercise-induced reduction in splanchnic blood flow is abolished(Reference Enevoldsen, Simonsen and Macdonald6). This makes it tempting to presume that other factors, such as heat or mechanical stresses or changes in hormone concentrations, contribute to the increase in intestinal glucose absorption following exercise(Reference Lambert41). Another factor at play could be reductions in insulin sensitivity of non-exercised (upper limb) muscle following exercise(Reference Devlin, Barlow and Horton42). Clearly, this area has great scope for future work, pertinent to the understanding of the impact of food intake and exercise on subsequent whole-body glucose tolerance.
The AUCINS/GLU was lower in both exercise trials compared with the FR trial, whereas ISIMatsuda was similar between trials, suggesting that postprandial insulin secretion is reduced immediately following exercise, but insulin sensitivity is unaffected(Reference Retnakaran, Shen and Hanley28, Reference Matsuda and DeFronzo29). This strengthens the assumption that the change in glucose kinetics seen in the present study is due to a difference in the glucose rate of appearance.
The finding that GLP-17–36 concentrations were not different between trials is in accordance with the proposition that glucose entered the circulation via passive absorption. Intravenous infusion of glucose mirroring the plasma glucose profile to oral ingestion does not augment GLP-1 concentrations(Reference Gutniak, Orskov and Holst43). Therefore, as GLP-17–36 concentrations were not different between trials, this provides support for elevated glucose appearance from passive absorption, as greater GLP-17–36 secretion would not occur. GLP-17–36 is also a potent incretin hormone, stimulating insulin secretion and also suppressing appetite(Reference Suzuki, Simpson and Minnion9). Thus, as GLP-17–36 concentration did not differ between trials, it would seem that other factors are playing a role in enhanced insulin action and appetite suppression with breakfast consumption. It should be noted that GLP-17–36 may interact with neurons expressed locally in L-cells, prior to being rapidly degraded on entry into the circulation, where its clearance can exceed cardiac output by two to three times(Reference Holst and Deacon44). Hence, GLP-17–36 can still influence appetite in spite of no detectable rise in its plasma concentrations.
There was evidence of delayed suppression of NEFA following consumption of the test drink in the FR trial compared with the BR trial, suggestive of metabolic inflexibility, again associated with insulin resistance. Exercise uncoupled the link between breakfast, NEFA and insulin concentrations, whereby, in both the FE and BE trials, insulin and NEFA concentrations were similar prior to and following consumption of the test drink. Increased NEFA availability during and following exercise is required to support higher rates of fat oxidation by skeletal muscle as carbohydrate is used to replenish glycogen stores(Reference Folch, Peronnet and Massicotte11). As such, NEFA flux is raised, and, as insulin-resisting effects of NEFA on muscle seem to be time dependent(Reference Hirabara, Silveira and Abdulkader31), turnover may be more important than NEFA concentrations for insulin sensitivity.
Exercise transiently suppressed hunger and overall appetite. This is a common phenomenon(Reference Martins, Morgan and Bloom15, Reference King, Miyashita and Wasse18, Reference Deighton, Zahra and Stensel45), yet less is known about the effect of nutritional status on the ability of exercise to influence appetite. The present study found that, compared with rest, exercise suppressed hunger and overall appetite to a greater extent when fasted compared with the fed state (approximately 17 v. 9 %, respectively). Nevertheless, it should be noted that appetite was higher in the fasting state prior to exercise. To our knowledge, this is the first crossover study to demonstrate the effect of exercise in fasted and fed conditions on appetite sensations compared with resting trials in the equivalent nutritional state.
Harmonious with preceding research(Reference Martins, Morgan and Bloom15, Reference King, Miyashita and Wasse18), the exercise-induced suppression of appetite was abolished within 30 min of exercise termination and appetite was subsequently similar between exercise and rest trials until lunch. Breakfast consumption, however, reduced overall appetite following test drink consumption by approximately 17 and 14 % in the rest and exercise trials, respectively. Despite a 10 % reduction in appetite ratings with breakfast consumption, no detectable difference in energy intake between trials was observed at lunch. This occurred regardless of the additional 1859 kJ of energy consumed during breakfast and approximately 2423 kJ of energy expended during exercise. Subsequently, energy intake was higher in breakfast trials. Observational data corroborate the present findings with daily energy intake increase in regular breakfast consumers compared with omitters(Reference Cho, Dietrich and Brown1). Yet, when BMI was measured, it was still inversely associated with breakfast consumption(Reference Cho, Dietrich and Brown1), suggesting that it may be the increased energy expenditure and the improved metabolic responses to food consumption that result in better weight maintenance.
The outcome that exercise did not influence subsequent energy intake is in accord with most of the prior research in this area, although some have found an increase in immediate energy intake(Reference Shorten, Wallman and Guelfi46). It may be that individual variation exists, whereby some individuals’ drive to eat following exercise is dominated by hedonic processes(Reference Finlayson, Bryant and Blundell47). This leads to a divergence between those who compensate for extra energy expenditure by increasing intake and non-compensators, who fail to increase intake in the face of an increase in expenditure. In the present study, the range of compensation for exercise-induced energy expenditure was large (5665 kJ of energy separated the individual who over-compensated and the individual who under-compensated the greatest). This variation in the compensation of energy expenditure is likely to account for the variation seen in body fat changes in an exercise intervention (reviewed by Caudwell et al. (Reference Caudwell, Gibbons and Hopkins48)). It is interesting to note that there was no significant relationship between the degree of compensation to exercise on fasted trials and breakfast trials, suggesting that those who over-compensate during exercise in one nutritional state (i.e. the fasted/fed state) may not over-compensate in the opposing circumstance. Another possibility is that exercise energy expenditure is gradually compensated for by energy intake, which is likely to require a period of several weeks, and even then is not likely to be fully compensated for(Reference Blundell, Stubbs and Hughes49).
The higher total energy intake with breakfast trials and the exercise-induced energy expenditure led to energy balance being most positive in the BR trial and least positive in the FE trial. BE resulted in an approximately 1110 kJ reduction in energy balance compared with FR. When taken in concert with the similar appetite sensations to resting trials, exercise may provide a more attractive option for restricting energy availability compared with omitting breakfast. Interestingly, in spite of differing quantities of carbohydrate and fat oxidised with all trials, carbohydrate balance was remarkably similar between the FE and BE trials, whereas fat balance was 3-fold more positive in the BE trial. This may not be as clear at rest, as the difference between the FR and BR trials in carbohydrate balance did approach a statistically significant difference (Fig. 7), but was higher than that in exercise trials. At least in the short term, the regulation of carbohydrate stores is more tightly regulated than fat stores(Reference Burton, Malkova and Caslake19). The findings of the present study add that consumption/omission of breakfast will not alter carbohydrate balance, whereas exercise can reduce carbohydrate balance.
The increased energy expenditure observed during exercise with breakfast consumption was provided by a higher rate of carbohydrate oxidation, this has previously been reported(Reference Miller, Mumford and Stock50–Reference Welle52) and may be magnified during running due to the weight-bearing component(Reference Taboga, Lazzer and Fessehatsion53). The relevance of this with respect to energy balance was, however, trivial, as energy balance was lower in the FE trial compared with the BE trial.
This controlled experimental study involved the provision of a popular breakfast food consumed prior to a bout of exercise or rest in physically active males, with a structure similar to the eating patterns in Western society. It could be viewed that a caveat with the present study is that the participants were physically active and that a sedentary population would benefit more from exercise/diet-induced improvements in metabolism and appetite. However, those who regularly exercise still utilise energy/carbohydrate restriction in order to regulate body composition(Reference Morton, Robertson and Sutton4). Therefore, the results are pertinent to these populations; yet, it would undoubtedly be of virtue to investigate these responses in other populations (females, sedentary and obese) to extrapolate findings to a wider population. Moreover, future work should examine whether there is a difference in energy intake in subsequently consumed meals over a longer duration.
It is also of merit to recognise that the environmental conditions were similar between trials, which is important due to the potential effect of temperature on appetite and energy intake(Reference Shorten, Wallman and Guelfi46).
The findings of the present investigation suggest that in an acute setting, energy intake from breakfast and energy expenditure from exercise are not compensated for at lunch. Consequently, energy balance was most positive following breakfast and rest and least positive following breakfast omission and exercise. When exercise is performed, it may be more pertinent to omit breakfast if a negative fat balance is desirable, although the findings of the present study are unable to predict the longer-term outcomes of energy and fat balance due to the single-meal design, and as such this conclusion should be interpreted with caution.
The present study aimed to explore the effect of breakfast and exercise on the metabolic and appetite responses to subsequent food consumption. The findings indicate that breakfast ingestion may improve the metabolic and appetite responses to subsequently consumed foods when sedentary. When breakfast is consumed, subsequent postprandial glycaemia is higher following exercise, yet care should be taken during the interpretation for chronic effects, as exercise training almost always confers a benefit for glucose tolerance and insulin sensitivity. Exercise also resulted in an ephemeral reduction in appetite, which is greater when performed fasted.
Acknowledgements
We gratefully thank the volunteers for their participation and A. Wilde for technical assistance. This project received no external funding. J. T. G. and E. J. S. designed the study, J. T. G. and R. C. V. performed the data collection and all authors contributed to data analysis and interpretation and writing of the manuscript. The authors declare no conflicts of interest.



