


1. Introduction
Design processes are often described in terms of how problems are related to solutions. Many such descriptions represent design as a sequence of activities that first define a problem and then solve it. In contrast to this problem-solving approach, other representations of design emphasise that design problems are not well understood until solutions are proposed (for a comparison, see Roozenburg & Cross Reference Roozenburg and Cross1991). These two perspectives on design are often combined in what is termed the ‘co-evolution’ of problem- and solution-spaces. That is, the problems and solutions reciprocally influence each other during design until a suitable ‘fit’ is found between a problem and a solution (Maher Reference Maher and Khozeimeh1994; Dorst & Cross Reference Dorst and Cross2001).
Despite the widespread use of the term ‘co-evolution’ in design, those accounts are not all describing the same phenomenon. Co-evolution means different things from one research account to another, sometimes describing the alternation of attention between problems and solutions, and sometimes describing the way that those problems and solutions change. This varying interpretation of the core concept makes it difficult to compare results or confidently build on prior work. Further, design co-evolution is almost always used to describe the relationship between problems and solutions rather than any of the other things that develop during design. This focus on only a single pair of categories disconnects design research from other disciplines that make much more flexible use of the co-evolution concept in the development of biological, ecological, social and industrial systems. Co-evolution should not be seen as a concept that is uniquely but loosely used to describe the development of problems and solutions, but as a concept that can generally yet precisely describe the development of many different interacting systems. Recognising such opportunities, recent work has called for ‘further conceptual development of co-evolution’, allowing it to account for ‘different levels of co-evolution’, for diverse systems such as ‘individuals, teams and projects’ (van der Bijl-Brouwer, Kligyte & Key Reference van der Bijl-Brouwer, Kligyte and Key2021: p. 583). For this, the design co-evolution concept needs to be represented more precisely and made independent of the problem–solution discourse to which it has become attached.
In this paper, we abstract the model of co-evolution in design, taking the basic process of reciprocal influence to be a useful way to represent change, but additionally considering analytic categories other than problems and solutions. For example, designers might also have ideas about the design progress that is being made and the design process that should be followed. Ideas like this, and many others, might not only co-evolve within the mind of an individual designer, they might also co-evolve ‘between’ designers, as the ideas shared by each designer reciprocally influence the ideas formed and shared by the others. To accommodate this, we formalise symbolic and visual representations of co-evolution that are independent of the analytic categories used, and which account for the cumulative effect of change within and between those categories. After we complete the development of the abstraction of the concept of design co-evolution, we illustrate how this approach can be applied to empirical design data where the same basic process of analysis is directed at different analytic categories.
In abstracting and formalising the design co-evolution model we aim to build on the design research community’s interest in co-evolutionary accounts, decomposing the co-evolution concept into its building blocks and providing opportunities for more flexible application. We also aim to develop visual representations that seamlessly transition from the conceptual to the quantitative, providing a bridge between different research traditions. Finally, as a demonstration of the applicability of the approach, we illustrate one way of coding protocol data so that different levels of co-evolution can be investigated and related to each other. We use various analytic categories to illustrate the general applicability of the approach, but we are not interested in those particular categories, just in the variety of categories that might be approached in this way.
2. Literature review
To establish the basis for our work, it is necessary to outline the standard model of design as co-evolution and the way in which that model has been modified to describe different aspects of design. This motivates the abstraction of the model for the purposes of generalisation.
2.1. Co-evolution
In the early 1990s, design researchers began representing the changing relationship between problems and solutions as one of ‘co-evolution’ (e.g., Fischer & Nakakoji Reference Fischer, Nakakoji and Gero1991; Yeh Reference Yeh1991; Maher Reference Maher and Khozeimeh1994). The most well-developed and well-known work on this is by Maher and colleagues who explored the potential for co-evolutionary genetic algorithms to enable computers to perform design work through the exploration of two changing search spaces: the problem space (P) and the solution space (S) (Maher Reference Maher and Khozeimeh1994; Maher & Poon Reference Maher and Poon1996; Maher & Tang Reference Maher and Tang2003). In this account, there is a population of possible ideas about problems and another population of possible ideas about solutions. Those populations constitute ‘spaces’ that can be searched. This process was represented diagrammatically as each of those two spaces evolving through time (t), and also mutually influencing the others’ evolution (Maher & Poon Reference Maher and Poon1996). A modification of that diagram is shown in Figure 1, where we align simultaneous states on the time axis (rather than having them offset) and relabel the time points with an arbitrary variable (i) and increments of that variable.
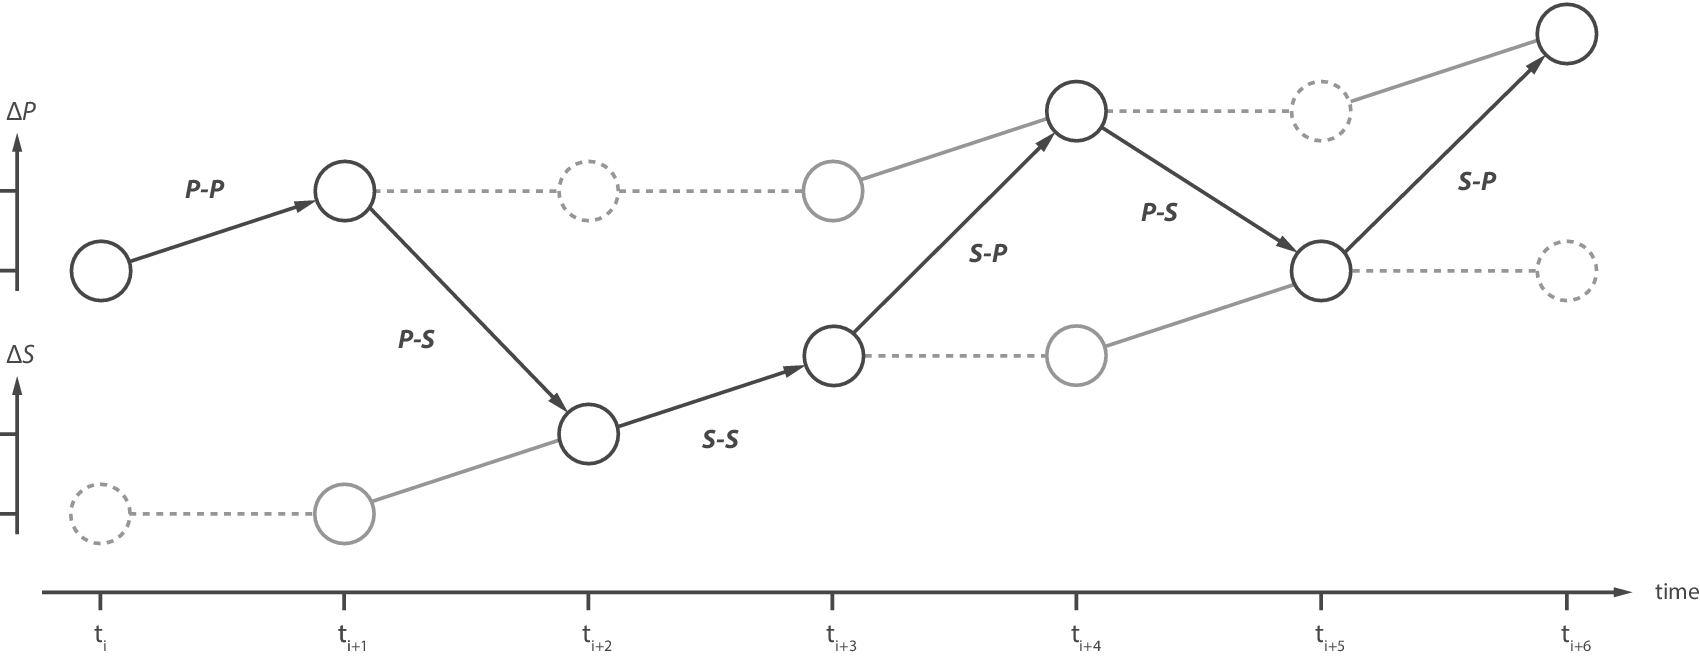
Diagram of the problem (P) and solution (S) spaces at two points in time (an arbitrary point, ti, and the next point, t i+1). A change in each space can originate from within that space (P–P, S–S) or from the other space (S–P, P–S).

A key aspect of Maher and Poon’s model is that a change in each space can originate from within that space (P–P or S–S), which is called ‘evolution’. Alternatively, a change in each space can originate from the other space (S–P or P–S). The quality of the design at any point in time is described as the ‘fitness’ of the current problem–solution pair. A lack of fitness between the current problem and the solution will result in a ‘refocussing’ of the search of each space.
To give an example, imagine a race car designer concerned with the problem of increasing the average speed of a race car around a track (Pi). Considering this problem causes the designer to focus on a particular aspect of the problem (P–P): increasing the rate of acceleration (P i+1). This interpretation of the problem prompts consideration of a possible solution (P–S): installing a more powerful engine (S i+2). The designer then recognises an alternative solution approach (S–S): developing more effective brakes would decelerate the car more quickly (S i+3). This solution prompts the designer to pose a new problem (S–P): permitting the car to brake later into corners (P i+4). Note that when the designer generates the braking solution (S i+3), this is not a solution to the acceleration problem then being considered (P i+1). Instead, the new solution changes the problem to one that that solution solves. In other words, ‘the solution that presents itself carries within it the problem redefined’ (Grossman & Wiseman Reference Grossman and Wiseman1993: p. 435). Of course, this is just one short episode in a design process where the problem and solution might each continuously change and in so doing change the other.
Although initially depicting the operation of an algorithm enabling computers to undertake creative design, Maher and Poon’s co-evolution model has subsequently been used to describe the way that historic design projects progressed over time (Poon & Maher Reference Poon and Maher1997) and the behaviour of human designers in laboratory settings (Dorst & Cross Reference Dorst and Cross2001; Maher & Tang Reference Maher and Tang2003). This has informed the study of a wide range of design phenomena, across many contexts, including individual and group design work in professional practice (Wiltschnig, Christensen & Ball Reference Wiltschnig, Christensen and Ball2013; Crilly & Moroşanu Firth Reference Crilly and Moroşanu Firth2019), and in educational settings (Storm, van Maanen & Gonçalves Reference Storm, van Maanen and Gonçalves2019; Chivukula & Gray Reference Chivukula and Gray2020). Such studies have generated many variants of the standard distinctions between problems and solutions, and of the transitions between them (for a review see Crilly Reference Crilly2021a).
2.2. Transitions and changes
Maher and Poon’s model illustrates four kinds of design change: P–P, S–S, S–P or P–S. These are sometimes understood as transitions in the designers’ attention, as they consider either problems or solutions (whether or not those problems and solutions are changing). Examples of this can be seen in measures of the relative time that designers spend in each space (Maher & Tang Reference Maher and Tang2003) or the frequency with which they switch between spaces (Yu et al. Reference Yu, Gu, Ostwald and Gero2015). Alternatively, the four kinds of design change are sometimes understood as sequenced pairs of changes to each space, such as a new solution conjecture changing the framing of the problem. Examples of this can be seen in studies where the development of a new idea is traced back to the idea preceding it (Dorst & Cross Reference Dorst and Cross2001; Wiltschnig et al. Reference Wiltschnig, Christensen and Ball2013). Here, we adopt that second perspective, considering the four kinds of design change to describe the cause and effect of a change rather than the movement of attention. Attention might move between spaces as the changes occur, but this is only associated with the phenomenon of interest, not the phenomenon itself. We also consider co-evolution to require reciprocal influence, so both P–S and S–P (in either order) are minimally required to describe an episode as involving co-evolutionary change.
2.3. What co-evolves?
In design research, the term ‘co-evolution’ is almost always used to describe the process by which problems and solutions change through a project. However, there are a few mentions of other things ‘co-evolving’, including knowledge and concepts (C–K theory) (Hatchuel & Weil Reference Hatchuel and Weil2002), theory and practice (Von Thienen et al. Reference Von Thienen, Noweski, Meinel, Rauth, Meinel, Leifer and Plattner2011) and object, actor and practice (van der Bijl-Brouwer et al. Reference van der Bijl-Brouwer, Kligyte and Key2021). In considering the interactions between an architect and client, Smulders, Reyman & Dorst (Reference Smulders, Reyman, Dorst, Bergendahl, Grimheden and Leifer2009) equate problems to functions, and solutions to structures, but also add another layer of ‘use’ which they equate to behaviour, citing Gero’s (Reference Gero1990) function behaviour structure (FBS) ontology. In similar theoretical expansions, Halstrøm & Galle (Reference Halstrøm and Galle2015) describe the co-evolution of problem, solution and audience, and Hui et al. (Reference Hui, Li, Tao and Liu2020) describe the co-evolution of problem, solution and knowledge. Crilly & Moroşanu Firth (Reference Crilly and Moroşanu Firth2019) more generally promote the idea of an ‘ecology’ of co-evolving ideas, including ideas about problems and solutions, but also ideas about design processes, users and application domains. Referring to the biological analogy on which design co-evolution concepts are based, we can observe that contemporary biological accounts emphasise (i) the co-evolution of more than just pairs of species and (ii) co-evolution at multiple levels of analysis, including processes that take place within and between species (for a review, see Crilly Reference Crilly2021b).
Clearly, co-evolutionary accounts of design projects need not be restricted to just the reciprocal influence of problems and solutions. However, in previous studies, modifications and extensions of the basic co-evolution model have been made in response to the specific questions being addressed by the researchers or the specific features of the dataset being analysed [e.g., see recent projects by Chivukula & Gray (Reference Chivukula and Gray2020) and Martinec et al. (Reference Martinec, Škec, Perišić and Štorga2020)]. In contrast, we propose a different approach: examining the underlying structure of the co-evolution model and developing a more abstract and formal description which allows it to be applied more generally. As such, our approach is not driven by any particular research question about design, but instead by the objective of developing a more general representation of how change occurs in design. This will allow models of design co-evolution to be more flexibly applied to the development of design ideas in different analytic categories. It will also allow for a range of presently-disconnected topics to all be considered in co-evolutionary terms, encouraging integration or consolidation (for motivations, see McMahon Reference McMahon2012; Cash Reference Cash2018; Crilly Reference Crilly2019).
In developing representations of the design process, we are engaging in the conceptual development of a descriptive approach. Descriptions of design are an important part of design research (Finger & Dixon Reference Finger and Dixon1989), making up two of the four stages of the ‘DRM’ research framework (Blessing & Chakrabarti Reference Blessing and Chakrabarti2009). Descriptive research is used to represent how design is done, either as a standalone research activity, or as an activity conducted both before and after prescriptive research interventions. Since the 1990s the design co-evolution model has provided a framework for such descriptions, both as a research output and as an input to educational activities. For example, descriptions of design as a co-evolutionary process are prominent in accounts of ‘design thinking’, promoting the understanding of design activities beyond design researchers and design practitioners (Kimbell Reference Kimbell2011; Wrigley, Mosely & Mosely Reference Wrigley, Mosely and Mosely2021). Descriptive accounts can also form the basis for the development of predictive theory, but we do not engage in that here.
3. Abstraction and generalisation
To accommodate our abstraction and generalisation of the co-evolution concept, we first introduce some changes to the notation and graphics of the co-evolution diagram. For ease of comprehension, we initially focus on the traditional problem–solution spaces before examining other analytic categories.
In Figure 1, we reproduced Maher and Poon’s co-evolution diagram with some modifications made to improve clarity. We now propose further modifications to allow it to depict the change in a state space over time in the form of a simple graph. To aid comprehension, we initially retain a focus on the two categories of problem (P) and solution (S), and the four categories of influence (P–P, P–S, S–P, S–S). However, we now indicate two possible states for each idea at t i+1: if the idea is unchanged then it is represented at the same height as at ti; if it has changed then it occupies a higher position (increasing by one increment on the vertical axis) and gains a prime mark. This diagram (see Figure 2) represents all the possible influences that might act within or between two spaces from one point in time to the next, but we will only consider the action of one influence at a time.
Representation of how problem–solution spaces can change from one point in time to another. If a space has changed since the previous time point, then this change is indicated with an incremental upward displacement (ΔP or ΔS) and the addition of the prime notation. If no change has occurred, then there is no vertical displacement.

We define problem–solution co-evolution as reciprocal influence between problem and solution. This minimally requires both a P–S transition and an S–P transition, in either order. The remaining two transitions, P–P and S–S, can be included in co-evolution, but are not required. An illustrative example of a design sequence involving co-evolution is shown in Figure 3. For both the problem space and the solution space, we represent the cumulative incremental count of the first occurrences (upward climbing). Through a series of first occurrences, each space is expanded (e.g., designers saying new things in the design session about the problem or solution). Each vertical increment is the same size because it is not proportional to the magnitude of the change, just the occurrence of the change. No downward increments are possible, even if an idea is explicitly discarded, because the idea is still ‘there’ in the cumulative expansion of the space that has been explored. The distance between the P and S lines only represents a difference in the relative expansion of the two spaces, it does not represent a divergence or convergence of the ideas, such as a good fit between them (cf. Storm et al. Reference Storm, van Maanen and Gonçalves2019).
Representation of an example design sequence in which problem and solution spaces change across seven time points. Co-evolution can be observed across the whole sequence, and is minimally observed either from t i+1 to t i+4, or from t i+3 to t i+5, or from t i+4 to t i+6. As each space changes, it increments upwards, indicating its cumulative expansion. The vertical distance between the two spaces only represents the relative expansion of the spaces.
In the conventional co-evolution model of design, there are two kinds of spaces: problems (P) and solutions (S). Changes or transitions can take place within a space (P–P or S–S), or they can take place across spaces (P–S or S–P). More generally, we could identify P and S as analytic categories, each with their own boundary. Changes that originate within a category boundary are the result of endogenous influences (e.g., P–P or S–S); changes that originate outside a category boundary are the result of exogenous influences (e.g., P–S or S–P).
However, P and S are not the only categories that are relevant to the analysis of design. There are many other categorical schemes, including but not limited to,
-
(i) Design ideas and design processes (e.g., linear and iterative approaches)
-
(ii) Information related to design, build and test activities (e.g., prototype construction and testing)
-
(iii) Ontologies of function, behaviour and structure or state (e.g., FBS)
-
(iv) Models of design concepts and design knowledge (e.g., C–K theory)
-
(v) The ideas of different stakeholders in the design (e.g., designer and client)
-
(vi) The ideas of different designers in a team (e.g., Designer X, Designer Y and Designer Z)
-
(vii) The ideas of different design teams (e.g., Team A, Team B and Team C)
-
(viii) The design ideas related to different projects, organisations or industries (e.g., Project 1 and Project 2).
It is important to stress here that we do not take any of these categorical schemes to necessarily represent how designers think about their work. Instead, they are presented as categories of analysis, such as in the analysis performed by a researcher trying to understand and represent a design process.
The individual categories within each categorical scheme can be seen to change through time with some of these changes driven by endogenous influences and some driven by exogenous influences. For example, two designers working together (Designer X and Designer Y) might each be viewed as different analytic categories, and within each designer, their problems and solutions (P and S) might be seen as different analytic categories. When working individually, without interaction, each designers’ ideas about problems and solutions might change in response to endogenous influences (P–P or S–S) or exogenous influences (P–S or S–P). When interacting with each other, each designers’ ideas about the design (whether problems or solutions) might change in response to endogenous influences (X–X or Y–Y) or exogenous influences (X–Y or Y–X). So, for each designer, we could say that their problems and solutions both evolve and co-evolve, and we could additionally say that the ideas of the two designers evolve and co-evolve (with or without referring to problems and solutions). Here, as with the conventional model of design co-evolution, we might imagine a reciprocal influence between different categories of ideas, whether those ideas are categorised according to their relating to problems and solutions, or according to who generates the idea.
Similar descriptions could be given for the endogenous and exogenous influences that affect change in any of the analytic categories outlined above, or any others. As such, we might talk about the evolution and co-evolution of function, behaviour and structure during design, or of different members of a design team, or of different design teams, or of different design projects, and so on. In each case, we simply identify the categories of interest and then identify the endogenous and exogenous influences on those categories. Consistent with our earlier definition of problem–solution co-evolution, our more general definition of design co-evolution minimally requires reciprocal exogenous influence between categories and additionally permits endogenous influences.
This general approach can be captured in formal notation.
Change of state within a category: Given the state σ of a category Ck at time ti and at time t i+1, respectively, a change of state of that category (Δσ(Ck, t i+1)) is defined as follows:
 $$ \Delta \unicode{x03C3} \left({C}^k,{t}_{i+1}\right):\unicode{x03C3} \left({C}^k,{t}_i\right)\to \unicode{x03C3} \left({C}^k,{t}_{i+1}\right), $$
where σ(Ck, t i+1) ≠ σ(Ck, ti).
A change of state is called endogenous, Δσn(Ck, t i+1), if it is caused by a transformation τ of the state of that category (Ck) prevailing at time ti:
 $$ {\Delta \unicode{x03C3}}^n\left({C}^k,{t}_{\mathrm{i}+1}\right)=\unicode{x03C4}\;\left(\unicode{x03C3} \left({C}^k,{t}_i\right)\right). $$
Evolution is consistent with this definition of endogenous change.
A change of state of a category Ck is called exogenous, Δσx(Ck, t i+1), if it is the result of a transformation τ of a state of a different category (C l) at time ti:
 $$ {\Delta \unicode{x03C3}}^x\left({C}^k,{t}_{i+1}\right)=\unicode{x03C4}\;\left(\unicode{x03C3} \left({C}^{\mathrm{l}},{t}_i\right)\right), $$
where Ck ∩ C l = ∅.
Co-evolution is defined as reciprocal exogenous change across two categories, that is:
 $$ {\Delta \unicode{x03C3}}^x\left({C}^k,{t}_{i+1}\right)=\unicode{x03C4}\;\left(\unicode{x03C3} \left({C}^{\mathrm{l}},{t}_i\right)\right), $$
and
 $$ {\Delta \unicode{x03C3}}^x\left({C}^{\mathrm{l}},{t}_{j+1}\right)=\unicode{x03C4}\;\left(\unicode{x03C3} \left({C}^k,{t}_j\right)\right), $$
where Ck ∩ C l = ∅.
For this definition of co-evolution, it is not relevant whether time t i+1 precedes or succeeds t j+1, or even if t i+1 equals t j+1. For example, when applied to problems and solutions as categories, this allows for co-evolution to be either problem-driven (i.e., co-evolution starting with the problem-space influencing the solution-space) or solution-driven (i.e., co-evolution starting with the solution-space influencing the problem-space).
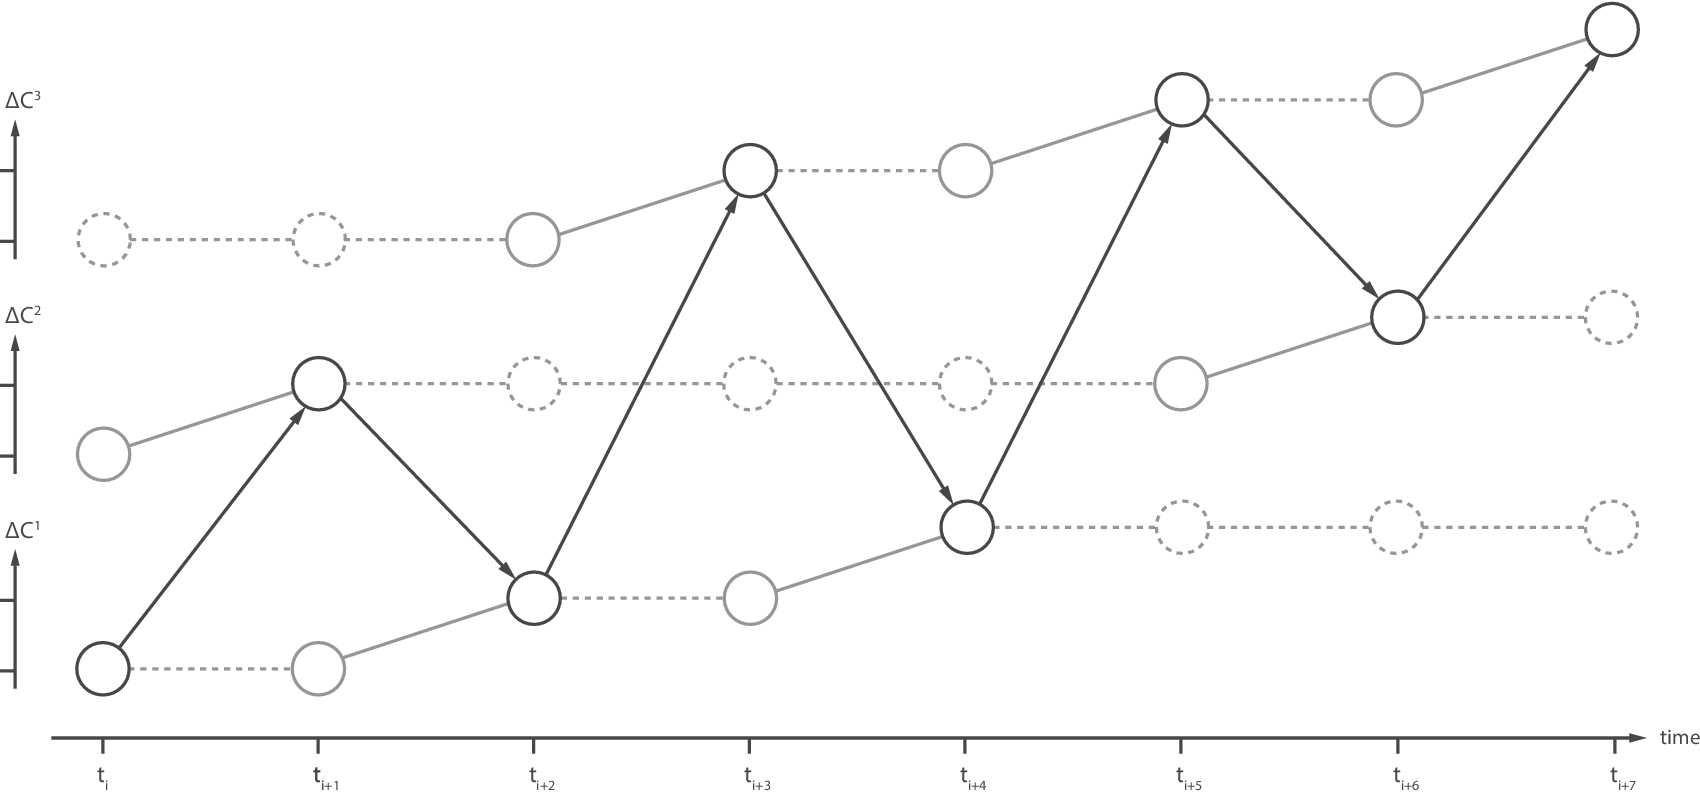
The definitions above are independent of the analytic categories chosen, and of how many such categories there are. This can be partially represented through a further modification of our basic co-evolution diagram so that it accommodates more than two analytic categories (see Figure 4). When describing reciprocal influences between only two categories, an exogenous influence on one category must originate from the other category. For example, if problems and solutions are the only categories considered then an exogenous influence on the problem must originate with the solution. However, when more than two categories are considered, an exogenous influence might originate from any of the other categories. For example, if we have three categories, C 1, C 2 and C 3 then an exogenous influence on C 1 may originate in C 2 or C 3; an exogenous influence on C 2 may originate in C 1 or C 3, and so on.
Representation of how the spaces for three analytic categories, C 1, C 2 and C 3 can change from one point in time to another. These categories might represent, for example, three kinds of ideas, three designers or three design projects. Any number of categories might be represented this way, across any number of time points.

The multiple possible origins of exogenous change must be considered when defining what is minimally required for co-evolution to be observed. Clearly, if two categories (say, C 1 and C 2) are reciprocally influencing each other but the third (say, C 3) is neither influenced nor influential, then we would say that C 1 and C 2 are co-evolving but they are not co-evolving with C 3. In this case, we cannot say that C 1, C 2 and C 3 are all co-evolving together. For all three categories to co-evolve together we require each possible category pairing (C 1 and C 2, C 1 and C 3, C 2 and C 3) to co-evolve (see Figure 5). This reasoning can be extended to any number of categories.
Representation of an example design sequence in which three analytic categories change across eight time points. The co-evolution of C 1 and C 2 can minimally be observed from t i to t i+2; the co-evolution of C 1 and C 3 can minimally be observed from t i+2 to t i+4; the co-evolution of C 2 and C 3 can minimally be observed from t i+5 to t i+7. The co-evolution of all three categories can only be observed from t i to t i+7, because only across that time period is reciprocal influence evident across all possible category pairings.
4. Illustrations with data
Equations (3), (4) and (5) are the complete definition of co-evolution. Here we present illustrations of the potential of our descriptive approach. We focus on examples of what designers do (our data), only to illustrate the kinds of things design researchers might do (in this case us). The generality of our approach would allow researchers with a wide range of interests to examine other kinds of data, identifying different categories of interest and exploring a wide range of phenomena.
4.1. Data collection and representation
We use data from a 1-hour design protocol drawn from a set of 19 design sessions that involved teams of three professional engineering designers designing a future personal entertainment system (Milovanovic, Gero & Becker Reference Milovanovic, Gero and Becker2021a, Reference Milovanovic, Gero and Becker2021b).
The utterances in the design protocol were segmented and coded using the FBS coding schema (Gero & Kannengiesser Reference Gero, Kannengiesser, Chakrabarti and Blessing2014). This describes how a designer (including a design team) designs an object (including all the elements that a designer includes in their design, such as physical, natural and virtual elements, as well as users and uses). For further details see the Appendix.
4.2. Illustrations
The coded protocols were analysed as illustrations of how the concept can be used according to our formal definitions for endogenous and exogenous change, and we exemplify co-evolution using three categorical schemes: (i) problems and solutions (P, S), (ii) different designers (X, Y and Z) and (iii) FBS ontology. When applied as a coding scheme the FBS ontology produces six codes: requirements that come outside the designer (R), functions, which are the intended purposes of what is being designed (F), the behaviours expected of the resulting design (Be), the structure of the design, that is, the elements and their relationships that go to make up the design (S), the behaviour derived from structure, that is, the behaviour of the design (Bs), and documents representing the design (D). More details about the FBS ontology can be found in Gero & Kannengiesser (Reference Gero, Kannengiesser, Chakrabarti and Blessing2014). Examples of segments from the protocol, their coding and their mapping onto the three examples we analyse are presented in Table 1. (Note that throughout this article, we italicise P and S when referring to problems and solutions, to disambiguate the S in P–S from the S in FBS, which we do not italicise.)
Example segments from the protocol, with their corresponding FBS codings, and how these map onto the three analyses

4.3. Illustration 1: categories of problem and solution
Our first illustration of a possible analysis of the data uses the commonly presented problem and solution spaces as two nonoverlapping categories where endogenous and exogenous change of state can occur. Here, changes of state are established by the expansion of problem and solution spaces as evidenced by the first occurrence of a new FBS design issue related to the problem space or the solution space, respectively. The problem space comprises R, F and Be issues, and the solution space comprises Bs, S and D issues. (The problem and solution categories could alternatively be obtained directly from the protocol without recourse to any FBS coding.)
The changes to the different design spaces are shown in Figure 6 as a cumulative count graph, consistent with the conceptual graph in Figure 3. Every increment in the accumulation of problem issues and solution issues is brought about by either endogenous or exogenous changes.
Graph of the cumulative expansion of the problem and solution spaces through a sequence of endogenous and exogenous changes. Endogenous changes comprising the evolution of the solution space are represented by the orange line; those comprising the evolution of the problem space are represented by the red line. Exogenous changes are represented by the blue line, where reciprocal exogenous change represents co-evolution.

Information gleaned from Figure 6 shows that the co-evolution of problems and solutions occurs in spurts across this design session and that co-evolution occurs even near the end of the session. Recall that we are here defining co-evolution in terms of exogenous change between categories, rather than just attention switching between categories. The data show that if we had instead used attention switching as a proxy for change then we would have overestimated the number of co-evolution occurrences by almost 50%. Recall also that we are defining co-evolution as reciprocal exogenous change, and so any individual exogenous change (P–S or S–P) does not constitute co-evolution, it is just a part of it. This means that isolated exogenous changes (such as the one around segment number 261) would only be considered part of a co-evolutionary episode if the time frame for analysis includes a neighbouring exogenous change in the opposite direction (such as that around segment number 241). Endogenous changes (P–P or S–S) might be included in that time frame (such as all the endogenous solution change in that period) but that would not be a requirement.
4.4. Illustration 2: categories of designer X, designer Y and designer Z
In our second illustration of a possible analysis, the individual design spaces of the three designers are used as three nonoverlapping categories. Here, all six FBS design issues brought up by one of the designers are grouped together to form that designer’s design space. Changes of state in the three design spaces (one for each designer) are established by the first occurrence of new FBS design issues for a designer.
The changes to the different design spaces are shown in Figure 7, in terms of the endogenous and exogenous changes for each of the three designers. This is consistent with the conceptual graph in Figure 5.
Graph of the cumulative expansion of the design spaces produced by the three designers (X, Y and Z) through a sequence of endogenous and exogenous changes. Exogenous changes across designers X and Y are represented by the light blue line, across designers Y and Z by the green line, and across X and Z by the purple line. Endogenous changes of designers X, Y and Z are represented by the dark orange, the light orange and the dark blue line, respectively.

Information gleaned from Figure 7 shows that while designers X and Z each introduced substantially more ideas than designer Y, designer Y contributed more to the co-evolution of ideas than is implied by designer Y’s relatively low number of new ideas. Further, designer Y contributed slightly more to the co-evolution of ideas with designer Z (35 exogenous changes) than designer X did with designer Z (29 exogenous changes). While designer Y only accounts for half as many coded segments as the other two designers, the influence of these is not apparent until their role in co-evolution is examined. Thus, designer Y is an important contributor to the co-evolution of the design ideas, an observation that cannot be made directly from the video recording or transcript. Again, these descriptions of co-evolution are descriptions of how each designer changes the ideas being discussed, not the turns they take in the discussion. If the same data is analysed on the basis of simple turn-taking, we would have overestimated the number of co-evolution occurrences by about 100%.
4.5. Illustration 3: categories of function, behaviour and structure
Our third illustration of a possible analysis uses function, behaviour and structure spaces as three nonoverlapping categories. In this conceptualisation, the R and D issues are ignored to allow us to focus on F, B and S. The Be and Bs issues – which in the previous analysis were separated into P and S spaces, respectively – are grouped together to compose the B space. Changes of state in the F, B and S spaces are established by the first occurrence of new F, B and S issues, respectively.
The changes to the different design spaces are shown in Figure 8. This is again consistent with the conceptual graph in Figure 5.
Graph of the cumulative expansion of the function (F), behaviour (B) and structure (S) spaces through a sequence of endogenous and exogenous changes. Exogenous changes across F and B are represented by the light blue line, across B and S by the green line, and across F and S by the red line. Endogenous changes of F, B and S issues are represented by the dark orange, the light orange and the dark blue line, respectively.

Information gleaned from Figure 8 shows that most co-evolutionary activity occurs between behaviour and structure rather than between function and behaviour or function and structure. Co-evolution between behaviour and structure occurs almost continuously through the design session, something that cannot be seen in the video of the session. Further, we can see that most of the co-evolutionary activity involving function occurs in the first half of the design session and that most co-evolution occurs between function and behaviour, not function and structure. The existence of only few occurrences of function-structure co-evolution is an indication of only few occurrences of system 1 thinking. System 1 thinking is contrasted with system 2 thinking (Kahneman Reference Kahneman2011). System 1 thinking is immediate without reasoning, rather like what is labelled ‘intuition’ or a ‘gut feeling’. System 2 thinking involves reflection and reasoning and takes time. In design, System 2 thinking involves going from intentions (F) through expected behaviours (Be) to a design (S). Whereas, System 1 thinking goes directly from function to structure, bypassing behaviour (Kannengiesser & Gero Reference Kannengiesser, Gero, Eriksson and Paetzold2019).
5. Discussion
In design research, concepts of co-evolution have almost exclusively been used to describe how problems and solutions change, and how the relationship between them changes too. There have been occasional suggestions that an additional category could be added, such as audience (Halstrøm & Galle Reference Halstrøm and Galle2015) or knowledge (Hui et al. Reference Hui, Li, Tao and Liu2020). There have also been suggestions that subcategories of problems and solutions could be defined by considering problem–solution variants, such as function, behaviour and structure (Maher & Tang Reference Maher and Tang2003), knowledge and rules (Yu et al. Reference Yu, Gu, Ostwald and Gero2015), or analysis, synthesis and evaluation (Martinec et al. Reference Martinec, Škec, Perišić and Štorga2020). However, problems and solutions have remained central to concepts of co-evolution. Here, we have taken a different approach, and examined the underlying structure of co-evolution to define an abstract and formal representation of how change occurs within and between any analytic categories. This structure is independent of the categories chosen and of how many categories there are. What results is a co-evolution model that is more generally applicable to the way change occurs in design. We here discuss the opportunities offered by this approach, its limitations and suggestions for further work.
5.1. Opportunities
Prior work has often left implicit the minimal requirements for co-evolution to be identified, leading to inconsistencies between studies and inconsistencies between definitions and examples. Here, we defined co-evolution to be the reciprocal influence between categories of analysis. This is different to those few cases where clear definitions of co-evolution episodes have been offered, or where unidirectional influence was sufficient (e.g., Wiltschnig et al. Reference Wiltschnig, Christensen and Ball2013). As such, we distinguish between simply listing the transitions which co-evolution episodes might include (e.g., P–P, S–S, P–S or S–P) and actually stating the requirements for episodes to be labelled co-evolution (e.g., P–S and S–P). This requirement for reciprocal exogenous influence is better aligned with other discourse on co-evolution in biology and the social sciences (Langerhans Reference Langerhans and Fath2008; Mitleton-Kelly & Davy Reference Mitleton-Kelly, Davy and Mitleton-Kelly2013). It is also better aligned with other aspects of design discourse, where problem solving (P–S) by itself is not taken to be co-evolution, and neither is iterative solution development (S–S), iterative problem refinement (P–P) or solution-driven problem reframing (S–P). We argue that reciprocal exogenous influence is the defining characteristic of design co-evolution, whether for problem–solution analyses or for other categorical schemes. This requirement for reciprocal exogenous influence can be extended from two categories to three or more (as illustrated in Figure 5).
The abstract form of our co-evolution model permits it to be flexibly applied to systems of categorisation that have previously been discussed in isolation. For example, in this paper, we have reported on a single process of coding to permit multiple analyses through different forms of code aggregation. This allowed us to adopt a common analytic approach to examining the way that change occurs within and between different analytic categories. Such approaches could address a long-standing problem of fragmentation in design research (McMahon Reference McMahon2012; Cash Reference Cash2018; Crilly Reference Crilly2019) and the need for multi-level analyses (Cash, Hicks & Culley Reference Cash, Hicks and Culley2015). Of course, the formulation of distinct concepts and research approaches for different topics has the benefit of consolidating work on those topics, driving progress and facilitating communication within the relevant communities. However, it also brings the cost of artificially separating those topics from other relevant work, and of making communication more difficult across communities. If a common descriptive framework for design co-evolution was found to be useful then this could promote conceptual and methodological connections between multiple areas of study.
The insights gained from studying co-evolution between various categories can potentially enhance design practice. For example, promoting awareness of the various aspects of the design space that can change in response to other aspects might further encourage designers to anticipate and search for such opportunities. This would mirror the way that entrepreneurs look for opportunities to ‘pivot’ their nascent offerings, not just in terms of the problems to be solved or the solutions to those problems, but also in terms of the many processes, structures and alliances that are related to their work (Crilly Reference Crilly2018). Looking beyond the work of individual designers, design team managers may use insights about the co-evolution between team members for composing their teams or measuring individual performance. Similarly, managers of large systems design teams might be interested in the co-evolution that occurs between subteams for better cross-team coordination and creative synergies. Whether looking at ideas, people, teams or something else, having a flexible concept of design co-evolution encourages recognition that changes in one category of analysis also change what is possible or likely in the other categories. Design progress might be identified not just in the ideas, people or teams that explicitly drive the process forward, but also in those that create an environment which promotes such progress in others.
The opportunities for connecting different levels of analysis can be seen in possible extensions of our illustrative application to data. We showed how the development of the design space can be examined by dividing that space into different categories and representing the changes that occur within and between those categories. We started by examining the traditional design co-evolution categories of problems and solutions, graphing the cumulative count of their endogenous and exogenous changes. We then examined the three designers, graphing their endogenous and exogenous changes. Our problem and solution data were aggregated across all three designers, but could have been disaggregated, separating out the first occurrences of problems and solutions for each designer. These designer-specific problem–solution spaces could be sub-divided further, into the categories from which the problems and solutions are composed (for our coding, this is R, F and Be for problems, and Bs, S and D for solutions, see Table 1). Each of these categories (P, S), super-categories (X, Y, Z) and sub-categories (R, F and Be, and Bs, S and D) could be represented as evolving and co-evolving through time, permitting a multilevel representation of design co-evolution (see Figure 9). This reveals that what might seem like endogenous change at one level of analysis can be seen to involve exogenous change when a finer-grained analysis is applied (because additional categories can now be distinguished). Conversely, what seems like a process involving exogenous change at one level of analysis might only appear as endogenous change when a courser-grained analysis is applied (because previously distinct categories have been aggregated). Overall, this provides a more formal representation of processes of individual and group co-evolution that have previously been pointed towards but not resolved (e.g., see Smulders et al. Reference Smulders, Reyman, Dorst, Bergendahl, Grimheden and Leifer2009; Chivukula & Gray Reference Chivukula and Gray2020). For example, an endogenous change Δσn of super-category C sup = Z (i.e., within team member Z) at time ti may include an exogenous change Δσx of subcategory C sub = S (i.e., within the solution space of team member Z) at the same time ti.
Multi-level representation of change within and between analytic categories. Starting in the upper-left bounding box, ideas are seen to change within, and between, three designers (X, Y and Z). A sequence of Designer Z’s idea development is identified, and considered with a finer-grained analysis in the bounding box below. Here, that same sequence can now be seen as involving change within and between Designer Z’s problems and solutions (P, S). Moving to the right (grey horizontal arrow), a sequence of Designer Z’s solution development is identified, and considered with a finer-grained analysis in the bounding box below. Here, that same sequence can be seen as involving change within and between three different categories: Behaviour-derived-from-structure, Structure and Description (Bs, S and D). These changes to the scope and resolution of the analysis could be continued (for example) into subcategories of Structure and into super-categories of which the design team is only a component (such as projects, organisations and industries).

Representations such as Figure 9 bear some similarities to other multilevel representations of design which connect macro, meso and micro accounts of design activity (e.g., see Cash et al. Reference Cash, Hicks and Culley2015: p. 22). The difference here is that we are emphasising the interactions between categories at each level and how they relate to changes at other levels. We also do not define time frames as the distinction between levels (the same time frame could be used for all levels of analysis in Figure 9) and only consider terms like ‘micro’ and ‘macro’ to be relative terms rather than descriptions of stable levels of analysis (for discussion of ‘flexible’ levels, see Klein, Tosi & Cannella Reference Klein, Tosi and Cannella1999). For example, we could extend beyond what we have explored in the illustrative analyses reported in this paper to include further subcategories (e.g., the subcategories of Bs) and further super-categories (e.g., the different projects that the designers work on). More generally, such a representation could be constructed for any set of analytic categories, along with their subcategories and super-categories. This need not include categories of problems and solutions at all, as illustrated by our second and third analyses. Additionally, the number of categorical levels that are identified between a system and its sub-systems is arbitrary, and so any number of levels of granularity might be defined, depending on the researchers’ analytic framework and objectives.
5.2. Limitations and future work
Even if co-evolution in design is accepted as a general form of description that is independent of analytic categories, this still leaves the question of which categories are best suited to co-evolutionary accounts. This is a question for future work to address. Some possible categories are listed in Section 3, but unlike our illustrations, such categories need not include problems and solutions, design team members or elements of the FBS ontology. We simply chose these categories because they are already widely understood. At the opposite end of the spectrum, it would be possible to define analytic categories using approaches such as cluster analysis and multidimensional scaling (Borg & Groenen Reference Borg and Groenen2005), where the characteristics of the categories do not necessarily derive from any intuitive understanding of the design activities being undertaken. However, such categories could still be identified and the reciprocal influence between them could be traced as part of deeper investigations.
Whatever categories are chosen, an inherent tension in co-evolutionary accounts should be acknowledged. One the one hand, the categories are considered as nonoverlapping so that endogenous and exogenous change can be distinguished from each other. On the other hand, the categories are, by definition, reciprocally influencing each other during co-evolution. This means that a change originating in one category might already include the influence of a change that originated in another category. In this sense, an influence from one category might then be said to ‘subsume’ influences from other categories. Endogenous changes might therefore subsume prior exogenous changes, blurring the distinction between category boundaries and influence types. For some analyses, maintaining a distinction between categories might become increasingly difficult or unhelpful. This challenge has already been documented for problem–solution categories (Crilly Reference Crilly2021a: pp. 320–323), but is something that would require further investigation for any other set of analytic categories that might be considered in co-evolutionary terms.
Whatever other categories might be considered in co-evolutionary terms, we still might expect the co-evolution of problems and solutions to receive special attention. This is because the ill-structured nature of design problems means that the design space is open to exploration, just like the solution space is (Simon Reference Simon1996: pp. 162–163). However, work in other disciplines has demonstrated that co-evolution concepts are useful for describing how a wide variety of systems develop both independently and in interaction with each other. For example, there are large bodies of influential work on the co-evolution of species in an ecosystem (for a review, see Carmona, Fitzpatrick & Johnson Reference Carmona, Fitzpatrick and Johnson2015) and the co-evolution of organisations within an economy (for a review, see Breslin Reference Breslin2016). The co-evolution of problems and solutions might be especially interesting to design researchers, but that does not mean it is the only co-evolutionary process relevant to design. Even if problems and solutions remain the main categories of interest, future work could investigate how their co-evolution is related to the co-evolution of other analytic categories. For example, is the co-evolution of problems and solutions driven by the co-evolution of problem–solution sub-categories, and does it in turn drive the co-evolution of super-categories of problems and solutions?
In our conceptual development of the co-evolution model, we made two simplifying assumptions, which are implicit in the graphical representations we developed and the illustrations we offered from empirical data. First, we only accounted for influences that originated from the previous time point. We did not consider ideas being introduced at one time point and then only later (e.g., after several time points) having an influence, whether endogenous or exogenous. Second, we only accounted for a single source of influence at any time point, and for a single change at any time point. We did not consider a single idea exerting multiple influences (e.g., causing both endogenous and exogenous change), and we did not consider a single idea being influenced by multiple sources (e.g., originating both endogenously and exogenously). The effect of these simplifications can be seen in Figures 3 and 5, where only a single influence arrow originates at any time point, and that arrow always terminates at the subsequent time point. Similar simplifications can be found (more or less implicitly) in previous work on problem–solution co-evolution, where the alternation of attention is presented as a sequence of strictly ordered events (e.g., Maher & Tang Reference Maher and Tang2003), narrow time windows are established within which co-evolution events are searched for (e.g., Wiltschnig et al. Reference Wiltschnig, Christensen and Ball2013) or single cause-effect events are monitored (e.g., Martinec et al. Reference Martinec, Škec, Perišić and Štorga2020). However, in practice we can expect the presence of out-of-sequence influences and multiple influences, and so challenging these assumptions and simplifications would be valuable, for example, through the application of linkography (Kan & Gero Reference Kan and Gero2008). Including consideration of nonconsecutive and multiple influences, especially in combination, would increase the complexity of the required notations and graphical representations for co-evolution but this would be a valuable future direction to explore.
6. Conclusions
The co-evolution model that is commonly used to analyse design behaviour is derived from a description of how computational genetic algorithms operate. Here we have modified and abstracted that model to make it better suited to describing how change occurs in projects with human designers. We have provided formal definitions of co-evolution, described its minimal form and generalised it to represent change in multiple categories. We have also distinguished between changing and unchanging categories, both in formal notation and in a set of diagrams that provide a basis for graphing co-evolution episodes. We used these to illustrate possible analyses of empirical data, graphing the way that three sets of design spaces expand over time, with those expansions driven by endogenous and exogenous influences. We performed each of these analyses separately, but also illustrated how they could be combined in a multilevel representation of design co-evolution.
Our approach opens the concept of co-evolution to further development because it can now be operationalised and represented consistently across different analytic categories, and different levels of analysis. Although our model is only descriptive, it provides a basis for theoretical and methodological integration for research topics that are currently treated separately. During design activities many things change and those changes influence other things. The more abstract and formal representation of design presented here provides a flexible basis for using co-evolution concepts to describe and represent such changes.
Acknowledgements
We wish to thank Yuzhen Luo and Mohammad Al Mestiraihi for their assistance in the FBS coding of the design protocols.
Financial support
This work was supported by the U.S. National Science Foundation (J.S.G., grant number CMMI-1762415). Any opinions, findings, and conclusions or recommendations expressed in this material are those of the authors and do not necessarily reflect the views of the National Science Foundation.
Appendix
The FBS schema includes the following categories of design issues. Requirements (R) are the design brief and constraints provided to a designer. Function (F) is the teleology or purpose of a design object. Behaviour is the attributes resulting from the object’s structure and interactions with its environment; in the context of a design process, these attributes can be either expected (Be) or derived from structure (Bs). Structure (S) is the set of components of the object and their relationships. Description (D) is the observable output of designing, such as sketches, CAD drawings, notes, etc.
The utterances contained within the turns of the speakers in the design session are split into separate segments such that each segment contains exactly one FBS code. The codes for function (F), behaviour (B) (i.e., the union of Be and Bs issues) and structure (S) were augmented with an additional code: first occurrence (FO). This additional coding was not used to augment the R and D codes in this project, but that would also be possible. The first occurrence (FO) code serves as a binary indicator whether an F, B or S issue is produced for the first time during the design session. This establishes a proxy for the expansion of the F, B or S space. Based on the binary nature of FO, no distinctions are made between the granularity or generality of the design space expansion.
The FBS coding of the design protocol was performed by two independent coders. For details of the source data see (Milovanovic et al. Reference Milovanovic, Gero and Becker2021a). For details of FBS coding see (Kan & Gero Reference Kan and Gero2017). The FO coding was done semi-automatically based on string matching (using the search function of a spreadsheet editor) and manual analysis of semantic relations including hypernyms and synonyms. This required only one human coder since the process does not involve subjective assessment. The coding of influence was performed syntactically: we make the cognitive assumption that if one first occurrence is followed by another, then the first of these influenced the second (for a discussion of the proximity of co-evolution episodes, see Wiltschnig et al. Reference Wiltschnig, Christensen and Ball2013: pp. 524, 536).


 Open access