The quantity and quality of carbohydrates have been reported to be associated with the risk and progression of a number of chronic diseases including cancer, CVD and type 2 diabetes( Reference Sluijs, Van der Schouw and Spijkerman 1 – Reference Ye, Chacko and Chou 7 ). While refined grains, sugars and sugar-sweetened beverages have been shown to be associated with an increased risk of cancer( Reference Cust, Slimani and Kaaks 3 , Reference Drake, Sonestedt and Gullberg 5 ), CVD, the metabolic syndrome, type 2 diabetes( Reference Malik, Popkin and Bray 4 , Reference Schulze, Manson and Ludwig 8 ) and weight gain( Reference Malik, Schulze and Hu 9 ), whole grains and fibre have been reported to be inversely associated with weight gain( Reference Koh-Banerjee, Franz and Sampson 10 , Reference Liu, Willett and Manson 11 ) and to play a protective role in the aetiology and management of chronic diseases( Reference De Munter, Hu and Spiegelman 6 , Reference Ye, Chacko and Chou 7 , Reference Aune, Chan and Lau 12 – Reference Post, Mainous and King 14 ). Because the type and amount of carbohydrate intake have been theorised to play a pivotal role in the pathophysiology of chronic diseases, it is important to describe the trends in carbohydrate consumption in ageing populations.
Despite these observed associations of carbohydrate quantity and quality with obesity and chronic diseases, few studies have evaluated the intake and food sources of dietary carbohydrates in different population groups across the USA( Reference Subar, Krebs-Smith and Cook 15 – Reference Cotton, Subar and Friday 20 ). Additionally, while the intake of carbohydrates and sugars in the US population has been previously evaluated cross-sectionally using the National Health and Nutrition Examination Survey (NHANES) data( Reference Austin, Ogden and Hill 19 , Reference Block 21 , Reference Marriott, Cole and Lee 22 ), no study has evaluated trends in the consumption of total carbohydrates, sugars, fibre and carbohydrate food sources in an ageing sample of US adults. These longitudinal analyses in an American population uniquely evaluated whether changes in carbohydrate intake over time have been consistent with changes in dietary guidance, food supply and product labelling.
The objective of the present study was to examine trends in the intake of dietary carbohydrates and their major food sources using the Framingham Heart Study Offspring (FOS) cohort. The study encompasses a 17-year period from 1991 to 2008, during which there has been increased emphasis on the consumption of whole grains and moderation of sugar intake in US dietary guidelines( 23 – 26 ). This period also reflected changes in the market availability of carbohydrate food sources, whole grains and foods with added sugars( Reference Adams and Engstrom 27 – Reference Popkin and Nielsen 29 ), which may have affected trends in carbohydrate intake in this population. Therefore, the present study was carried out to investigate changes in dietary carbohydrate intake from middle to older adulthood. The availability of anthropometric data also allowed the assessment of trends in carbohydrate intake among normal-weight, overweight and obese individuals.
Subjects and methods
Study population
The Framingham Heart Study (FHS) is an ongoing study in Framingham, MA, initiated between 1948 and 1953( Reference Dawber, Meadors and Moore 30 ). The FOS cohort consists of children of the Original Cohort and their spouses (n 5124). Recruitment of the FOS was initiated in 1971–1975; clinical and medical examinations were conducted, on average, every 4 years, with the last examination being conducted in 2008( Reference Feinleib, Kannel and Garrison 31 , Reference Larson, Atwood and Benjamin 32 ). Details of the FHS have been published previously( Reference Dawber, Meadors and Moore 30 , Reference Feinleib, Kannel and Garrison 31 , Reference Splansky, Corey and Yang 33 ). All research activities were consistent with the ethical standards of New York University's Institutional Review Board.
The overall retention rate of participants was 80 % from examination 5 (n 3799) to examination 8 (n 3021) with 3418 and 2720 valid FFQ at each of these examinations, respectively. We restricted our analytical dataset to include participants aged >25 years with at least three of four complete dietary assessments during examinations 5–8, reflecting the period during which dietary data were collected (n 2439–2742). Individuals who left more than thirteen blanks in the FFQ were excluded by the FHS investigators( Reference McKeown, Troy and Jacques 34 ). Additionally, per the criteria for ‘implausible intakes’ established by the FHS, participants with energy intake outside of the ranges of 2510–17 569 kJ/d (600–4199 kcal/d) and 2510–16 732 kJ/d (600–3999 kcal/d) for men and women, respectively, were also excluded from the analyses (n 160)( Reference McKeown, Troy and Jacques 34 ).
Data collection
Assessment of dietary intake
Dietary intake was assessed since 1991 using the validated 131-item Harvard semi-quantitative FFQ that queried the frequency of food intake with standard serving sizes during examinations 5–8( Reference Rimm, Giovannucci and Stampfer 35 ). The FFQ were mailed to the participants and reviewed by trained personnel along with the participants during each examination to ensure the accuracy of dietary self-reports. The frequency with which the participants consumed foods was queried using options ranging from never or < 1 serving/month to ≥ 6 servings/d in the past year( Reference Rimm, Giovannucci and Stampfer 35 ). The US Department of Agriculture (USDA) database that was used to estimate nutrient intakes from the FFQ was updated periodically to reflect changes in the food supply over time( Reference Wolongevicz, Brown and Millen 36 ).
Assessment of other variables
Height and weight were measured by trained personnel during each visit and were used to calculate BMI. Other covariates including age, education and smoking status were self-reported during each examination( Reference Feinleib, Kannel and Garrison 31 ). Physical activity was measured during examinations 5, 7 and 8. Education was self-reported once during examination 2.
Statistical analyses
Descriptive statistics for anthropometric and clinical characteristics across the tertiles of carbohydrate intake during examination 5, including means and standard deviations, were computed using the SAS software version 9.3 for Windows (SAS Institute, Inc.). In the main analyses, trends in the intake of types of carbohydrates and carbohydrate-rich food sources in the whole sample and among men and women were evaluated by calculating means, standard deviations and P values for trends and P values for interactions over the four surveys. In exploratory analyses, trends were stratified by three BMI categories: normal weight (18·5–24·9 kg/m2); overweight (25–29·9 kg/m2); obese ( ≥ 30 kg/m2)( 37 ). Analyses were also stratified by sex. Analyses were stratified by sex and BMI because of potential differences in eating patterns between these subgroups. We also carried out sensitivity analyses for participants with and without chronic disease including CVD, cancer, diabetes and hypertension. In the assessment of trends, to allow individual differences in the overall level to be controlled, subject-specific random intercepts were used in the repeated-measures regression model. Maximum-likelihood estimates for trend coefficients and their associated P values were based on the generalised least-squares function in the non-linear mixed effects package in R( Reference Pinheiro, Bates and DebRoy 38 ). Bonferroni corrections were applied to P values for subgroup analyses to correct for multiple comparisons while maintaining the significance level at 0·05.
Results
Participant characteristics across the tertiles of carbohydrate intake during examination 5
Participant characteristics across the tertiles of carbohydrate intake during examination 5 are summarised in Table 1 as percentages for categorical variables or as means and standard deviations for continuous variables. The mean age of men and women across the tertiles of carbohydrate intake ranged between 53·6 and 55·1 years. On average, both men and women were educated beyond high school. As carbohydrate intake increased, men were more likely to be younger (P for trend = 0·016), more educated (P for trend = 0·029), and have a lower BMI (P for trend = 0·003) and less likely to smoke (P for trend < 0·001). On the other hand, BMI and age were not related to carbohydrate intake in women; yet, women with higher intakes were more likely to be more educated (P for trend = 0·033) and less likely to smoke (P for trend = 0·001). No significant linear trends were observed for other characteristics across the tertiles of carbohydrate intake in either sex (Fig. 1).
Characteristics of male and female Framingham Heart Study Offspring populations across the tertiles of total carbohydrate intake in 1995 (examination 5) (Mean values and standard deviations or percentages)
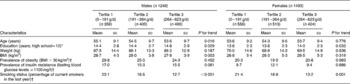
* Recorded during examination 2 for less than 2 % of the cohort. Education may have been recorded at a pre-college age, so this value understates completed education.
† Prevalence of obesity, insulin resistance and smoking are shown as percentages.

Trends in dietary carbohydrate and macronutrient intake in men and women
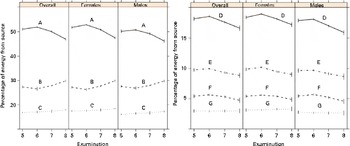
As shown in Table 2 and Fig. 2, over approximately 17 years, total carbohydrate intake, in g and as a percentage of total energy intake, decreased significantly in the whole sample (51·0–46·8 %) and in men (50·1–46·1 %) and women (51·7–47·4 %) (P for trend < 0·001). Total sugar intake, in g and as a percentage of total energy intake, also decreased in the whole sample (18·2–16·6 %) and in men (17·9–15·9 %) and women (18·4–17·2 %) (P for trend < 0·001). The intake of different sugars was also evaluated separately. Fructose intake, as a percentage of total energy intake, decreased in the whole sample (5·4–4·7 %), in men (5·4–4·6 %) and in women (5·4–4·9 %) (P for trend < 0·001). Similarly, sucrose intake decreased in the whole sample (9·8–8·8 %), in men (9·6–8·7 %) and in women (9·9–9·0 %) (P for trend < 0·001).
Trends in the intake of macronutrients and dietary carbohydrates from 1991 to 2008 in men and women aged 25 years and above* † ‡ (Mean values and standard deviations)
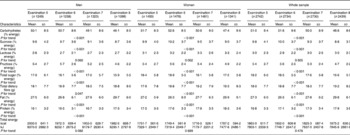
* P values listed are for the whole sample and then for males and females.
† P values for interaction by sex were calculated.
‡ Examinations 5, 6, 7 and 8 took place between 1991 and 1995, 1995 and 1998, 1998 and 2001, and 2005 and 2008, respectively.
Trends in the intake of macronutrients and sugars from 1991 to 2008 in the overall sample and in men and women: A, percentage of energy from carbohydrates; B, percentage of energy from protein; C, percentage of energy from fat; D, percentage of energy from sucrose; E, percentage of energy from lactose; F, percentage of energy from fructose; G, percentage of energy from total sugars. (A colour version of this figure can be found online at http://www.journals.cambridge.org/bjn).
Total dietary fibre intake increased significantly in the whole sample from 18·0 to 19·2 g/d (P for trend < 0·001), in men from 18·1 to 18·8 g/d (P for trend = 0·047), and in women from 17·9 to 19·5 g/d (P for trend < 0·001). The percentage of energy from fat increased in the whole sample (27·3–29·8 %) and in both men (27·5–29·7 %) and women (27·2–29·9 %) (P for trend < 0·001). Similarly, the percentage of energy from protein increased in the whole sample (16·8–17·9 %) and in both men (16·1–17·3 %) and women (17·5–18·5 %) (P for trend < 0·001). However, there was no change in energy intake. Trends in carbohydrate intake did not differ significantly when the analyses were repeated among individuals with and without pre-existing chronic diseases and were similar to those in the overall population (data not shown).
Trends in dietary carbohydrate and macronutrient intake in normal-weight, overweight and obese participants
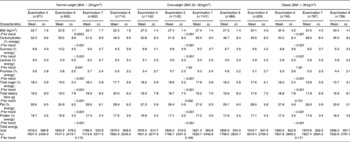
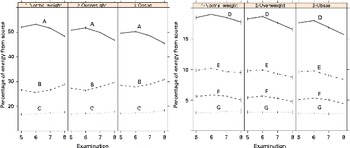
Trends in carbohydrate intake were stratified by BMI category and explored in normal-weight, overweight and obese participants (Table 3 and Fig. 3). Total carbohydrate intake, both in g and as a percentage of total energy intake, decreased significantly in normal-weight (52·0–48·3 %), overweight (50·8–46·7 %) and obese (49·6–45·5 %) participants (P for trend < 0·001) over the study period of almost two decades. Total sugar intake, as a percentage of total energy, decreased in normal-weight participants (18·4–17·7 %) and in both overweight (18·2–16·5 %) and obese (17·6–15·7 %) participants (P for trend < 0·001). Fructose intake, as a percentage of total energy intake, decreased from 5·6 to 5·0 % in normal-weight participants, from 5·4 to 4·8 % in overweight participants, and from 5·1 to 4·4 % in obese participants (P for trend < 0·001). Sucrose intake decreased from 9·8 to 9·5 %, from 9·8 to 8·7 % and from 9·6 to 8·3 % of total energy intake in normal-weight, overweight and obese participants, respectively (P for trend < 0·001). Lactose intake increased significantly in only normal-weight participants.
Trends in the intake of macronutrients and dietary fats in normal-weight and overweight participants from 1991 to 2008* † ‡ (Mean values and standard deviations)
* P values listed are for the overall trend for normal-weight, overweight and obese individuals, disaggregated.
† P values for interaction by BMI category were calculated.
‡ Examinations 5, 6, 7 and 8 took place between 1991 and 1995, 1995 and 1998, 1998 and 2001, and 2005 and 2008, respectively.
Trends in the intake of macronutrients and sugars from 1991 to 2008 among normal-weight, overweight and obese participants: A, percentage of energy from carbohydrates; B, percentage of energy from protein; C, percentage of energy from fat; D, percentage of energy from sucrose; E, percentage of energy from lactose; F, percentage of energy from fructose; G, percentage of energy from total sugars. (A colour version of this figure can be found online at http://www.journals.cambridge.org/bjn).
Total dietary fibre intake increased significantly from 18·2 to 20·0 g/d in normal-weight participants (P for trend < 0·001) and from 18·0 to 18·8 g/d in overweight participants (P for trend = 0·032), but not among obese participants. The percentage of energy from fat increased in normal-weight (26·6–28·9 %), overweight (27·3–29·7 %) and obese (28·5–30·9 %) participants (P< 0·001). Similarly, the percentage of energy from protein increased in normal-weight (16·7–17·6 %), overweight (16·8–17·8 %) and obese (17·1–18·4 %) participants (P< 0·001). There were no significant changes in energy intake among the three BMI categories.
Trends in carbohydrate food source intake among men and women
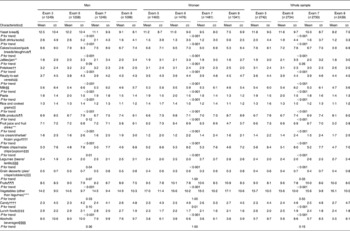
Foods that are considered to be the main contributors of dietary carbohydrate intake based on previous studies of the nationally representative Continuing Survey of Food Intakes by Individuals( Reference Subar, Krebs-Smith and Cook 15 , Reference Cotton, Subar and Friday 20 ) were selected a priori for the analyses (Table 4). The following food groups were included: yeast bread; soft drinks/soda; cakes/cookies/quick breads/doughnuts; jams; potatoes; ready-to-eat cereals; pasta; rice and cooked grains; milk; milk products; fruit juice/fruit drinks; ice cream/sherbet/frozen yogurt; potato chips/maize chips/popcorn; legumes; grain desserts (pies/crisps/cobblers); fruits; vegetables (other than legumes); candy; lunch foods such as pizzas and burgers; alcoholic beverages. Servings are reported in ranges, and the FHS reports the imputed mean of each range, which was used in the calculation of means and for the evaluation of trends in the present study.
Trends in the intake of carbohydrate food sources from 1991 to 2008 in men and women aged 25 years and above in servings/week* † (Mean values and standard deviations)
* P values listed are for the whole sample and then for males and females. P values for interaction by sex were calculated.
† Exams 5, 6, 7 and 8 took place between 1991 and 1995, 1995 and 1998, 1998 and 2001, and 2005 and 2008, respectively.
‡ Based on food sources of total carbohydrates among US adults from 1989–1991 Continuing Survey of Food Intake by Individuals; flour/baking ingredients and sugar/syrups were also the primary sources of total carbohydrates among US adults, but this information was not available for the Offspring cohort.
§ Includes dark bread, white bread and English muffins/bagels.
∥ Includes cola, cola without caffeine and non-cola soda.
¶ Includes muffins/biscuits, pancakes/waffles, home-made cookies, readymade cookies, brownies, doughnuts, home-made cakes, readymade cakes, home-made sweet rolls and readymade sweet rolls.
** Includes jams and jellies.
†† Includes white potatoes, French fries, yams and sweet potatoes.
‡‡ Includes cold cereals, cooked oatmeal, bran, wheat germ and other hot cereals.
§§ Includes skimmed or low-fat milk and whole milk.
∥∥ Includes pasta white rice, brown rice and other grains.
¶¶ Includes cream, sour cream, yogurt, cottage/ricotta cheese, cream cheese and other cheese.
*** Includes orange juice, grapefruit juice, apple juice/cider, lemonade and punch, and other fruit juices.
††† Includes sherbet/ice milk and ice cream.
‡‡‡ Includes potato/maize chips, crackers, popcorn and pizzas.
§§§ Includes tofu and soyabeans, string beans, peas/lima beans, and beans/lentils.
∥∥∥ Includes home-made pies and readymade pies.
¶¶¶ Includes fresh apples and pears, bananas, raisins, prunes, cantaloupe, watermelon, oranges, grapefruit, strawberries, blueberries and peaches.
**** Includes maize, broccoli, cabbage/coleslaw, cauliflower, Brussels sprouts, alfalfa sprouts, carrots (raw/cooked), mixed vegetables, winter squash, summer squash, beets, celery, spinach (raw/cooked), iceberg/head lettuce, romaine/leaf lettuce, tomatoes, tomato juice and tomato sauce.
†††† Includes chocolate, candy bars and candy without chocolate.
‡‡‡‡ Includes pizzas, hamburgers, meat sandwich or casserole.
§§§§ Includes red wine, white wine, beer and liquor.
In the FHS Offspring generation between examinations 5 and 8, the number of weekly servings of yeast bread, soft drinks/soda, cakes/cookies/quick breads/doughnuts, potatoes, milk, pasta, rice and cooked grains, fruit juice/fruit drinks, potato chips/maize chips/popcorn, and lunch foods decreased significantly in the whole sample and in both men and women (P for trend < 0·003). There was a significant increase in the number of weekly servings of ready-to-eat cereals, ice cream/sherbet/frozen yogurt, legumes and fruits in the whole sample and of dairy products and candy in the whole sample and in only women (P for trend < 0·026). The number of weekly servings of jams/jellies decreased significantly in only women (P for trend < 0·001). There were no significant changes in the number of weekly servings of grain desserts (pies/crisps/cobblers), vegetables other than legumes, and alcoholic beverages.
Trends in carbohydrate-rich food intake among normal-weight, overweight and obese participants
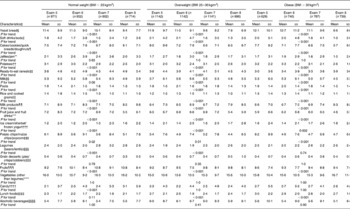
We explored trends in carbohydrate-rich food intake by BMI category (Table 5). There was a decrease in the number of weekly servings of yeast bread, soft drinks/soda, cakes/cookies/quick breads/doughnuts, potatoes, pasta, rice and cooked grains, fruit juice/fruit drinks, and potato chips/maize chips/popcorn in normal-weight, overweight and obese participants (P for trend < 0·05). The number of weekly servings of lunch foods, on the other hand, decreased in overweight and obese participants (P for trend < 0·001), but did not change in normal-weight participants.
Trends in the intake of carbohydrate food sources in normal-weight and overweight participants from 1991 to 2008 in servings/week* † (Mean values and standard deviations)
* P values listed are for the whole sample and then for males and females. P values for interaction by sex were calculated.
† Exams 5, 6, 7 and 8 took place between 1991 and 1995, 1995 and 1998, 1998 and 2001, and 2005 and 2008, respectively.
‡ Based on food sources of total carbohydrates among US adults from 1989–1991 Continuing Survey of Food Intake by Individuals; flour/baking ingredients and sugar/syrups were also the primary sources of total carbohydrates among US adults, but this information was not available for the Offspring cohort.
§ Includes dark bread, white bread and English muffin/bagels.
∥ Includes cola, cola without caffeine and non-cola soda.
¶ Includes muffins/biscuits, pancakes/waffles, home-made cookies, readymade cookies, brownies, doughnuts, home-made cakes, readymade cakes, home-made sweet rolls and readymade sweet rolls.
** Includes jams and jellies.
†† Includes white potatoes, French fries, yams and sweet potatoes.
‡‡ Includes cold cereals, cooked oatmeal, bran, wheat germ and other hot cereals.
§§ Includes skimmed or low-fat milk and whole milk.
∥∥ Includes white rice, brown rice and other grains.
¶¶ Includes cream, sour cream, yogurt, cottage/ricotta cheese, cream cheese and other cheese.
*** Includes orange juice, grapefruit juice, apple juice/cider, lemonade and punch, and other fruit juices.
††† Includes sherbet/ice milk and ice cream.
‡‡‡ Includes potato/maize chips, crackers, popcorn and pizzas.
§§§ Includes tofu and soyabeans, string beans, peas/lima beans, and beans/lentils.
∥∥∥ Includes home-made pies and readymade pies.
¶¶¶ Includes fresh apples and pears, bananas, raisins, prunes, cantaloupe, watermelon, oranges, grapefruit, strawberries, blueberries and peaches.
**** Includes maize, broccoli, cabbage/coleslaw, cauliflower, Brussels sprouts, alfalfa sprouts, carrots (raw/cooked), mixed vegetables, winter squash, summer squash, beets, celery, spinach (raw/cooked), iceberg/head lettuce, romaine/leaf lettuce, tomatoes, tomato juice and tomato sauce.
†††† Includes chocolate, candy bars and candy without chocolate.
‡‡‡‡ Includes pizzas, hamburgers, meat sandwich or casserole.
§§§§ Includes red wine, white wine, beer and liquor.
An increase in the number of weekly servings of milk products, ready-to-eat-cereals, ice cream/sherbet/frozen yogurt, and fruits was observed across the three BMI categories (P for trend < 0·01). Legume intake increased in normal-weight and overweight participants, while candy intake increased only among normal-weight participants (P for trend < 0·001). The number of weekly servings of jams and jellies, grain desserts, vegetables other than legumes, and alcoholic beverages did not differ by BMI category.
Discussion
The present study uniquely investigated trends in the intake of dietary carbohydrates and their major food sources from 1991 to 2008 in a middle-aged sample of predominantly white Americans. The analyses indicate that total carbohydrate intake decreased in the whole sample and in both the sexes, which is consistent with the observed decline in the intake of the majority of carbohydrate sources in the diet. These trends did not vary when the analyses were stratified by BMI category. The decrease in total carbohydrate intake was accompanied by an increase in protein and fat intake in the whole sample, both the sexes, and all the three BMI categories, indicating that food sources of fat and protein replaced carbohydrates in this population. Our data demonstrate that the greatest measured decrease in the percentage of energy from carbohydrates occurred between 1998 and 2008 between examinations 7 and 8. The increased popularity of low-carbohydrate diets as a means for weight control in the 2000 s may have contributed to this observed trend( Reference Kuchler, Golan and Variyam 39 ). Moreover, between 2003 and 2004, 700 ‘low-carb’ and 3431 ‘no-carb’ products were introduced into the food supply, respectively( Reference Kuchler, Golan and Variyam 39 ), thereby increasing access to low-carbohydrate food choices. Food labels mandated by the 1994 National Labeling and Education Act for packaged foods may have allowed consumers to select lower-carbohydrate and sugar options, at a time when such diets were being advocated.
Total sugar, sucrose and fructose intake decreased in the whole sample and in both men and women. This decrease is consistent with the observed decrease in the consumption of some major sources of these sugars in this population, including soft drinks/soda, cakes/cookies/quick breads/doughnuts, and fruit juice/fruit drinks. The intake of individual sugars was evaluated, as sucrose and fructose are the predominant added sugars in the diet including as components of high-fructose maize syrup implicated in the obesity epidemic. While sugar intake decreased, fibre intake reportedly increased in the whole sample and in both the sexes. Consistently, the intake of fibre-rich foods such as fruits, legumes and ready-to-eat cereals increased. To the extent that these ready-to-eat cereals were not highly processed varieties, the observed increase in fibre intake may have been driven, at least in part, by an increase in the consumption of whole grains.
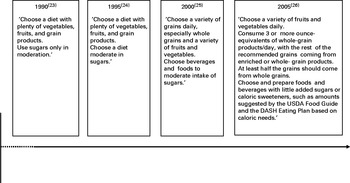
The first numerical recommendation for total carbohydrate intake appeared in the 2005 dietary guidelines, where intake between 45 and 65 % of total energy intake was promoted (Fig. 1)( 26 ). In the FOS, carbohydrate intake was within this range for all the four examinations and decreased over time. It must be noted that the shift from recommending diets low in fat ( < 30 % of energy intake) from 1990 to 2000( 23 – 25 ) to diets moderate in fat (25–35 % of energy intake) in 2005( 26 ) may have encouraged the replacement of energy from carbohydrates with energy from fat. Similarly, total sugar consumption decreased across the FOS examinations consistently, as dietary guidance increasingly emphasised the consumption of sugars in moderation and limitation of added sugar intake( 23 – 25 ). In fact, the 2005 guidelines explicitly stated that higher consumption of added sugars makes it increasingly difficult to meet nutrient needs without experiencing weight gain( 26 ).
The increase in fibre intake observed in the present study is consistent with the dietary guidelines, which encourage the consumption of a variety of fibre sources in the diet( 23 – 25 ) including fruits, vegetables, legumes and whole grains, over the past two decades. The 2005 recommendations to consume at least half of total grains as whole grains( 26 ) may have partially contributed to the highest observed increase in fibre intake from examination 7 to examination 8. However, it must be noted that while the consumption of fruits, legumes and fibre increased over time, intakes in this sample fell below the fibre and 5-a-day fruit and vegetable recommendations for health promotion.
The results of the present study are similar to those observed in the cross-sectional NHANES analysis of secular trends in macronutrient intake between 1999 and 2008( Reference Wright and Wang 40 ), which showed that the percentage of energy from carbohydrates decreased, while that of energy from fat and protein increased. Although the NHANES study time period overlaps with the FOS follow-up in these analyses, comparisons between the findings must consider the differences in methodology and sample characteristics. The NHANES analyses rely on 24 h recalls for dietary assessment, while the FHS used a validated semi-quantitative FFQ( Reference Rimm, Giovannucci and Stampfer 35 ). Moreover, the NHANES sample is representative of the US population, whereas the FHS sample represents a predominantly white middle-aged to older age population.
The present results must be interpreted in the context of the study's limitations. FOS participants may be health conscious, because they volunteered to participate in a longitudinal health study. Additionally, the observed decline in carbohydrate and sugar consumption may simply reflect the reduced food intake that is typically observed in ageing populations( Reference Morley 41 ), which is often accompanied by shifts to healthier eating patterns( Reference Millen, Quatromoni and Gagnon 42 ). As inherent to observational studies that use FFQ, dietary intake is prone to measurement error including error due to inaccurate recall of past diet( Reference Pope, Kritchevsky and Morris 43 ). Self-reported FFQ data are particularly prone to under-reporting( Reference Schatzkin, Kipnis and Carroll 44 ), especially the underestimation of energy intake( Reference Subar, Kipnis and Troiano 45 ). Furthermore, the FFQ was not reliably able to measure added sugar intake due to limitations of the USDA database, so only total sugar intake could be evaluated. However, the present study has notable strengths including the prospective design, long duration of follow-up of approximately two decades, and repeated measures of diet and anthropometric characteristics in a well-defined cohort.
In conclusion, the results of the present study suggest a favourable trend in dietary carbohydrate consumption that was consistent with related updates in dietary guidance. The decrease in carbohydrate consumption may reflect the concomitant increase in dietary fat intake in this cohort due to the liberalisation of recommended fat intake in dietary guidelines. However, it may also be a consequence of increased availability of ‘no-carb’ and ‘low-carb’ food products during an era in which the popularity of low-carbohydrate diets was high. In the light of the recent policy efforts to reduce the consumption of sugar-sweetened beverages, the present study indicates that food availability in the marketplace and within consumer reach in conjunction with dietary guidance may in fact play a pivotal role in the modification of consumption patterns. Therefore, policies that target access to sugar sources and increase both the availability and affordability of whole foods and healthier ‘lower-sugar’ processed foods may be effective for promoting healthy dietary changes.
Acknowledgements
The present study was supported by the American Cancer Society Research Scholar Grant (#RSG-12-005-01-CNE) and the New York University's IDEA Research Challenge Grant awarded to N. P. The American Cancer Society had no role in the design and analysis of the study or in the writing of this article.
The FHS is conducted and supported by the National Heart, Lung, and Blood Institute (NHLBI) in collaboration with Boston University (contract no. N01-HC-25 195). Funding support for the Framingham FFQ datasets was provided by ARS Contract no. 53-3k06-5-10, ARS Agreement no. 58-1950-9-001, 58-1950-4-401 and 58-1950-7-707. This manuscript was not prepared in collaboration with the investigators of the FHS and does not necessarily reflect the opinions or views of the FHS, Boston University, or NHLBI.
The authors' contributions are as follows: N. M. wrote the paper and assisted with designing the analyses; M. S. carried out the statistical analyses and reviewed the manuscript for the statistical accuracy of results; P. Q. and P. J. provided insights into the review and revision of the manuscript for important intellectual content; N. P. developed the overall research plan, reviewed the manuscript for important intellectual content and had primary responsibility for the final content; N. P. was responsible for overseeing the entire study.
The authors declare that there are no conflicts of interest.