

In 2004, the Centers for Disease Control and Prevention (CDC) published an important article showing the trends in dietary intake in the USA from 1971 to 2000, the same period in which the prevalence of obesity more than doubled( 1 ). The increased prevalence of obesity has been attributed both to increasing energy consumption and decreasing physical activity, among other potential aetiologies. Although a declining trend in physical activity has been more difficult to demonstrate( 2 – Reference Carlson, Fulton and Schoenborn 4 ), the CDC authors found that energy intake increased in men by over 628 kJ/d and in women by over 1255 kJ/d. Notably, the increase in energy came predominantly from carbohydrate sources, leading to the theory that this dietary trend may have fuelled the burgeoning obesity rate. Similar trends were seen in non-population-based data – the US Department of Agriculture's (USDA) food supply data showed an increase in daily per capita energy availability of 1757 kJ (420 kcal) in 1999 compared with 1971, and over 80 % of this increase in energy came from carbohydrates( 5 ).
Support for this theory also comes from randomized trials examining the weight loss effects of varied levels of carbohydrate intake. Several trials have shown that a lower-carbohydrate diet typically leads to greater weight loss than a higher-carbohydrate diet, at least over relatively short periods (up to 6 months)( Reference Nordmann, Nordmann and Briel 6 ). When follow-up is extended beyond 6 months, however, results have been mixed, with some studies showing equivalent weight loss and others showing greater weight loss with the low-carbohydrate diet( Reference Nordmann, Nordmann and Briel 6 – Reference Shai, Schwarzfuchs and Henkin 8 ). Given the dietary intake trends in the overall US population and recent trial data, examining how macronutrient composition relates to obesity could contribute information regarding the aetiology of the recent rise in obesity.
The CDC study did not examine whether changes in consumption of energy, carbohydrate, protein and fat varied by BMI. To extend this prior study, we examined trends in intakes of energy and macronutrients of the National Health and Nutrition Examination Survey (NHANES) participants during 1971–2004 and whether the trends varied by BMI class. It is important to examine whether the overall trends in energy and macronutrient intakes masked differences among BMI classes. Such differences might elucidate associations between diet and obesity, providing insight into the potential factors contributing to the increasing prevalence of obesity. Our hypotheses were that energy consumption would increase with BMI (because of greater energy needs) and that carbohydrates would be an increasingly dominant source of extra energy intake. We also expected trends in energy and macronutrient consumption would diverge over time among BMI classes. If intake trends diverged over time among BMI classes, it might suggest that specific dietary patterns (e.g. high fat or high carbohydrate) might underlie the rising prevalence of obesity in the USA.
Methods
Study design and data
The NHANES are a series of nationally representative cross-sectional health examination surveys conducted by the National Center for Health Statistics of the CDC. Data were analysed from three of the earlier periodic NHANES (NHANES I conducted during 1971–1974, NHANES II during 1976–1980 and NHANES III during 1988–1994) and from three of the 2-year survey cycles of the continuous NHANES (1999–2000, 2001–2002 and 2003–2004). NHANES collects information on the health status of US civilian, non-institutionalized persons using a complex, multistage probability sample design. The study was conducted according to the guidelines laid down in the Declaration of Helsinki and all procedures involving human participants were approved by the National Center for Health Statistics Institutional Review Board. Written informed consent was obtained from all participants. Detailed descriptions of survey procedures and questionnaires have been published( 9 – 15 ).
Study sample
Overall response rates (i.e. percentage of the sample who completed interviews and examinations) for the surveys were as follows: 1971–1974 (74 %), 1976–1980 (73 %), 1988–1994 (78 %), 1999–2000 (76 %), 2001–2002 (80 %) and 2003–2004 (76 %)( 16 ). The present analyses were limited to individuals aged 20–74 years who completed the self-reported 24 h dietary recall (one per participant). The upper age limit was chosen for uniformity because 74 years was the upper age limit for NHANES I and NHANES II whereas subsequent surveys were not limited. Participants were excluded if they reported consuming 0 kJ on the 24 h diet recall (n 4) or had missing BMI data (n 219). Further exclusions were made for participants with missing data on education (n 313), marital status (n 80), physical activity (n 415), atypical diet (n 186), employment status (n 76), and self-report of dieting (n 11). Analytic sample sizes ranged from 1714 men and 1985 women in NHANES 1999–2000 to 6630 men and 7537 women in NHANES III (Table 1).
Characteristics of men and women aged 20–74 years – National Health and Nutrition Examination Surveys (NHANES), USA, 1971–2004Footnote *

Data are presented as mean and standard deviation except where noted otherwise.
* Because of differences in the age distribution across surveys, estimates of population characteristics were adjusted by direct standardization to the 2000 US Census population using the age groups 20–39 years, 40–59 years and 60–74 years.
† In the regression analyses, underweight was combined with normal weight and obese class III was combined with obese class II due to the small prevalence of underweight and obese class III in the sample.
Interview and examination measurements
NHANES consisted of a household interview followed by an interview and examination at a mobile examination centre( 9 – 15 ). Weight and height were measured in all surveys using standardized procedures and equipment( 9 – 15 ). BMI, the explanatory variable of interest, was calculated by dividing weight in kilograms by the square of height in metres and classified according to guidelines( 17 ). Due to small sample sizes, the underweight (BMI < 18·5 kg/m2) category was combined with normal weight (BMI = 18·5–24·9 kg/m2) and class III obesity (BMI ≥ 40·0 kg/m2) was combined with class II obesity (BMI = 35·0–39·9 kg/m2).
Race was defined as white, black and other. In the 1971–1974 and 1976–1980 surveys, race of the participant was ‘marked by observation’ by the interviewers who were instructed to record Mexican Americans, Puerto Ricans and persons of other Latin American descent as white, ‘unless definitely known to be Black, American Indian, or other nonwhite race’. To remain consistent with this coding, participants who were ‘Mexican American’ or ‘other Hispanic’ were included in the white category for subsequent surveys. Physical activity was assessed differently during several of the surveys; therefore, participants were classified as ‘more active’, ‘moderately active’ or ‘less active’ as compared with their peers according to questions used in the 1988–1994 survey and after. For the earlier surveys, responses to two questions regarding leisure-time and non-leisure-time activity were collapsed into one physical activity variable using the ‘more active’, ‘moderately active’ or ‘less active’ responses. Other variables considered were age, marital status (married, not married), education (high school or less, or beyond high school) and employment status (working, for example at a job or business v. other categories, including keeping house). To assess for the possibility that the 24 h dietary recall was not representative of a person's typical intake, variables indicating weekday v. weekend day of the recall interview, self-report that the previous day's diet was atypical (yes or no) and self-report of current dieting for weight loss (yes or no) were included in the analyses.
Dietary assessments
The examination at the mobile examination centre included a 24 h dietary recall interview that assessed intake of all foods and beverages during the preceding day. Diet variables used as outcomes of interest in the current analysis included total energy intake in kilojoules, and total fat, protein and carbohydrate intakes as percentages of total energy intake. Percentage of total energy intake from alcohol was not included in the analyses. Although there have been changes in the dietary interview methodology and food composition databases used in the surveys, there was sufficient comparability to allow comparison of overall energy and macronutrient intakes. Dietary interviews did not include weekend days in 1971–1974 and 1976–1980, while the subsequent surveys did include weekend days. This difference was addressed in the analytic approach.
Estimation
Because of differences in the age distribution across surveys, estimates of population characteristics were adjusted by direct standardization to the 2000 US Census population using the age groups 20–39 years, 40–59 years and 60–74 years (Table 1). Generalized linear models with a normal distribution and identity link function were applied to the proportion of total energy intake from carbohydrate and fat because the nutrient intakes were normally distributed. Given the non-normal distribution of total energy intake and the proportion of total energy intake from protein, generalized linear models with a normal distribution and log link function were applied. Regression analyses were stratified by sex. Regression models were used to predict nutrient intakes adjusted for the characteristics described above representing important secular, health and health habit changes over the study period.
These regression models were used to generate adjusted total energy consumption and adjusted proportions of total energy from carbohydrate, protein and fat to assess differences among BMI classes and across time. Statistical significance of explanatory variables was determined using Sattherwaite-adjusted F tests with an α level of 0·05, including tests of trend over time using the survey variable and tests of BMI class differences using the BMI class variable. The interaction between survey and BMI class was used to examine whether BMI class differences in energy and macronutrient intakes may have changed over time. The interaction term was not statistically significant in any of the models, so P values for the main effects of time (i.e. survey) and BMI class are presented. All analyses were performed using the statistical software package SAS-callable SUDAAN release 9·0·1 (2005), to apply survey sampling weights and survey design variables for estimating standard errors that account for the complex sample design, survey non-response and oversampling to obtain nationally representative results.
Results
Participant characteristics
The proportion of NHANES respondents of white race decreased over time from 89·9 % to 85·9 % in men (P < 0·01) and from 88·8 % to 83·8 % in women (P < 0·01; Table 1). Obesity, high-school education and attempts at weight management became more prevalent over time in men and women (all P < 0·01). Cigarette smoking and married status became less prevalent in men and women (all P < 0·01). Employment decreased in men (P < 0·01) and increased in women (P < 0·01).
Trends in intakes of energy and macronutrients over time
To understand whether energy and macronutrient intakes changed from 1971 to 2004 irrespective of BMI class, we examined time trends for the pooled sample (Table 2). From 1971 to 2004, there was a significant increase in total energy intake for men (9832 to 11 652 kJ/d, P < 0·01 for trend) and women (6418 to 8142 kJ/d, P < 0·01 for trend), adjusting for BMI class and other variables. The amount and proportion of total energy intake from carbohydrate also increased over time in men (42·7 % to 48·0 %, P < 0·01 for trend) and women (45·4 % to 50·6 % P < 0·01 for trend). From 1971 to 2004, there was an increase in amount but a significant decrease in the proportion of total energy intake from fat for men (36·7 % to 33·1 %, P < 0·01 for trend) and women (36·1 % to 33·8 % P < 0·01 for trend). The proportion of total energy intake from protein also decreased over time (men: 16·4 % to 15·1 %, P < 0·01 for trend; women: 16·9 % to 14·7 % P < 0·01 for trend), even though the total amount of energy intake increased.
AdjustedFootnote * daily energy intake and proportions of energy intake from macronutrients by survey wave for men and women aged 20–74 years – National Health and Nutrition Examination Surveys (NHANES), USA, 1971–2004
* Adjusted for BMI, age, race, physical activity, marital status, education, employment status, day of the week of the dietary recall, self-reported atypical and self-report of current dieting for weight loss.
† P < 0·01 for trend over time (i.e. over surveys) using the Sattherwaite-adjusted F test adjusting for BMI class and other explanatory variables.
Trends in intakes of energy and macronutrients by BMI classification
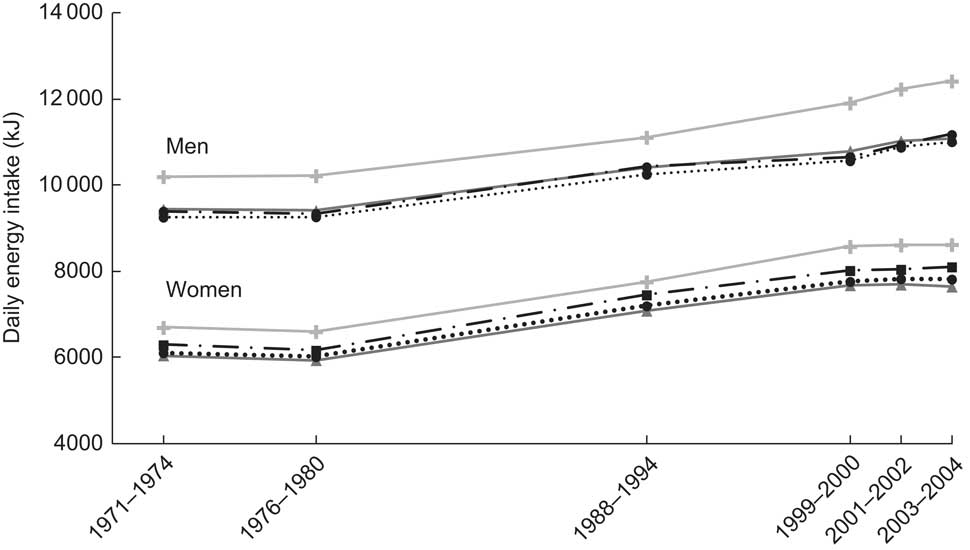
To understand whether energy and macronutrient intakes changed from 1971 to 2004 differentially across BMI classes and whether these differences were masked in pooled results from Table 2, we examined time trends stratified by BMI class. In men, average total energy intake between 1971 and 2004 was similar among the BMI categories (range: 10 125 kJ/d in obese class I to 10 979 kJ/d in underweight/normal weight, P = NS for trend), adjusting for survey period and other variables (Table 3 and Fig. 1). In women, total energy intake was highest for underweight/normal weight (7460 kJ/d), lowest in overweight women (6799 kJ/d) and then rose gradually in the obese categories (P < 0·01 for trend). However, the quadratic trend was not statistically significant (Table 3 and Fig. 1).
AdjustedFootnote * daily energy intake and proportions of energy intake from macronutrients by survey wave and BMI category for men and women aged 20–74 years – National Health and Nutrition Examination Surveys (NHANES), USA, 1971–2004
* Adjusted for age, race, physical activity, marital status, education, employment status, day of the week of the dietary recall, self-reported atypical diet and self-report of current dieting for weight loss.
† P < 0·01 for trend over BMI classes using the Sattherwaite-adjusted F test adjusting for survey wave and other explanatory variables.
Adjusted daily energy intake by BMI (![]() , underweight/normal weight;
, underweight/normal weight; ![]() , overweight;
, overweight; ![]() , obese class I;
, obese class I; ![]() , obese class II/III) among men and women aged 20–74 years – National Health and Nutrition Examination Surveys (NHANES), USA, 1971–2004 (1 kcal = 4·184 kJ)
, obese class II/III) among men and women aged 20–74 years – National Health and Nutrition Examination Surveys (NHANES), USA, 1971–2004 (1 kcal = 4·184 kJ)
In men, the proportion of total energy intake from carbohydrate declined with increasing BMI category (46·6 % in underweight/normal weight to 45·5 % in obese class II/III, P < 0·01 for trend), after adjusting for survey period and other variables (Table 3 and Fig. 2(a)). In women, the decline across BMI classes was slighter (0·4 percentage points) but still statistically significant (P < 0·01 for trend). The largest difference between any two BMI classes in a single survey was 2·8 percentage points in men (underweight/normal weight: 49·1 %, obese class II/III: 46·3 %, in 2003–2004) and 2·3 percentage points in women, occurring in both the 1999–2000 and 2003–2004 surveys (Table 3 and Fig. 2(b)).
Adjusted percentage of daily energy intake from macronutrients by survey wave and BMI (![]() , underweight/normal weight;
, underweight/normal weight; ![]() , overweight;
, overweight; ![]() , obese class I;
, obese class I; ![]() , obese class II/III) for men (a) and women (b) aged 20–74 years – National Health and Nutrition Examination Surveys (NHANES), USA, 1971–2004
, obese class II/III) for men (a) and women (b) aged 20–74 years – National Health and Nutrition Examination Surveys (NHANES), USA, 1971–2004
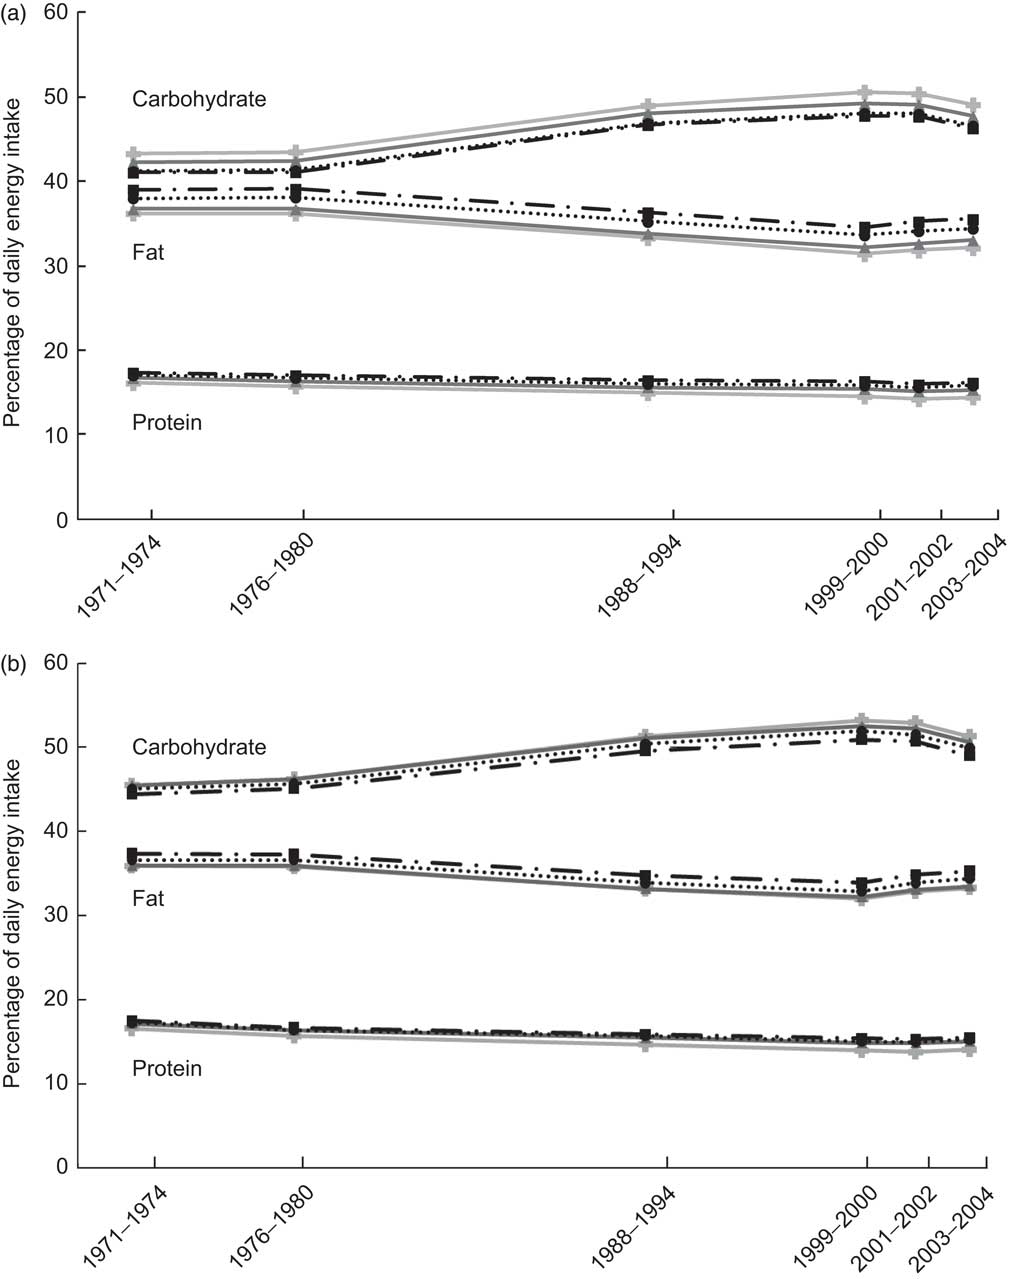
The proportion of dietary fat increased as BMI class increased in men (34·3 % in underweight/normal weight to 36·5 % in obese class II/III, P < 0·01 for trend), adjusting for survey period and other variables. In women, the pattern was the same but the increase in proportion of dietary fat as BMI class increased was smaller (34·4 % in underweight/normal weight to 35·4 % in obese class II/III, P < 0·01 for trend). The proportion of energy from protein increased slightly but significantly as BMI class increased from underweight/normal weight to obese class II/III (from 15·3 % to 16·5 % in men; from 15·2 % to 16·0 % in women; all P < 0·01), adjusting for survey and other variables.
Discussion
From 1971 to 2004 in the USA, daily energy intake and the percentage of daily energy from carbohydrate increased substantially, whereas the percentages of daily energy from fat and protein declined. These results are consistent with a prior study that did not adjust for the full set of demographic, health status, physical activity and dietary behaviour variables considered here( Reference Austin, Ogden and Hill 18 ). The types of foods that explain these changes in macronutrient composition in the American diet were not a focus of the present study, but previous research has demonstrated that intakes of sugared beverages and fast foods increased substantially over the time period of the surveys( Reference Nielsen and Popkin 19 ). The decline in percentage of daily energy from fat may indicate that the US population altered dietary intake in response to the USDA's messages to reduce dietary fat. Unfortunately, the decrease in percentage fat intake was more than compensated with an increased intake of carbohydrate that was predominantly refined starches and sugars( Reference Nielsen and Popkin 19 ).
We expected that these overall trends of increasing energy and carbohydrate intakes would mask meaningful differences in trends among BMI classes. Contrary to our expectations, differences among BMI classes in the intake of energy and macronutrient composition were modest. Obese individuals reported consuming less energy each day, and a somewhat smaller percentage of energy from carbohydrate, compared with underweight/normal weight individuals. These results suggest that obese individuals did not, as one would expect from our current understanding of maintenance energy requirements, consume more energy than their underweight/normal weight peers, nor did they consume diets that were dramatically different in macronutrient content. This indicates that increasing trends in energy consumption are of concern for all BMI classes, not just for individuals in the highest BMI classes.
Several cross-sectional studies have found negative or no associations between energy intake and BMI( Reference Ballard-Barbash, Graubard and Krebs-Smith 20 – Reference Satia-Abouta, Patterson and Schiller 25 ); the current study extends this finding over multiple time points in the US population. According to current understanding of energy balance, however, obese individuals should consume considerably more energy per day than normal weight individuals to maintain their weight. For example, using an equation commonly used for calculating energy requirements, a 45-year-old sedentary man of average height (1·78 m) who weighed 70 kg (BMI = 22 0 kg/m2) would require 9606 kJ/d to maintain that weight; a man of the same age, height and activity level who weighed 120 kg (BMI = 38 0 kg/m2) would require 12 962 kJ/d, a difference of ∼3347 kJ/d( 26 ). This contrasts with the finding in the current study that adjusted energy intakes in the lowest and highest BMI classes differed by only 209–1255 kJ/d in each of the surveys.
Several reasons have been given for the compressed range of daily energy intake among the BMI classes. Two common postulates are that obese individuals are less active or are more likely to be restricting food intake. For example, Ballard-Barbash et al. examined 24 h dietary recall data from the USDA's 1985–1986 Continuing Surveys of Food Intakes by Individuals (CSFII) and found that overweight women were twice as likely than normal weight women to report energy restriction/weight loss dieting (15 % v. 7 %) but less likely to report moderate or heavy leisure activity (50 % v. 64 %)( Reference Ballard-Barbash, Graubard and Krebs-Smith 20 ). Physical activity level, atypical dietary intake and whether the individual was ‘dieting’ were considered in the present analyses but residual confounding may be present.
Another common explanation is that obese people under-report food intake more than their thinner counterparts. This belief is based on studies comparing self-reported dietary intake with more objective methods such as estimated energy requirements from calculated BMR (using an equation that includes age, sex, height and weight), subsequent measured intake of supplied food, or extrapolated measures of energy intake (i.e. doubly labelled water)( Reference Ballard-Barbash, Graubard and Krebs-Smith 20 , Reference Mertz, Tsui and Judd 22 , Reference Satia-Abouta, Patterson and Schiller 25 , Reference Schoeller and Fjeld 27 ). The doubly labelled water method, which actually measures energy expenditure rather than intake, is currently considered the gold standard. One compelling finding from these studies is that while most participants underestimate energy intake, the magnitude of underestimation increases as BMI increases( Reference Ballard-Barbash, Graubard and Krebs-Smith 20 , Reference Schoeller and Fjeld 27 – Reference Moshfegh, Rhodes and Baer 30 ). Unfortunately, all of these objective methods for estimating energy intake have limitations such that determining whether and how much someone is under-reporting remains difficult.
Previous studies have found that obese individuals consume a smaller proportion of daily energy from carbohydrate than their thinner counterparts and/or a larger proportion of energy from protein( Reference Randi, Pelucchi and Gallus 31 – Reference Bowman and Spence 33 ). In an analysis of the USDA's 1994–1996 CSFII, Bowman and Spence divided participants into four groups based on their percentage of energy intake from carbohydrate (0–30 %, 30–45 %, 45–55 %, above 55 %) and found that women in the highest carbohydrate intake group had the lowest mean BMI (25·2 v. 25·7–26·7 kg/m2)( Reference Bowman and Spence 33 ). The relationship was not obvious in men, however, with the mean BMI being similar in the lowest and highest carbohydrate intake groups. Whether certain patterns of macronutrient intake actually lead to weight gain or whether people of high BMI tend to consume a certain macronutrient pattern is more difficult to discern. Clinical trials have demonstrated that weight loss can result from diets that are either high or low in carbohydrate composition( Reference Nordmann, Nordmann and Briel 6 , Reference McAuley, Hopkins and Smith 34 , Reference McAuley, Smith and Taylor 35 ). Examining this issue in prospective studies that repeatedly collect both dietary intake and body weight data may provide further insight.
Our results also highlight several other demographic and lifestyle trends in the USA over the covered time period. The percentage of whites in the sample trended downward across surveys, reflecting trends in the general population in which the percentage of whites declined from 88·6 % in 1960 to 75·1 % in 2000, while the percentage of blacks and races other than white or black increased from 10·5 % to 12·3 % and from <5 % to 12·5 %, respectively( Reference Hobbs and Stoops 36 ). Starting with NHANES III (1988–1994), the prevalence of obesity increased while the prevalence of normal weight declined and the prevalence of overweight remained stable, as has been described( Reference Flegal, Carroll and Kuczmarski 37 , Reference Flegal, Carroll and Ogden 38 ). In a similar pattern, there were substantive increases in the percentage of participants reporting they were trying to lose or maintain weight, likely reflecting the increasing prevalence of obesity that was occurring. The 24 h diet recall was also described as atypical more frequently in the later surveys, which likely signals changes in eating habits in that era (e.g. increased eating at restaurants). Physical activity did not change as dramatically but there was a mild decrease across surveys in the percentage of participants who reported being less active or more active, whereas the percentage who reported being moderately active increased.
There are some limitations to the present study to consider. As with other population research, dietary intake information was self-reported by participants and thus subject to recall bias. To reduce bias and enhance data quality, the survey uses standardized mobile examination centres, highly trained staff and validated questionnaires. Another limitation is that the interview methods for collecting information changed somewhat over the surveys( Reference Wright, Borrud and McDowell 39 ). For example, dietary intake on weekend days was not included in NHANES I and II but was included in subsequent surveys. The physical activity assessment also changed over the surveys and was brief, allowing potential residual confounding. Also, because information on cigarette smoking was missing for a large proportion of participants in the 1971–1974 survey, smoking was not included in the regression models. Smokers tend to have lower BMI but higher intakes of energy and fat than non-smokers; therefore, adjusting for smoking status might result in more dramatic increases in energy and fat intakes with increasing BMI. Estimates were quite similar, however, when these variables were included in the models. To minimize the impact of these method changes, only those variables that were measured consistently over the surveys were used and variables for atypical diet and day of the week being reported were included. Because analyses of NHANES data must rely upon a cross-sectional time-series study design, it is not possible to examine diet and weight changes longitudinally in the same individuals. These results are strengthened, however, by their generalizability to the US population because the surveys used national probability samples.
Conclusions
Over the past 35 years in the USA when obesity has become increasingly prevalent, the intakes of energy and macronutrients among people of different BMI classes trended similarly over time. From these results, population trends in fat or carbohydrate intake do not clearly explain the rise in obesity prevalence. Research examining how individuals respond differently to varying macronutrient compositions may provide greater insight about dietary contributors to the rise in obesity.
Acknowledgements
Sources of funding: This material is the result of work supported with resources and the use of facilities at the Durham VA Medical Center. W.S.Y. was supported by a Health Services Research Career Development Award (RCD 02-183-1) from the Department of Veterans Affairs during work on this project. The views expressed in this article are those of the authors and do not necessarily reflect the position or policy of the Department of Veterans Affairs, Duke University, or the Research Triangle Institute. Conflicts of interest: W.S.Y. and C.-C.W. have no competing interests to declare. M.L.M. has received consulting fees from Takeda Pharmaceuticals, Novartis and the Surgical Review Corporation. Authors’ contributions: W.S.Y. contributed to the study conception and design, interpretation of data, and drafting the article and revising it critically for important intellectual content. C.-C.W. contributed to the acquisition of data, analysis of data, and revising the article critically for important intellectual content. M.L.M. contributed to the study conception and design, interpretation of data, and revising the article critically for important intellectual content. All authors provided final approval of the version to be published. W.S.Y. had full access to all of the data in the study and takes responsibility for the integrity of the data and the accuracy of the data analysis.


