


1. Introduction
Global climate change is taking place at an unprecedented pace and is expected to have dramatic consequences on humankind from both health and economic perspectives (Babar et al. Reference Babar, Mukhtar, Mubashir, Saqib, Ullah, Quddusi, Bustam and Show2021; Zhao et al. Reference Zhao, Yuan, Zhao, Chang, Li, Lin and Li2022). There is a consensus among researchers that the growing anthropogenic  $\text {CO}_2$ emissions are mainly to blame (Farcas & Woods Reference Farcas and Woods2009; Mac Dowell et al. Reference Mac Dowell, Fennell, Shah and Maitland2017; Hepburn et al. Reference Hepburn, Adlen, Beddington, Carter, Fuss, Mac Dowell, Minx, Smith and Williams2019; Gilmore et al. Reference Gilmore, Sahu, Benham, Neufeld and Bickle2022). To mitigate $\text {CO}_2$ emissions, it is necessary to introduce carbon capture technologies to separate $\text {CO}_2$ from the flue gas of power plants. Several $\text {CO}_2$ capture technologies are under development, such as chemical absorption, physical adsorption, membrane separation and cryogenic capture (Song et al. Reference Song, Liu, Deng, Li and Kitamura2019; Nocito & Dibenedetto Reference Nocito and Dibenedetto2020; Gomez-Rueda et al. Reference Gomez-Rueda, Verougstraete, Ranga, Perez-Botella, Reniers and Denayer2022; Naquash et al. Reference Naquash, Qyyum, Haider, Bokhari, Lim and Lee2022). One of the cryogenic carbon capture (CCC) technologies is to desublimate $\text {CO}_2$ on the cooled surface of heat exchangers, achieving the separation of $\text {CO}_2$ in pure from the flue gas (bin Ab Halim Reference bin Ab Halim2013; Maqsood et al. Reference Maqsood, Mullick, Ali, Kargupta and Ganguly2014; Shen et al. Reference Shen, Tong, Yin, Liu, Wang, Feng and Ding2022). This desublimation-based CCC technology offers attractive advantages, such as easy operation, high efficiency, no chemical reaction, and pure separation. With these advantages, CCC is considered to hold significant application perspectives and research interests (Babar et al. Reference Babar, Bustam, Ali and Maulud2018, Reference Babar, Mukhtar, Mubashir, Saqib, Ullah, Quddusi, Bustam and Show2021; Font-Palma, Cann & Udemu Reference Font-Palma, Cann and Udemu2021). Nevertheless, compared with the other mature technologies, the development of desublimation-based CCC is still in a nascent stage due to some operational concerns (Pan, Clodic & Toubassy Reference Pan, Clodic and Toubassy2013; Gallucci & van Sint Annaland Reference Gallucci and van Sint Annaland2015). For example, a proper cooling temperature is required to guarantee the efficient desublimation rate and avoid the high cooling duty and cost. Meanwhile, the flue gas should be fed at a suitable rate so that the heat transfer surface can be fully utilized before the flue gas breakthrough. Furthermore, the desublimated solid $\text {CO}_2$ layer (SCL) needs to be controlled in a suitable pattern, otherwise it may adversely affect heat and mass transfer and even plug flow paths. These concerns demand a deep investigation of $\text {CO}_2$ desublimation in the CCC process.
During the desublimation-based CCC process, the flue gas containing multiple components flows unsteadily in void channels (or flow paths). Meanwhile, the component  $\text {CO}_2$ desublimates on the cooled surface of solid heat exchangers, which introduces two important physical processes: the evolution of channel structures, and the conjugate heat transfer between the solid and the gas phases. These two processes, in turn, can significantly affect the flue gas flow and the $\text {CO}_2$ desublimation rate (Debnath et al. Reference Debnath, Mukherjee, Mullick, Ghoshdastidar, Ganguly and Kargupta2019). Therefore, $\text {CO}_2$ desublimation in the CCC process is a complex problem with fully coupled multiphysics. To study such a problem, some experiments were designed and conducted. Tuinier et al. (Reference Tuinier, van Sint Annaland, Kramer and Kuipers2010) proposed a post-combustion CCC system based on packed beds. This novel system used packing materials to act as the heat transfer surface for $\text {CO}_2$ desublimation, which operated in three consecutive steps: cooling, capture and recovery. In order to obtain a pseudo-continuous capture of $\text {CO}_2$, Tuinier, Hamers & van Sint Annaland (Reference Tuinier, Hamers and van Sint Annaland2011a) and Tuinier & van Sint Annaland (Reference Tuinier and van Sint Annaland2012) operated three packed beds in parallel, following three different cycles of capture, recovery and cooling. They also changed the system design to use the evaporation of liquid natural gas for cooling, which would be a preferred option if the liquid natural gas was available at low cost (Tuinier et al. Reference Tuinier, Hamers and van Sint Annaland2011a). By using such dynamically operated beds at atmospheric pressure, $\text {CO}_2$ was effectively separated from the flue gas or biogas. But this CCC system was not tested for gas mixtures with high $\text {CO}_2$ content and high pressure. To fill this gap, cryogenic packed beds with different flow configurations were exploited to purify the natural gas with high $\text {CO}_2$ content (Ali et al. Reference Ali, Maqsood, Syahera, Shariff and Ganguly2014, Reference Ali, Maqsood, Redza, Hii, Shariff and Ganguly2016). Through experimental observations, the countercurrent flow configuration was found to provide optimal separation and energy efficiencies, which was superior to the cocurrent flow bed.
Later, another CCC system was developed to introduce Stirling coolers as the heat transfer surface (Song, Kitamura & Li Reference Song, Kitamura and Li2012a; Song et al. Reference Song, Kitamura, Li and Ogasawara2012b, Reference Song, Kitamura, Li and Jiang2013). Similar to the above CCC systems with packed beds, this one included three Stirling coolers for gas cooling,  $\text {CO}_2$ desublimation, and $\text {CO}_2$ capture. From experiments, $\text {CO}_2$ and $\text {H}_2\text {O}$ were separated at different Stirling coolers, without introducing large pressure drops and plugging problems. In addition, by adjusting operation parameters (i.e. the gas flow rate and the Stirling cooler temperature), the optimal performance with high $\text {CO}_2$ recovery and low energy consumption was obtained. More recently, in order to avoid the use of multiple packed beds or Stirling coolers, a new CCC system based on a packed bed of moving packing materials was built (Willson et al. Reference Willson, Lychnos, Clements, Michailos, Font-Palma, Diego, Pourkashanian and Howe2019; Cann, Font-Palma & Willson Reference Cann, Font-Palma and Willson2021). Experimental results showed that this system had a modest life cost for large-scale applications, but a substantially low cost for small-scale applications. Besides, no excessive accumulation of desublimated $\text {CO}_2$ was observed in the capture step, suggesting the ability to capture $\text {CO}_2$ continuously. Subsequently, Wang et al. (Reference Wang, Pfotenhauer, Qiu, Zhi and Jiang2020) carried out experiments to visualize the growth of the SCL on a cooled surface. They demonstrated that under the low-temperature condition, $\text {CO}_2$ desublimated quickly to generate a loose SCL, which sublimated easily in the recovery step.
The above experiments were conducted to implement various cryogenic capture concepts and investigate the  $\text {CO}_2$ capture performance. Due to the operational complexity and the experimental cost, however, limited system designs and operation conditions could be tested by experiments. For such reasons, the numerical simulation was applied as a powerful and economic approach to investigate the desublimation-based CCC technology. Tuinier et al. (Reference Tuinier, van Sint Annaland, Kramer and Kuipers2010) proposed a one-dimensional (1-D) pseudo-homogeneous model to describe evolutions of axial temperature, desublimated $\text {CO}_2$, and concentration profiles during the CCC process within packed beds. This 1-D model was validated by their experiments, and the $\text {CO}_2$ capture performance was evaluated for different parameters. The lower inlet $\text {CO}_2$ content and the higher bed temperature were found to cause the larger cooling duty per mass of $\text {CO}_2$ captured (Tuinier, van Sint Annaland & Kuipers Reference Tuinier, van Sint Annaland and Kuipers2011b). Moreover, compared with other competing $\text {CO}_2$ capture technologies (i.e. chemical absorption and membrane separation), the packed-bed-based CCC was shown to be favourable in cases with the decreased pressure drop and the incorporated impurity removal (Tuinier et al. Reference Tuinier, Hamers and van Sint Annaland2011a). By introducing a multiple equilibrium temperature scheme, this 1-D model was extended to investigate the $\text {CO}_2$ capture performance of a desublimation-based cryogenic pipeline network consisting of three packed beds (Ali et al. Reference Ali, Maqsood, Redza, Hii, Shariff and Ganguly2016). The modelled $\text {CO}_2$ content at the outlet showed a promising agreement with experimental measurements. This 1-D pseudo-homogeneous model was modified further to consider the desublimation of $\text {CO}_2$ both on the gas–solid interface and in the gas area (Debnath et al. Reference Debnath, Mukherjee, Mullick, Ghoshdastidar, Ganguly and Kargupta2019). The spatio-temporal evolution of an SCL in a cryogenic packed bed was simulated under different operation conditions. The results suggested that the desublimation rate increased with the decreasing bed temperature, the increasing pressure, and the ascending $\text {CO}_2$ content. In order to enhance the understanding of CCC using Stirling coolers, Song et al. (Reference Song, Kitamura, Li and Jiang2013, Reference Song, Kitamura and Li2014, Reference Song, Liu, Ji, Deng, Zhao and Kitamura2017a,Reference Song, Liu, Ji, Deng, Zhao, Li and Kitamurab) developed a two-dimensional (2-D) model to simulate the formation of an SCL during the CCC process. By synthesizing the heat integration and the membrane capture units, their simulations demonstrated that the energy requirement of the improved CCC system was reduced. Besides, with the growth of the SCL on Stirling coolers, the temperature of the SCL increased and the desublimation rate of $\text {CO}_2$ decreased. This indicated that an advanced knowledge base of the SCL could hep to improve the $\text {CO}_2$ capture performance. By comparing with experiments, Wang et al. (Reference Wang, Pfotenhauer, Zhi, Qiu and Li2018a) also demonstrated that numerical models considering heat transfer in the SCL could produce more accurate results.
The existing numerical studies have improved the understanding of  $\text {CO}_2$ desublimation during the CCC process. However, they applied volumetric models to describe the desublimation of $\text {CO}_2$ on the cooled heat transfer surface, which simplified the intricate pore structure of the SCL as homogeneous. Consequently, these models focused on averaged desublimation properties at macroscopic scales and ignored pore-scale details. Furthermore, these numerical studies adopted empirical correlations to determine the effective transport and desublimation properties. But the formulation of empirical correlations requires a prior understanding of pore-scale desublimation properties (Xu et al. Reference Xu, Long, Jiang, Ma, Zan, Ma and Shi2018a,Reference Xu, Long, Jiang, Zan, Huang, Chen and Shib, Reference Xu, Dai, Yang, Liu and Shi2022). As can be seen, models that can investigate $\text {CO}_2$ desublimation in the CCC process at the pore scale are essential.
As a powerful pore-scale solver, the lattice Boltzmann (LB) method has been applied widely to study complex fluid flows in porous structures over the past three decades (Li et al. Reference Li, Luo, Kang, He, Chen and Liu2016; Lei, Luo & Wu Reference Lei, Luo and Wu2019; Lei & Luo Reference Lei and Luo2021a; Chen et al. Reference Chen, He, Zhao, Kang, Li, Carmeliet, Shikazono and Tao2022). Accordingly, LB simulations were reported to investigate separately the physical processes that are encountered in  $\text {CO}_2$ desublimation, including the unsteady fluid flow, the heat and mass transfer, and the active gas–solid interface for desublimation. On the one hand, for simulating the incompressible fluid flow and component transport in porous structures, LB models with a single relaxation time or multiple relaxation times were developed (Dorschner et al. Reference Dorschner, Bösch, Chikatamarla, Boulouchos and Karlin2016; Wang et al. Reference Wang, Sui, Salsac, Barthès-Biesel and Wang2018b; Lei & Luo Reference Lei and Luo2020). Compared with traditional solvers, these LB models offered attractive advantages, such as simple implementation, high parallelism, easy treatment of complex porous structures, and the ability to extend from two to three dimensions. On the other hand, $\text {CO}_2$ desublimation on the active gas–solid interface can be modelled by tracking the porous structure evolution and solving the boundary conditions for mass conservation and conjugate heat transfer. To model the mass conservation condition at the active fluid–solid boundary, Zhang et al. (Reference Zhang, Shi, Guo, Chai and Lu2012) developed a general bounce-back LB boundary scheme. This scheme was easy to implement and suitable for boundaries with or without curvature and velocity, but the update of porous structures was not considered. In the meantime, Kang, Lichtner & Zhang (Reference Kang, Lichtner and Zhang2006) and Chen et al. (Reference Chen, Kang, Carey and Tao2014) proposed an LB boundary scheme to solve the active fluid–solid interface, with both the dissolution of solid matrix and the precipitation of solid products being considered. Under effects of these two interfacial reactions, porous structures evolved with time and were tracked by the volume of pixel (VOP) method. Their model was applied extensively to investigate the active fluid–solid boundary in applications such as geological $\text {CO}_2$ sequestration and fuel cells (Chen et al. Reference Chen, Zhang, He, Kang, He and Tao2018a,Reference Chen, Zhang, Min, Kang and Taob; Chen, Kang & Tao Reference Chen, Kang and Tao2019; Lei & Luo Reference Lei and Luo2021b). To solve the conjugate heat transfer boundary conditions, several efforts were made in the LB community without involving conventional extrapolations or iterations (He et al. Reference He, Liu, Li and Tao2019). A half-lattice division scheme was proposed to model the conjugate heat transfer between the solid and fluid phases. The reliability of this scheme was limited to cases with steady-state solutions or unified heat capacities between the two phases (Wang, Wang & Li Reference Wang, Wang and Li2007; Wang & Pan Reference Wang and Pan2008). Later, by recasting the energy conservation equation, a new source term was introduced into LB equations to guarantee the conjugate heat transfer (Karani & Huber Reference Karani and Huber2015). Due to the easy implementation, this treatment was applied to consider the conjugate heat transfer during coke combustion and methane hydrate dissolution (Zhang et al. Reference Zhang, Zhang, Zhang, Zhang, Yao, Sun and Yang2019; Lei, Wang & Luo Reference Lei, Wang and Luo2021).
From the above literature review, it is concluded that the LB method can be applied to model separately various aspects of the multiphysics behind  $\text {CO}_2$ desublimation in the CCC process. However, modelling the interaction of all these complex and coupled physics at the pore scale remains challenging and has not been achieved by a single LB model. To advance the predictive capability of the LB method and improve the current understanding of the CCC process, this work aims to develop an LB model for studying $\text {CO}_2$ desublimation during the CCC process at the pore scale. The main goal of the pore-scale simulations is to elucidate the $\text {CO}_2$ desublimation properties and evaluate the $\text {CO}_2$ capture performance under various operation conditions.
2. Mathematical and physical models
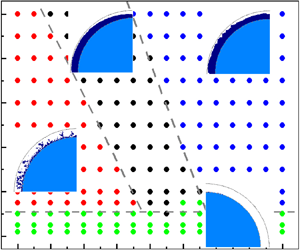
This study focuses on the multiphysical processes behind  $\text {CO}_2$ desublimation during the CCC process within a packed bed. The simplified schematic of a sample cryogenic packed bed is depicted in figure 1, where the bed is jacked by stainless steel and packed with solid materials (Ali et al. Reference Ali, Maqsood, Syahera, Shariff and Ganguly2014). Before constructing governing equations for describing the desublimation of $\text {CO}_2$ at the pore scale, some simplifications and assumptions are made as follows.
(i) This work investigates the capture of $\text {CO}_2$ without detailing the cooling of packing materials and the recovery of desublimated $\text {CO}_2$.
(ii) The temperature of packing materials is fixed as
$T_w$.(iii) The incompressible flue gas is neutrally buoyant and obeys the ideal gas law.
(iv) The flue gas is represented as a mixture of
$\text {CO}_2$ and $\text {N}_2$.(v) Fick's law is applied to describe the mass diffusion of gas components.
(vi) The desublimation rate of the gaseous component
$\text {CO}_2$ is proportional to the local deviation from the gas–solid equilibrium.(vii) Physical properties of the gas and the solid phases are set as constants in relation to the initial condition.
(viii) To allow for a wide-range parametric study, the computational domain is reduced to a small-size one that can both decrease the computational cost and hold the
$\text {CO}_2$ desublimation characteristics.(ix) To compare 2-D and three-dimensional (3-D) simulations, the shape of packing materials is considered cylindrical.


The schematic diagram of the problem: desublimation of  $\text {CO}_2$ in the CCC process.

Under these premises, a small computational domain encompassing a single solid packing cylinder is selected from the cryogenic packed bed as depicted in figure 1. The computational domain is  $0 \leqslant x \leqslant l_x$, $0 \leqslant y \leqslant l_y$ and $0 \leqslant z \leqslant l_z$. From the inlet of the selected domain, the incompressible flue gas at temperature $T_0$, pressure $p_0$ and velocity $\boldsymbol {u}_0$ is injected in. Such a flue gas initially consists of $\text {CO}_2$ and $\text {N}_2$ with mass fractions $Y_0$ and $(1-Y_0)$, respectively. The temperature of the packing cylinder ( $T_{w}$) is above the freezing point of $\text {N}_2$ but below that of $\text {CO}_2$. Thus once the flue gas is sufficiently cooled by the cylinder, $\text {N}_2$ continues passing the cylinder and leaving the domain without phase change, while the gaseous $\text {CO}_2$ starts to deposit as solid on the cylinder surface:
 \begin{equation} \text{CO}_2(\text{g}) \rightarrow \text{CO}_2(\text{s}) + Q. \end{equation}
Here,  $Q$ is the released heat from $\text {CO}_2$ desublimation, and the gaseous and solid phases of $\text {CO}_2$ are denoted by g and s, respectively. During such a desublimation process, the mass transfer rate from the gaseous $\text {CO}_2$ to the solid $\text {CO}_2$ is estimated as (Tuinier et al. Reference Tuinier, van Sint Annaland, Kramer and Kuipers2010; Debnath et al. Reference Debnath, Mukherjee, Mullick, Ghoshdastidar, Ganguly and Kargupta2019)
 \begin{equation} m_r = k_r ( y_i p - p_e ). \end{equation}
In the above calculation,  $k_r$ is the mass desublimation rate constant, $p$ is the flue gas pressure, and $y_i$ is the mole fraction of $\text {CO}_2$. The value of $y_i$ is calculated based on the mass fraction $Y$ of $\text {CO}_2$:
 \begin{equation} y_i =\frac{M}{M_{\text{CO}_2}}\,Y, \quad \text{with}\ \frac{1}{M} = \frac{Y}{M_{\text{CO}_2}}+\frac{1-Y}{M_{\text{N}_2}}, \end{equation}
where  $M$,
$M$,  $M_{\text {CO}_2}$ and $M_{\text {N}_2}$ are the molecular weights of the flue gas, $\text {CO}_2$ and $\text {N}_2$, respectively. The equilibrium pressure between the gas and the solid phases corresponding to the local temperature $T$ is determined by an empirical correlation as (Tuinier et al. Reference Tuinier, van Sint Annaland, Kramer and Kuipers2010)
 \begin{equation} p_e = \exp\left(10.257 - \frac{3082.7}{T}+4.08\ln T-2.2658\times 10^{{-}2}T\right). \end{equation}
The units of  $p_e$ and $T$ are pascal (Pa) and kelvin (K), respectively. Note that $\text {CO}_2$ desublimates continuously on the cylinder surface until the equilibrium pressure is reached. That is, (2.2) is valid when the partial pressure of $\text {CO}_2$ is larger than the equilibrium pressure (i.e. $y_i p > p_e$), otherwise the mass transfer rate becomes zero under conditions with $y_i p\leqslant p_e$. From the desublimation process, the released heat $Q$ is calculated as
 \begin{equation} Q = m_ra_rh_r, \end{equation}
with  $h_r$ being the enthalpy change of $\text {CO}_2$ desublimation, and $a_r$ being the specific surface area per unit volume. During the $\text {CO}_2$ desublimation process, the pore structure of the SCL changes with the deposition of solid $\text {CO}_2$ on the cylinder surface. This structure evolution is tracked by the mass conservation equation for the solid $\text {CO}_2$ as (Kang et al. Reference Kang, Chen, Valocchi and Viswanathan2014)
 \begin{equation} \rho_s\,\frac{\partial V_s}{\partial t} = m_r a_r V_r, \end{equation}
where  $V_s$ and $\rho _s$ represent the volume and density of solid $\text {CO}_2$, respectively, and $V_r$ is the active volume for desublimation.
To model  ${\text {CO}_2}$ desublimation at the pore scale, a set of governing equations is built, including the continuity equation (2.7) and the incompressible Navier–Stokes equation (2.8) for the flue gas flow, the species conservation equation (2.9) for the transport of ${\text {CO}_2}$ in flow paths, and the energy conservation equation (2.10) for heat transfer in both flow paths and solid phases (i.e. solid cylinder and solid ${\text {CO}_2}$):
 \begin{gather} \boldsymbol{\nabla}\boldsymbol{\cdot} {\boldsymbol{u}} = 0, \end{gather}
 \begin{gather}\rho_g\,\frac{\partial \boldsymbol{u}}{\partial t} + \rho_g\,\boldsymbol{\nabla} \boldsymbol{\cdot} (\boldsymbol{u}\boldsymbol{u} ) ={-}\boldsymbol{\nabla} p + \rho_g\,\boldsymbol{\nabla} \boldsymbol{\cdot} ( \nu\,\boldsymbol{\nabla}\boldsymbol{u} ), \end{gather}
 \begin{gather}\frac{\partial Y}{\partial t} + \boldsymbol{\nabla} \boldsymbol{\cdot} ( Y \boldsymbol{u}) = \boldsymbol{\nabla} \boldsymbol{\cdot} ( D\,\boldsymbol{\nabla} Y ), \end{gather}
 \begin{gather}\frac{\partial }{\partial t} ( \rho c_p T ) + \boldsymbol{\nabla} \boldsymbol{\cdot} (\rho c_p T\boldsymbol{u}) = \boldsymbol{\nabla} \boldsymbol{\cdot} ( \rho c_p \alpha\,\boldsymbol{\nabla} T ) + Q. \end{gather}
Here,  $\boldsymbol {u}=(u, v, w)$, $\rho _g$ and $\nu$ are the gas velocity, density and kinematic viscosity, respectively; $t$ is the time, and $D$ is the diffusion coefficient of the gaseous component $\text {CO}_2$; $\rho$, $c_p$ and $\alpha$ are the local density, specific heat at constant pressure, and thermal diffusivity, respectively.
Such governing equations must satisfy boundary conditions at both internal and external boundaries of the computational domain. At the internal interface between the flue gas and the solid cylinder or solid  $\text {CO}_2$, two types of boundary conditions are considered.
On the one hand, at the gas–solid interface  $I$ satisfying the criterion $y_i p > p_e$, the gaseous $\text {CO}_2$ desublimates to generate the solid $\text {CO}_2$ and release heat. Such a desublimation process at the internal interface $I$ is described by boundary conditions as
 \begin{gather} \boldsymbol{u}^I = \left( 0, 0 \right), \end{gather}
 \begin{gather}\boldsymbol{n}\boldsymbol{\cdot} D \rho_g\,\boldsymbol{\nabla} Y^I = m_r, \end{gather}
 \begin{gather}T^{I,+} =T^{I,-}, \quad \boldsymbol{n} \boldsymbol{\cdot} (k\,\boldsymbol{\nabla} T +\rho c_p \boldsymbol{u} T )^{I,+} = \boldsymbol{n} \boldsymbol{\cdot} (k\, \boldsymbol{\nabla} T +\rho c_p \boldsymbol{u} T ) ^{I,-} + q. \end{gather}
These equations describe the no-slip velocity (2.11), the mass conservation (2.12), and the conjugate heat transfer (2.13a,b) boundary conditions. In these equations,  $\boldsymbol {n}$ is the interface normal pointing to the gas phase, $+$ and $-$ denote parameters on either side of $I$,
$I$,  $k=\alpha \rho c_p$ is the thermal conductivity, and $q$ is the heat flux caused by $\text {CO}_2$ desublimation.
On the other hand, at the gas–solid interface  $I_n$ satisfying $y_i p \leqslant p_e$, there is no $\text {CO}_2$ desublimation, and the no-flux boundary condition is adopted for mass conservation. Thus the boundary conditions at the internal interface $I_n$ reduce to
 \begin{gather} \boldsymbol{u}^{I_n} = \left( 0, 0 \right), \end{gather}
 \begin{gather}\boldsymbol{\nabla} Y^{I_n} = \boldsymbol{0}, \end{gather}
 \begin{gather}T^{I_n,+} =T^{I_n,-}, \quad \boldsymbol{n} \boldsymbol{\cdot} (k\, \boldsymbol{\nabla} T +\rho c_p \boldsymbol{u} T )^{I_n,+} = \boldsymbol{n} \boldsymbol{\cdot} (k\,\boldsymbol{\nabla} T +\rho c_p \boldsymbol{u} T ) ^{I_n,-}. \end{gather}
 At the external boundaries of the computational domain, boundary conditions are set as follows. First, at the inlet ( $x=0$), the component mass fraction, temperature and velocity are specified. This is because the flue gas is injected into the domain at a specific operation condition. Then, at the outlet ( $x=l_x$), the zero-gradient velocity and the no-flux conditions for temperature and mass fraction are applied. A fully developed flow is thus considered there, and the flue gas can flow out freely. Finally, at the bottom ( $y=0$) and top ( $y=l_y$), the periodic conditions are imposed. Note that the additional front ( $z=0$) and back ( $z=l_z$) boundaries in 3-D simulations are also treated as periodic ones. These boundary conditions are described by
 \begin{gather} u = u_0, \quad v = 0, \quad w = 0, \quad Y = Y_0, \quad T = T_0 \quad \text{on}\ x=0, \end{gather}
 \begin{gather}\boldsymbol{\nabla} u = \boldsymbol{\nabla} v = \boldsymbol{\nabla} w = \textbf{0}, \quad \boldsymbol{\nabla} Y = \textbf{0}, \quad \boldsymbol{\nabla} T = \textbf{0} \quad \text{on}\ x=l_x, \end{gather}
 \begin{gather}\zeta( y=0 ) = \zeta( y=l_y ), \quad \zeta( z=0 ) = \zeta( z=l_z ) \quad \text{for} \ \zeta = \boldsymbol{u}, Y, T. \end{gather}
 In order to model  $\text {CO}_2$ desublimation using the LB method, the above physical parameters should be converted to those in the lattice units. For this purpose, dimensionless parameters are derived to act as the conversion criteria between the two systems of units. By introducing the characteristic length $L$, velocity $U$, temperature $T_{ch}$ and density $\rho _g$, dimensionless parameters marked by asterisks are derived as
 \begin{equation} \left.\begin{gathered} \boldsymbol{x}^* = \frac{\boldsymbol{u}}{L}, \quad t^* = \frac{t U}{L}, \quad \boldsymbol{u}^* = \frac{\boldsymbol{u}}{U}, \quad \rho^* = \frac{\rho}{\rho_g}, \quad p^* = \frac{p}{\rho_g U^2}, \quad T^* = \frac{T}{T_{ch}}, \\ m_r^* = \frac{m_r}{\rho_lU}, \quad h_r^* = \frac{h_r}{c_{p,g}T_{ch}}, \quad k_r^* = k_rU, \quad \textit{Re} = \frac{LU}{\nu}, \quad \textit{Pe} = \frac{LU}{D}, \quad \textit{Pr} = \frac{\nu}{\alpha_g}. \end{gathered}\right\} \end{equation}
The subscript  $g$ refers to physical properties of the flue gas. From such dimensionless derivations, key characteristic numbers are obtained, such as the Reynolds number $\textit {Re}$, the Péclet number $\textit {Pe}$, and the Prandtl number $\textit {Pr}$. In the following LB simulations, a match of these dimensionless variables ensures the same desublimation properties between the lattice space and the real physical coordinate.
3. Numerical method
Considering different thermophysical properties between the gas and solid phases, (2.10) is recast as
 \begin{equation} \frac{\partial T}{\partial t} + \boldsymbol{\nabla} \boldsymbol{\cdot} ( T \boldsymbol{u} ) = \boldsymbol{\nabla} \boldsymbol{\cdot} ( \alpha \boldsymbol{\nabla} T ) + F_{T}, \end{equation}
with the source term  $F_T$ being
 \begin{align} F_{T}=F_{T1}+F_{T2}, \quad F_{T1} = \frac{Q}{\rho c_p}, \quad F_{T2} = \frac{\boldsymbol{\nabla}( \rho c_p )}{\rho c_p}\boldsymbol{\cdot} ( \alpha\,\boldsymbol{\nabla} T - T \boldsymbol{u} ) - \frac{T}{\rho c_p}\,\frac{\partial (\rho c_p)}{\partial t}. \end{align}
The derivation details can be found in our earlier work (Lei et al. Reference Lei, Wang and Luo2021).
To solve the governing equations (2.7)–(2.9) and (3.1) in two and three dimensions, the 2-D nine-velocity (D2Q9) and 3-D fifteen-velocity (D3Q15) multiple-relaxation-time (MRT) LB models are developed, respectively (Pan, Luo & Miller Reference Pan, Luo and Miller2006; Guo & Shu Reference Guo and Shu2013; Lei & Luo Reference Lei and Luo2019). The corresponding discrete velocities  $\boldsymbol {e}_i$ and weight coefficients $w_i$ are provided in Appendix A.
In the proposed LB models, a set of evolution equations is built as (Guo & Shu Reference Guo and Shu2013; Lei & Luo Reference Lei and Luo2019; Lei et al. Reference Lei, Wang and Luo2021)
 \begin{gather} f_i \left( \boldsymbol{x} + \boldsymbol{e}_i \delta _t, t + \delta _t \right) - f_i \left( \boldsymbol{x}, t \right) ={-}\left( \boldsymbol{\mathsf{M}}^{{-}1} \boldsymbol{\mathsf{S}} \boldsymbol{\mathsf{M}} \right)_{ij} \left[ f_j \left( \boldsymbol{x}, t \right) - f_j ^{eq} \left( \boldsymbol{x}, t \right) \right], \end{gather}
 \begin{gather} g_i \left( \boldsymbol{x} + \boldsymbol{e}_i \delta _t, t + \delta _t \right) - g_i\left( \boldsymbol{x}, t \right) ={-} \left( \boldsymbol{\mathsf{M}}^{{-}1} \boldsymbol{\mathsf{S}}_y \boldsymbol{\mathsf{M}} \right)_{ij} \left[ g_j \left( \boldsymbol{x}, t \right) - g_j ^{eq} \left( \boldsymbol{x}, t \right) \right], \end{gather}
 \begin{align} h_i \left( \boldsymbol{x} + \boldsymbol{e}_i \delta _t, t + \delta _t \right) - h_i\left( \boldsymbol{x}, t \right) &={-} \left( \boldsymbol{\mathsf{M}}^{{-}1} \boldsymbol{\mathsf{S}}_t \boldsymbol{\mathsf{M}} \right)_{ij} \left[ h_j \left( \boldsymbol{x}, t \right) - h_j ^{eq} \left( \boldsymbol{x}, t \right) \right]\nonumber\\ &\quad + \delta _t \bar{F}_{T,i} + \frac{\delta _t^ 2}{2}\,\frac{\partial \bar{F}_{T,i}}{\partial t}, \end{align}
where  $i$ and $j$ are discrete directions, and $f_i(\boldsymbol {x}, t)$, $g_i(\boldsymbol {x},t)$ and $h_i(\boldsymbol {x},t)$ are distribution functions for the density, the $\textrm {CO}_2$ mass fraction and the temperature fields, respectively. The corresponding equilibrium distribution functions $f_i^{eq}$, $g_i^{eq}$ and $h_i^{eq}$ are given as
 \begin{gather} f_i^{eq} = w_i \left[\rho_g + \rho_p \left( \frac{\boldsymbol{e}_i \boldsymbol{\cdot} \boldsymbol{u}}{c_s^2} + \frac{\left(\boldsymbol{e}_i \boldsymbol{\cdot} \boldsymbol{u}\right)^2}{2 c_s^4} - \frac{\boldsymbol{u}^2}{2 c_s^2} \right) \right], \end{gather}
 \begin{gather}g_i^{eq} = w_i Y \left[ 1 + \frac{\boldsymbol{e}_i \boldsymbol{\cdot} \boldsymbol{u}}{c_s^2} + \frac{\left(\boldsymbol{e}_i \boldsymbol{\cdot} \boldsymbol{u}\right)^2}{2 c_s^4} - \frac{\boldsymbol{u}^2}{2 c_s^2} \right], \end{gather}
 \begin{gather}h_{i}^{eq} = w_i T \left[ 1 + \frac{\boldsymbol{e}_i \boldsymbol{\cdot} \boldsymbol{u}}{c_s^2} + \frac{\left(\boldsymbol{e}_i \boldsymbol{\cdot} \boldsymbol{u}\right)^2}{2 c_s^4} - \frac{\boldsymbol{u}^2}{2 c_s^2} \right]. \end{gather}
Here,  $\rho _p$ is a variable related to the gas pressure as $\rho _p= p / c_s^2$, where $c_s = e/ \sqrt {3}$ is the lattice sound velocity; $e=\delta _x/\delta _t$ is the lattice speed and is set as $e=1$ in the following simulations, with $\delta _x$ and $\delta _t$ denoting the lattice spacing and time step, respectively. This LB model for incompressible fluid flows can reduce compressible errors (Guo & Shu Reference Guo and Shu2013).
To avoid discrete lattice effects, the distribution function for the thermal source term ( $F_T$) is defined as (Guo & Zhao Reference Guo and Zhao2002; Shi & Guo Reference Shi and Guo2009)
 \begin{equation} \bar{F}_{T,i} = w_i F_T \left( 1 + \frac{\boldsymbol{e}_i\boldsymbol{\cdot}\boldsymbol{u}}{c_s^2}\, \frac{\tau_t-0.5}{\tau_t} \right), \end{equation}
with  $\tau _t$ being the relaxation time. The time derivatives in (3.2c) ( $\partial \rho c_p / \partial t$) and (3.5) ( $\partial \bar {F}_{T,i} / \partial t$) are treated by the backward scheme. In the evolution equations (3.3)–(3.5), $\boldsymbol{\mathsf{S}}$, $\boldsymbol{\mathsf{S}}_y$ and $\boldsymbol{\mathsf{S}}_t$ are the diagonal relaxation matrices, while $\boldsymbol{\mathsf{M}}$ is the transformation matrix to map distribution functions from the physical space to the moment space. More details about the transformation are provided in Appendix A. Based on the distribution functions, the macroscopic variables can be calculated finally as
 \begin{equation} \rho_p=\sum_{i}{f_i}, \quad \rho_g\boldsymbol{u}=\sum_i{\boldsymbol{e}_i f_i}, \quad Y =\sum_{i}{g_i}, \quad T =\sum_{i}{h_i}. \end{equation}
 In order to obtain the accurate solution of (2.7)–(2.9) and (3.1) by the above LB models, boundary conditions for macroscopic variables in (2.11)–(2.19) should be satisfied. Note, however, that the fundamental variables in LB equations are discrete distribution functions (i.e.  $f_i(\boldsymbol {x}, t)$, $g_i(\boldsymbol {x},t)$ and $h_i(\boldsymbol {x},t)$). It is thus necessary to build LB boundary schemes to transform the boundary conditions for macroscopic variables to those for discrete distribution functions.
On the one hand, treatments of the external boundary conditions are introduced. For the specified inlet in (2.17) and the fully developed outlet in (2.18), the non-equilibrium extrapolation boundary scheme is applied to reconstruct the unknown distribution functions (Guo & Shu Reference Guo and Shu2013). For the periodic top and bottom boundaries in (2.19), the outgoing distribution functions from the top re-enter the domain from the bottom, and vice versa (Guo & Shu Reference Guo and Shu2013). This scheme is also applied for the periodic front and back boundaries in (2.19).
On the other hand, LB schemes are built for modelling boundary conditions at the internal boundaries  $I$ and $I_n$. For the gas–solid interface $I$ with the desublimation of $\textrm {CO}_2$, three boundary treatments are required. First, the conjugate heat transfer in (2.13a,b) is satisfied automatically by solving the energy conservation equation (3.1). Then the no-slip velocity condition in (2.11) is addressed by the halfway bounce-back scheme, with the unknown distribution functions at the gas grid $\boldsymbol {x}_g$ adjacent to $I$ being (Zhang et al. Reference Zhang, Shi, Guo, Chai and Lu2012)
 \begin{equation} f_{\bar{\imath}}( \boldsymbol{x}_g, t + \delta _t ) = f'_i ( \boldsymbol{x}_g, t ). \end{equation}
Here, the superscript  $'$ denotes the post-collision distribution function, $i$ is the direction opposite to $\bar {\imath }$ (i.e. $\boldsymbol {e}_i = -\boldsymbol {e}_{\bar {\imath }}$), and $\boldsymbol {e}_i$ points to the solid phase. Finally, to solve the mass conservation condition in (2.12), the $\textrm {CO}_2$ mass fraction gradient at interface $I$ (
$I$ ( $\boldsymbol {\nabla } Y^I$) is calculated based on the finite-difference scheme as (Zhang et al. Reference Zhang, Shi, Guo, Chai and Lu2012)
 \begin{equation} \boldsymbol{n} \boldsymbol{\cdot} \boldsymbol{\nabla} Y^I = \frac{Y^g-Y^I}{0.5\boldsymbol{n}\boldsymbol{\cdot} \boldsymbol{e}_i\delta_x}, \end{equation}
where  $Y^g$ is the $\textrm {CO}_2$ mass fraction at the gas grid neighbouring the interface $I$. By inserting (3.12) into (2.12) and using the ideal gas law, the value of $Y^I$ is calculated as
 \begin{equation} Y^I = \frac{D \rho_g Y^l + 0.5\boldsymbol{n}\boldsymbol{\cdot} \boldsymbol{e}_i\delta_x k_r p_e}{ D \rho_g + 0.5 \boldsymbol{n} \boldsymbol{\cdot} \boldsymbol{e}_i \delta_x k_r p_0 T/T_0}. \end{equation}
Hence the mass conservation condition reduces to a given  $\textrm {CO}_2$ mass fraction value $Y^I$. The halfway bounce-back scheme is used to solve this boundary condition, and the unknown distribution functions at the gas grid are computed as (Zhang et al. Reference Zhang, Shi, Guo, Chai and Lu2012)
 \begin{equation} g_{\bar{\imath}}( \boldsymbol{x}_g, t + \delta _t ) ={-}g'_i ( \boldsymbol{x}_g, t )+2w_iY^I. \end{equation}
In addition, for the interface  $I_n$ without $\textrm {CO}_2$ desublimation, the conjugate heat transfer in (2.16a,b) and the no-slip velocity in (2.14) are addressed as conducted at interface $I$. In other words, the halfway bounce-back scheme applied to solve the no-flux condition for mass fraction in (2.15) becomes,
 \begin{equation} g_{\bar{\imath}}( \boldsymbol{x}_g, t + \delta _t ) = g'_i ( \boldsymbol{x}_g, t ). \end{equation}
 With the desublimation process, solid  $\textrm {CO}_2$ is generated to form an SCL on the cooled cylinder surface, and the movement of solid $\textrm {CO}_2$ with the fluid flow is not considered. The pore structure of the SCL is updated based on the mass conservation equation (2.6) for the solid $\textrm {CO}_2$. In LB simulations, this structure evolution is realized by the commonly used VOP method (Kang et al. Reference Kang, Lichtner and Zhang2006; Zhou et al. Reference Zhou, Xu, Xia, Li and Qin2020). Explicitly, a grid mesh is selected that is fine enough to cover the computational domain. Thus each grid node of the domain can be assumed to represent only one material: the solid cylinder, the solid $\textrm {CO}_2$ or the flue gas. In the VOP method, each grid node (or pixel) holds a control volume of size $1\times 1 \times 1$ in lattice units, with the grid node being located at the centre of the volume. At each grid node, the volume of solid $\textrm {CO}_2$ is noted as $V_s$. Initially, values of $V_s$ are set as $V_s=1$ at solid $\textrm {CO}_2$ grids, $V_s=0$ at gas grids, and $V_s=0$ at cylinder grids, respectively. As the desublimation process continues, $V_s$ changes according to (2.6), and it is updated at each time step as
 \begin{equation} V_s(t + \delta _t) = V_s(t ) + m_r a_r V_r/\rho_s. \end{equation}
Considering that each grid node can be occupied by one material, the desublimated volume is not included in the grid node until  $V_s$ exceeds the threshold value. That is, as the value of $V_s$ doubles at a solid $\textrm {CO}_2$ grid (i.e. $V_s=2$) or increases to $V_s=1$ at a cylinder grid, one of its neighbouring gas grid nodes is chosen to be converted into a solid $\textrm {CO}_2$ grid. The ratios of the desublimation probability between the nearest and diagonal grid nodes are set as $R_{dp}=1:0.125$ in three dimensions and $R_{dp}=1:0.25$ in two dimensions, respectively. These selected $R_{dp}$ values are consistent with the ratios of weight coefficients $w_i$ between the nearest and diagonal directions. The sensitivity of $\textrm {CO}_2$ desublimation properties to the value of $R_{dp}$ has been evaluated in Appendix B, thus verifying the reliability of the selected $R_{dp}$ above.
4. Results and discussion
The developed MRT LB models are programmed in the C language, with the Message Passing Interface library being applied for parallel computing. The LB code is verified by two cases: one is the desublimation of  $\textrm {CO}_2$ on the surface of a single cylinder immersed in the quiescent flue gas; the other is the desublimation of $\textrm {CO}_2$ inside a packed bed fed with flue gas. As demonstrated in Appendix C, the present numerical results agree well with existing simulations and experiments, validating the proposed LB models and verifying their implementation. In addition, for a comprehensive model validation, key sub-models of the proposed MRT LB method have been tested in the supplementary material available at https://doi.org/10.1017/jfm.2023.227. Subsequently, pore-scale simulations are conducted to investigate $\textrm {CO}_2$ desublimation on the packing cylinder as shown in figure 1. Considering that the computational domain is selected from the cryogenic bed, the volume fraction of void space is set as the bed porosity Ali et al. (Reference Ali, Maqsood, Syahera, Shariff and Ganguly2014). Thus key geometrical parameters of the computational domain are set as length $l_x=14.7\ \textrm {mm}$, width $l_y=14.7\ \textrm {mm}$, depth $l_z=0.69\ \textrm {mm}$, cylinder diameter $l_d=10.0\ \textrm {mm}$, and the void volume fraction $\phi =0.637$. From such a 3-D structure, an $x- y$ cross-section at a random location $z_r$ is selected for 2-D simulations (see the front view in figure 1).
In the computational domain, a cooled cylinder at temperature  $T_w$ is placed in the centre area for $\textrm {CO}_2$ desublimation, and the remaining void space (or flow paths) is initially filled with pure $\textrm {N}_2$ at temperature $T_w$. The incompressible flue gas at the initial condition $(T_0, Y_0, u_0, p_0 )$ is injected from the inlet, and the component $\textrm {CO}_2$ desublimates on the surface of the cooled cylinder. The desublimation parameters are set as $k_r=10^{-6}\ \textrm {s}\ \textrm {m}^{-1}$ and $h_r=5.682\times 10^5\ \textrm {J}\ \textrm {kg}^{-1}$ (Tuinier et al. Reference Tuinier, van Sint Annaland, Kramer and Kuipers2010). The initial conditions of the flue gas are $T_0=293\ \textrm {K}$, $Y_0=1$ and $p_0=0.1\ \textrm {MPa}$. Based on the equilibrium pressure in (2.4), the freezing point of $\textrm {CO}_2$ corresponding to $p_0=0.1\ \textrm {MPa}$ can be calculated as $T_f=194.6\ \textrm {K}$. The inlet velocity of the flue gas $u_0$ and the cylinder temperature $T_w$ are left for changing the desublimation conditions. Thermophysical properties of the flue gas, the solid $\textrm {CO}_2$ and the solid cylinder are fixed as $\rho _g=1.46\ \textrm {kg}\ \textrm {m}^{-3}$, $c_{p,g}=0.846\ \textrm {kJ}\ \textrm {kg}^{-1}\ \textrm {K}^{-1}$, $\alpha _{g}=5.02\times 10^{-6}\ \textrm {m}^{2} \textrm {s}^{-1}$, $\rho _s=1.56\times 10^3\ \textrm {kg}\ \textrm {m}^{-3}$, $c_{p,s}=0.967\ \textrm {kJ}\ \textrm {kg}^{-1}\ \textrm {K}^{-1}$, $\alpha _{s}=4.64\times 10^{-7}\ \textrm {m}^2\ \textrm {s}^{-1}$, $\rho _c=2.55\times 10^3\ \textrm {kg}\ \textrm {m}^{-3}$, $c_{p,c}=0.841\ \textrm {kJ}\ \textrm {kg}^{-1}\ \textrm {K}^{-1}$, and $\alpha _{c}=3.74\times 10^{-7}\ \textrm {m}^2\ \textrm {s}^{-1}$. Here, the subscripts $g$,
$g$,  $s$ and $c$ represent properties of the flue gas, the solid $\textrm {CO}_2$ and the solid cylinder, respectively. The gas viscosity and the $\textrm {CO}_2$ diffusion coefficient are $\nu =7.12\times 10^{-6}\ \textrm {m}^2\ \textrm {s}^{-1}$ and $D=1.63\times 10^{-5}\ \textrm {m}^2\ \textrm {s}^{-1}$, respectively. In the subsequent simulations, the conversion between the physical and lattice units is based on a match of the dimensionless parameters in (2.20), with characteristic parameters being selected as
 \begin{equation} L = l_y, \quad U = u_0, \quad \rho_{ch}=\rho_g, \quad T_{ch}=T_0. \end{equation}
Before proceeding further, grid convergence tests have been carried out. A mesh of size  $640 \times 640 \times 30$ with lattice resolution $0.0219\ \textrm {mm}$ is selected to describe the computational domain in figure 1. In 2-D simulations, an $x- y$ cross-section is selected randomly from the 3-D domain, thus the mesh size is $640 \times 640$. More details about the grid convergence tests are provided in Appendix D and the supplementary material.
Given the periodic front and back boundaries of the computational domain, the desublimation of  $\textrm {CO}_2$ is first simulated in two dimensions. A comparison with 3-D simulations is then provided to verify the reliability of 2-D results. In the subsequent simulations, the range of $u_0$ from $1.22\times 10^{-3}\ \textrm {m}\ \textrm {s}^{-1}$ to $6.1\times 10^{-2}\ \textrm {m}\ \textrm {s}^{-1}$, and the range of $T_w$ from $100\ \textrm {K}$ to $180\ \textrm {K}$, are covered. These two parameters (i.e. $u_0$ and $T_w$) are characterized by the Péclet number $\textit {Pe}$ and the dimensionless subcooling degree $\Delta T_{sub}=(T_f-T_w)/T_{ch}$, respectively. The corresponding $\textit {Pe}$ and $\Delta T_{sub}$ locate in the ranges $[1.1, 55]$ and $[0.05, 0.32]$, respectively. Each simulation test is continued until the maximum thickness of the SCL ( $\delta _{fm}$) reaches the termination condition $\delta _{fm}=0.048l_x$. The termination time instant in each test is denoted as $t_e$. For the quantitative analysis, the coordinates $(x, y, z)$ are transformed to the coordinates $(r, \theta, z )$ (see figure 1). The coordinates ranges are set as $0 \leqslant x \leqslant l_x$, $0 \leqslant y \leqslant l_y$ and $0 \leqslant z \leqslant l_z$ for $(x, y, z)$, and $l_d/2 < r \leqslant l_x/2$, $0 \leqslant \theta < 2{\rm \pi}$ and $0 \leqslant z \leqslant l_z$ for $(r, \theta, z )$. Here, the coordinate $r$ starts from $l_d/2$ because we focus on the space with the flue gas and the solid $\textrm {CO}_2$. Both of these coordinate systems are used to describe the $\textrm {CO}_2$ desublimation properties.
4.1. $\textrm {CO}_2$ desublimation characteristics

To discuss the general properties of  $\textrm {CO}_2$ desublimation on the cooled cylinder surface, a case with the subcooling degree $\Delta T_{sub}=0.17$ and Péclet number $\textit {Pe}=11$ is first simulated in two dimensions. This case is referred to as case Base. The simulated $\textrm {CO}_2$ desublimation properties are illustrated in figure 2, including contours of solid $\textrm {CO}_2$, temperature ( $T$) and $\textrm {CO}_2$ mass fraction ( $Y$) at two time instants $t=8.9, 55.8\ \textrm {s}$. As the desublimation process goes on, $\textrm {CO}_2$ deposits on the cylinder surface to generate the SCL, which is observed to be thicker in the front surface area (facing the inlet) and thinner in the back surface area (facing the outlet). This uneven desublimation is driven by the continuous gas injection from the inlet. Also, distributions of $Y$ show that the outgoing $\textrm {CO}_2$ mass fraction is obviously smaller than the injected value. This indicates that a large portion of the injected $\textrm {CO}_2$ is captured by the cooled cylinder. These $\textrm {CO}_2$ desublimation properties are consistent with our expectations. Moreover, by providing the enlarged solid $\textrm {CO}_2$ distributions, the intricate pore structure of the desublimated SCL is depicted at each of the selected time instants. Both $T$ and $Y$ are found to decrease within the SCL, implying the suppressed heat and mass transfer there. The present 2-D simulations provide detailed temperature and $\textrm {CO}_2$ mass fraction distributions and pore structures of the SCL, which are difficult to observe from existing experiments and 1-D studies. $\textrm {CO}_2$ desublimation properties in case Base with subcooling degree $\Delta T_{sub}=0.17$ and Péclet number $\textit {Pe}=11$. Contours of solid $\textrm {CO}_2$, temperature ( $T$) and $\textrm {CO}_2$ mass fraction ( $Y$) at time instants (a) $t=8.9\ \textrm {s}$ and (b) $55.8\ \textrm {s}$. Zoom-in views of solid $\textrm {CO}_2$ are provided to clarify pore structures of SCLs.

In order to quantify these observed  $\textrm {CO}_2$ desublimation characteristics, we calculate the angularly averaged scalars as
 \begin{equation} \bar{\psi}_r= \frac{1}{2{\rm \pi}}\int_0^{2{\rm \pi}}\psi(r,\theta)\,{\rm d}\theta. \end{equation}
Here,  $\bar {\psi }_r$ represents the angularly averaged volume fraction of solid $\textrm {CO}_2$ ( $\phi _r$), temperature ( $\bar {T}_r$) and $\textrm {CO}_2$ mass fraction ( $\bar {Y}_r$). Figure 3 plots the computed profiles of $\bar {\psi }_r$ at two time instants $t=8.9, 55.8\ \textrm {s}$. As shown in figure 3(a), the calculate $\phi _r$ increases with time and grows outwards, suggesting the growth of the SCL on the cylinder surface. The maximum $\phi _r$ stays on the cylinder surface and remains less than 1 (i.e. $\phi _{rm}<1$), which stems from the weak desublimation in the back surface area. Further, profiles of $\phi _r$ can be used to define the surface of the SCL as the position $r=r_m$ with $\phi _r=0.01$. The maximum thickness of the SCL ( $\delta _{fm}$) is then calculated as the distance between the surfaces of the solid cylinder ( $r=l_d/2$) and the SCL ( $r=r_m$). On the other hand, profiles of both $\bar {T}_r$ and $\bar {Y}_r$ are illustrated in figures 3(b) and 3(c). At a certain radius $r$, the value of $\bar {T}_r$ (or $\bar {Y}_r$) is found to decrease with the growth of the SCL. In addition, $\bar {T}_r$ (or $\bar {Y}_r$) increases at a smaller rate inside the SCL ( $l_d/2< r \leqslant r_m$), and at a larger rate in the gas region ( $r_m < r \leqslant l_x/2$). This tendency results from two factors: one is the resistance of the SCL on heat and mass transfer; the other is that heat and mass are transferred mainly by the faster convection in the gas area, and the slower conduction and diffusion in the SCL. $\textrm {CO}_2$ desublimation properties in case Base with subcooling degree $\Delta T_{sub}=0.17$ and Péclet number $\textit {Pe}=11$. Angularly averaged profiles of (a) volume fraction of solid $\textrm {CO}_2$ ( $\phi _r$), (b) temperature ( $\bar {T}_r$) and (c) $\textrm {CO}_2$ mass fraction ( $\bar {Y}_r$) at two time instants $t=8.9, 55.8\ \textrm {s}$.

Considering the important role of the SCL, we calculate three metrics for quantitative analyses. The first is  $\phi _x$, the transversally averaged volume fraction of solid $\textrm {CO}_2$:
 \begin{equation} \phi_x= \frac{1}{l_y}\int_0^{l_y}V_s(x,y)\,{{\rm d}y}. \end{equation}
The next metric is the local thickness of the SCL ( $\delta _f$) determined along the angular direction. Finally, from $l_d/2$ to ( $l_d/2+\delta _f$), the radially averaged volume fraction of solid $\textrm {CO}_2$ ( $\phi _\theta$) is calculated as
 \begin{equation} \phi_\theta= \frac{1}{\delta_f}\int_{l_d/2}^{l_d/2+\delta_f}V_s(r,\theta)\,{\rm d}r. \end{equation}
Here,  $V_s(x,y)$ and $V_s(r,\theta )$ are local volumes of solid $\textrm {CO}_2$ in two different coordinates.
Profiles of  $\phi _x$ are first depicted in figure 4(a). The value of $\phi _x$ is found to be larger in the front surface area but smaller in the back surface area, corresponding to the uneven $\textrm {CO}_2$ accumulation on the cylinder surface in figure 2. Then results for $\delta _f$ are plotted in figure 4(b), from which the maximum thickness of the SCL ( $\delta _{fm}$) is captured at each time instant. Here, $\delta _{fm}$ grows with time and keeps locating in the front surface area with strong $\textrm {CO}_2$ desublimation. Based on the calculated $\delta _f$, the parameter $\phi _\theta$ is finally determined along the angular direction. As shown in figure 4(c), the value of $\phi _\theta$ remains smaller than 1, suggesting that the SCL consists of both solid $\textrm {CO}_2$ and flue gas. For illustration, figure 4(d) provides the zoom-in view of the SCL at the time instant $t=55.8\ \textrm {s}$. The observed dendritic pore structures of the SCL verify the coexistence of both solid $\textrm {CO}_2$ and flue gas. Furthermore, ignoring the small fluctuations introduced by the random selections of neighbouring gas grids for the SCL growth, profiles of $\delta _f$ and $\phi _\theta$ in figures 4(b) and 4(c) are fairly symmetric about the middle of the domain ( $\theta =0$). This symmetry is attributed to the central position of the cylinder and the periodic top and bottom.
Analysis of the SCL in case Base with subcooling degree  $\Delta T_{sub}=0.17$ and Péclet number $\textit {Pe}=11$. (a) Transversally averaged volume fraction of solid $\textrm {CO}_2$ ( $\phi _x$). (b) Local thickness of the SCL along the angular direction ( $\delta _f$). (c) Radially averaged volume fraction of solid $\textrm {CO}_2$ ( $\phi _\theta$) at two time instants $t=8.9, 55.8\ \textrm {s}$. (d) Zoom-in view of the SCL in the highlighted grey rectangle of figure 2(b) at $t=55.8\ \textrm {s}$.

By modelling this case, the general  $\textrm {CO}_2$ desublimation properties have been discussed both qualitatively and quantitatively. Also, the pore structure of the SCL is visualized and analysed by different metrics. In order to further investigate effects of operation conditions on the $\textrm {CO}_2$ desublimation process, simulations with different values of $\Delta T_{sub}$ and $\textit {Pe}$ (i.e. $T_w$ and $u_0$) are conducted. The $\textrm {CO}_2$ desublimation properties and the $\textrm {CO}_2$ capture performance are compared for different operation parameters. Based on this comparison, four distinct regimes are identified, with each one representing a unique $\textrm {CO}_2$ desublimation pattern. Results of two sets of simulations are provided as representatives of the four desublimation regimes: cases A1 and A2 with $\textit {Pe}=11$ and $\Delta T_{sub}=0.32, 0.05$, and cases B1 and B2 with $\Delta T_{sub}=0.17$ and $\textit {Pe}=1.1, 55$. The parameters for case Base, cases A1-A2 and cases B1-B2 are summarized in table 1.
Values of the cylinder temperature  $T_w$, the gas injection velocity $u_0$, the dimensionless subcooling degree $\Delta T_{sub}$, and the Péclet number $\textit {Pe}$ in case Base, cases A1-A2 and cases B1-B2.

4.2. Four desublimation regimes
We first consider cases A1-A2 with different  $\Delta T_{sub}$ values. Based on (2.2)–(2.4), the larger subcooling degree $\Delta T_{sub}$ (or the lower temperature $T$) yields the smaller equilibrium pressure $p_e$ and then the faster mass transfer rate $m_r$. Hence, compared with case Base ( $\Delta T_{sub}=0.17$), cases A1-A2 are selected to represent the faster ( $\Delta T_{sub}=0.32$) and the slower ( $\Delta T_{sub}=0.05$) $\textrm {CO}_2$ desublimation conditions, respectively. For each case, figures 5(a) and 5(b) depict spatial distributions of solid $\textrm {CO}_2$, temperature ( $T$) and $\textrm {CO}_2$ mass fraction ( $Y$) at the termination time instant $t_e$, with $\delta _{fm}=0.048l_x$. Cases A1-A2 generally show $\textrm {CO}_2$ desublimation properties similar to case Base: the SCL grows on the cylinder surface, the strong $\textrm {CO}_2$ desublimation occurs in the front surface area, and heat and mass transfer is suppressed within the SCL. In addition to these similarities, cases A1-A2 show pore structures different to those of the SCL from case Base: the smaller $\Delta T_{sub}$ brings in the more compact SCL. As visualized in figure 5(c), the decrease of $\Delta T_{sub}$ makes the pore structure of SCL transform from a cluster-like type (A1), via a dendritic type (Base), to a dense type (A2). $\textrm {CO}_2$ desublimation properties in cases A1-A2 with Péclet number $\textit {Pe}=11$ and different subcooling degrees $\Delta T_{sub}$. Contours of solid $\textrm {CO}_2$, temperature ( $T$) and $\textrm {CO}_2$ mass fraction ( $Y$) in (a) case A1 with $\Delta T_{sub}=0.32$, and (b) case A2 with $\Delta T_{sub}=0.05$, at the termination time instant $t_e$. (c) Zoom-in views of the SCL in highlighted grey rectangles for case Base and cases A1-A2.

The difference in pore structures of the SCL is further quantified by the angularly averaged volume fraction of solid  $\textrm {CO}_2$ ( $\phi _r$) in figure 6(a). At a smaller $\Delta T_{sub}$, $\phi _r$ is larger and thus the SCL is denser. This change tendency is attributed to the relative intensity of the $\textrm {CO}_2$ desublimation rate and the $\textrm {CO}_2$ supply on the gas–solid interface. Based on (2.12), $\textrm {CO}_2$ diffuses to desublimate on the gas–solid interface, thus the supplied $\textrm {CO}_2$ there is determined by diffusion. In case A1 with $\Delta T_{sub}=0.32$, the desublimation rate is sufficiently large and the diffused $\textrm {CO}_2$ is exhausted once it reaches the surface of the SCL (or tips of solid $\textrm {CO}_2$). This fast desublimation leaves limited $\textrm {CO}_2$ to desublimate inside the SCL. The favoured $\textrm {CO}_2$ desublimation on the SCL surface combined with the restrained $\textrm {CO}_2$ desublimation inside the SCL lead to the fast growth of the SCL in a radial and cluster-like fashion. Note that, compared with the fast $\textrm {CO}_2$ desublimation, the supplied $\textrm {CO}_2$ via diffusion is insufficient, and case A1 is defined as the diffusion-controlled regime. Then in case Base, $\Delta T_{sub}$ decreases to $0.17$ and the desublimation rate slows down. As a result, a part of the diffused $\textrm {CO}_2$ passes the SCL surface without phase change and desublimates inside the SCL. The comparable desublimation and diffusion of $\textrm {CO}_2$ yield the dendritic-like SCL, which is more compact than the cluster-like SCL in case A1. Case Base is thus defined as the joint-controlled regime. Finally, as $\Delta T_{sub}$ decreases continuously to $0.05$ in case A2, the $\textrm {CO}_2$ desublimation rate becomes relatively slow. Instead of completely condensing on the SCL surface, the injected $\textrm {CO}_2$ diffuses to make most gas–solid interface rich in $\textrm {CO}_2$. Therefore, the slow desublimation process occurs on most gas–solid interface, and the SCL grows in a compact and dense pattern. Considering the sufficient $\textrm {CO}_2$ supply and the slow $\textrm {CO}_2$ desublimation rate, case A2 is marked as the desublimation-controlled regime. $\textrm {CO}_2$ desublimation properties in cases A1-A2 with Péclet number $\textit {Pe}=11$ and different subcooling degrees $\Delta T_{sub}$. Angularly averaged profiles of (a) volume fraction of solid $\textrm {CO}_2$ ( $\phi _r$), (b) $\textrm {CO}_2$ mass fraction ( $\bar {Y}_r$) and (c) temperature ( $\bar {T}_r$), at the termination time instant $t_e$ in case Base and cases A1-A2.

Upon the growth of the SCL, differences in heat and mass transfer arise among cases A1-A2 and Base. On the one hand, seen from distributions of  $Y$ in figures 2(a), 5(a) and 5(b), the injected $\textrm {CO}_2$ is captured efficiently by the cylinder in both cases A1 and Base, while a large portion of the injected $\textrm {CO}_2$ passes the cylinder and leaves the domain in case A2. Quantitatively, the angularly averaged $\textrm {CO}_2$ mass fraction ( $\bar {Y}_r$) is calculated and plotted in figure 6(b) for case Base and cases A1-A2. As illustrated, the profile of $\bar {Y}_r$ in case A2 is above those in the other two cases. These results indicate that the decreasing $\Delta T_{sub}$ (or the increasing $T_w$) gives rise to the degraded $\textrm {CO}_2$ capture performance. As explained above, this is due to the fact that the smaller $\Delta T_{sub}$ represents the slower $\textrm {CO}_2$ desublimation rate and the smaller capture ratio of $\textrm {CO}_2$. On the other hand, profiles of the angularly averaged temperature ( $\bar {T}_r$) are calculate for case Base and cases A1-A2. As shown in figure 6(c), $\bar {T}_r$ increases along the $r$ direction and the increase rate in the SCL slows down as $\Delta T_{sub}$ decreases. This reflects the fact that in a low- $\Delta T_{sub}$ case, the pore structure of the SCL is compact and dense, thus its thermal resistance becomes strong.
By modelling cases A1-A2, our results show a consistent trend with previous experiments (Wang et al. Reference Wang, Pfotenhauer, Qiu, Zhi and Jiang2020) that the SCL becomes more compact corresponding to the decreasing  $\Delta T_{sub}$. This verifies the reliability of the present LB simulations. However, previous experiments failed to describe intricate pore structures of the SCL, effects of the SCL on heat and mass transfer, and interactions between desublimation and diffusion/convection (or causes for different pore structures of the SCL). Therefore, this study helps to advance the understanding of $\textrm {CO}_2$ desublimation.
We then consider cases B1-B2 that have the smaller (B1) and the larger (B2) Péclet number  $\textit {Pe}$ than case Base. The larger $\textit {Pe}$ represents the faster gas injection velocity $u_0$. Again, seen from scalar distributions in figures 7(a) and 7(b), cases B1-B2 hold $\textrm {CO}_2$ desublimation properties similar to case Base. Zoom-in views of SCL structures and angularly averaged scalars are then provided in figures 7(c) and 8 to demonstrate differences between cases B1-B2 and case Base. Compared with case Base, the pore structure of the SCL becomes incompletely covered on the cylinder surface in case B1, but compact in case B2 (figure 7c). Correspondingly, there is a gradual rise in $\phi _{r}$ from case B1 via Base to B2 (figure 8a). As explained for cases A1-A2, the formation of these SCL structures is associated with the relative strength of the $\textrm {CO}_2$ desublimation rate and the $\textrm {CO}_2$ supply on the gas–solid interface. In other words, the gas convection intensity in cases B1-B2 varies obviously with the Péclet number $\textit {Pe}$, which subsequently affects both the $\textrm {CO}_2$ desublimation rate and the $\textrm {CO}_2$ supply for desublimation. To be specific, in case B1 ( $\textit {Pe}=1.1$), the gas convection is weak, thus the transport of $\textrm {CO}_2$ to the gas–solid interface is severely limited (figure 7a). As a consequence, the $\textrm {CO}_2$ desublimation rate declines sharply, the growth of the SCL is retarded strongly, and almost half of the cylinder surface is not coated by solid $\textrm {CO}_2$ (figure 7c). Due to effects of the weak convection, this case is defined as the convection-controlled regime. By contrast, the gas convection is accelerated in case B2 ( $\textit {Pe}=55$), and $\textrm {CO}_2$ is transported easily to the gas–solid interface for desublimation. As illustrated by distributions of $Y$ and profiles of $\bar {Y}_r$ (figures 7(b) and 8(b)), the supply of $\textrm {CO}_2$ via convection is relatively abundant (figure 7b). Similar to case A2, the sufficient $\textrm {CO}_2$ supply compared with desublimation finally contributes to the dense and compact structure of the SCL (figure 7c). Case B2 is thus classified as the desublimation-controlled regime. Furthermore, with the increase of $\textit {Pe}$, both $\bar {T}_r$ and $\bar {Y}_r$ increase significantly in the flue gas region (figures 8b,c). This is because the strong convection accelerates both heat and mass transfer in the flue gas area. $\textrm {CO}_2$ desublimation properties in cases B1-B2 with subcooling degree $\Delta T_{sub}=0.17$ and different Péclet numbers $\textit {Pe}$. Contours of solid $\textrm {CO}_2$, temperature ( $T$) and $\textrm {CO}_2$ mass fraction ( $Y$) in (a) case B1 with $\textit {Pe}=1.1$ and (b) case B2 with $\textit {Pe}=55$, at the termination time instant $t_e$. (c) Zoom-in views of the SCL in highlighted grey rectangles for case Base and cases B1-B2.
 $\textrm {CO}_2$ desublimation properties in cases B1-B2 with subcooling degree $\Delta T_{sub}=0.17$ and different Péclet numbers $\textit {Pe}$. Angularly averaged profiles of (a) volume fraction of solid $\textrm {CO}_2$ ( $\phi _r$), (b) $\textrm {CO}_2$ mass fraction ( $\bar {Y}_r$), and (c) temperature ( $\bar {T}_r$), at the termination time instant $t_e$ in case Base and cases B1-B2.

After that, pore structures of the SCL in cases A-B are analysed quantitatively and compared with case Base. Figure 9 depicts the transversally averaged volume fraction of solid  $\textrm {CO}_2$ ( $\phi _x$), the local thickness of the SCL along the angular direction ( $\delta _f$), and the radially averaged volume fraction of solid $\textrm {CO}_2$ ( $\phi _\theta$). Profiles of these three metrics verify the strong desublimation in the front surface area and the symmetrical SCL structure about the middle of the domain. In addition, maximum values of both $\phi _x$ and $\phi _\theta$ decrease as $\Delta T_{sub}$ increases or $\textit {Pe}$ declines, which quantify the less compact SCL (figures 9a,c). The maximum value of $\phi _\theta$ reaches 1 in cases A2 and B2 (desublimation-controlled regime) but drops to 0.56 in case A1 (diffusion-controlled regime). Again, this verifies qualitatively the dense SCL structure under the desublimation-controlled regime, and the cluster-like SCL structure under the diffusion-controlled regime. Meanwhile, values of $\delta _f$ and $\phi _\theta$ remain 0 in the back surface area in case B1 (convection-controlled regime) due to the incompletely coated cylinder surface by the SCL (figures 9a,b).
Analysis of the SCL in cases Base, A1-A2 and B1-B2 with subcooling degrees  $\Delta T_{sub}=0.05, 0.17, 0.32$ and Péclet numbers $\textit {Pe}=1.1, 11, 55$ at the termination state. (a) Transversally averaged volume fraction of solid $\textrm {CO}_2$ ( $\phi _x$). (b) Local thickness of the SCL along the angular direction ( $\delta _f$). (c) Radially averaged volume fraction of solid $\textrm {CO}_2$ ( $\phi _\theta$). The four desublimation regimes are joint-controlled (I), diffusion-controlled (II), desublimation-controlled (III) and convection-controlled (IV).

To further discuss the  $\textrm {CO}_2$ capture performance under different desublimation regimes (or cases), temporal evolutions of four metrics are recorded in figure 10, including the volume fraction of captured solid $\textrm {CO}_2$ ( $\phi _c$), the overall desublimation rate ( $m_r^*$), the capture efficiency of the injected $\textrm {CO}_2$ ( $\eta _c$), and the utilization of the cylinder surface ( $\eta _s$). Here, $\phi _c$ is calculated as the volume of captured solid $\textrm {CO}_2$ over the volume of the domain, which reflects the $\textrm {CO}_2$ capture capacity, and $\eta _c$ is determined based on the mass fluxes at the inlet and the outlet as
 \begin{equation} \eta_c= \frac{\sum_{x=0} uY - \sum_{x=l_x} uY}{\sum_{x=0} uY}. \end{equation}
The utilization of the cylinder surface is determined based on the local frost thickness  $\delta _f$ along the angular direction. As illustrated in figure 9(b), the surface area satisfying the criterion $\delta _f/l_x\geqslant 0.02$ is considered to be utilized effectively for desublimation. Thus $\eta _s$ is calculated as the ratio of the effective surface to the total surface of the cylinder. As shown in figure 10, for each simulation case, temporal evolutions of these four metrics are recorded until the termination time instant $t_e$ with $\delta _{fm}=0.048l_x$.
Analysis of  $\textrm {CO}_2$ capture performance in cases Base, A1-A2 and B1-B2 with subcooling degrees $\Delta T_{sub}=0.05, 0.17, 0.32$ and Péclet numbers $\textit {Pe}=1.1, 11, 55$. (a) The volume fraction of captured solid $\textrm {CO}_2$ ( $\phi _c$). (b) The capture efficiency of the injected $\textrm {CO}_2$ ( $\eta _c$). (c) The overall desublimation rate ( $m_r^*$). (d) The utilization of the cylinder surface ( $\eta _s$). The four desublimation regimes are joint-controlled (I), diffusion-controlled (II), desublimation-controlled (III) and convection-controlled (IV).

By comparing values of  $t_e$ among the four desublimation regimes, the diffusion-controlled regime is found to possess the fastest growth of the SCL and the earliest termination of desublimation (figure 10a). Nevertheless, this regime features the low $\textrm {CO}_2$ capture capacity and the incomplete utilization of the cylinder surface (figures 10a,d). This is attributed to the fast $\textrm {CO}_2$ desublimation rate and the cluster-like SCL structure. Then, under the convection-controlled regime, the insufficient $\textrm {CO}_2$ supply results in the slow $\textrm {CO}_2$ desublimation rate (figure 10c) and the incomplete growth of the SCL on the cylinder. Subsequently, this leads to the low $\textrm {CO}_2$ capture capacity and the incomplete utilization of the cylinder surface (figures 10a,d). The highest $\textrm {CO}_2$ capture efficiency is achieved under the convection-controlled regime (figure 10b), which, however, is due to the slow gas injection rate (or the insufficient $\textrm {CO}_2$ supply) rather than the efficient $\textrm {CO}_2$ desublimation process. After that, under the desublimation-controlled regime, the desublimation rate is weaker than the $\textrm {CO}_2$ supply. The injected $\textrm {CO}_2$ is not fully desublimated on the cylinder surface but flows out partially without phase change. Consequently, this yields the ineffective capture of the injected $\textrm {CO}_2$ (figure 10b). Finally, by comparison, the joint-controlled regime features relatively large capture capacity of $\textrm {CO}_2$, fast desublimation rate, high capture efficiency of the injected $\textrm {CO}_2$, and complete utilization of the cylinder surface. This regime is thus desirable in industrial applications. Note that the capture efficiency ( $\eta _c$) does not reach the idealized value 1 because only one cylinder is considered in this work.
The above simulations have distinguished four desublimation regimes and demonstrated that the joint-controlled regime is favourable. To identify the desublimation regime for a wide range of  $\Delta T_{sub}$ and $\textit {Pe}$, values of the four metrics ( $\phi _c$, $\eta _c$, $m_r^*$ and $\eta _s$) at the termination time instance $t_e$ are plotted in figure 11. In cases with a relatively slow injection velocity (e.g. $\textit {Pe}=1.1, 5.5$), the decrease of $\Delta T_{sub}$ results in either a slight increase of the utilization of the cylinder surface or no increase at all (figure 11d). Furthermore, these cases demonstrate the relatively small $\textrm {CO}_2$ capture capacity (figure 11a) and the highly limited $\textrm {CO}_2$ desublimation rate (figure 11c). They are thus identified as the convection-controlled regime. On the other hand, as $\textit {Pe}$ increases to a larger value (e.g. $\textit {Pe}>5.5$), effects of $\Delta T_{sub}$ on $\textrm {CO}_2$ desublimation properties become different. Explicitly, with the decrease of $\Delta T_{sub}$ at fixed $\textit {Pe}$, the $\textrm {CO}_2$ desublimation process is found to posses the higher $\textrm {CO}_2$ capture capacity (figure 11a), the smaller $\textrm {CO}_2$ capture ratio (figure 11b), and the larger utilization of the cylinder surface (figure 11d). Considering that the supplied $\textrm {CO}_2$ is almost unchanged for a given $\textit {Pe}$, the decreased desublimation rate in relation to the decreasing $\Delta T_{sub}$ (figure 11c) plays an important role in this tendency. Accordingly, the desublimation process transfers from the diffusion-controlled regime, via the joint-controlled regime, to the desublimation-controlled regime. The discussion and comparison of $\textrm {CO}_2$ desublimation properties and SCL structures finally lead to the desublimation regime distribution in the parameter space spanned by $\Delta T_{sub}$ and $\textit {Pe}$ (figure 12). The boundary lines of different regimes are identified qualitatively. Based on this regime diagram, $\textit {Pe}$ is suggested to exceed a critical value ( ${\sim }0.5$) to avoid the convection-controlled regime. Then, for a given $\textit {Pe}$ larger than the critical value, a moderate range of $\Delta T_{sub}$ can be identified for achieving the favourable joint-controlled regime. A relatively higher or lower $\Delta T_{sub}$ is not necessary due to the high cooling costs and the degraded $\textrm {CO}_2$ capture performance. In conclusion, the regime diagram can provide guidance on how to select operation conditions for an optimal desublimation process.
Analysis of  $\textrm {CO}_2$ capture performance in cases with varying subcooling degrees $\Delta T_{sub}$ and Péclet numbers $\textit {Pe}$. (a) The volume fraction of captured solid $\textrm {CO}_2$ ( $\phi _c$). (b) The capture efficiency of the injected $\textrm {CO}_2$ ( $\eta _c$). (c) The overall desublimation rate ( $m_r^*$). (d) The utilization of the cylinder surface ( $\eta _s$).

Analysis of  $\textrm {CO}_2$ capture performance in cases with varying subcooling degrees $\Delta T_{sub}$ and Péclet numbers $\textit {Pe}$. Data points of desublimation simulations plotted against $\Delta T_{sub}$ and $\textit {Pe}$. The grey dashed lines divide the plane into four desublimation regimes: joint-controlled (I), diffusion-controlled (II), desublimation-controlled (III) and convection-controlled (IV).

4.3. Three-dimensional results
In the above 2-D simulations, the cluster-style and dendritic-style SCLs are observed under the diffusion-controlled and joint-controlled regimes, respectively. These two porous SCLs may enlarge the gas–solid interface while blocking a part of the flue gas (or flow paths), thus affecting the  $\textrm {CO}_2$ desublimation process. The complexities and effects of a porous SCL are expected to be different between two and three dimensions. Therefore, to verify the accuracy of the above 2-D simulations, $\textrm {CO}_2$ desublimation needs to be investigated in three dimensions. The 3-D simulation set-up is shown in figure 1. In order to render the results comparable, simulation parameters in three dimensions are set identical to those in two dimensions. Cases A-B are simulated to reflect the $\textrm {CO}_2$ desublimation properties under the four distinct regimes, with the corresponding $\Delta T_{sub}$ and $\textit {Pe}$ values being listed in table 1. The 3-D simulation results are then compared with those in two dimensions.
The corresponding 3-D results of cases Base and A1-A2 with  $\textit {Pe}=11$ and $\Delta T_{sub}=0.05, 0.17, 0.32$ are shown in figures 13(a)–13(c). Consistent with 2-D results, three desublimation regimes are identified. To be specific, as $\Delta T_{sub}$ decreases, the desublimation process changes from diffusion-controlled, via joint-controlled, to desublimation-controlled regimes. As explained above, this tendency is driven by the fact that the $\textrm {CO}_2$ desublimation rate declines and gradually becomes weaker than the supplied $\textrm {CO}_2$ via diffusion. Despite these similar regimes, SCLs in figures 13(a)–13(c) have 3-D structures that differ from 2-D cases. To quantify effects of these 3-D structures, temporal evolutions of four metrics ( $\phi _c$, $\eta _c$, $m_r^*$, $\eta _s$) are recorded and compared with 2-D results in figure 14. As can be seen, under the desublimation-controlled regime, 3-D profiles are consistent with 2-D ones. The dense and compact structure of the SCL plays an important role in this agreement. In contrast, curves of 3-D simulations differ from those in two dimensions under the joint-controlled and diffusion-controlled regimes. Explicitly, compared with 2-D simulations, the $\textrm {CO}_2$ desublimation process in three dimensions has a better $\textrm {CO}_2$ capture performance: faster desublimation rate, higher $\textrm {CO}_2$ capture ratio, and larger utilization of the cylinder surface. Under the joint-controlled and diffusion-controlled regimes, SCLs show dendritic and cluster-like structures, respectively. Two possible factors related to these pore structures help to explain the improved $\textrm {CO}_2$ desublimation process in three compared with two dimensions. First, the dendritic and cluster-like SCLs in three dimensions provide more gas–solid interface and solid $\textrm {CO}_2$ growth directions. To be specific, 9 and 17 growth directions are applied for 2-D and 3-D simulations, respectively. Second, the porous SCL expands flow paths in three dimensions, while it blocks flow channels in two dimensions. $\textrm {CO}_2$ desublimation properties in three dimensions. Contours of solid $\textrm {CO}_2$ and zoom-in views of SCL in cases (a) Base, (b) A1, (c) A2, (d) B1 and (e) B2. The four desublimation regimes are joint-controlled (I), diffusion-controlled (II), desublimation-controlled (III) and convection-controlled (IV).

Comparison of  $\textrm {CO}_2$ desublimation properties between 2-D and 3-D simulations for cases Base and A1-A2. (a) The volume fraction of captured solid $\textrm {CO}_2$ ( $\phi _c$). (b) The capture efficiency of injected $\textrm {CO}_2$ ( $\eta _c$). (c) The overall desublimation rate ( $m_r^*$). (d) The utilization of the cylinder surface ( $\eta _s$). The three desublimation regimes are joint-controlled (I), diffusion-controlled (II) and desublimation-controlled (III).

As above, the corresponding 3-D cases B1-B2 with  $\Delta T_{sub}=0.17$ and $\textit {Pe}=1.1, 11, 55$ are simulated and compared with case Base. As shown in figures 13(a,d,e), three desublimation regimes are captured in the same vein as 2-D simulations. With the increase of $\textit {Pe}$, $\textrm {CO}_2$ desublimation properties are determined by convection-controlled, joint-controlled and desublimation-controlled regimes, respectively. Similar to 2-D simulations, the intensified convection is considered as the major contributing factor to the transformation of desublimation regimes. To quantify the inconsistency between 2-D and 3-D simulations, temporal evolutions of $\phi _c$, $\eta _c$, $m_r^*$ and $\eta _s$ are calculated. As plotted in figure 15, under the convection-controlled regime, the desublimation properties are quite similar in 2-D and 3-D simulations due to the dense SCL. Under the joint-controlled and convection-controlled regimes, however, the $\textrm {CO}_2$ desublimation process in three dimensions shows a faster desublimation rate and a better $\textrm {CO}_2$ capture performance than the process in two dimensions. Consistent with the above discussion, this difference is brought about by the dendritic and incomplete structures of the SCL.
Comparison of  $\textrm {CO}_2$ desublimation properties between 2-D and 3-D simulations for cases Base and B1-B2. (a) The volume fraction of captured solid $\textrm {CO}_2$ ( $\phi _c$). (b) The capture efficiency of injected $\textrm {CO}_2$ ( $\eta _c$). (c) The overall desublimation rate ( $m_r^*$). (d) The utilization of the cylinder surface ( $\eta _s$). The three desublimation regimes are joint-controlled (I), desublimation-controlled (III) and convection-controlled (IV).

Overall, both 2-D and 3-D simulations are able to capture the four desublimation regimes that represent different  $\textrm {CO}_2$ desublimation properties and SCL structures. From quantitative comparisons, when the SCL is dense and compact, 2-D modelling reproduces well the results obtained in 3-D simulations. When it comes to porous SCLs (i.e. cluster-like, dendritic and incomplete structures), however, 3-D results show a faster and more efficient $\textrm {CO}_2$ desublimation process than 2-D results. This is due to the fact that 3-D simulations can describe the complex SCL structures more accurately. In addition, a drawback of 3-D simulations is that the computational cost is extremely high compared to 2-D studies. For example, to record numerically the $\textrm {CO}_2$ desublimation process in case Base until the termination time instant $t_e$, a 2-D simulation takes a 1.71 h parallel computation of 384 computing cores (i.e. 656.64 core-hours of computation), while a 3-D simulation spends 41.32 h of computational time using 2048 computing cores (i.e. 84 623.36 core-hours of computation). Therefore, 2-D simulations are suitable for the extensive exploration of different desublimation regimes, while 3-D simulations are a better choice for describing complex SCL structures.
5. Conclusions
In this work, a pore-scale multiple-relaxation-time lattice Boltzmann (LB) model is proposed and validated to simulate  $\textrm {CO}_2$ desublimation during the cryogenic carbon capture (CCC) process. This novel LB model incorporates LB equations for solving the key physics behind $\textrm {CO}_2$ desublimation, including the unsteady fluid flow, species transport, conjugate heat transfer between the fluid and the solid phases, $\textrm {CO}_2$ desublimation kinetics at the gas–solid interface, and structural evolution of the solid $\textrm {CO}_2$ layer (SCL). These physical processes, and their interactions are fully accounted for. Also, with the volume of pixel scheme, the intricate structure of the SCL was depicted at the pore scale.
Based on this model, the desublimation of  $\textrm {CO}_2$ on the cooled cylinder surface is studied in both two and three dimensions with different operation conditions, namely, the gas injection velocity (Péclet number $\textit {Pe}$) and the cylinder temperature (subcooling degree $\Delta T_{sub}$). In 2-D simulations with different operation parameters, the $\textrm {CO}_2$ desublimation process shares similar characteristics: $\textrm {CO}_2$ desublimates on the cylinder surface and preferentially in the front surface area; injected $\textrm {CO}_2$ is captured to generate an SCL on the cylinder surface; and both heat and mass transfer are suppressed within the SCL. However, changes of $\textit {Pe}$ and $\Delta T_{sub}$ modify the gas diffusion rate, the gas convection rate and the $\textrm {CO}_2$ desublimation rate, which further bring about different pore structures of the SCL. Accordingly, four desublimation regimes are classified, depending on the relative strengths between the $\textrm {CO}_2$ supply (via gas diffusion and convection) and the $\textrm {CO}_2$ desublimation. On the one hand, with the decrease of $\Delta T_{sub}$, the $\textrm {CO}_2$ desublimation rate decreases and gradually becomes weaker than the $\textrm {CO}_2$ supply via diffusion. As a consequence, the desublimated SCL transforms from cluster-like, via dendritic, to dense structures, which corresponds to the diffusion-controlled, joint-controlled and desublimation-controlled regimes, respectively. On the other hand, the increasing $\textit {Pe}$ represents the stronger convection and thus enhances the mass transport and the $\textrm {CO}_2$ supply. This then yields the incomplete, dendritic and dense structures of the SCL at the pore scale, corresponding to the convection-controlled, joint-controlled and desublimation-controlled regimes, respectively. Under the four classified desublimation regimes, $\textrm {CO}_2$ capture performances are recorded and compared quantitatively. The $\textrm {CO}_2$ desublimation process under the joint-controlled regime is found to possess a relatively fast $\textrm {CO}_2$ desublimation rate, large $\textrm {CO}_2$ capture capacity and efficiency, and complete cylinder surface utilization. The joint-controlled regime is thus considered to be desirable for separating $\textrm {CO}_2$ from the flue gas. Moreover, 3-D simulations are conducted to investigate the $\textrm {CO}_2$ desublimation properties and the $\textrm {CO}_2$ capture performances, which are in the same vein as 2-D studies but at significantly higher computational costs. The analysis of quantitative metrics shows that under the desublimation-controlled regime with a dense SCL, $\textrm {CO}_2$ desublimation properties in two and three dimensions are almost the same. However, under the other regimes with cluster-like, dendritic and incomplete SCLs, the $\textrm {CO}_2$ desublimation process becomes faster and more efficient in three compared to two dimensions. The improved $\textrm {CO}_2$ desublimation performance is attributed to the more gas–solid interface and flow paths in three dimensions. To conclude, the newly proposed LB model has proven capability to capture $\textrm {CO}_2$ desublimation properties under various operating conditions. The simulation results provide new and important insights into the desublimation-based CCC process, which is an alternative and promising method for mitigating climate change.
As the first pore-scale study of  $\textrm {CO}_2$ desublimation using the LB method, this work focuses on investigating the $\textrm {CO}_2$ desublimation properties on a single packing cylinder. In practical applications, however, a cryogenic packed bed usually consists of multiple packing cylinders, with potential interferences between them. The multiple cylinders are expected to influence the desublimation process. For example, the multiple cylinders may affect the temperature distribution because the thermophysical parameters between the gas and the solid phases are different. The cylinders may also modify the flow channels and subsequently affect the gas flow. These changes in temperature and flow distributions will influence the $\textrm {CO}_2$ desublimation properties and also the parameter ranges for different desublimation regimes. Also, some narrow channels may be blocked by the accumulated SCL, hence causing operational risks. Therefore, it is necessary to investigate effects of the packed bed design, including the size, number, material and geometrical position of packing cylinders, in a follow-on study.
Supplementary material
Supplementary material is available at https://doi.org/10.1017/jfm.2023.227.
Funding
This work was supported by the UK Engineering and Physical Sciences Research Council under the grant nos EP/T015233/1 and EP/W026260/1, as well as by King Abdullah University of Science and Technology (KAUST). The supercomputing time was provided by the UK Consortium on Mesoscale Engineering Sciences (UKCOMES) (EPSRC grant nos EP/R029598/1 and EP/X035875/1). This work made use of computational support by CoSeC, the Computational Science Centre for Research Communities, through UKCOMES.
Declaration of interests
The authors report no conflict of interest.
Appendix A. Transformation details in the MRT model
In the proposed D2Q9 and D3Q15 LB models for simulating  $\textrm {CO}_2$ desublimation, the corresponding discrete velocities $\boldsymbol {e}_i$ and the weight coefficients $w_i$ are set as (Guo & Shu Reference Guo and Shu2013)
 \begin{gather} \text{D2Q9,} \quad \boldsymbol{e}_i=e \left[ \begin{array}{ccccccccc} 0 & 1 & 0 & -1 & 0 & 1 & -1 & -1 & 1 \\ 0 & 0 & 1 & 0 & -1 & 1 & 1 & -1 & -1 \end{array} \right], \end{gather}
 \begin{gather}\text{D3Q15,} \quad \boldsymbol{e}_i =e \left[ \begin{array}{ccccccccccccccc} 0 & 1 & -1 & 0 & 0 & 0 & 0 & 1 & -1 & 1 & -1 & 1 & -1 & -1 & 1 \\ 0 & 0 & 0 & 1 & -1 & 0 & 0 & 1 & -1 & 1 & -1 & -1 & 1 & 1 & -1 \\ 0 & 0 & 0 & 0 & 0 & 1 & -1 & 1 & -1 & -1 & 1 & 1 & -1 & 1 & -1 \end{array} \right], \end{gather}
 \begin{gather}\text{D2Q9,} \quad w_i=\begin{cases} 4/9, & i=0, \\ 1/9, & i=1\unicode{x2013}4, \\ 1/36, & i=5\unicode{x2013}8, \end{cases} \qquad \text{D3Q15,} \quad w_i =\begin{cases} 2/9, & i=0,\\ 1/9, & i=1\unicode{x2013}6,\\ 1/72, & i=7\unicode{x2013}14. \end{cases} \end{gather}
Also, values of the transformation matrix  $\boldsymbol{\mathsf{M}}$ in D2Q9 and D3Q15 LB models are (Guo & Shu Reference Guo and Shu2013)
 \begin{gather} \text{D2Q9,} \quad \boldsymbol{\mathsf{M}}= \left[ \begin{array}{ccccccccc} 1 & 1 & 1 & 1 & 1 & 1 & 1 & 1 & 1 \\ -4 & -1 & -1 & -1 & -1 & 2 & 2 & 2 & 2 \\ 4 & -2 & -2 & -2 & -2 & 1 & 1 & 1 & 1 \\ 0 & 1 & 0 & -1 & 0 & 1 & -1 & -1 & 1 \\ 0 & -2 & 0 & 2 & 0 & 1 & -1 & -1 & 1 \\ 0 & 0 & 1 & 0 & -1 & 1 & 1 & -1 & -1 \\ 0 & 0 & -2 & 0 & 2 & 1 & 1 & -1 & -1 \\ 0 & 1 & -1 & 1 & -1 & 0 & 0 & 0 & 0 \\ 0 & 0 & 0 & 0 & 0 & 1 & -1 & 1 & -1 \\ \end{array} \right], \end{gather}
 \begin{gather} \text{D3Q15,} \quad \boldsymbol{\mathsf{M}}= \left[ \begin{array}{ccccccccccccccc} 1 & 1 & 1 & 1 & 1 & 1 & 1 & 1 & 1 & 1 & 1 & 1 & 1 & 1 & 1 \\ -2 & -1 & -1 & -1 & -1 & -1 & -1 & 1 & 1 & 1 & 1 & 1 & 1 & 1 & 1 \\ 16 & -4 & -4 & -4 & -4 & -4 & -4 & 1 & 1 & 1 & 1 & 1 & 1 & 1 & 1 \\ 0 & 1 & -1 & 0 & 0 & 0 & 0 & 1 & -1 & 1 & -1 & 1 & -1 & 1 & -1 \\ 0 & -4 & 4 & 0 & 0 & 0 & 0 & 1 & -1 & 1 & -1 & 1 & -1 & 1 & -1 \\ 0 & 0 & 0 & 1 & -1 & 0 & 0 & 1 & 1 & -1 & -1 & 1 & 1 & -1 & -1 \\ 0 & 0 & 0 & -4 & 4 & 0 & 0 & 1 & 1 & -1 & -1 & 1 & 1 & -1 & -1 \\ 0 & 0 & 0 & 0 & 0 & 1 & -1 & 1 & 1 & 1 & 1 & -1 & -1 & -1 & -1 \\ 0 & 0 & 0 & 0 & 0 & -4 & 4 & 1 & 1 & 1 & 1 & -1 & -1 & -1 & -1 \\ 0 & 2 & 2 & -1 & -1 & -1 & -1 & 0 & 0 & 0 & 0 & 0 & 0 & 0 & 0 \\ 0 & 0 & 0 & 1 & 1 & -1 & -1 & 0 & 0 & 0 & 0 & 0 & 0 & 0 & 0 \\ 0 & 0 & 0 & 0 & 0 & 0 & 0 & 1 & -1 & -1 & 1 & 1 & -1 & -1 & 1 \\ 0 & 0 & 0 & 0 & 0 & 0 & 0 & 1 & 1 & -1 & -1 & -1 & -1 & 1 & 1 \\ 0 & 0 & 0 & 0 & 0 & 0 & 0 & 1 & -1 & 1 & -1 & -1 & 1 & -1 & 1 \\ 0 & 0 & 0 & 0 & 0 & 0 & 0 & 1 & -1 & -1 & 1 & -1 & 1 & 1 & -1 \\ \end{array} \right]. \end{gather}
 The transformation matrix  $\boldsymbol{\mathsf{M}}$ maps the distribution functions from the physical space $\boldsymbol {\psi }$ to the moment space as $\hat {\boldsymbol {\psi }} = \boldsymbol{\mathsf{M}} \boldsymbol {\cdot } \boldsymbol {\psi }$. With this transformation, the evolution equations (3.3)–(3.5) are implemented in the moment space as
 \begin{gather} \hat{\boldsymbol{f}}\left( \boldsymbol{x} + \boldsymbol{e}_i \delta _t, t + \delta _t \right) = \hat{\boldsymbol{f}} \left(\boldsymbol{x}, t\right) - \boldsymbol{\mathsf{S}}\left[ \hat{\boldsymbol{f}} \left( \boldsymbol{x}, t \right) - \hat{\boldsymbol{f}}^{eq} \left( \boldsymbol{x}, t \right) \right], \end{gather}
 \begin{gather}\hat{\boldsymbol{g}} \left( \boldsymbol{x} + \boldsymbol{e}_i \delta _t, t + \delta _t \right) = \hat{\boldsymbol{g}} \left(\boldsymbol{x}, t \right) - \boldsymbol{\mathsf{S}}_y \left[ \hat{\boldsymbol{g}} \left( \boldsymbol{x}, t \right) - \hat{\boldsymbol{g}}^{eq} \left( \boldsymbol{x}, t \right) \right], \end{gather}
 \begin{gather}\hat{\boldsymbol{h}} \left( \boldsymbol{x} + \boldsymbol{e}_i \delta _t, t + \delta _t \right) = \hat{\boldsymbol{h}} \left(\boldsymbol{x}, t \right) - \boldsymbol{\mathsf{S}}_t \left[ \hat{\boldsymbol{h}} \left( \boldsymbol{x}, t \right) - \hat{\boldsymbol{h}}^{eq} \left( \boldsymbol{x}, t \right) \right] + \delta _t \hat{\boldsymbol{F}}_{T} + 0.5\delta _t^ 2\partial_t \hat{\boldsymbol{F}}_{T}. \end{gather}
 Through the Chapman–Enskog analysis on the proposed LB equations, the governing equations can be recovered with relaxation times  $\tau$, $\tau _y$ and $\tau _t$ as
 \begin{equation} \nu = c_s^2( \tau - 0.5 ) \delta _t, \quad D = c_s^2 (\tau_y- 0.5 )\delta _t, \quad \alpha = c_s^2 (\tau_t - 0.5 )\delta _t, \end{equation}
as well as the gradient terms of temperature ( $\boldsymbol {\nabla } T$) as (Lei, Meng & Guo Reference Lei, Meng and Guo2017; Lei et al. Reference Lei, Wang and Luo2021)
 \begin{equation} \boldsymbol{\nabla}_x T ={-}\frac{\hat{h}_3 - Tu + 0.5\delta_t F_{T} u}{c_s^2\tau_t\delta_t}, \quad \boldsymbol{\nabla}_y T ={-}\frac{\hat{h}_5 - Tv + 0.5\delta_t F_{T}v}{c_s^2\tau_t\delta_t}. \end{equation}
Except for these calculations, the other gradient term in (3.2a–c) is determined using the isotropic central scheme as (Guo, Zheng & Shi Reference Guo, Zheng and Shi2011)
 \begin{equation} \boldsymbol{\nabla} ( \rho c_p ) = \sum_i \frac{w_i \boldsymbol{e}_i \rho c_p \left( \boldsymbol{x} + \boldsymbol{e}_i \delta _t \right)}{c_s^2 \delta_t}. \end{equation}
Appendix B. Sensitivity tests of desublimation probability ratio $R_{dp}$

In the present model, the ratio of the desublimation probability between the nearest and the diagonal grid nodes ( $R_{dp}$) affects the intricate structure of the SCL at the pore scale. In order to test the sensitivity of $\textrm {CO}_2$ desublimation properties to the selection of $R_{dp}$, simulations with different values of $R_{dp}$ are performed and compared. Considering the distance between two grid nodes, the desublimation probability in the nearest-grid direction should be larger than or equal to that in the diagonal-grid direction. Therefore, four values of $R_{dp}$ are considered in 2-D simulations: $R_{dp}=1:0.25, 1:0.50, 1:0.75, 1:1$. After simulations and comparisons under varying operation conditions (i.e. subcooling degree $\Delta T_{sub}$ and Péclet number $\textit {Pe}$), the $\textrm {CO}_2$ desublimation process at each given $R_{dp}$ is found to show the same desublimation properties as discussed in § 4.
As an example, figures 16 and 17 provide the simulated SCL structures and the  $\textrm {CO}_2$ desublimation properties, including the captured solid $\textrm {CO}_2$ ( $\phi _c$), the overall desublimation rate ( $m_r^*$), the capture efficiency of the injected $\textrm {CO}_2$ ( $\eta _c$), and the utilization of the cylinder surface ( $\eta _s$). Consistent with cases at $R_{dp}=1:0.25$ in § 4, four desublimation regimes are classified. As $\Delta T_{sub}$ decreases from case A1 via Base to A2, SCL becomes dense and the desublimation process changes from diffusion-controlled, via joint-controlled, to desublimation-controlled regimes. In the meantime, with the increase of $\textit {Pe}$ from case B1 via Base to B2, fluid convection becomes intensified and the system transfers from convection-controlled, via joint-controlled, to desublimation-controlled regimes.
Sensitivity tests of  $R_{dp}$. Zoom-in views of SCL in cases (a) Base, (b) A1, (c) A2, (d) B1 and (e) B2, with the desublimation probability ratio $R_{dp}=1:1$. The four desublimation regimes are joint-controlled (I), diffusion-controlled (II), desublimation-controlled (III) and convection-controlled (IV).

Sensitivity tests of  $R_{dp}$. Temporal evolutions of (a) the volume fraction of captured solid $\textrm {CO}_2$ ( $\phi _c$), (b) the capture efficiency of injected $\textrm {CO}_2$ ( $\eta _c$), (c) the overall desublimation rate ( $m_r^*$) and (d) the utilization of cylinder surface ( $\eta _s$) in cases Base, A1-A2 and B1-B2, with the desublimation probability ratio $R_{dp}=1:1$. The four desublimation regimes are joint-controlled (I), diffusion-controlled (II), desublimation-controlled (III) and convection-controlled (IV).

To further quantify the sensitivity of  $\textrm {CO}_2$ desublimation properties to $R_{dp}$, temporal evolutions of the four desublimation metrics (i.e. $\phi _c$, $m_r^*$, $\eta _c$ and $\eta _s$) are compared for case Base at $R_{dp}=1:0.25, 1:0.50, 1:0.75, 1:1$. As displayed in figure 18, with the decrease of $R_{dp}$, values of the captured $\textrm {CO}_2$ ( $\phi _c$, $\eta _c$), the desublimation rate ( $m_r^*$) and the cylinder utilization ( $\eta _s$) increase slightly, hence the improved $\textrm {CO}_2$ capture performance. However, such an improvement is insignificant, and curves for $R_{dp}=1:0.50, 1:0.75, 1:1$ are in good agreement with those for $R_{dp}=1:0.25$.
Sensitivity tests of  $R_{dp}$. Temporal evolutions of (a) the volume fraction of captured solid $\textrm {CO}_2$ ( $\phi _c$), (b) the capture efficiency of injected $\textrm {CO}_2$ ( $\eta _c$), (c) the overall desublimation rate ( $m_r^*$) and (d) the utilization of cylinder surface ( $\eta _s$) in case Base, with four desublimation probability ratios $R_{dp}=1:0.25, 1:0.50,1:0.75, 1:1$. The desublimation regime I is the joint-controlled regime.

In general, similar desublimation regimes and  $\textrm {CO}_2$ desublimation properties can be produced at each given $R_{dp}$. Meanwhile, under a certain operation condition, the simulated $\textrm {CO}_2$ desublimation properties at different values of $R_{dp}$ match well with each other. Therefore, the reliability of the present findings at the selected $R_{dp}$ has been verified.
Appendix C. Model validation
To validate the proposed MRT LB model, simulations of two cases are carried out in this appendix. The first case focuses on the desublimation of  $\textrm {CO}_2$ over a single packing grain immersed in the quiescent flue gas. The modelled thickness of desublimated $\textrm {CO}_2$ on the packing surface is recorded versus time, which is then compared with results from the GERAs algorithm (ode15s library function of MATLAB 2009b software; Debnath et al. Reference Debnath, Mukherjee, Mullick, Ghoshdastidar, Ganguly and Kargupta2019). The second case is conducted to study $\textrm {CO}_2$ desublimation in a cryogenic packed bed, with the flue gas flow being considered. Temporal evolutions of the outgoing $\textrm {CO}_2$ content are simulated and compared with experimental measurements (Ali et al. Reference Ali, Maqsood, Syahera, Shariff and Ganguly2014). By performing these two cases, the reliability of the present LB model for simulating $\textrm {CO}_2$ desublimation on the cooled surface can be verified.
C.1. $\textrm {CO}_2$ desublimation over a single packing

The desublimation of  $\textrm {CO}_2$ on the surface of a single packing grain is first simulated to test the capability of the proposed LB model. As displayed in figure 19(a), the computational domain is $0\leqslant x \leqslant l_x$ and $0\leqslant x\leqslant l_y$. A solid packing grain is fixed in the centre of the domain, and the remaining void space is filled with flue gas. The four boundaries of the domain are set as periodic. In order to produce results comparable to those by Debnath et al. (Reference Debnath, Mukherjee, Mullick, Ghoshdastidar, Ganguly and Kargupta2019), the same simulation parameters are set: diameter of the packing grain is $l_d=0.01\ \textrm {m}$, porosity is 0.637, initial flue gas temperature is $T_0=303 \textrm {K}$, initial packing temperature is $T_w=155\ \textrm {K}$, $\textrm {CO}_2$ mass fraction is $Y_0=1$, and gas pressure is $p_0=3\ \textrm {atm}$. The thermophysical properties of the gas and solid phases are set as in § 4. Once the flue gas encounters the cooled packing, $\textrm {CO}_2$ desublimates to generate an SCL on the packing surface. Here, the flue gas is assumed to be quiescent, which depicts the growth of the SCL for a large exposure time of the flue gas with the packing grain (Debnath et al. Reference Debnath, Mukherjee, Mullick, Ghoshdastidar, Ganguly and Kargupta2019). In this case, a mesh of size $640\times 640$ is used.
Validation case of  $\textrm {CO}_2$ desublimation over a single packing immersed in the quiescent flue gas. (a) Computational domain and boundary conditions. (b) Comparing temporal evolutions of SCL thickness between the present LB simulations and simulations in Debnath et al. (Reference Debnath, Mukherjee, Mullick, Ghoshdastidar, Ganguly and Kargupta2019).

The calculated thickness of the SCL is recorded versus time and plotted in figure 19(b), where the numerical data reported by Debnath et al. (Reference Debnath, Mukherjee, Mullick, Ghoshdastidar, Ganguly and Kargupta2019) are included for comparison. As can be seen, our simulation results agree well with those from Debnath et al. (Reference Debnath, Mukherjee, Mullick, Ghoshdastidar, Ganguly and Kargupta2019), indicating the reliability of our developed LB model in simulating  $\textrm {CO}_2$ desublimation.
C.2. $\textrm {CO}_2$ desublimation in a cryogenic packed bed

The present MRT LB model has been shown to be capable of tracking dynamically the growth of the SCL on the cooled surface of a packing grain. Nevertheless, the gas feed flow and the multiple packing grains were not considered. To fill this gap, this subsection further introduces a cryogenic bed as shown in figure 20(a), which is packed with multiple grains and fed with a flue gas flow from the left inlet. Based on such a system,  $\textrm {CO}_2$ desublimation is simulated and compared with experiments by Ali et al. (Reference Ali, Maqsood, Syahera, Shariff and Ganguly2014) to examine the reliability of the present MRT LB model. In this case, the computational domain is $0\leqslant x \leqslant l_x$ and $0\leqslant x\leqslant l_y$. From the left inlet, the flue gas is injected into the domain at the initial condition $(T_0, Y_0, u_0, p_0)$. The injected $\textrm {CO}_2$ deposits on the surface of cooled packing grains. Once the bed reaches saturation, the injected $\textrm {CO}_2$ leaves the domain from the right outlet without phase change. The outgoing $\textrm {CO}_2$ content at the outlet has been measured and compared with experimental data (Ali et al. Reference Ali, Maqsood, Syahera, Shariff and Ganguly2014).
Validation case of  $\textrm {CO}_2$ desublimation in a cryogenic packed with flue gas feed flow. (a) Computational domain and boundary conditions. (b) Comparison of the outgoing $\textrm {CO}_2$ content between the present LB results and experimental measurements in Ali et al. (Reference Ali, Maqsood, Syahera, Shariff and Ganguly2014).

We simulate the case based on the countercurrent flow configuration in § 3.1 of Ali et al. (Reference Ali, Maqsood, Syahera, Shariff and Ganguly2014), for which the same desublimation conditions and parameters are selected. To be specific, bed size is  $l_x=0.46\ \textrm {m}$ and $l_y=0.0418\ \textrm {m}$, porosity is 0.637, inlet flue gas temperature is $T_0=293\ \textrm {K}$, inlet $\textrm {CO}_2$ mass fraction is $Y_0=1$, and gas pressure is $p_0=1\ \textrm {atm}$. The initial bed temperature $T_w$ decreases from the inlet to the outlet. The thermophysical properties of the gas and solid phases are set as in our simulations in § 4. A mesh of size $640\times 7040$ is utilized here.
Under this simulation set-up, the calculated  $\textrm {CO}_2$ mass fraction at the outlet is depicted versus time in figure 20(b), along with the experimental data by Ali et al. (Reference Ali, Maqsood, Syahera, Shariff and Ganguly2014) for comparison. This shows that at first, the injected $\textrm {CO}_2$ is fully captured by packing grains and the outgoing $\textrm {CO}_2$ content remains zero. After this $\textrm {CO}_2$ capture period, the bed gradually becomes saturated with solid $\textrm {CO}_2$, and the breakthrough of the injected $\textrm {CO}_2$ is observed at the outlet. Subsequently, the value of outgoing $\textrm {CO}_2$ content increases rapidly and finally reaches the feed composition. This trend matches well with the experimental data. Thus the present LB model is accurate for simulating $\textrm {CO}_2$ desublimation on the cooled surface during the cryogenic $\textrm {CO}_2$ capture.
Appendix D. Grid convergence tests
We perform grid-independence simulations of  $\textrm {CO}_2$ desublimation on a cooled cylinder surface. Three different grids ( $384\times 384$, $640\times 640$, $1024\times 1024$) are tested. As an illustration, simulation results in case Base (see table 1) are provided and discussed. The calculated contours of $\textrm {CO}_2$ mass fraction, temperature, solid $\textrm {CO}_2$ and zoom-in views at the time instant $55.8\ \textrm {s}$ are provided in figure 21. All these contours under different grid resolutions show similar desublimation properties. That is, the SCL grows on the packing surface, the strong desublimation takes place in the front surface area, the injected $\textrm {CO}_2$ is effectively captured by the packing grain, and the SCL suppresses heat and mass transfer within it. On the other hand, inconsistencies between three tests are observed: the coarse grid ( $384\times 384$) fails to describe the intricate structure of the SCL at the pore scale. Specifically, the dendritic structure is captured by grids $640\times 640$ and $1024\times 1024$, while the SCL consists of large bumps but not distinct branches under the $384\times 384$ coarse grid.
Grid convergence test. Contours of solid  $\textrm {CO}_2$, temperature ( $T$) and $\textrm {CO}_2$ mass fraction ( $Y$) at $t=55.8\ \textrm {s}$ in case Base with three grid resolutions: (a) $384\times 384$, (b) $640\times 640$ and (c) $1024\times 1024$. Zoom-in views of the SCL in highlighted grey rectangles are provided.

After the above qualitative observations, temporal evolutions of four metrics are compared quantitatively in figure 22. That includes the volume fraction of the captured solid  $\textrm {CO}_2$ ( $\phi _c$), the overall desublimation rate ( $m_r^*$), the capture efficiency of the injected $\textrm {CO}_2$ ( $\eta _c$), and the utilization of the cylinder surface ( $\eta _s$). Profiles of these four metrics demonstrate similar tendencies. In addition, results by grids $640\times 640$ and $1024\times 1024$ match well with each other but show slight discrepancies from those by the $384\times 384$ coarse grid. That is, the $384\times 384$ grid leads to the faster desublimation process and the slightly over-predicted $\textrm {CO}_2$ capture performance. These comparisons suggest that the grid of size $640\times 640$ is fine enough to obtain grid-independent results. Thus simulations in this work are conducted with the $640\times 640$ grid.
Grid convergence test. Temporal evolutions of (a) the volume fraction of captured solid  $\textrm {CO}_2$ ( $\phi _c$), (b) the capture efficiency of injected $\textrm {CO}_2$ ( $\eta _c$), (c) the overall desublimation rate ( $m_r^*$) and (d) the utilization of cylinder surface ( $\eta _s$), in case Base with three grid resolutions.


 Open access