

I. INTRODUCTION
Along with the development of digital imaging technology, a number of display types have emerged, while offering a variety of viewing environments and accommodating users to enjoy a versatile user experience (UX). With the rapid development of these new technologies, people have easily acquired or even edited contents with imaging devices such as digital cameras, smartphones, multi-cameras, and 3D modeling tools. In addition, the contents can be easily visualized in real life through various devices of 2D display, stereoscopic 3D (S3D) display and head-mounted display (HMD) [Reference Brunnström1], which even enables users to interact with new spaces and objects. Above all, the development of social networks and mobile devices makes sharing of imaged information even more massive than before. For this reason, the quality of experience (QoE) that people perceive in each display has become much more diverse and personalized than before, while being adaptive to different service scenarios. Thereby, the study of predicting and evaluating this has been actively carried out not only for engineering inquiry but also for understanding the consumer-centered market and trend.
In [Reference Brunnström1,Reference Laghari and Connelly2], QoE is defined as “a measure of the overall level of customer satisfaction with a vendor”. Understanding this definition intuitively, QoE may seem to be similarly categorized as an extended version of quality of service. However, it does not just mean visual quality delivered over network, but needs to be described with additional perspectives over new domains. Currently, QoE is abstractly stated in literature while including a different level of emotional experience for humans. Naturally, the interpretation as a form of numerical formula is also different so that many metrics, feature values, and subjective evaluations have been published in various research fields. Nevertheless, the QoE paradigm can be widely applied to all consumer-related content business or spell out services from both sides of service provider and customer. Indeed, user satisfaction is directly linked to corporate profits so that QoE leads to gain momentum as an important criterion not only in multimedia services and systems but also in other areas including content design, human–computer interaction, and aesthetics. This trend is also related to the rapidly increasing demand and market size in the UX sector, which has recently exploited multi-dimensional visualization [Reference Brunnström1]. With the opposite pay for it, the analysis of human perception and content is becoming a more complicated problem, and for this reason, the emergence of new displays or platforms that provide more versatile UX requires more sophisticated and novel quality assessment techniques.
QoE can be quantified by various methods depending on the type of signal to be processed. In this paper, we use a generic QoE measurement process depicted in Fig. 1. As shown in the figure, traditionally, the QoE assessment can be divided into two categories. One is subjective assessment and the other is objective assessment. The former expresses feedback on the most accurate QoE of a user who has experienced digitized contents through the device, and this method has been regarded as the most reliable one among all possible means currently. So far, numerous methodologies have been proposed to perform the subjective assessment of various QoEs [Reference Union3,4]. The double-stimulus continuous quality scale (DSCQS) measures the difference in QoE of a target content and that of the reference content. Then, the differential mean opinion score (DMOS) can be obtained from the statistical scores of all subjects performed therefrom. However, as one of the drawbacks, this method needs two stimuli simultaneously to the user. If no reference content is available (e.g., visual discomfort), it is difficult to employ DSCQS. For this reason, the single-stimulus continuous quality evaluation (SSCQE) has been widely used to overcome such drawbacks. Nevertheless, SSCQE has a disadvantage in that it causes the user to be fatigued and to spend a lot of time in the evaluation process of the massive contents.
Framework of subjective and objective evaluation for QoE.
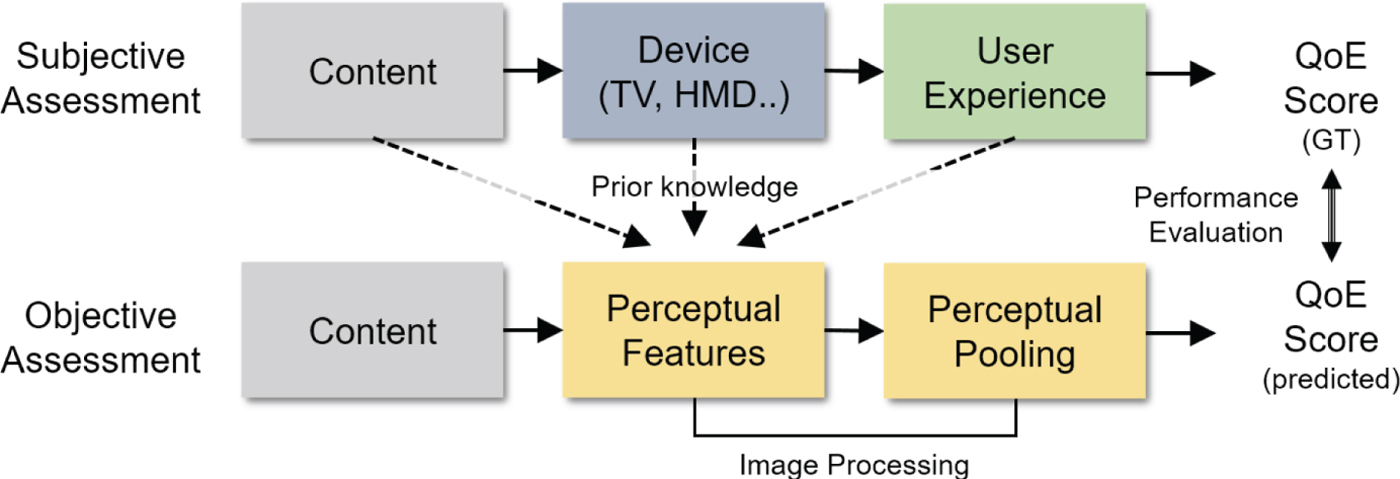
Therefore, most studies have focused on the objective assessment of QoE mentioned in the latter. Unlike the subjective assessment, this predicts the QoE score through feature extraction and regression via image processing of the content information. The main flow of objective assessment lies in analyzing the behavior of the human visual system (HVS) as a function. It then uses the output values of the function as prior knowledge to extract perceptual features from the content, and maps these features to a single score through the pooling process. As mentioned above, it is not easy to design an accurate prediction model because the perceptual features are obtained based on different prior knowledge depending on the types of display and content. In addition, since the user performs QoE evaluation non-linearly according to the content, it is essential to predict the appropriate HVS-related prior knowledge in conjunction with the prediction task. In fact, since there are limitations in studying the HVS biologically and psychologically as a closed form of the prior knowledge, researchers lean on reverse engineering. Thus, researchers have rigorously measured the response of human visual perception to the contents available on the individual display and to their device characteristics.
Table 1 tabulates the available content types and recent QoE tasks conducted over the display devices covered in this paper. In the table, the circle mark indicates the available content type for each display, and which QoE task can be applied to. For measurement of experience on 2D display, image quality assessment (IQA) and video quality assessment (VQA) have been actively pursued to solve the deterioration of visual quality with the development of compression or transmission technology in order to provide a higher QoE environment. To achieve this, many researchers have attempted to verify the out-performance of their metrics by demonstrating that the errors obtained by using their metrics are highly correlated with human perception errors. For example, in the IQA task, the structural similarity (SSIM) [Reference Wang5] is formulated. Associated with the human perception on the spatial information, its value implies a correlation with the phenomenon through the divisive normalization process in the receptive field.
Comparison of the available content types for each display device with related QoE tasks.

For various QoEs, the image quality evaluation has been diversely evolved depending on the application such as the sharpness of object or contour relative to the background from various visual perspectives. Thus, recently, contrast IQA and sharpness IQA [Reference Gu6,Reference Kim7] have been developed for the visual preference for post-processing reflecting the aesthetic view of the image. In addition, visual saliency detection, which is to find the local area of the content visually concentrated by user has also been widely used as a factor for predicting the target QoE more accurately [Reference Kim8–Reference Nguyen11]. In addition, foveation, which has been dealt with as a prominent visual property due to uneven distribution of photoreceptors on the retina, has also been extensively studied in QoE [Reference Lee12,Reference Lee13]. At the same time, viewing geometry analysis, which estimates the perceived resolution in consideration of user's viewing distance, display resolution, and resolution of human vision, has also been utilized in many fields.
Nowadays, the service is gradually evolving into an interactive form through being customized toward satisfying the personal need, and into realizing the stereoscopic effect in order to maximize the presence feeling. In keeping with this trend, S3D display enables to provide a virtual 3D experience using stereoscopic image/video (left/right paired content) to maximize the 2D display experience. Since this is still based on 2D images, numerous I/VQA studies have been performed similarly to what has been done before [Reference Oh14]. However, the S3D display causes discomfort due to the vergence-accommodation mismatch of human vision, and thereby visual discomfort prediction (VDP) studies have been actively investigated. As a result, the binocular fusion principle was used to produce a synthesized cognitive image called cyclopean image [Reference Oh15–Reference Park18]. For this research, modeling has been performed from various angles to analyze stereoscopic recognition of human brain processes [Reference Park19].
Recently, virtual reality (VR) or augmented reality (AR) using HMD has been actively studied. There are two main types of HMDs. One is a 360-degree VR content type that allows viewing 360-degree panorama image/video w.r.t. the original point. The other is a computer graphic (CG)-based VR content type that experiences a three-dimensional space defined in the 3D modeling platform using Unity or Unreal engine. For 360-degree VR, the tasks of I/VQA are actively performed because they are closely relevant to the topics done for 2D I/VQA in nature. However, in the CG-based VR content, VR sickness caused by VR experience hinders the viewing, and acts as an obstacle to market activation. Therefore, studies on VR sickness assessment (VRSA) have been actively conducted to solve this problem while reflecting the visual-vestibular sensory conflict [Reference Kim20,Reference Kim21].
Overall, in this paper, we focus on overviewing trends in the QoE from the viewpoint of display technology, and on discussing the details of individual tasks. There have been a small number of QoE-related review papers in the past, but there has been a lack of research to various other QoEs in a holistic way according to display type [Reference Brunnström1,Reference Liu22,Reference Chikkerur23]. The remainder of this paper is organized as follows. Section II introduces an overview of QoE assessment for general QoE tasks. Then, after reviewing the QoE assessment on image/video content including I/VQA and the visual preference assessment in Section III, we describe the QoE assessment on 3D stereoscopic content including visual discomfort and image/video quality in Section IV. Then, Section V discusses the QoE assessment on HMD device dealing with VRSA and 360-degree VR content I/VQA. In addition, the future trends of QoE and the conclusion are presented in Sections VI and VII, respectively.
II. OVERVIEW OF QOE ASSESSMENT
A) Subjective methodology
It is common sense that the most reliable method for measuring QoE is subjective assessment conducted by human subjects. Traditionally, subjective assessment is conducted in several forms such as explorative research, psychophysical scaling, or questionnaire to gather focus group opinions from subjects after showing them test sequences [Reference Union3]. The methods referred in international recommendation such as DSCQS and SSCQE have been widely employed in the QoE field [Reference Union3,24,Reference Lambooij25]. In recent years, more dynamic contents have been produced by adding additional depth domain, i.e., 3D. In order to capture such dynamics of psychophysical features during watching 3D video, it is necessary to develop more interactive subjective method. For this, the multimodal interactive continuous scoring of quality (MICSQ) method was presented to acquire more reliable quality scores by maximizing convenience of the user scoring process in the middle of entertaining contents, which can be used even in a dark room [Reference Kim26]. Therefore, it is important to choose an appropriate method subjective to the purpose of assessment and to adequate constraints of contents. Details of each method are as follows
1) DSCQS
In the DSCQS method, a pair of reference and assessment contents are successively displayed to the subject in random order. At the end of each second viewing sequence, the subject assessment process is carried out in continuous quality scale between bad to excellent followed by calculating the difference of scores being obtained after watching the reference and assessment contents. In many cases, the score gap is larger when there is significant distinction in time or space domain. Finally, DMOS is obtained by averaging differential scores from all subjects. A less value of DMOS indicates that the subjective score of the test content is near to that of the reference content, so the test content has good quality as close as the reference content. The most significant advantage of DSCQS is robustness to context effect, since DSCQS is a reference content-aware method, i.e., viewers always watch a pair of contents. However, this implies that DSCQS cannot be applied to no-reference (NR) I/VQA where reference contents do not exist. Therefore, DSCQS is suitable for full-reference (FR) where both target and reference contents exist together [Reference Park27].
2) SSCQE
In contrast to DSCQS, SSCQE is devised to conduct the time-efficient and referenceless subjective assessment for general viewing environments. In this protocol, the subject experiences the long sequence at a time, and evaluates it by the continuous quality scale in real-time. The subjective score is recorded by using a device such as slider or fader. Also, the subject can monitor the scored values for more reliable testing. Especially, while most subjective assessment methods provide only one quality rating for a single content, SSCQE can produce a temporal scoring output. However, as the side effect, there are still issues about accuracy. Since the subject experiences only target content, the contextual effect can be reflected to the scoring judgment. Thereby, there is a possibility that the annotated score can be drifted according to the test sequence due to the user dependency. Moreover, this drawback becomes much worse when the target QoE gets a severe impact on the local region over the temporal domain [Reference Park27].
3) MICSQ
MICSQ is a more user-friendly way compared to SSCQE [Reference Kim26]. The motivation of MICSQ is a separation of viewing experience from assessment by involving hearing and touching in addition to seeing. Toward this, an additional interaction is employed to minimize distraction from visual immersion. In the cases of SSCQE and DSCQS, no suggestions are given on how the assessment interface is presented on the screen. However, MICSQ utilizes a sub-display such as tablet, to separate the assessment view from the content view, which allows viewers to focus on watching contents while continuously carrying out the assessment process. This helps the subject to score more reliably by providing an environment that they can fully concentrate on visual cues. During the subjective testing, a haptic cue (periodic vibration) and an auditory cue (beeping) are utilized together to prevent the subject from losing sight of core values being recorded, and to enhance the credibility of assessment results. Nevertheless, there is still weakness. The existence of delay and reaction speed variance between subjects may degrade accuracy. This method is intrinsically designed to find specific sections where intense drift of quality, discomfort, or presence exists, so it shows strength in measuring the response of human perception in face with irregularity of stimuli triggered by immersive contents.
B) Objective methodology
The objective QoE assessment is broadly divided into three evaluation manners according to the availability of the reference information: FR, reduced-reference (RR) and NR. FR metrics are generally designed to measure the distance from a target image to the reference image such as mean-squared error (MSE) or peak-signal-to-ratio (PSNR). When the pristine unimpaired stimulus is given, the information of the reference is fully utilized, and the prediction performance is generally higher than the others. The RR approach is applicable to scenarios for image/video communication or transmission. This evaluates QoE by relying on incomplete reference information (e.g., visual feature information) for a given target content. The NR assessment remains the only scheme to be used for the general-purpose application when there exists no reference content. Commercially, this case is the most prevailing case. The NR assessment has been designed by formulating a QoE metric, or by developing an evaluation model from data-driven perspective.
In general, to verify the performance of QoE assessment, researchers have followed three standard measures, i.e., Pearson's linear correlation coefficient (PLCC), Spearman's rank order correlation coefficient (SROCC), and Kendall's rank order correlation coefficient (KROCC) by following the recommendation from the video quality experts group [28]. PLCC is obtained by

where o i and $\bar {o}$ are the ith subjective score and the mean of o i. q i and $\bar {q}$
 are the ith predicted score and the mean of q i.
SROCC is a method of measuring the correlation between two variables by the non-parametric method:

where d i is the difference between the subjective and predicted scores for the ith image rank, and k is the image index of the testing set. From equation (2), SROCC can be obtained based on the rank of each difference of subjective and predicted scores. Therefore, even if there is less linear-relationship or regularity, it can derive the correlation as long as the tendency to the ranking is clear. However, it may not operate well if there are several outliers in the difference or if its variance is small.
KROCC is similar to SROCC, while the difference is that KROCC is designed to capture the association between two ordinal variables, not the order itself. KROCC quantifies discrepancy between the number of concordant and discordant rank pairs. This means that KROCC gives stronger penalty to non-sequential cases compared to SROCC. KROCC can be obtained as

where N is the number of total rank pairs, N c and N d are the numbers of concordant and discordant pairs in the dataset, respectively. This method has more robust performance than SROCC in cases when the sample size is small or multiple ties in rank order exist.
III. QOE ON 2D DISPLAY
A) QoE trend on 2D display
With the evolution of 2D display, image/video content has become the most familiar medium for users. In addition, by virtue of recent advances in network transmission and spread of smartphones, the application of 2D image/video content has become an increasingly important medium for acquiring data and for communicating with others. However, due to limitations of access device, storage, and transmission equipment, digital images can be easily degraded during acquisition, compression, and transmission. For this reason, it is particularly relevant to identify and quantify image distortions since the perceptual distortion severely affects the human understanding of 2D content. This trend has led to the emergence of numerous QoE assessments.
More recently, the demand for high-quality image/video has steadily grown. Nowadays, “high-quality” simply goes beyond the quality of information against loss, i.e., artifact, and more implies aesthetic sense. Toward this, in many studies, post-processing and domain-transfer techniques such as image generation and style transfer have been actively presented to satisfy user expectation of high quality from the aesthetic point of view [Reference Nguyen29]. Accordingly, new assessments such as contrast IQA and sharpness IQA, which quantify visual preferences of enhanced 2D content, appear as recent core topics to ensure the image quality. In addition, with the advent of ultra-high definition displays, it enables to accommodate greater immersion experience over a wider screen [Reference Sugawara30]. Therefore, in order to evaluate the QoE afforded by high-resolution image/video, major studies have been conducted while covering the variation of visual perception according to viewing geometry (viewing distance, viewing angle, etc.).
Furthermore, there have been QoE-related studies to model the HVS for more precise 2D QoE assessment. These works contribute to clarify various human perceptual factors dealt in the fields of psychology and neuroscience using formula, and enable to quantify the QoE with a broader understanding of the perceptual process. The following items are introduced as major factors for 2D QoE: foveation, viewing geometry, and visual saliency.
– Foveation: The distribution of photoreceptors in the human eye is not uniform and decreases away from the center of the fovea [Reference Lee12,Reference Lee13]. This characteristic is defined as foveation and has been employed as a spatial weight of the 2D domain in many existing studies [Reference Kim7,Reference Lee12,Reference Lee13,Reference Kim31–Reference Kim33]. For example, when a viewer gazes at a fixation point, as shown in Fig. 2(a), peripheral regions of the foveal region Ω can be blurred due to non-uniform distribution of photoreceptors.
– Viewing geometry: The perceptual resolution shown by the display varies w.r.t. viewing geometry factors (viewing distance, display resolution, display size, and display types: flat or curved). Therefore, many existing QoE studies have applied viewing geometry to design a prediction model that reflects perceptual resolution [Reference Kim7,Reference Kim33–Reference Kim35]. Figure 2(b) geometrically depicts an example of perceived pixel according to display type. When the viewing position is straight in front, the number of pixels is 4 for 1° of the viewing angle, where the perceived pixel length corresponds to the geometric length of each pixel for a given viewing distance. In contrast, when the viewing position moves to the side of the display as shown in right, the number of pixels is seven for 1° of the viewing angle, so that the perceived pixel length is relatively reduced compared to the previous case. This means the QoE is reduced in the ratio of the perceived pixel length. In contrast, for the curved display, the perceived pixel length variation is smaller because each pixel is relatively close to the viewer due to the curved shape, which becomes a good reference how to make a consumer product through quantifying QoE in terms of viewing geometry.
– Visual saliency: Visual attention can be characterized by how much user focuses on visual information on the region of display. The strength is termed “visual saliency” which can be used as an important criterion to measure QoE by figuring out the most critical information in 2D content. The research on saliency is determined in two ways of utilizing bottom-up and top-down visual cues. The bottom-up method is triggered by stimuli of low-level features obtained at the resolution of pixel. Thus, saliency is captured as the distinction of image regions or objects by analysis of low-level signals such as intensity, color, gradient, and shape. In general, image processing techniques have been mainly applied to find visual cues. In contrast, the top-down visual attention is inspired by recognition of objects in daily life from the computer vision perspective. Hereby, top-down saliency models utilize prior knowledge, expectations, or rewards as high-level visual cues to identify the target of interest. Overall, visual saliency prediction is to model the fixation selection behavior as well as biological interest mechanism of the HVS. Therefore, there have been studies to predict the visual saliency objectively through the HVS-based content analysis [Reference Kim8,Reference Hu36].
Representation of related studies for 2D QoE assessment. (a) Foveation, (b) viewing geometry, and (c) visual saliency.
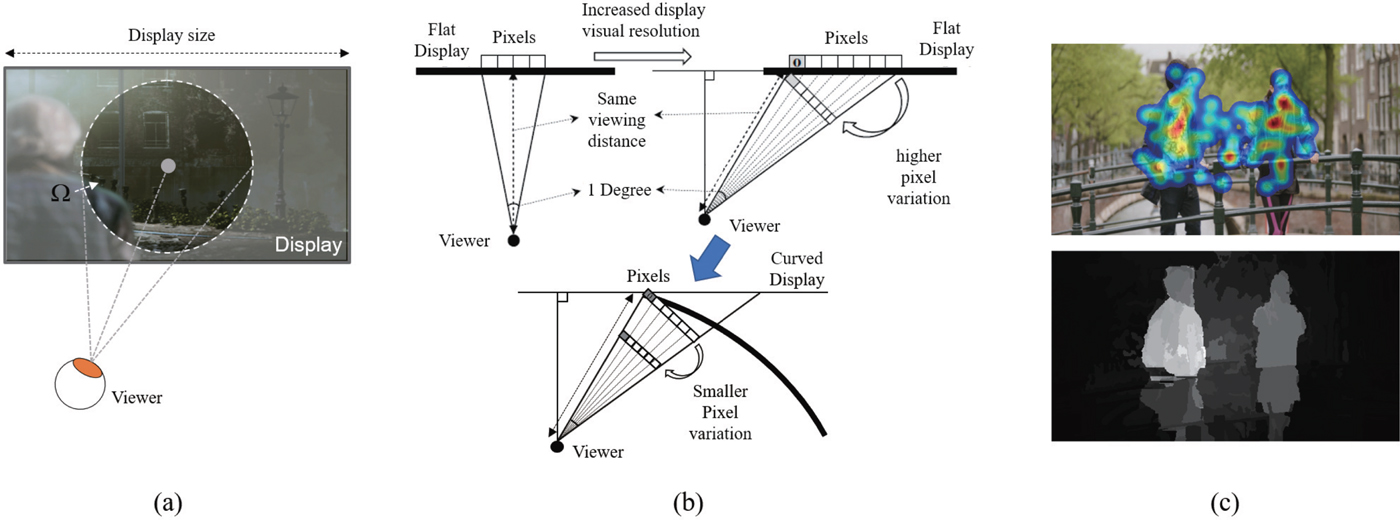
Figure 2(c) shows the heat-map traced by using an eye-tracker and its saliency predicted map. As shown in the figure, users tend to focus on specific local regions more clearly. Therefore, when user undergoes a specific QoE, it can be seen that the QoE is likely to be induced from the concentrated area. For this reason, in many studies, the saliency prediction has been implemented through the saliency weighting on the target QoE [Reference Kim7,Reference Kim33].
B) QoE tasks on 2D display
1) Image/video quality assessment
2D I/VQA databases
As mentioned in Section II, the I/VQA database containing subjective assessment data plays an important role in measuring the performance of the objective assessment. In the meanwhile, a number of public I/VQA databases have been proposed. In this section, we introduce major databases based on numerous existing studies including six IQA databases: LIVE IQA [Reference Sheikh37], TID2008 [Reference Ponomarenko38], CSIQ IQA [Reference Larson and Chandler39], LIVE-MD [Reference Jayaraman40], TID2013 [Reference Ponomarenko41], and LIVE-Challenge [Reference Ghadiyaram and Bovik42], and three VQA databases: LIVE VQA [Reference Seshadrinathan43], CSIQ VQA [44], and IVP VQA [Reference Zhang, Li, Ma, Wong and Ngan45].
Table 2 tabulates the comparison of major 2D IQA databases. The LIVE IQA database is one of well-utilized IQA databases containing 29 reference images and 799 distorted images with five distortion types: JP2K compression, white noise (WN), Gaussian blur (GB), and Rayleigh fast-fading (FF) channel distortion. Although most databases have focused on specific distortion components such as compression artifacts and transmission errors, the TID2008 database includes various types of distortion. TID2008 consists of 25 reference images and 1700 distorted images with 17 different distortions at four levels of degradation. Moreover, the TID2013 database is expanded to the dataset of having 3000 distorted images with 24 distortion types at five levels of degradation. The CSIQ IQA database includes 30 reference images and 866 distorted images with six distortion types: JPEG, JP2K, WN, GB, pink Gaussian noise (PGN), and contrast distortion (CTD). The LIVE MD database includes 15 reference images and 405 distorted images degraded by two multiple types of distortion. One is associated with images corrupted by GB followed by JPEG (GB+JPEG) and the other one is associated with images corrupted by GB followed by WN (GB+WN). Finally, the LIVE challenge database includes almost 1200 unique image contents, obtained by a variety of mobile camera devices under highly diverse conditions. As such, the images were subjected to numerous types of authentic distortions during the capture process such as low-light blur and noise, motion blur, camera shake, overexposure, underexposure, a variety of color errors, compression errors, and many combinations of these and other impairments.
Comparison of major 2D image quality assessment databases.

For 2D VQA, three VQA databases are tabulated in Table 3. Unlike the IQA database, the video sequences have high complexity, hence the number of sequences is limited compared to the IQA database. The LIVE VQA database contains 10 references and 150 distorted videos with four distortion types: wireless, IP, H.264, and MPEG-2 compression distortions. The IVP VQA database contains 10 references and 128 distorted sequences with four distortion types: MPEG, Dirac-wavelet, H.264, and packet loss. The CSIQ VQA database includes 12 references and 216 distorted videos with six distortion types: motion JPEG (MJPEG), H.264, HEVC, wavelet compression using the SNOW codec, packet-loss in a simulated wireless network, and additive white Gaussian noise (AWGN).
Comparison of major 2D video quality assessment databases.

Major 2D IQA approaches
For the FR-IQA method, most existing works have focused on discovering specific visual characteristics, and on mathematically formulating them from a top-down perspective. Here, we introduce seven well-known FR-IQA approaches. The most intuitive way is calculating error signals between a reference image and its distorted image using the PSNR. Later then, researchers have found that the HVS is a more important factor in perceptual quality. Based on this, Wang et al. established a SSIM metric which utilizes divisive normalization and accords with the normalized response of the HVS [Reference Wang5]. Similarly, a variety of studies have been proposed. Lai and Kuo proposed haar wavelet transform-based approach to address HVS-related perceptual distance [Reference Lai and Jay Kuo46]. The Visual Information Fidelity (VIF) model calculates the information distance between natural scene statistics (NSS) [Reference Sheikh and Bovik47]. FSIM embodies phase coherency in an SSIM-like computation [Reference Zhang48]. In addition, a simple and high-efficient model has been proposed using gradient magnitude similarity deviation [Reference Xue49]. With the development of deep-learning technique, Kim. et al. proposed a convolutional neural network (CNN)-based FR-IQA model which infers the visual sensitivity map as an intermediate training target of the CNN [Reference Kim and Lee50]. Different from existing CNN-based IQA works, this provides visual analysis of the HVS and demonstrates state-of-the-art performance.
For NR-IQA, since not having a reference image, only the statistics of target images is available. There have been several attempts using perceptually relevant low-level feature extraction mechanisms associated with parametric fitting. Here, we introduce six NR-IQA methods. BRISQUE is one of the well-utilized models, which uses NSS features [Reference Mittal51]. Ye et al. proposed a codebook representation method through learning for NR image assessment (CORNIA) [Reference Ye52]. Zhang et al. proposed an effective algorithm called ILNIQE. To characterize structural distortions, they deployed quality-aware gradient statistics feature [Reference Zhang53]. Moreover, in [Reference Xu, Ye, Li, Du, Liu and Doermann54], dictionary learning was applied to capture useful features from the raw patches. Recently, several deep-learning approaches have been introduced in the literature. BIECON [Reference Kim and Lee55] is a novel CNN approach where a new data augmentation method is presented. More recently, they proposed a more reliable model called DIQA by predicting the sensitivity of human perception, and then weighted the sensitivity onto the predicted error map [Reference Kim56].
Major 2D VQA approaches
Similar to 2D FR-IQA, FR-VQA has also focused on the formulation of the distance metric from the HVS point of view. For this reason, some IQA metrics, e.g., PSNR, SSIM, still have been applied to the FR-VQA task accompanied by a temporal pooling method. Recently, Vu et al. proposed STMAD which takes into account the visual perception of motion artifacts. STMAD employs a concept of spatio-temporal frame which enables to quantify motion-based distortion [Reference Vu57]. Similarly, they continued their work to ViS3 [Reference Vu58], while separating estimates of perceived degradation into spatial distortion and joint spatio-temporal distortion. More recently, Kim et al. proposed a new deep-learning-based FR-VQA approach by learning the spatio-temporal sensitivity map [Reference Kim59]. This work effectively addresses the motion masking effect and provides an attention mechanism-based temporal pooling strategy.
For NR-VQA, V-BLIIND [Reference Saad60] employed a statistical approach from frame difference signals as done in NSS-based approach [Reference Mittal51]. In the paper, the authors utilized the frame difference signal which contains temporal variation to extract DCT coefficients, and calculated statistical features. One well-known NR-VQA approach is MOVIE which has been proposed in [Reference Seshadrinathan61]. By using a spatio-temporal Gabor filter family, they computed quality index as done in SSIM. MOVIE provides significant performance improvement in comparison with existing works. Recently, Li et al. proposed a deep-learning-based NR-VQA model called SACONVA [Reference Li62]. Interestingly, they combined hand-crafted features from 3D shearlet transform, and regressed the CNN output onto the subjective score. Powered by the CNN's strong predictive performance, SACONVA achieved the highest performance in NR-VQA.
2) Visual preference assessment
2D contrast/sharpness IQA database
To compare the performance of the contrast IQA, the CID2013 and CCID2014 databases were presented. The CID2013 consists of 400 contrast distorted images with six contrast changed distortion types. The CCID2014 database is a large-scale contrast-changed database including 655 images with eight contrast-changed distortion types [Reference Gu6].
The camera-shaken image (CSI) database was opened in public for 2D sharpness IQA [Reference Köhler63]. The database contains camera-shaken images with resolutions of 1024 × 768 and 1092 × 728. This database is classified into two categories. Category I has 11 natural images and 99 blurred images by linear camera shake. Category II consists of 25 blurred images impaired by complex camera movement. The camera aperture varies in the range from f /2.2 to f /32, and the exposure time range is from 1/40 to 1 second, where f means the focal length of a lens.
Major sharpness IQA approaches
Existing studies for measuring the sharpness of an image can be categorized into two methods. The first is measuring the spread of edges within an image. The edge width is calculated by fitting the distribution of edge region in the blurred image to the Gaussian function [Reference Elder and Zucker64,Reference Hu and De Haan65] or by measuring the distance between the start and endpoints of edges [Reference Marziliano66–Reference Ferzli and Karam68]. Another method is the spectral-based method, which assumes that edges and textured regions comprise high-frequency energy. This method measures the sharpness of images by analyzing the statistical characteristics of coefficients obtained by Fourier transform or discrete cosine transform on the image [Reference Caviedes and Oberti69]. However, existing approaches lack consideration on the perceived resolution change according to viewing geometry. To overcome this, Kim et al. [Reference Kim33] proposed a sharpness assessment metric that takes into account various factors that affect the perceived resolution.
Major contrast IQA approaches
Recently, Wang et al. [Reference Wang70] estimated the perceptual distortion for each component by decomposing the image patches into mean intensity, signal strength, and signal structure. In Gu et al. [Reference Gu6], they proposed the RR contrast IQA technique based on phase congruency and information statistics from image histogram. However, since most contrast enhancement techniques do not have reference images, NR methods have been more actively studied in contrast IQA research. Feng et al. [Reference Fang71] proposed a blind quality assessment method based on NSS in terms of mean, standard deviation, skewness, and kurtosis. Chen et al. [Reference Chen72] extracted feature vectors from feature descriptors and color motions, and then used a regression algorithm to measure the final quality score. The authors of [Reference Gu73] devised a machine-learning-based algorithm that extracts feature vectors by calculating contrast, sharpness, brightness, colorfulness, and naturalness of images.
3) Benchmarking on 2D QoE tasks
The performance of each 2D I/VQA task was benchmarked by means of PLCC and SROCC. The correlation coefficients were calculated by using the objective/subjective scores. In the case of support vector regressor (SVR) or neural networks (NNs)-based model, the predicted scores have closely fitted to the subjective scores, so no other post-fitting is needed to evaluate the performance. In contrast, for metric-based model, a metric index was developed, but in different scale from the subjective score. Thus, it is necessary to use a logistic function to fit the objective scores to MOS (or DMOS) in order to account for quality rating confining at the extremes of the test range and to prevent the overfitting problem. For this scale conversion, four or five parametric logistic functions have been broadly utilized to fit objective prediction score to subjective quality score as shown in [Reference Sheikh and Bovik47,Reference Zhang48]. In this benchmark, all the experimental settings followed their origin literature.
Major I/VQA benchmarking
Firstly, to compare the performance of existing 2D IQA methods, five IQA databases were used: LIVE IQA, CSIQ IQA, TID2013, LIVE-MD, and LIVE challenge. Table 4 reports the SROCC and PLCC of the compared FR/NR-IQA algorithms with the five different databases. Here, 12 existing methods are compared by means of six FR-IQA metrics: PSNR, SSIM [Reference Wang5], VIF [Reference Sheikh and Bovik47], FSIMc [Reference Zhang48], GMSD [Reference Xue49], DeepQA [Reference Kim and Lee50], and of six NR-IQA methods: BRISQUE [Reference Mittal51], CORNIA [Reference Ye52], ILNIQE [Reference Zhang53], HOSA [Reference Xu, Ye, Li, Du, Liu and Doermann54], BIECON [Reference Kim and Lee55], and DIQA [Reference Kim56]. As listed in Table 4, the best performance is done by using the deep-learning approach. For both FR/NR IQA benchmarking, DeepQA and DIQA show the best performance for the overall databases. Generally, FR-IQA methods show higher performance than NR-IQA methods since reference images can be utilized as additional information for FR-IQA. For the TID2013 database, conventional metrics such as SSIM and VIF do not perform well since TID2013 has more widespread types of distortion than other databases. For the LIVE challenge, because the database was designed for the NR-IQA, the FR is not evaluated. As it can be seen, the overall performance is lower than those using the other databases due to broader types of distortion added to the reference images. Nevertheless, it is noted that DIQA still yields higher performance on the LIVE challenge database.
SROCC and PLCC comparison on the five 2D IQA databases. Italics indicate the deep-learning-based methods.

Secondly, we compared 2D VQA methods using three VQA databases: LIVE VQA, CSIQ VQA, and IVP VQA. Table 5 tabulates the SROCC and PLCC of the compared FR/NR-VQA methods. We benchmarked eight existing methods including five FR-VQA approaches: PSNR, SSIM [Reference Wang5], STMAD [Reference Vu57], ViS3 [Reference Vu58], DeepVQA [Reference Kim59], and three NR-VQA methods: V-BLINDS [Reference Saad60], MOVIE [Reference Seshadrinathan61], and SACONVA [Reference Li62].
SROCC and PLCC comparison on the three 2D VQA databases. Italics indicate the deep-learning-based methods.

In our experiment, as shown in Table 5, the highest SROCC and PLCC of overall distortion types are achieved by DeepVQA which takes full advantage of deep-learning and reference information in all the databases. Also, SACONVA achieves competitive performance even though it is an NR-based model. Since the metrics of PSNR and SSIM were designed for FR-IQA, it shows lower performance over all the databases. However, the other recent FR-VQA algorithms show improved performances. Interestingly, V-BLINDS shows higher performance than non-deep-learning-based FR-VQA works even it is an NR-VQA approach. Overall, it can be concluded that the deep-learning-based model can demonstrate powerful performance in correlation with the subjective scores.
Major visual preference assessment benchmarking
To verify the performance of the sharpness IQA methods, we used the CSI database [Reference Köhler63]. For the contrast IQA, the CID2013 and CCID2014 databases were used. For image sharpness IQA, the following methods were benchmarked: Marziliano et al. [Reference Marziliano66], Narvekar et al. [Reference Narvekar and Karam67], Ferzli et al. [Reference Ferzli and Karam68], Caviedes et al. [Reference Caviedes and Oberti69], and Oh et al. [Reference Oh32]. Also, we compared the several contrast IQA methods: FSIM [Reference Zhang48], PCQI [Reference Wang70], RIQMC [Reference Gu6], FANG [Reference Fang71], and BIQME [Reference Gu73].
Table 6 shows the results for the sharpness IQA methods, where the performance of Oh et al. [Reference Oh32] is superior to the other methods. The scene classification method by object and camera movement plays an important role in improving the performance of image sharpness IQA [Reference Oh32].
PLCC and SROCC comparison of sharpness IQA on the CSI database.

Table 7 shows the results for the contrast IQA methods. The contrast quality dedicated models [Reference Gu6,Reference Wang70,Reference Gu73] are superior to the conventional IQA metric FSIM [Reference Zhang48]. Mostly, PCQI and RIQMC achieved higher performance than the other methods. Interestingly, BIQME which is an NR-IQA model shows competitive performance, and even higher than RIQMC in the CID2013 database.
Performance comparison of contrast IQA methods on the two contrast IQA databases.

IV. QOE ON STEREOSCOPIC 3D DISPLAY
A) QoE trend on S3D display
Different from 2D display, S3D display enables to accommodate another dimension of QoE by providing enhanced sense of reality through depth provision to viewers. However, as the side effect, entertaining S3D contents make viewers perceive the optical illusion effect induced from disparity of left and right images. This effect causes abnormal interaction of the oculomotor and crystalline lens control system, which results in feeling of discomfort to viewers [Reference Emoto74–Reference Lee76]. Therefore, VDP needed to assess the level of fatigue has emerged as an important topic in addition to the quality assessment as done for 2D contents. As a result, several researches have been conducted to predict quality and visual discomfort more objectively for S3D contents.
Besides, there are several studies which investigated HVS-related factors observed when watching S3D contents. Since QoE can be measured after displaying S3D content over the display rather than by analyzing just content itself as done for 2D I/VQA, the performance of the QoE prediction model can be dramatically improved by considering these QoE-related factors. One of them is understanding of the depth perception-related mechanism including the process of receiving visual information through the HVS. The following items introduce major QoE-related studies: accommodation–vergence mismatch and binocular rivalry and suppression.
– Accommodation–vergence mismatch: This mismatch occurs due to the side effect of optical illusion. When watching S3D contents, the accommodative stimulus is fixed on the stereoscopic screen while the vergence stimulus fluctuates according to disparity over the screen as shown in Fig. 3(a). These artificial decoupling phenomenon has been commonly known as an important factor of visual discomfort [Reference Wann77,Reference Okada78].
– Binocular rivalry and suppression: The binocular rivalry occurs when the left and right images are mismatched, e.g., when one of the images is severely distorted, the stereopsis by both eyes is imperfectly established. In this case, the image information recognized at the same retinal location is different from our expectation used to be in daily life. The failure of binocular matching induces the binocular rivalry, which occurs in various forms, such as a sense of failed fusion or bi-state alternation between the eyes [Reference Levelt79] as shown in Fig. 3(b). The binocular suppression is a special case of the binocular rivalry, in which rivalrous fluctuations do not occur between two images. In other words, only one image is perceived in the brain while viewing mismatched stereo stimuli, as shown in Fig. 3(b) [Reference Blake80].
Representation of related studies for S3D QoE assessment. (a) Accommodation–vergence mismatch, and (b) binocular rivalry and suppression.

B) QoE tasks on S3D display
1) Visual discomfort assessment
Visual discomfort databases
The databases for VDP consist of the left and right images and the corresponding subjective visual discomfort scores. The IEEE-SA database [81,82] and IVY LAB database [Reference Jung83] are the representative public databases for the performance comparison of VDP models. The IEEE-SA database [81,82] consists of 800 S3D image pairs with a resolution of 1920 × 1080. The images of the IEEE-SA database are classified into eight categories (e.g., indoor/outdoor, no salient/salient and large/small) according to the distribution of depth. The IVY LAB database [Reference Jung83] consists of 120 S3D image pairs with a resolution of 1920 × 1080, and includes indoor and outdoor scenes which contain various objects (e.g., humans, trees, buildings, etc.).
Major S3D VDP approaches
In previous studies, various visual factors have been found including crosstalk, keystone effects, window violations, and optical distortion, which mainly cause visual discomfort when viewing S3D contents [Reference Sohn84–Reference Kim86]. However, neuronal and oculomotor conflicts arising from the accommodation–vergence mismatch are known to be the most important cue of visual discomfort [Reference Kim17,Reference Park19,Reference Hoffman75].
Early VDP models focused on extracting statistical features related to distribution of disparity, such as mean and variance [Reference Yano87–Reference Kim and Sohn90]. More recently, an advanced VDP model based on human visual perception has been proposed. Jung et al. [Reference Jung83] developed a saliency-based VDP model based on saliency-weighted disparity and disparity gradient features. Park et al. [Reference Park18] developed a VDP model in terms of retinal resolving power and optics.
In addition to spatial information, S3D videos additionally contain temporal information over the frame sequence. Therefore, it is necessary to take into account various temporal characteristics when designing the VDP model for S3D video. The authors of [Reference Jung91] devised a metric for predicting discomfort from motion magnitude in the salient region under the assumption that the motion information is an important factor for visual discomfort. Lambooij et al. [Reference Lambooij25] classified the motions in S3D video into static/planar/in-depth motions according to depth variation and motion size. They extracted a feature vector to predict visual discomfort through the regression process.
In recent years, some researchers attempted to apply deep learning to the VDP task. However, deep-learning approaches have shown a limited performance improvement due to the insufficient databases for visual discomfort. To resolve this problem, Oh et al. [Reference Oh92] used S3D images in patch unit, and employed the existing VDP model [Reference Park19] to derive the proxy ground-truth score for each patch. The authors of [Reference Kim20] showed the state-of-the-art performance by proposing a binocular fusion network mimicking binocular fusion model of human.
2) S3D image quality assessment
S3D I/VQA databases
The databases of the S3D I/VQA include both of left and right images and their corresponding subjective quality scores. There have been four official S3D IQA databases: LIVE S3D IQA (Phase I) [Reference Moorthy93], LIVE S3D IQA (Phase II) [Reference Chen94], IVC S3D IQA (Phase I) [Reference Wang95], and IVC S3D IQA (Phase II) [Reference Wang95], and three S3D VQA databases: EPFL S3D VQA [Reference Joveluro96], IRCCYN S3D VQA [Reference Jin97], and the QI S3D VQA [Reference Lu98].
Table 8 tabulates the comparison of major S3D IQA databases. The LIVE S3D IQA database (Phase I) includes 20 reference image pairs and 365 distorted image pairs including five distortion types: JPEG, JPEG2000 (JP2K), additive white Gaussian noise (AWGN), Rayleigh fast-fading channel distortion (FF), and Gaussian blur (BLUR). The LIVE S3D IQA database (Phase II) [Reference Chen94] contains eight reference image pairs and 360 distorted image pairs with five corresponding distortion types: JPEG, JP2K, AWGN, BLUR, and FF. The IVC S3D IQA database (Phase I) [Reference Wang95] has six reference image pairs and 72 distorted image pairs including three distortion types: AWGN, BLUR, and JPEG. The IVC S3D IQA database (Phase II) [Reference Wang95] consists of 10 reference image pairs and 120 distorted image pairs with three distortion types: AWGN, BLUR, and JPEG.
Comparison of the stereoscopic S3D IQA databases.

For the S3D VQA databases, Table 9 tabulates the comparison of major S3D VQA databases. The EPFL S3D VQA database [Reference Joveluro96] consists of six reference pairs and 24 distorted video pairs including three distortion types: geometrical alignment, temporal alignment, and color adjustment. The IRCCYN S3D VQA database [Reference Jin97] has 10 reference video pairs with 10 distorted video pairs including five distortion types: H.264, JP2K, down-sampling, sharpening, and down-sampling and sharpening. The QI S3D VQA database [Reference Lu98] includes nine reference pairs and 450 distorted pairs containing two distortion types: H.264 and Gaussian blur.
Comparison of the stereoscopic S3D VQA databases.

Major S3D IQA methods
Early studies for FR S3D IQA stemmed from approaches used for 2D IQA. In this way, a 2D FR-IQA metric was applied to the left and right images, and additional metrics were used to derive the final predictive score [Reference Benoit99–Reference Yang101]. More recently, various methods have been introduced to reflect the binocular vision into the IQA model. Chen et al. [Reference Chen94] proposed a cyclopean model based on the binocular rivalry theory when the human eyes recognize stereoscopic images. In other words, the authors used a linear additive model to calculate the cyclopean images and applied a 2D IQA method for them to predict the quality scores. Lin and Wu [Reference Lin and Wu102] proposed a FR-S3D IQA model which includes the neural processing occurring at the visual cortex. Also, the authors of [Reference Lee and Lee103] proposed a local quality pooling method that calculates the quality score by dividing the distorted image pair into binocular fusion, rivalry, and suppression regions.
Some researchers have studied S3D IQA metrics without the use of reference image pairs. Sazzad et al. [Reference Sazzad104] proposed a distortion-specific approach which is applicable only to JPEG distortion. After extracting the edge and relative depth information, they modeled the NR S3D IQA metric using a logistic regression function. Chen et al. [Reference Chen105] extracted normalized texture information, disparity, and uncertainty maps under the assumption that natural S3D images show statistical regularity, and fitted them to a generalized Gaussian and log-normal distribution. The shape parameters were utilized as features to predict the MOS score through support vector regression.
Along with the development of deep learning, CNN-based methods have been studied in the S3D IQA domain. Zhang et al. [Reference Zhang106] proposed a CNN model to predict the quality score by using left, right, and difference images as an input to the deep-learning model. Each input (left, right, and difference images) passed through different convolution layers whose weights were shared, and the resulting structural features were concatenated to predict the quality score through the MLP layer. Oh et al. [Reference Oh14] presented a two-stage deep-learning framework to solve the database shortage problem when applying deep learning to IQA. Also, Ding et al. [Reference Ding107] proposed a CNN network that imitates the process of depth recognition in HVS.
Major S3D VQA methods
In previous S3D VQA researches, disparity and spatio-temporal information have been importantly considered. Han et al. [Reference Han108] extracted spatial-temporal structural information and derived the SSIM-like similarity between adjacent frames. The authors of [Reference Jin97] applied sensitivity and luminance masking to generate videos perceived by the HVS, and calculated the MSE between the reference and distorted videos. Recently, the authors of [Reference Malekmohamadi109] proposed a video quality evaluation method by extracting spatial information from color and depth maps. More recently, in [Reference Zhu110], they proposed a depth perception-based VQA metric. To model a metric closer to the HVS, the authors of [Reference Qi111] proposed a just-noticeable-difference model that can be applied to stereoscopic content, and predicted video quality by using a saliency map as its weighting function. For the learning-based approach, in [Reference Chen, Zhou and Li112], the authors introduced the features of auto-regressive prediction-based disparity measurement. Jiang et al. [Reference Jiang113] performed tensor decomposition on S3D video to extract motion features representing time-varying information. In recent years, there have been attempts to use CNN for S3D VQA. Yang et al. [Reference Yang114] proposed a 3D CNN framework based on local and global spatiotemporal information.
3) Benchmarking on 3D QoE tasks
For 3D QoE, the benchmark is performed by evaluating the performance using the correlation indices of PLCC and SROCC.
Major S3D VDP benchmarking
To compare the performance, the following S3D VDP models are included:Yano et al. [Reference Yano87], Nojiri et al. [Reference Nojiri88], Choi et al. [Reference Choi89], Kim et al. [Reference Kim and Sohn90], Park et al. [Reference Park18], Oh et al. [Reference Oh92], and Kim et al. [Reference Kim20]. The IEEE-SA database [81,82] and IVY LAB database [Reference Jung83] were used for training and testing. As shown in Table 10, the methods using HVS-related features [Reference Park18,Reference Kim and Sohn90] perform better than those using only statistical features from disparity maps [Reference Yano87–Reference Choi89]. It means that the analysis of 3D factors such as accommodation–vergence mismatch and binocular rivalry is important to predict the visual discomfort. In particular, the deep-learning approaches [Reference Kim20,Reference Oh92] show superior performance compared to the other methods [Reference Park18,Reference Yano87–Reference Kim and Sohn90]. This means there is a limitation to cover various factors optimally by existing hand-crafted methods. It also shows that the data augmentation process through the patch-based approach has successfully solved the database shortage problem as experienced in the 2D-IQA approaches.
Performance comparison of VDP models on the two S3D VDP databases. Italics indicate the deep-learning-based methods.

Major S3D I/VQA benchmarking
To compare the performance of existing S3D IQA models, we used 10 S3D IQA methods: Chen [Reference Chen94], You [Reference You100], Benoit [Reference Benoit99], Lin [Reference Lin and Wu102], Sazzad [Reference Sazzad104], Chen [Reference Chen105], Zhang [Reference Zhang106], Oh [Reference Oh14], Ding [Reference Ding107]. For the training and testing processes, the LIVE S3D IQA database (phase I and II) was used. As shown in Table 11, the FR methods show higher performance than the NR methods since reference images can be utilized as additional information for the FR-S3D IQA. Also, the deep-learning approaches [Reference Zhang106,Reference Ding107] outperform the other works [Reference Chen94,Reference Chen105]. This means that the deep-learning models have successfully learned various visual perception characteristics compared to conventional hand-crafted methods. Oh et al. [Reference Oh14] proposed a concept of pseudo ground-truth for each S3D patch to overcome overfitting problem. Also, Ding et al [Reference Ding107] considered various HVS factors such as saliency and multiscale disparity map, which produced better performance than previous works.
Performance comparison for S3D IQA models on the two S3D IQA databases. Italics indicate the deep-learning-based methods.

Secondly, we compared the performance of existing S3D VQA models: Feng [Reference Qi111], PHVS-3D [Reference Jin97], SFD [Reference Lu98], 3D-STS [Reference Han108], MNSVQM [Reference Jiang113], BSVQE [Reference Chen, Zhou and Li112], and Yang [Reference Yang114]. The IRCCYN 3D video quality database [Reference Jin97] and the Qi stereoscopic video quality database [Reference Lu98] were used for performance comparison. As can be seen in Table 12, the performance of S3D VQA is better when they are trained on the QI database. Because the QI database has fewer distortion types and more training videos, the VQA than the other methods while learning the spatial and temporal characteristics of videos more successfully [Reference Yang114].
Performance comparison for S3D VQA models on the two S3D VQA databases. Italics indicate the deep-learning-based methods.
V. QOE ON HMD DEVICE
A) QoE trend on HMD device
360-degree VR content
360-degree VR content is a new type of visual information that brings users totally immersive experience. Different from usual 2D content displayed on a normal plane, 360-degree content surrounds user spherically so that the content is in his view at any head pose. Equipped with an HMD device, user can enjoy the content using head motion similar to what we do in real life, which provides the immersive and interactive experience. This is a new type of experience so that several new human factors should be identified to assess the quality of the immersive experience. There are many factors that determine the immersive experience of 360-degree content such as resolution, saliency, bitrate, and visual quality. Unfortunately, compared to the 2D counterpart, there is no widely-accepted I/VQA workflow for 360-degree contents. Simply applying 2D IQA metrics to the assessment is also troublesome as these metrics do not consider the spherical nature of 360-degree contents.
In [Reference Lee12,Reference Lee115], Lee et al. first introduced a metric of assessing the image over curvilinear coordinates from Cartesian coordinates after mapping it in accordance with the foveation. Stemming from this concept, researches have been conducted to map the content from Spherical coordinates to Cartesian coordinates, and then applied conventional metrics to assess the QoE. However, this warping may cause some projection errors into the scene, and results in much redundancy, which leads to a decrease in accuracy of the IQA. Thus, reliable I/VQA pipelines have been studied for the continuous integration of the 360-degree contents into our life.
Computer graphic-based VR content
Unlike the 360-degree VR content, the breakthrough of CG-based VR content has led the user to interact in the virtual space. Furthermore, development tools such as Unity and Unreal have facilitated the diversified virtual experiences through a huge amount of CG contents. Accordingly, the user's demand to access sufficient QoE has accelerated the production of CG content in a more realistic way. However, in the CG-based VR contents, heterogeneous visual stimuli through the HMD strongly induces physiological side effects called VR sickness (or cybersickness). With this unexpected symptoms, it has been critical to predict the VR sickness level in order to guarantee users' viewing safety and abundant QoE. In literature, many VR sickness-related human factors have been found such as motion-to-photon latency, flicker, and visual movement pattern. Nevertheless, there is still no definitive conclusion to predict VR sickness due to its complex perceptual mechanism.
To overcome this problem, a few VRSA approaches have focused on analyzing changes in the physiological condition during VR experience, and on analyzing meaningful feature information through statistical analysis. Electrogastrogram (ECG), eye blink, heart period, electroencephalogram (EEG), and galvanic skin response (GSR) are the main measurement tools for observing physiological changes.
B) QoE tasks on HMD device
1) 360-degree I/VQA
360-degree I/VQA databases
There are several notable databases in 360-degree VR content I/VQA literature. One of them for 360-degree VR content IQA is CVIQD2018 [Reference Sun116]. The database consists of 16 pristine images and 544 distorted derivations compressed by JPEG, H.264, and H.265. The resolution of these images is 4096 × 2048. The OIQA [Reference Duan117] also contains 16 pristine images and 336 distorted images which are perturbed by JPEG and JPEG2000 compressions, Gaussian blur, and white Gaussian noise. The resolutions vary from 11332 × 5666 to 13320 × 6660.
For the VQA task, VQA-ODV [Reference Li118] is the largest one set up to date. The set has 60 pristine sequences and another 600 videos distorted by H.265 compression noise. The resolution ranges from 3840 × 1920 to 7680 × 3840. The second-largest dataset is much smaller [Reference Zhang119]. It has only 16 original sequences and 400 distorted videos derived from them. However, there are many more distortion types including VP9, H.264, H.265, Gaussian blur, and box-blur. The resolution is fixed to 4096 × 2048.
Major 360-degree I/VQA approaches
After 360-degree contents are converted to 2D contents by means of projection, and then the 2D QA metrics can be applied as done in some early works [Reference Qian120]. However, this raises a serious problem due to the warping in projection. Depending on the projection, some regions in the spherical 360-degree contents are redundantly projected onto the 2D plane, which significantly affects the QA scores. Also, the QA metrics are not invariant to projection and sampling, which does not agree with our HVS.
In the literature, there exist three main approaches to the I/VQA problem; the sampling, attention, and learning-based methods.
Sampling-based I/VQA methods: To deal with the redundancy and over-sampling problem, in [Reference Yu, Lakshman and Girod121], the authors introduced the concept for 360-degree spherical PSNR (s-PSNR). s-PSNR measures the PSNR between points in the spherical domain instead of the usual planar image domain. Points on the sphere were obtained by either nearest neighbor selection or interpolation from the planar image. PSNR can also be calculated in a weighting manner. The weighted to spherically uniform PSNR (WS-PSNR) [Reference Sun, Lu and Yu122] simply calculates the PSNR between two images but the pixels are weighted differently depending on the sampling area on the corresponding spherical regions. In [Reference Zakharchenko123], the authors converted the images into the Crasters Parabolic Projection format, which is similar to the unit sphere, and then applied PSNR, which is called CPP-PSNR, to the transformed images. CPP-PSNR can be applicable for images with different resolutions and projection types. Indeed, this type of sampling-based I/VQA had been researched earlier [Reference Lee12,Reference Lee115], where foveal-PSNR has been presented by reflecting the foveation over the Cartesian coordinates.
Saliency-based I/VQA methods: Many studies resort to saliency for the weighting scheme in different ways. In [Reference Luz124], the authors proposed a saliency detection model and used it to weight the PSNR score. In [Reference Xu125], the authors utilized random forest to predict the 360 attention, and then masked the non-content region. Differently, Yu et al. [Reference Yu126] calculated PSNR in the attentive viewports only while Ozcinar et al. [Reference Ozcinar127] used ground-truth saliency maps directly. The F-PSNR can be directly applied to this saliency-based scheme as long as the saliency region is identified [Reference Lee12,Reference Lee115]. Thus, it can be stated that both sampling and saliency-based methods stem from the idea published in [Reference Lee12,Reference Lee115].
Learning-based I/VQA methods: Given the popularity of deep learning, recent works also manage to benefit from the phenomenal performance of CNN. Kim et al. [Reference Kim128] proposed to extract patch-based positional and visual features from a 360 image using CNN, and then regressed the features onto the ground truth MOS. Similarly, Lim et al. [Reference Lim129] proposed latent spatial and positional features, and used adversarial learning to predict the quality score. In [Reference Li118], the authors predicted head movement and eye movement, and incorporated this information into the I/VQA model of a deep CNN. Li et al. [Reference Li130] proposed the viewport CNN (V-CNN) and a two-stage training scheme to extract proposal viewports, and rated the quality of them. The final score was obtained by integrating the scores of the viewports.
A quantitative benchmark of some spotlight methods is shown in Table 13. The first three rows are bottom-up methods derived from PSNR while the others are all deep-learning-based models. s-PSNR is the best among these metrics. DeepQA [Reference Kim and Lee50] is a state-of-the-art deep-learning-based method designed for the 2D IQA task. Interestingly, it is easy to notice that it shows lower performance than those in general IQA task. This emphasizes the difference in characteristics of 2D and 360 stimuli. V-CNN [Reference Li130] achieves the current state-of-the-art correlation with human opinions. However, compared to the 2D IQA score, the performance is still much behind, which suggests there is still much room for improvement in future work.
Performance comparison of major 360-degree VQA models on the VQA-ODV database [Reference Li118]. Results are reproduced from [Reference Li130].

2) VR sickness assessment
VR sickness databases
According to our knowledge, there is no public VR sickness database for CG-based VR contents. However, several self-produced databases have been introduced in the literature. Padmanban et al. produced a dataset of stereoscopic CG videos and their corresponding subjective sickness scores to quantify their nauseogenicity [Reference Padmanaban131]. The dataset consists of 19 stereoscopic videos extracted with a 60-second clip with the corresponding Kennedy SSQ and the MSSQ-short. Kim et al. constructed the VR sickness database and conducted a subjective sickness scoring using the Unity engine [Reference Kim21]. The database includes two reference scenes which are then extended by adjusting parameters: object movements, camera movements, and content components. In addition, it serves the user's head-movement information from Gyroscope sensors in the HMD.
The largest dataset for CG-based VR sickness is perhaps the dataset of [Reference Kim132]. Kim et al. constructed a total of 52 scenes by composing various contents in different scenarios, and conducted a subjective test on 200 non-expert users, which is named the ETRI-VR dataset. Furthermore, it contains three types of physiological signals including EEG, ECG, and GSR. For the collection of the dataset, they used the HTC-VIVE, which provides a resolution of 1080 × 1022 per eye, with a refresh rate of 90 Hz and a nominal 110-degree vertical field of view.
Major VRSA approaches
Feature-based VRSA: Recently, it has been found that the VR sickness can be triggered by content factors such as fidelity, global (local) motion, and depth change. Based on the fact that motion is a dominant component that induces sickness, Padmanaban et al. developed the first machine-learning-based VRSA model [Reference Padmanaban131]. Here, optical flow is utilized to extract motion representation, and the features are regressed onto the subjective sickness score using the SVR. Learning-based VRSA: Different from the feature engineering perspective, CNN-based deep-learning methods have been proposed. Kim et al. designed a sickness prediction model that utilizes an unsupervised learning manner [Reference Kim20]. To learn the exceptional motion in the content, they defined unexpected motion as the difference between the image input and reconstructed output from the autoencoder. Furthermore, Kim et al. proposed the model that reflects individual differences for VRSA by complementary learning of the visual and physiological features [Reference Kim132]. They devised a novel deep learning framework to identify the human cognitive feature space by analyzing brain activity, and then expressed the visual and cognitive features simultaneously in the intermediate state.
In this review, we report benchmarking of major VRSA models on the ETRI-VR dataset. Table 14 shows the performance comparison of existing methods. The first two rows are top-down approaches that compute optical-flow features while the others are CNN-based models. Among the benchmarks, the deep-learning-based model shows the best prediction performance. Moreover, it can be seen that Kim [Reference Kim132] shows higher performance than Kim [Reference Kim20]. Therefore, it is more effective to take into account both of visual and cognitive space in predicting VR sickness compared to the simple motion estimation-based method.
Performance comparison of major VRSA models on the ETRI-VR database.

VI. FUTURE TRENDS ON QOE
A) QoE on future displays
On the basis of the recent trend, display technology has been growing for user to entertain high-quality contents. Advances in these technologies continue to raise user satisfaction with larger screens and even sophisticated user interaction. From this ongoing technological development, it can be easily inferred that the resolution of 2D display is getting higher, the S3D display combines a sense of depth on 2D space, and the HMD device is expanded for more interactive experience. As if the sprout comes out of the ground, this has been continuing to evolve toward areas where user is deeply immersive to media just like reality rather than experience. Therefore, it is expected that the future displays, such as AR, holographic display, and light-field display, will allow more realistic stereoscopic regardless of the viewing position. In this respect, it is going to be vital to quantify QoE based on the human factor accompanied with the display. Currently, the display technology mentioned above is ongoing, and contents are produced by providers and producers with all their best efforts. Thus, the QoE issues keep being brought up at both industry and academic sides.
Recently, for more elaborate QoE control, displays perform scene understanding to augment visual content. Therefore, contextual QoE for the visualized space on the display is expected to play an important role in the future market. In addition, considering the perceptual factors of the device is expected to elevate technology to guarantee the viewing safety and satisfaction of the user.
B) Deep-learning approaches
As aforementioned, the deep CNN has emerged as a core technology while breaking most performance records in the area of QoE via intensive training in accordance with the dataset. Accordingly, there have been many attempts on the deep-learning technique to find out new factors without using prior information. For instance, in recent I/VQA works, the human visual sensitivity has been successfully investigated from the output of hidden nodes attained from the deep-learning mechanism, which enables to provide deep insight on how human perception is responsive to an input image [Reference Kim and Lee50,Reference Kim56,Reference Kim59,Reference Kim133].
How can this technology be more generally applied to future QoE metrics? Various deep-learning-based QoE applications could fall in the area of image/video, S3D, and VR contents. Due to the intricately involved visual factors, currently, no solid numerical definition has not been published yet, but it is expected that new QoE metrics will be developed by modeling the HVS similarly to the mechanism used for IQA works. For example, in VRSA, the distribution of the spatial texture has a great effect on the motion perception of the HVS. Thereby, it is expected that the motion component of an image and the weighting process of the human visual mechanism extracted from the deep model can be effectively applied to calculate the visually perceived QoE.
VII. CONCLUSION
In this paper, we have examined the QoE assessment and classification of existing displays (ie, 2D display, S3D display, and HMD device) from a comprehensive viewpoint. In addition, QoE assessment approaches that have been utilized in each display was introduced and benchmarked according to QoE types and applications. Based on this, it can be concluded that the objective QoE assessment has been played an influential role in the human satisfaction of the display.
In the future, we expect that a lot of QoE work will be actively accomplished in accordance with display type (i.e., AR, holographic display, and light-field display). Notably, content quality involved in human interaction will emerge as a new paradigm of QoE challenging issues. Toward this, the current valuable insights of image-processing techniques based on data-driven approach will play an important roll in the future.
ACKNOWLEDGMENTS
This work was supported by Samsung Research Funding Center of Samsung Electronics under Project Number SRFC-IT1702-08.
Woojae Kim received the B.S. degree in electronic engineering from Soongsil University, Korea, in 2015. He is currently pursuing the M.S. and Ph.D. degrees with the Multidimensional Insight Laboratory, Yonsei University. He was a Research Assistant under the guidance of Prof. Weisi Lin with the Laboratory for School of Computer Science and Engineering, Nanyang Technological University (NTU), Singapore in 2018. His research interests include image and video processing based on the human visual system, computer vision, and deep-learning.
Sewoong Ahn received the B.S. degree in fusion electronic engineering from Hanyang University, Korea, in 2015. He is currently pursuing the M.S. and Ph.D. degrees with the Multidimensional Insight Laboratory, Yonsei University. His research interests include 2D/3D image and video processing based on human visual system, 3D virtual reality, and deep-learning.
Anh-Duc Nguyen received the B.S degree in automatic control from the Hanoi University of Science and Technology, Vietnam in 2015.He is currently pursuing the M.S. and Ph.D. degrees with the Multidimensional Insight are computer vision, image/video analysis, and machine learning.
Jinwoo Kim received the B.S. degree in electrical and electronic from Hongik University, South Korea, in 2016. He is currently pursuing the M.S. and Ph.D. degree with the Multidimensional Insight Laboratory, Yonsei University. His research interests are in the area of quality assessment, computer vision, and machine learning.
Jaekyung Kim received the B.S. degree in electrical and electronic engineering from Yonsei University, Korea, in 2017. He is currently pursuing the M.S. and Ph.D. degrees with the Multidimensional Insight Laboratory, Yonsei University. His research interests include perceptual image/video/VR/AR processing, computational photography, and deep-learning.
Heeseok Oh received the B.S., M.S., and Ph.D. degrees in electrical and electronics engineering from Yonsei University, Korea, in 2010, 2012, and 2017, respectively. He is currently with ETRI, Korea. His current research interests include 2D/3D image and video processing based on human visual system, machine learning, and computational vision.
Sanghoon Lee received the B.S. degree from Yonsei University, Korea, in 1989, the M.S. degree from the KAIST, Korea, in 1991, and the Ph.D. degree from The University of Texas at Austin, Austin, TX, USA, in 2000, all in E.E. From 1991 to 1996, he was with Korea Telecom, Korea. From 1999 to 2002, he was with Lucent Technologies, NJ, USA. In 2003, he joined the Department of Electrical and Electronics Engineering, Yonsei University, as a Faculty Member, where he is currently a Full Professor. His current research interests include image/video quality assessment, computer vision, graphics, and multimedia communications. He has been currently serving as the Chair of the APSIPA IVM Technical Committee since 2018 and also the Chair of the IEEE P3333.1 Quality Assessment Working Group since 2011.


 Open access