


1 Introduction
Recently, ignition and burning of deuterium–tritium (DT) plasmas[ Reference Abu-Shawareb, Acree, Adams, Adams, Addis, Aden, Adrian, Afeyan, Aggleton and Aghaian1, Reference Kritcher, Zylstra, Weber, Hurricane, Callahan, Clark, Divol, Hinkel, Humbird, Jones, Lindl, Maclaren, Strozzi, Young, Allen, Bachmann, Baker, Braun, Brunton, Casey, Chapman, Choate, Dewald, Nicola, Edwards, Haan, Fehrenbach, Hohenberger, Kur, Kustowski, Kong, Landen, Larson, MacGowan, Marinak, Millot, Nikroo, Nora, Pak, Patel, Ralph, Ratledge, Rubery, Schlossberg, Sepke, Stadermann, Suratwala, Tommasini, Town, Woodworth, Wonterghem and Wild2] in the laboratory have been successively achieved in inertial confinement fusion (ICF)[ Reference Nuckolls, Wood, Thiessen and Zimmerman3] experiments conducted at the National Ignition Facility (NIF). This achievement has inspired worldwide research efforts in ICF, especially on higher heating efficiency and more stable operation of the ICF process to realize the dream of fusion energy for a carbon-free future world. Notably, the fast ignition (FI) approach[ Reference Tabak, Hammer, Glinsky, Kruer, Wilks, Woodworth, Campbell, Perry and Mason4], characterized by high heating efficiency with a relaxed requirement for symmetrical implosion, has garnered significant attention.
In the FI approach, a relativistic electron beam (REB) is generated by the picosecond laser pulse, and injected into the isochoric pre-compressed fuel core to raise its temperature rapidly. During the fast heating phase, the transport efficiency of the REB in high-density and degenerate plasmas is an inevitable challenge[
Reference Tabak, Clark, Hatchett, Key, Lasinski, Snavely, Wilks, Town, Stephens, Campbell, Kodama, Mima, Tanaka, Atzeni and Freeman5,
Reference Robinson, Strozzi, Davies, Gremillet, Honrubia, Johzaki, Kingham, Sherlock and Solodov6]. To enhance the efficiency of energy transport from the REB to the pre-compressed fuel, the REB must be injected sufficiently close to the high-density core of the fuel. However, the outward expansion of the ablation-induced corona displaces the critical density, where the REB is generated, further from the high-density core. To address this issue, the laser hole-boring scheme was initially proposed[
Reference Tabak, Hammer, Glinsky, Kruer, Wilks, Woodworth, Campbell, Perry and Mason4]. This approach uses a precursor pulse to create a plasma channel that allows the main pulse to reach the core[
Reference Pukhov and Meyer-ter Vehn7,
Reference Sentoku, Kruer, Matsuoka and Pukhov8]. However, due to filamentation instabilities[
Reference Tanaka, Allen, Pukhov, Kodama, Fujita, Kato, Kawasaki, Kitagawa, Mima, Morio, Shiraga, Iwata, Miyakoshi and Yamanaka9], various suppression mechanisms[
Reference Mulser and Schneider10] and other factors, the energy coupling efficiency of the hole-boring approach has been less than satisfactory. In addition, Kodama et al. [
Reference Kodama, Norreys, Mima, Dangor, Evans, Fujita, Kitagawa, Krushelnick, Miyakoshi, Miyanaga, Norimatsu, Rose, Shozaki, Shigemori, Sunahara, Tampo, Tanaka, Toyama, Yamanaka and Zepf11] proposed another scheme with a gold cone inserted into the DT pellet. In this scheme, the picosecond laser beams are injected into the gold cone, generating an REB at the cone tip deep in the fuel[
Reference Kodama, Norreys, Mima, Dangor, Evans, Fujita, Kitagawa, Krushelnick, Miyakoshi, Miyanaga, Norimatsu, Rose, Shozaki, Shigemori, Sunahara, Tampo, Tanaka, Toyama, Yamanaka and Zepf11,
Reference Stoeckl, Boehly, Delettrez, Hatchett, Frenje, Glebov, Li, Miller, Petrasso, Séguin, Smalyuk, Stephens, Theobald, Yaakobi and Sangster12]. Early experiments carried out at the Gekko XII laser facility[
Reference Kodama, Shiraga, Shigemori, Toyama, Fujioka, Azechi, Fujita, Habara, Hall, Izawa, Jitsuno, Kitagawa, Krushelnick, Lancaster, Mima, Nagai, Nakai, Nishimura, Norimatsu, Norreys, Sakabe, Tanaka, Youssef, Zepf and Yamanaka13] reported a more than $20\%$
heating efficiency. However, subsequent studies[
Reference Azechi, Mima, Shiraga, Fujioka, Nagatomo, Johzaki, Jitsuno, Key, Kodama, Koga, Kondo, Kawanaka, Miyanaga, Murakami, Nagai, Nakai, Nakamura, Nakamura, Nakazato, Nakao, Nishihara, Nishimura, Norimatsu, Norreys, Ozaki, Pasley, Sakagami, Sakawa, Sarukura, Shigemori, Shimizu, Sunahara, Taguchi, Tanaka, Tsubakimoto, Fujimoto, Homma and Iwamoto14–
Reference Kitagawa, Mori, Ishii, Hanayama, Okihara, Arikawa, Abe, Miura, Ozaki, Komeda, Suto, Umetani, Sunahra, Johzaki, Sakagami, Iwamoto, Sentoku, Nakajima, Sakata, Matsuo, Mirfayzi, Kawanaka, Fujiokua, Tsubakimoto, Shigemori, Yamanoi, Yogo, Nakao, Asano, Shiraga, Motohiro, Hioki and Azuma17] presented lower efficiency. More seriously, the gold cone may be deformed or damaged, before the arrival of picosecond laser beams, by the strong shocks from the imploded DT plasma[
Reference Stephens, Mclean, Theobald, Akli, Beg, Sentoku, Schumacher and Wei18, Reference Theobald, Solodov, Stoeckl, Anderson, Betti, Boehly, Craxton, Delettrez, Dorrer, Frenje, Glebov, Habara, Tanaka, Knauer, Lauck, Marshall, Marshall, Meyerhofer, Nilson, Patel, Chen, Sangster, Seka, Sinenian, Ma, Beg, Giraldez and Stephens19].
$20\%$
heating efficiency. However, subsequent studies[
Reference Azechi, Mima, Shiraga, Fujioka, Nagatomo, Johzaki, Jitsuno, Key, Kodama, Koga, Kondo, Kawanaka, Miyanaga, Murakami, Nagai, Nakai, Nakamura, Nakamura, Nakazato, Nakao, Nishihara, Nishimura, Norimatsu, Norreys, Ozaki, Pasley, Sakagami, Sakawa, Sarukura, Shigemori, Shimizu, Sunahara, Taguchi, Tanaka, Tsubakimoto, Fujimoto, Homma and Iwamoto14–
Reference Kitagawa, Mori, Ishii, Hanayama, Okihara, Arikawa, Abe, Miura, Ozaki, Komeda, Suto, Umetani, Sunahra, Johzaki, Sakagami, Iwamoto, Sentoku, Nakajima, Sakata, Matsuo, Mirfayzi, Kawanaka, Fujiokua, Tsubakimoto, Shigemori, Yamanoi, Yogo, Nakao, Asano, Shiraga, Motohiro, Hioki and Azuma17] presented lower efficiency. More seriously, the gold cone may be deformed or damaged, before the arrival of picosecond laser beams, by the strong shocks from the imploded DT plasma[
Reference Stephens, Mclean, Theobald, Akli, Beg, Sentoku, Schumacher and Wei18, Reference Theobald, Solodov, Stoeckl, Anderson, Betti, Boehly, Craxton, Delettrez, Dorrer, Frenje, Glebov, Habara, Tanaka, Knauer, Lauck, Marshall, Marshall, Meyerhofer, Nilson, Patel, Chen, Sangster, Seka, Sinenian, Ma, Beg, Giraldez and Stephens19].
Recently, the double-cone ignition (DCI) scheme[
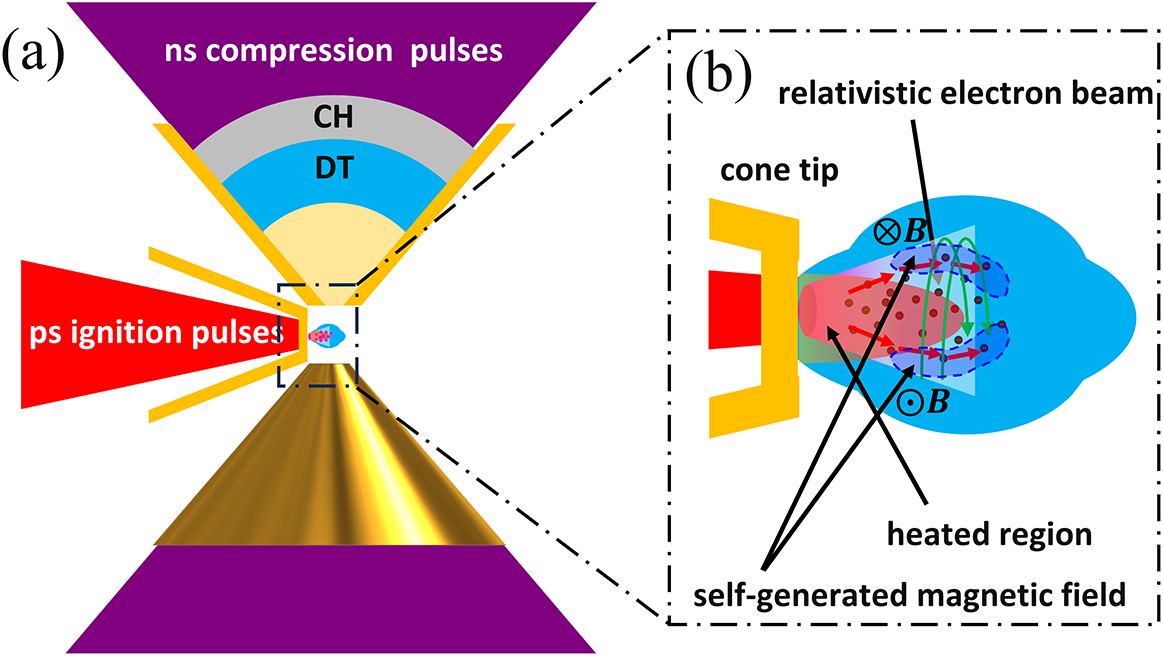
Reference Zhang, Wang, Yang, Wu, Ma, Jiao, Zhang, Wu, Yuan, Li and Zhu20], which averts the risk of cone breaking, was proposed, as shown in Figure 1(a). Two DT fuel shells are separately embedded in two head-on gold cones. Under the confinement and guidance of the cones, the shells are compressed and accelerated by carefully tailored nanosecond laser pulses to eject from the cone tips and finally collide head-to-head. Because of the confinement of the compression cones, the corona of the plasma jets is peeled off, forming a concentrically pre-heated plasma in isochoric distribution with sharp ends to the REB injection. Due to the insulation of the guiding cone, the heating cone for ignition is maintained out of exposure to the high-pressure plasma during the compression. When the two ejected plasma jets collide head-to-head, the density edge in the perpendicular direction is significantly sharp, features a shorter scale length to the core and provides a secure region for the heating cone with reduced risk of being damaged before the REB is generated[
Reference Liu, Wu, Zhang, Yuan, Zhang, Xu, Xue, Tian, Zhong and Zhang21]. This allows for efficient injection of the REB into the approximately $300\;\mathrm{g}/{\mathrm{cm}}^3$
high-density region.
$300\;\mathrm{g}/{\mathrm{cm}}^3$
high-density region.
(a) Schematic of the DCI scheme. (b) Detailed schematic for the structure of the colliding target and the transport of fast electrons in the REB.
In previous studies on the transport of REBs, the electromagnetic (EB) field was regarded as crucial to the quality of the REB, and received considerable attention[
Reference Robinson, Strozzi, Davies, Gremillet, Honrubia, Johzaki, Kingham, Sherlock and Solodov6,
Reference Norreys, Batani, Baton, Beg, Kodama, Nilson, Patel, Pérez, Santos, Scott, Tikhonchuk, Wei and Zhang22]. Taking advantage of self-generated EB fields[
Reference Davies23,
Reference Robinson and Sherlock24]
, composite materials with a gradient of resistivity were explored[
Reference Robinson and Sherlock24–
Reference Pérez, Debayle, Honrubia, Koenig, Batani, Baton, Beg, Benedetti, Chawla, Dorchies, Fourment, Galimberti, Gizzi, Gremillet, Heathcote, Higginson, Hulin, Jafer, Koester, Labate, Lancaster, MacKinnon, MacPhee, Nazarov, Nicolai, Pasley, Ramis, Richetta, Santos, Sgattoni, Spindloe, Vauzour, Vinci and Volpe27] to reduce the divergence of the REB. Special configurations of the cone tip were also proposed[
Reference Solodov, Betti, Anderson, Myatt, Theobald and Stoeckl28–
Reference Johzaki, Yoshitake, Endo, Kim, Fujioka, Nagatomo, Morita, Takizawa and Takemura31]. In the above researches, the density of plasma is relatively low, where the ohmic effect dominates the interaction between the REB and plasma. In the configuration of simulations[
Reference Solodov, Anderson, Betti, Gotcheva, Myatt, Delettrez, Skupsky, Theobald and Stoeckl32–
Reference Strozzi, Tabak, Larson, Divol, Kemp, Bellei, Marinak and Key34], for the sake of preservation of the cone tip, the REB sources are always set approximately $100\;\mu \mathrm{m}$
away from the most dense core, with the density of plasma gradually increasing from several
$100\;\mu \mathrm{m}$
away from the most dense core, with the density of plasma gradually increasing from several $\mathrm{g}/{\mathrm{cm}}^3$
to about
$\mathrm{g}/{\mathrm{cm}}^3$
to about $500\;\mathrm{g}/{\mathrm{cm}}^3$
, and the effect of self-generated EB fields is mainly reflected in this transit region.
$500\;\mathrm{g}/{\mathrm{cm}}^3$
, and the effect of self-generated EB fields is mainly reflected in this transit region.
By contrast, in the DCI scheme, the REB is directly injected into the high-density core. In such a regime, the collision effect between the REB and the background electrons is extremely significant. Moreover, as the DT fuel is heated up to thousands of electronvolts within several picoseconds, it is usually modelled as ideal plasma with a low Spitzer resistivity. Therefore, the effect of the EB field in high-density fuel used to be ignored. However, through our in-depth investigation we found that self-generated EB fields indeed play important roles, which are significantly enhanced by the quantum degeneracy effects.
In this paper, we conducted rigorous theoretical analyses and unprecedented simulations to investigate the transport of the REB in high-density, degenerate DT plasmas. Focusing on the transport of the REB, we model the colliding plasma as a uniform density region for simplicity, and the REB is directedly injected into the plasma. The theoretical findings demonstrate that due to influences of quantum degeneracy, where resistivity increases with rising temperature, there exists a rapid growth of the magnetic field as the REB is injected. Furthermore, we figured out the threshold for the occurrence of the self-organized pinching of the REB by the EB field. Via fully three-dimensional (3D) hybrid particle-in-cell (PIC) simulations, we observed an enhancement of the heating efficiency of the REB compared with previous intuitive expectation, as a result of the self-generated EB field in the high-density quantum degenerate plasma.
This paper is organized as follows. Section 2 theoretically derives the growth of the self-generated magnetic field, and analyzes the occurrence of the self-organized pinching. Section 3 presents the 3D hybrid PIC simulation results with a broad-spectrum diverging REB, and quantitatively compares the deposit efficiency of the REB between EB and non-EB cases, as well as the enhancement on the heating of DT plasma. In Section 4 our conclusions are presented .
2 Theoretical analysis of self-generated magnetic field for the high-density regime
2.1 Growth rate of self-generated magnetic field in dense, collision-dominated plasma
When an REB with the current density of ${\boldsymbol{j}}_{\mathrm{f}}$
is injected into the DT plasma along the
${\boldsymbol{j}}_{\mathrm{f}}$
is injected into the DT plasma along the $z$
-axis, the macroscopic electrical neutrality condition should be fulfilled, leading to the drifting of background particles. Since the DT ions have a mass thousands of times larger than the mass of electrons, the drifting of background ions by the interaction with the REB is relatively negligible, and the drifting current of background electrons is
$z$
-axis, the macroscopic electrical neutrality condition should be fulfilled, leading to the drifting of background particles. Since the DT ions have a mass thousands of times larger than the mass of electrons, the drifting of background ions by the interaction with the REB is relatively negligible, and the drifting current of background electrons is ${\boldsymbol{j}}_{\mathrm{b}}=-{\boldsymbol{j}}_{\mathrm{f}}$
. Since the thermal drift motion of the background electrons is much slower than that of the injected relativistic electrons (
${\boldsymbol{j}}_{\mathrm{b}}=-{\boldsymbol{j}}_{\mathrm{f}}$
. Since the thermal drift motion of the background electrons is much slower than that of the injected relativistic electrons ( ${v}_{\mathrm{e}}/{v}_{\mathrm{f}}\sim {10}^{-4}$
), the
${v}_{\mathrm{e}}/{v}_{\mathrm{f}}\sim {10}^{-4}$
), the $-{\boldsymbol{v}}_{\mathrm{e}}\times \boldsymbol{B}$
and
$-{\boldsymbol{v}}_{\mathrm{e}}\times \boldsymbol{B}$
and $-\nabla {P}_{\mathrm{e}}/{en}_{\mathrm{e}}$
terms in the generalized ohmic law are neglected, and an approximation of the electric field of
$-\nabla {P}_{\mathrm{e}}/{en}_{\mathrm{e}}$
terms in the generalized ohmic law are neglected, and an approximation of the electric field of $\boldsymbol{E}=\eta {\boldsymbol{j}}_{\mathrm{b}}$
is presented, where
$\boldsymbol{E}=\eta {\boldsymbol{j}}_{\mathrm{b}}$
is presented, where $\eta$
is the resistivity of the background electrons. In the practical case,
$\eta$
is the resistivity of the background electrons. In the practical case, ${\boldsymbol{j}}_{\mathrm{f}}$
of the injected REB is spatially nonuniform, and according to Faraday’s law, a magnetic field is generated with the growth of
${\boldsymbol{j}}_{\mathrm{f}}$
of the injected REB is spatially nonuniform, and according to Faraday’s law, a magnetic field is generated with the growth of $\partial \boldsymbol{B}/\partial t=-\mathbf{\nabla}\times \left(\eta {\boldsymbol{j}}_{\mathrm{b}}\right)=\mathbf{\nabla}\times \left(\eta {\boldsymbol{j}}_{\mathrm{f}}\right)$
. For a cylindrically symmetrical REB, neglecting the microscopic perturbations, the plasma is also assumed to be heated up symmetrically. Therefore, by noting
$\partial \boldsymbol{B}/\partial t=-\mathbf{\nabla}\times \left(\eta {\boldsymbol{j}}_{\mathrm{b}}\right)=\mathbf{\nabla}\times \left(\eta {\boldsymbol{j}}_{\mathrm{f}}\right)$
. For a cylindrically symmetrical REB, neglecting the microscopic perturbations, the plasma is also assumed to be heated up symmetrically. Therefore, by noting $\mid {\boldsymbol{j}}_{\mathrm{f}}\mid$
as
$\mid {\boldsymbol{j}}_{\mathrm{f}}\mid$
as $j(r)$
and
$j(r)$
and $\eta$
as
$\eta$
as $\eta (r)$
, the azimuthal derivation
$\eta (r)$
, the azimuthal derivation $\partial /\partial \theta$
vanishes. For simplicity, we assume that
$\partial /\partial \theta$
vanishes. For simplicity, we assume that ${\boldsymbol{j}}_{\mathrm{f}}$
is only along the
${\boldsymbol{j}}_{\mathrm{f}}$
is only along the $z$
-axis with a gradient along the
$z$
-axis with a gradient along the $r$
-axis. Under these assumptions, the growth rate of the azimuthal magnetic field can be expressed as follows:
$r$
-axis. Under these assumptions, the growth rate of the azimuthal magnetic field can be expressed as follows:
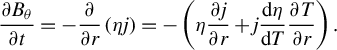 $$\begin{align}\frac{\partial {B}_{\theta }}{\partial t}=-\frac{\partial }{\partial r}\left(\eta j\right)=-\left(\eta \frac{\partial j}{\partial r}+j\frac{\mathrm{d}\eta }{\mathrm{d}T}\frac{\partial T}{\partial r}\right).\end{align}$$
According to Equation (1), the growth of the magnetic field is closely dependent on the competition between $\eta$
and
$\eta$
and $j\left(\mathrm{d}\eta /\mathrm{d}T\right)\left(\partial T/\partial r\right)$
, assuming that the background ions and electrons are in thermal equilibrium with the same
$j\left(\mathrm{d}\eta /\mathrm{d}T\right)\left(\partial T/\partial r\right)$
, assuming that the background ions and electrons are in thermal equilibrium with the same $T$
. For the first term, the power law of
$T$
. For the first term, the power law of $\eta \propto {T}^{\alpha }$
is applied, according to the degenerate limit of the Lee–More model and the classical Spitzer model, with
$\eta \propto {T}^{\alpha }$
is applied, according to the degenerate limit of the Lee–More model and the classical Spitzer model, with $\alpha =1$
and
$\alpha =1$
and $-3/2$
respectively representing the degenerate and classical state. For the second term,
$-3/2$
respectively representing the degenerate and classical state. For the second term, $\partial T/\partial r$
is determined by the heating efficiency:
$\partial T/\partial r$
is determined by the heating efficiency:
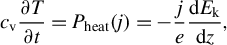 $$\begin{align}{c}_{\mathrm{v}}\frac{\partial T}{\partial t}={P}_{\mathrm{heat}}(j)=-\frac{j}{e}\frac{\mathrm{d}{E}_{\mathrm{k}}}{\mathrm{d}z},\end{align}$$
where ${c}_{\mathrm{v}}$
is the heat capacity of background plasma and
${c}_{\mathrm{v}}$
is the heat capacity of background plasma and ${P}_{\mathrm{heat}}$
is the heating power of the REB, related to the beam current density
${P}_{\mathrm{heat}}$
is the heating power of the REB, related to the beam current density $j$
and the stopping power
$j$
and the stopping power $\mathrm{d}{E}_{\mathrm{k}}/\mathrm{d}z$
. In this way,
$\mathrm{d}{E}_{\mathrm{k}}/\mathrm{d}z$
. In this way, $\partial T/\partial r$
is connected to
$\partial T/\partial r$
is connected to $\partial j/\partial r$
. A more intensive heating current density leads to the elevation of local temperature, inducing a gradient in
$\partial j/\partial r$
. A more intensive heating current density leads to the elevation of local temperature, inducing a gradient in $T$
with the same direction as
$T$
with the same direction as $j$
.
$j$
.
Detailed analysis of the stopping power $\mathrm{d}{E}_{\mathrm{k}}/\mathrm{d}z$
in Appendix A demonstrates that for an REB with the intensity of
$\mathrm{d}{E}_{\mathrm{k}}/\mathrm{d}z$
in Appendix A demonstrates that for an REB with the intensity of ${10}^{20}\;\mathrm{W}/{\mathrm{cm}}^2$
in the
${10}^{20}\;\mathrm{W}/{\mathrm{cm}}^2$
in the $300\;\mathrm{g}/{\mathrm{cm}}^3$
DT plasma, the collisional component in the stopping power is dominant. For the sake of simplicity and clarity in analytical derivation, the ohmic component in Equation (A1) is omitted in the calculation, focusing on the fundamental physics of the collisional cases. In this way, ignoring the minute changes of
$300\;\mathrm{g}/{\mathrm{cm}}^3$
DT plasma, the collisional component in the stopping power is dominant. For the sake of simplicity and clarity in analytical derivation, the ohmic component in Equation (A1) is omitted in the calculation, focusing on the fundamental physics of the collisional cases. In this way, ignoring the minute changes of $\ln {\Lambda}_{\mathrm{f}}$
, the stopping power
$\ln {\Lambda}_{\mathrm{f}}$
, the stopping power $\mathrm{d}{E}_{\mathrm{k}}/\mathrm{d}z$
is independent of
$\mathrm{d}{E}_{\mathrm{k}}/\mathrm{d}z$
is independent of $T$
, and hence Equation (2) is promptly simplified into a concise form
$T$
, and hence Equation (2) is promptly simplified into a concise form $T={T}_0+ jt/C$
, where
$T={T}_0+ jt/C$
, where ${T}_0$
is the initial temperature and
${T}_0$
is the initial temperature and $C$
is approximately regarded as a constant. In this way,
$C$
is approximately regarded as a constant. In this way, $\partial T/\partial r$
is equal to
$\partial T/\partial r$
is equal to $\left(t/C\right)\left(\partial j/\partial r\right)$
. Let
$\left(t/C\right)\left(\partial j/\partial r\right)$
. Let ${\eta}_0=\eta \left({T}_0\right)$
, and the growth rate of the magnetic field is calculated as follows:
${\eta}_0=\eta \left({T}_0\right)$
, and the growth rate of the magnetic field is calculated as follows:
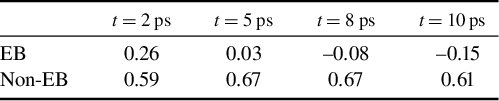
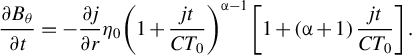 $$\begin{align}\frac{\partial {B}_{\theta }}{\partial t}=-\frac{\partial j}{\partial r}{\eta}_0{\left(1+\frac{jt}{CT_0}\right)}^{\alpha -1}\left[1+\left(\alpha +1\right)\frac{jt}{CT_0}\right].\end{align}$$
The effect of quantum degeneracy is important for the growth of the magnetic field. According to Equation (1), the growth of the self-generated magnetic field is related to both $\eta$
and
$\eta$
and $j$
. During the heating process, the temperature in the centre region with the highest intensity of the REB undergoes a more rapid increase. Therefore, in the degenerate plasma,
$j$
. During the heating process, the temperature in the centre region with the highest intensity of the REB undergoes a more rapid increase. Therefore, in the degenerate plasma, $\eta \propto T$
also holds its peak value in the centre region, with the same trend of gradient as
$\eta \propto T$
also holds its peak value in the centre region, with the same trend of gradient as $j$
, and the growth of the magnetic field is consequently promoted. By substituting
$j$
, and the growth of the magnetic field is consequently promoted. By substituting $\alpha =1$
into Equation (3), the growth of the magnetic field in the degenerate becomes the following:
$\alpha =1$
into Equation (3), the growth of the magnetic field in the degenerate becomes the following:
 $$\begin{align}\frac{\partial {B}_{\theta }}{\partial t}=-\frac{\partial j}{\partial r}{\eta}_0\left(1+2\frac{jt}{CT_0}\right),\end{align}$$
which means that $\partial {B}_{\theta }/\partial t$
is linear with respect to
$\partial {B}_{\theta }/\partial t$
is linear with respect to $t$
, indicating a quadratic growth of the magnetic field.
$t$
, indicating a quadratic growth of the magnetic field.
As for the classical $\eta \propto {T}^{-3/2}$
case, the two terms on the right-hand side (RHS) of Equation (1) possess different signs, and the growth of
$\eta \propto {T}^{-3/2}$
case, the two terms on the right-hand side (RHS) of Equation (1) possess different signs, and the growth of ${B}_{\theta }$
depends on the competition between
${B}_{\theta }$
depends on the competition between $\eta$
and
$\eta$
and $T\left(\mathrm{d}\eta /\mathrm{d}T\right)$
. Numerically, Equation (3) becomes the following:
$T\left(\mathrm{d}\eta /\mathrm{d}T\right)$
. Numerically, Equation (3) becomes the following:
 $$\begin{align}\frac{\partial {B}_{\theta }}{\partial t}=-\frac{\partial j}{\partial r}{\eta}_0{\left(1+\frac{jt}{CT_0}\right)}^{-5/2}\left(1-\frac{jt}{2{CT}_0}\right).\end{align}$$
When $jt/2{CT}_0>1$
, it is observed from Equation (5) that the sign of
$jt/2{CT}_0>1$
, it is observed from Equation (5) that the sign of $\partial {B}_{\theta }/\partial t$
is reversed. However, the
$\partial {B}_{\theta }/\partial t$
is reversed. However, the ${\left(1+ jt/{CT}_0\right)}^{-5/2}$
term decreases towards zero quickly with the power of
${\left(1+ jt/{CT}_0\right)}^{-5/2}$
term decreases towards zero quickly with the power of $-5/2$
, which retards the decline of
$-5/2$
, which retards the decline of ${B}_{\theta }$
.
${B}_{\theta }$
.
2.2 Numerical calculation of the self-generated magnetic field
In this section, a numerical calculation with practical parameters is presented, following the theoretical analysis in the previous section.
Firstly, a proper expression of $\eta$
is discussed. In many researches, to avoid divergence of the Spitzer model in the cool region, a constant scale value
$\eta$
is discussed. In many researches, to avoid divergence of the Spitzer model in the cool region, a constant scale value ${\eta}_{\mathrm{c}}$
was introduced by
${\eta}_{\mathrm{c}}$
was introduced by ${\eta}^{-1}={\eta}_{\mathrm{Sp}}^{-1}+{\eta}_{\mathrm{c}}^{-1}$
[
Reference Davies, Green and Norreys35,
Reference Gus’kov and Kuchugov36]. However, this approach eliminates the gradient of
${\eta}^{-1}={\eta}_{\mathrm{Sp}}^{-1}+{\eta}_{\mathrm{c}}^{-1}$
[
Reference Davies, Green and Norreys35,
Reference Gus’kov and Kuchugov36]. However, this approach eliminates the gradient of $\eta$
with respect to
$\eta$
with respect to $T$
in the degenerate regime. In this investigation, to align with Lee and More’s model[
Reference Lee and More37], with
$T$
in the degenerate regime. In this investigation, to align with Lee and More’s model[
Reference Lee and More37], with $\alpha =1$
for degenerated cases and
$\alpha =1$
for degenerated cases and $\alpha =-3/2$
for classical cases, a piece-wise approximation of
$\alpha =-3/2$
for classical cases, a piece-wise approximation of $\eta$
is applied as Equation (B1), as shown in Appendix B.
$\eta$
is applied as Equation (B1), as shown in Appendix B.
In the pursuit of rigour, this study has considered the influence of degeneracy effects on the heat capacity ${c}_{\mathrm{v}}$
. As is commonly known,
${c}_{\mathrm{v}}$
. As is commonly known, ${c}_{\mathrm{v}}$
in Equation (2) consists of the ion and electron heat capacities. Both heat capacities are equal to the classical value
${c}_{\mathrm{v}}$
in Equation (2) consists of the ion and electron heat capacities. Both heat capacities are equal to the classical value $\left(3/2\right)n$
in classical case, where
$\left(3/2\right)n$
in classical case, where $n={n}_{\mathrm{i}}={n}_{\mathrm{e}}$
is the number density of ions or electrons for fully ionized fuel. In the strongly degenerate state, however, the heat capacity is calculated by
$n={n}_{\mathrm{i}}={n}_{\mathrm{e}}$
is the number density of ions or electrons for fully ionized fuel. In the strongly degenerate state, however, the heat capacity is calculated by ${c}_{\mathrm{v}}=n\left(3/2+\mathrm{d}{\overline{\varepsilon}}_{\mathrm{e}}/\mathrm{d}T\right)$
, where
${c}_{\mathrm{v}}=n\left(3/2+\mathrm{d}{\overline{\varepsilon}}_{\mathrm{e}}/\mathrm{d}T\right)$
, where ${\overline{\varepsilon}}_{\mathrm{e}}=\int \varepsilon f\left(\varepsilon \right)\mathrm{d}\varepsilon$
is the average energy of the background electrons and
${\overline{\varepsilon}}_{\mathrm{e}}=\int \varepsilon f\left(\varepsilon \right)\mathrm{d}\varepsilon$
is the average energy of the background electrons and $f\left(\varepsilon \right)$
is the Fermi–Dirac distribution.
$f\left(\varepsilon \right)$
is the Fermi–Dirac distribution.
Now all the pre-works have been done, and we numerically solve Equation (1). After deriving Equation (3), with the symbolic constant $C$
being calculated along with Equations (A1) and (B1),
$C$
being calculated along with Equations (A1) and (B1), $T$
is then determined as a function of
$T$
is then determined as a function of $t$
and
$t$
and $j$
. Subsequently, this time-varying
$j$
. Subsequently, this time-varying $T$
is substituted back into Equation (B1) to calculate
$T$
is substituted back into Equation (B1) to calculate $\eta$
at a specific moment, as well as its derivative to temperature
$\eta$
at a specific moment, as well as its derivative to temperature $\mathrm{d}\eta /\mathrm{d}T$
. By incorporating
$\mathrm{d}\eta /\mathrm{d}T$
. By incorporating $\eta$
,
$\eta$
, $\mathrm{d}\eta /\mathrm{d}T$
and
$\mathrm{d}\eta /\mathrm{d}T$
and $\partial T/\partial r$
into Equation (1) and integrating both sides over time, the magnetic field
$\partial T/\partial r$
into Equation (1) and integrating both sides over time, the magnetic field ${B}_{\theta }$
is finally solved.
${B}_{\theta }$
is finally solved.
A specific model is constructed for analysis, which refers to typical parameters for ignition[
Reference Zhang, Wang, Yang, Wu, Ma, Jiao, Zhang, Wu, Yuan, Li and Zhu20,
Reference Li, Yang, Xu, Zhang, Zeng, Chen, Ma, Wu and Zhang38–
Reference Tao, Zheng, Jia, Yan and Zheng40]. The density of the DT plasma is chosen as a representative value of $300\;\mathrm{g}/{\mathrm{cm}}^3$
, with the Fermi temperature to be
$300\;\mathrm{g}/{\mathrm{cm}}^3$
, with the Fermi temperature to be ${T}_{\mathrm{F}}=629.17\;\mathrm{eV}$
. The beam number density follows a bell-shaped distribution
${T}_{\mathrm{F}}=629.17\;\mathrm{eV}$
. The beam number density follows a bell-shaped distribution ${n}_{\mathrm{f}}(r)={n}_{\mathrm{f}}(0)\exp \left(-{r}^2/{\sigma}^2\right)$
along the
${n}_{\mathrm{f}}(r)={n}_{\mathrm{f}}(0)\exp \left(-{r}^2/{\sigma}^2\right)$
along the $r$
-axis, with a peak value of
$r$
-axis, with a peak value of ${n}_{\mathrm{f}}(0)=2.5\times {10}^{22}\;{\mathrm{cm}}^{-3}$
and a waist of
${n}_{\mathrm{f}}(0)=2.5\times {10}^{22}\;{\mathrm{cm}}^{-3}$
and a waist of $\sigma =20\;\mu \mathrm{m}$
. Consequently, the current density is in form of
$\sigma =20\;\mu \mathrm{m}$
. Consequently, the current density is in form of $j(r)\approx {n}_{\mathrm{f}}(0) ec\exp \left(-{r}^2/{\sigma}^2\right)$
. For the simplicity of calculating the current density
$j(r)\approx {n}_{\mathrm{f}}(0) ec\exp \left(-{r}^2/{\sigma}^2\right)$
. For the simplicity of calculating the current density $j$
, we assume an idealized exponent kinetic energy spectrum
$j$
, we assume an idealized exponent kinetic energy spectrum $f(E)\propto \exp \left(-E/{E}_{\mathrm{k}_0}\right)$
for the REB, with
$f(E)\propto \exp \left(-E/{E}_{\mathrm{k}_0}\right)$
for the REB, with ${E}_{\mathrm{k}_0}=1.5\;\mathrm{MeV}$
, and the corresponding beam intensity integrating over the energy spectrum
${E}_{\mathrm{k}_0}=1.5\;\mathrm{MeV}$
, and the corresponding beam intensity integrating over the energy spectrum $E$
is
$E$
is $I(0)\approx {n}_{\mathrm{f}}(0){E}_{\mathrm{k}_0}c=2\times {10}^{20}\;\mathrm{W}/{\mathrm{cm}}^2$
. The profile of
$I(0)\approx {n}_{\mathrm{f}}(0){E}_{\mathrm{k}_0}c=2\times {10}^{20}\;\mathrm{W}/{\mathrm{cm}}^2$
. The profile of $j$
is assumed to be invariant, while the lateral movement will be discussed in the following.
$j$
is assumed to be invariant, while the lateral movement will be discussed in the following.
According to Equation (3), the growth rate $\partial {B}_{\theta }/\partial t$
is self-similar in scale to
$\partial {B}_{\theta }/\partial t$
is self-similar in scale to $jt/{CT}_0$
, and Figure 2 shows a typical calculation of
$jt/{CT}_0$
, and Figure 2 shows a typical calculation of ${B}_{\theta }$
and
${B}_{\theta }$
and $T$
at
$T$
at $r=\sigma$
. In the high-density regime, the primary contribution to heating the DT fuel is the collision effect between the fast electrons and background electrons, and
$r=\sigma$
. In the high-density regime, the primary contribution to heating the DT fuel is the collision effect between the fast electrons and background electrons, and $T$
is increased near-linearly. The green and yellow regions in Figure 2 roughly separate the degenerate and non-degenerate states by the Fermi temperature
$T$
is increased near-linearly. The green and yellow regions in Figure 2 roughly separate the degenerate and non-degenerate states by the Fermi temperature ${T}_{\mathrm{F}}$
. Notably, although the degenerate state lasts for merely a short time, less than
${T}_{\mathrm{F}}$
. Notably, although the degenerate state lasts for merely a short time, less than $1\;\mathrm{ps}$
, compared with the approximately
$1\;\mathrm{ps}$
, compared with the approximately $10\;\mathrm{ps}$
full fast heating process, the quadratic growth of
$10\;\mathrm{ps}$
full fast heating process, the quadratic growth of ${B}_{\theta }$
in the early degenerate stage is quite crucial. As the plasma is heated up and turns non-degenerate, the growth of
${B}_{\theta }$
in the early degenerate stage is quite crucial. As the plasma is heated up and turns non-degenerate, the growth of ${B}_{\theta }$
is decreasing as expected. However, the already generated
${B}_{\theta }$
is decreasing as expected. However, the already generated ${B}_{\theta }$
in the initial degenerate stage is still sustained for a long while, which leads to self-organized pinching of the REB.
${B}_{\theta }$
in the initial degenerate stage is still sustained for a long while, which leads to self-organized pinching of the REB.
Theoretical calculation of ${B}_{\theta }$
and
${B}_{\theta }$
and $T$
at the position of
$T$
at the position of $r=\sigma$
, for a bell-shaped REB with
$r=\sigma$
, for a bell-shaped REB with $I(0)=2\times {10}^{20}\;\mathrm{W}/{\mathrm{cm}}^2$
in
$I(0)=2\times {10}^{20}\;\mathrm{W}/{\mathrm{cm}}^2$
in $300\;\mathrm{g}/{\mathrm{cm}}^3,{T}_0=200\;\mathrm{eV}$
DT plasma. The green and yellow background colours indicate the degenerate and non-degenerate states, respectively.
$300\;\mathrm{g}/{\mathrm{cm}}^3,{T}_0=200\;\mathrm{eV}$
DT plasma. The green and yellow background colours indicate the degenerate and non-degenerate states, respectively.

2.3 Threshold for self-organized pinching
In the practical fast heating process, attention should be paid to the self-organized pinching of the REB. Due to the degenerate effect, the self-generated EB field rises rapidly to deflect and concentrate the REB. Consequently, the current density $j$
increases while the waist of the REB decreases, and hence
$j$
increases while the waist of the REB decreases, and hence $\partial j/\partial r$
in Equation (3) increases, accelerating the growth of the magnetic field. In turn, the boosted magnetic field further pinches the diverging fast electrons towards the centre. It should be clarified that the approximately
$\partial j/\partial r$
in Equation (3) increases, accelerating the growth of the magnetic field. In turn, the boosted magnetic field further pinches the diverging fast electrons towards the centre. It should be clarified that the approximately $10\;\mathrm{ps}$
time span of fast heating is insufficient for hydrodynamic effects of the background plasma to occur; therefore, this self-organized pinching is purely EB in nature.
$10\;\mathrm{ps}$
time span of fast heating is insufficient for hydrodynamic effects of the background plasma to occur; therefore, this self-organized pinching is purely EB in nature.
To determine the threshold at which the magnetic field will inevitably evolve into the pinching process, we outline an estimation of the required magnetic fields, in which the Larmor radius of fast electrons plays a key role, ${r}_{\mathrm{L}}=\gamma {m}_{\mathrm{e}}v/ eB$
, where
${r}_{\mathrm{L}}=\gamma {m}_{\mathrm{e}}v/ eB$
, where $\gamma$
is the Lorentz factor of the electron and
$\gamma$
is the Lorentz factor of the electron and $v$
is the corresponding velocity. For an REB out of the guiding gold cone tip, its divergence is modelled as a Gaussian function
$v$
is the corresponding velocity. For an REB out of the guiding gold cone tip, its divergence is modelled as a Gaussian function $f\left(\theta \right)\propto \exp \left(-{\theta}^2/{\theta}_0^2\right)$
characterized by
$f\left(\theta \right)\propto \exp \left(-{\theta}^2/{\theta}_0^2\right)$
characterized by ${\theta}_0$
[
Reference Robinson, Strozzi, Davies, Gremillet, Honrubia, Johzaki, Kingham, Sherlock and Solodov6,
Reference Debayle, Honrubia, d’Humieres and Tikhonchuk41]. It is essential that the transverse extension of the magnetic field along the
${\theta}_0$
[
Reference Robinson, Strozzi, Davies, Gremillet, Honrubia, Johzaki, Kingham, Sherlock and Solodov6,
Reference Debayle, Honrubia, d’Humieres and Tikhonchuk41]. It is essential that the transverse extension of the magnetic field along the $r$
direction, denoted as
$r$
direction, denoted as $L$
, should be at least equivalent to
$L$
, should be at least equivalent to ${r}_{\mathrm{L}}\left(1-\cos {\theta}_0\right)$
at a particular instant. Once the inequality
${r}_{\mathrm{L}}\left(1-\cos {\theta}_0\right)$
at a particular instant. Once the inequality
 $$\begin{align}{\int}_{\kern-5pt 0}^L{B}_{\theta }(r)\mathrm{d}r>\gamma \frac{m_{\mathrm{e}}v}{e}\left(1-\cos {\theta}_0\right)\end{align}$$
for pinching is fulfilled, most of the diverging electrons are deflected by the EB field, causing them to converge towards the beam centre. For a rough estimation, substituting $L=10\ \mu \mathrm{m}$
,
$L=10\ \mu \mathrm{m}$
, ${\theta}_0=30{}^{\circ}$
and
${\theta}_0=30{}^{\circ}$
and $\gamma =3.9$
(corresponding to
$\gamma =3.9$
(corresponding to $1.5\;\mathrm{MeV}$
) into Equation (6), a
$1.5\;\mathrm{MeV}$
) into Equation (6), a $10\;\mu \mathrm{m}$
scale of magnetic field with
$10\;\mu \mathrm{m}$
scale of magnetic field with $B>90\;\mathrm{T}$
is required, which is available under the parameter of theoretical calculation.
$B>90\;\mathrm{T}$
is required, which is available under the parameter of theoretical calculation.
3 Effects of three-dimensional hybrid particle-in-cell simulations on the transport of the broad-spectrum diverging relativistic electron beam
3.1 Introduction to LAPINS code and simulation settings
To examine the theoretical analysis, we conducted 3D3V hybrid PIC simulations with the LAPINS code[ Reference Wu, He, Yu and Fritzsche42– Reference Wu, Yu, Zhao, Hoffmann, Fritzsche and He45]. LAPINS is a hybrid PIC code compatible with simulation of degenerate and dense plasmas over a large scale by improving the interactions of collision and the EB field. Compared with conventional PIC codes, LAPINS modifies the kinetic equation to Boltzmann–Uhling–Uhlenbeck equations, where the Pauli exclusion principle is considered in collision terms. With this approach[ Reference Wu, Yu, Fritzsche and He44], Fermi–Dirac statistics are implemented to degenerate particles. Different from other hybrid PIC codes, in LAPINS code, the hydro method is only applied to solve the EB field, while the background electrons and ions are still treated as discrete particles. Hence, the collisions among ions, background electrons and injected electrons are self-consistently included through the Monte Carlo schemes [ Reference Nanbu and Yonemura46– Reference Pérez, Gremillet, Decoster, Drouin and Lefebvre48]. Benchmarks for the correctness of the collision module and range of fast electrons are presented in Appendix C.
The major configurations for simulation are listed as follows, referring to Refs. [Reference Zhang, Wang, Yang, Wu, Ma, Jiao, Zhang, Wu, Yuan, Li and Zhu20,Reference Li, Yang, Xu, Zhang, Zeng, Chen, Ma, Wu and Zhang38–Reference Tao, Zheng, Jia, Yan and Zheng40]. Due to the special sharp density edge in the DCI scheme, we assume that the REB is directly injected into the high-density isochoric plasma in our simulations. The density of DT plasma is $300\;\mathrm{g}/{\mathrm{cm}}^3,$
corresponding to a number density of
$300\;\mathrm{g}/{\mathrm{cm}}^3,$
corresponding to a number density of ${n}_{\mathrm{e}}={n}_{\mathrm{i}}=7.2\times {10}^{25}\;{\mathrm{cm}}^{-3}$
, and the initial temperature is
${n}_{\mathrm{e}}={n}_{\mathrm{i}}=7.2\times {10}^{25}\;{\mathrm{cm}}^{-3}$
, and the initial temperature is ${T}_0=200\;\mathrm{eV}$
. The REB is injected into the
${T}_0=200\;\mathrm{eV}$
. The REB is injected into the $300\;\mathrm{g}/{\mathrm{cm}}^3$
,
$300\;\mathrm{g}/{\mathrm{cm}}^3$
, $200\;\mathrm{eV}$
degenerate DT plasma. A complete distribution of the broad-spectrum, diverging and bell-shaped REB is written as follows:
$200\;\mathrm{eV}$
degenerate DT plasma. A complete distribution of the broad-spectrum, diverging and bell-shaped REB is written as follows:
 $$\begin{align}{n}_{\mathrm{f}}\left(r,{E}_{\mathrm{k}},\theta \right)\propto 2\pi r\exp \left(\!-\frac{r^2}{\sigma^2}\right)\exp \left(\!-\frac{\mid {E}_{\mathrm{k}}-1.5\;\mathrm{MeV}\mid }{1\;\mathrm{MeV}}\!\right)\exp \left(\!-\frac{\theta^2}{\theta_0^2}\!\right),\end{align}$$
where $\sigma =20\;\mu \mathrm{m}$
and
$\sigma =20\;\mu \mathrm{m}$
and ${\theta}_0=30{}^{\circ}$
. The total energy carried by the REB and injected into the system is
${\theta}_0=30{}^{\circ}$
. The total energy carried by the REB and injected into the system is $40\;\mathrm{kJ}$
, and the injection power is constant in the
$40\;\mathrm{kJ}$
, and the injection power is constant in the $10\;\mathrm{ps}$
simulation span. The fast electrons are real particles injected into the system at each time step, randomly assigning the r-position, kinetic energy and momentum according to Equation (7) and the total energy requirement. Therefore, the transport and stagnation process of the injected electrons is self-consistent.
$10\;\mathrm{ps}$
simulation span. The fast electrons are real particles injected into the system at each time step, randomly assigning the r-position, kinetic energy and momentum according to Equation (7) and the total energy requirement. Therefore, the transport and stagnation process of the injected electrons is self-consistent.
The size of simulation region is $120\;\mu \mathrm{m}\times 120\;\mu \mathrm{m}\times 100\;\mu \mathrm{m}$
with Cartesian coordinates, with the length of each meshgrid being
$120\;\mu \mathrm{m}\times 120\;\mu \mathrm{m}\times 100\;\mu \mathrm{m}$
with Cartesian coordinates, with the length of each meshgrid being $1\;\mu \mathrm{m}$
along the
$1\;\mu \mathrm{m}$
along the $x$
- and
$x$
- and $y$
-axes, and
$y$
-axes, and $0.5\;\mu \mathrm{m}$
along the
$0.5\;\mu \mathrm{m}$
along the $z$
-axis. The fields adhere to the periodic boundary condition, and the background ions and electrons adhere to the thermal boundary condition. In particular, the injected electrons apply the absorbing boundary. The time step
$z$
-axis. The fields adhere to the periodic boundary condition, and the background ions and electrons adhere to the thermal boundary condition. In particular, the injected electrons apply the absorbing boundary. The time step $\mathrm{d}t$
is set to be
$\mathrm{d}t$
is set to be $1.67\;\mathrm{fs}$
. The DT ions are equivalent to a virtual species of particle with a mass number of
$1.67\;\mathrm{fs}$
. The DT ions are equivalent to a virtual species of particle with a mass number of $A=2.5$
, and the nuclear fusion module is turned off. The particle per cell (ppc) values of background ions and electrons are both
$A=2.5$
, and the nuclear fusion module is turned off. The particle per cell (ppc) values of background ions and electrons are both $64$
. The REB is injected at
$64$
. The REB is injected at $z=0$
from the left-hand boundary of the simulation region. In each time step, the ppc of fast electrons generated in the boundary cell is 8. To ensure computation efficiency, an upper limit of
$z=0$
from the left-hand boundary of the simulation region. In each time step, the ppc of fast electrons generated in the boundary cell is 8. To ensure computation efficiency, an upper limit of $400$
is imposed on the ppc of fast electrons. A newly developed merging algorithm[
Reference Gonoskov49] is applied to the injected electrons, which simultaneously ensures the conservation of energy, momentum and current density, while decreasing the number of virtual particles to achieve greater computing speed.
$400$
is imposed on the ppc of fast electrons. A newly developed merging algorithm[
Reference Gonoskov49] is applied to the injected electrons, which simultaneously ensures the conservation of energy, momentum and current density, while decreasing the number of virtual particles to achieve greater computing speed.
3.2 Simulation results
The simulation results are presented in Figure 3. As shown in Figure 3(a), significant self-generated EB fields are generated in the high-density plasma. Clear illustration of the temporal evolution of the magnetic field profile is presented in Figures 4(a)–4(d). The ${B}_{\theta }$
exhibits a significant trend of pinching towards the centre like a pair of folded wings, with the field intensity in the ‘mid-wing’ region exceeding
${B}_{\theta }$
exhibits a significant trend of pinching towards the centre like a pair of folded wings, with the field intensity in the ‘mid-wing’ region exceeding $200\;\mathrm{T}$
. The extraordinarily large field intensity near the injection edge
$200\;\mathrm{T}$
. The extraordinarily large field intensity near the injection edge $z=0$
results from the overly idealized REB shape, whereas in reality the stacking and transverse spread of low-energy electrons would lessen the field. Hence, to focus on the self-organized pinching and to check with theoretical calculation, the maximum value of
$z=0$
results from the overly idealized REB shape, whereas in reality the stacking and transverse spread of low-energy electrons would lessen the field. Hence, to focus on the self-organized pinching and to check with theoretical calculation, the maximum value of ${B}_{\theta }$
is only collected within the region of
${B}_{\theta }$
is only collected within the region of $z>20\;\mu \mathrm{m}$
and
$z>20\;\mu \mathrm{m}$
and $r<30\;\mu \mathrm{m}$
, as is marked by the black dotted box in Figure 3(a).
$r<30\;\mu \mathrm{m}$
, as is marked by the black dotted box in Figure 3(a).
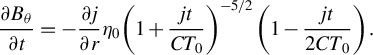
Snapshots of the transport of REB in DT plasma at $t=10\;\mathrm{ps}$
. (a) Deposition of injected electrons, vector schematic of self-generated magnetic field and profile of
$t=10\;\mathrm{ps}$
. (a) Deposition of injected electrons, vector schematic of self-generated magnetic field and profile of ${B}_{\theta }$
. (b)–(d) Profile of the distribution of deposited, injected electrons, electron temperature and ion temperature at
${B}_{\theta }$
. (b)–(d) Profile of the distribution of deposited, injected electrons, electron temperature and ion temperature at $x=0$
. For comparison, the bottom half part of (b)–(d) shows the non-EB simulation result, which turns off the EB field. To demonstrate the pinching of the self-generated EB field, the contours in (b) indicate the intensity distribution of the magnetic field
$x=0$
. For comparison, the bottom half part of (b)–(d) shows the non-EB simulation result, which turns off the EB field. To demonstrate the pinching of the self-generated EB field, the contours in (b) indicate the intensity distribution of the magnetic field ${B}_{\theta }$
, and the black quivers indicate the direction of the REB’s current density
${B}_{\theta }$
, and the black quivers indicate the direction of the REB’s current density $-{\boldsymbol{j}}_{\mathrm{f}}/\mid j\mid$
.
$-{\boldsymbol{j}}_{\mathrm{f}}/\mid j\mid$
.
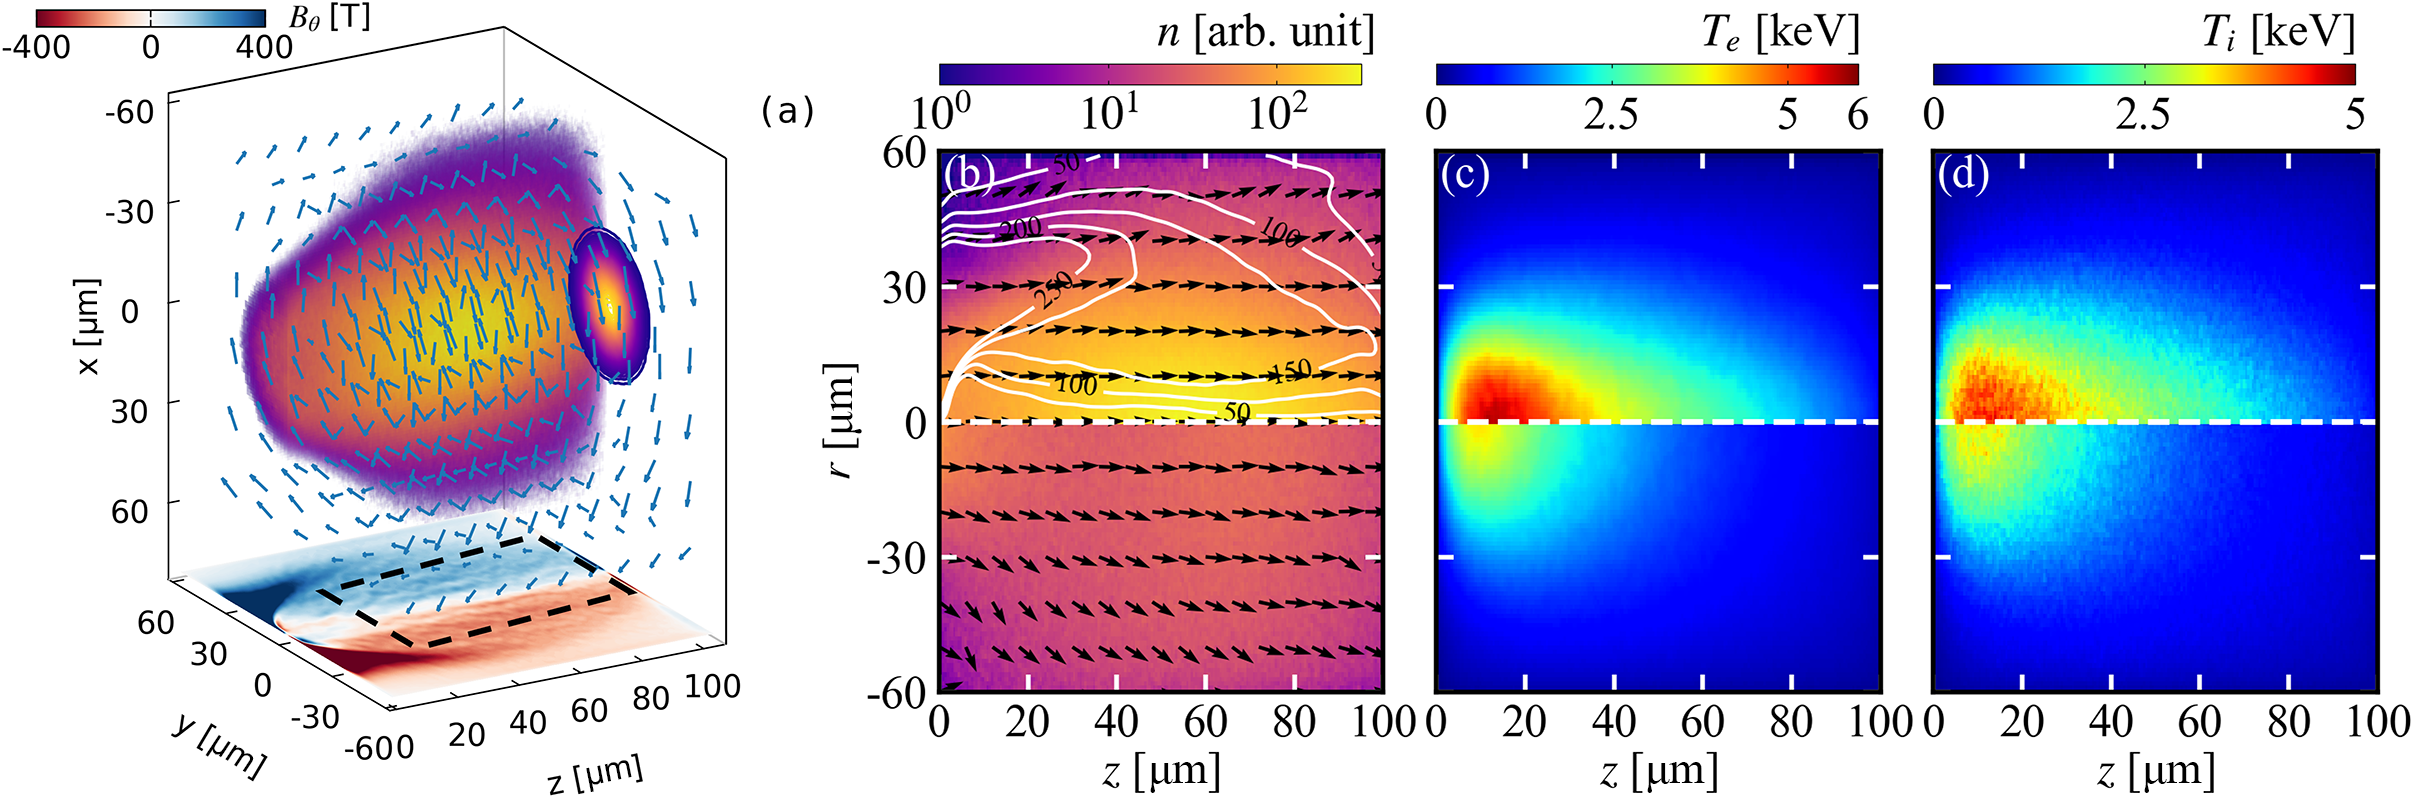
(a)–(d) Snapshots of the self-generated magnetic field ${B}_{\theta }$
at
${B}_{\theta }$
at $t=2\;\mathrm{ps}$
,
$t=2\;\mathrm{ps}$
, $5\;\mathrm{ps}$
,
$5\;\mathrm{ps}$
, $8\;\mathrm{ps}$
and
$8\;\mathrm{ps}$
and $10\;\mathrm{ps}$
in the EB case. The black arrows show the direction of the REB’s current density
$10\;\mathrm{ps}$
in the EB case. The black arrows show the direction of the REB’s current density $-{\boldsymbol{j}}_{\mathrm{f}}/\mid j\mid$
. (e)–(h) Full width at half maximum of the REB’s current density
$-{\boldsymbol{j}}_{\mathrm{f}}/\mid j\mid$
. (e)–(h) Full width at half maximum of the REB’s current density $j$
along the
$j$
along the $z$
-axis at the corresponding moment. The black dotted lines indicate the linear fitting result, with the slopes shown in Table 1.
$z$
-axis at the corresponding moment. The black dotted lines indicate the linear fitting result, with the slopes shown in Table 1.
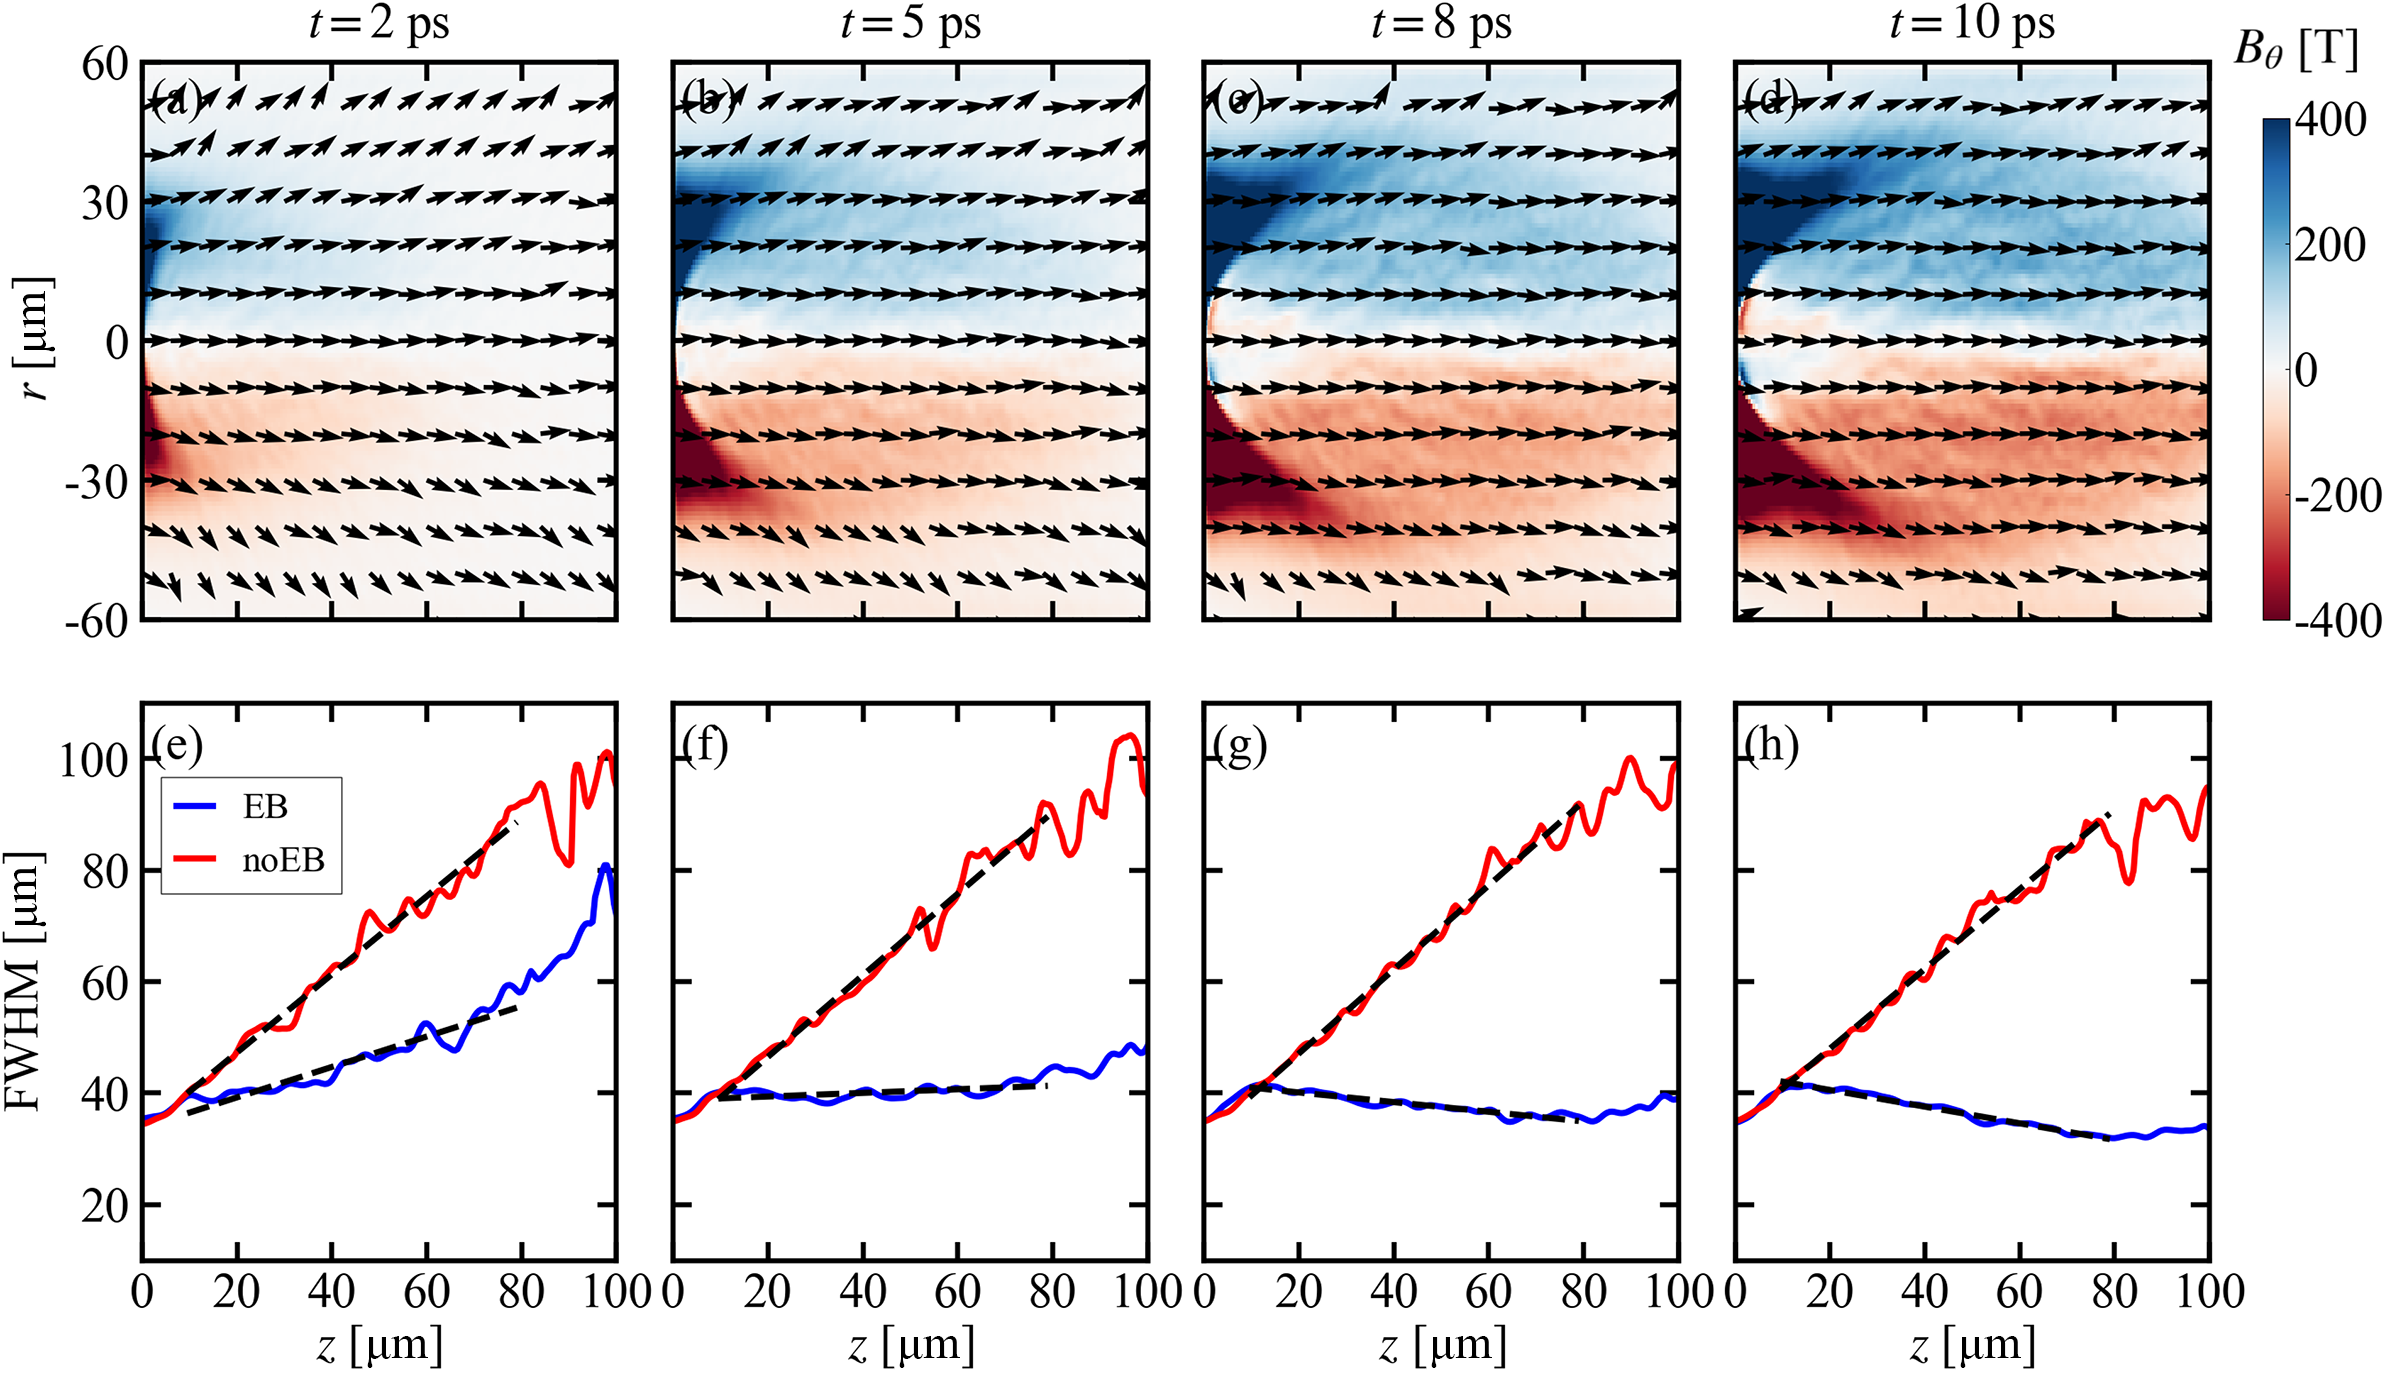
Linear fitting slope $\mathrm{d}\left({\mathrm{FWHM}}_{\mid j\mid}\right)/\mathrm{d}z$
according to Figures 4(e)–4(h). The region for least-square fitting is from
$\mathrm{d}\left({\mathrm{FWHM}}_{\mid j\mid}\right)/\mathrm{d}z$
according to Figures 4(e)–4(h). The region for least-square fitting is from $z=10\;\mu \mathrm{m}$
to
$z=10\;\mu \mathrm{m}$
to $z=80\;\mu \mathrm{m}$
.
$z=80\;\mu \mathrm{m}$
.
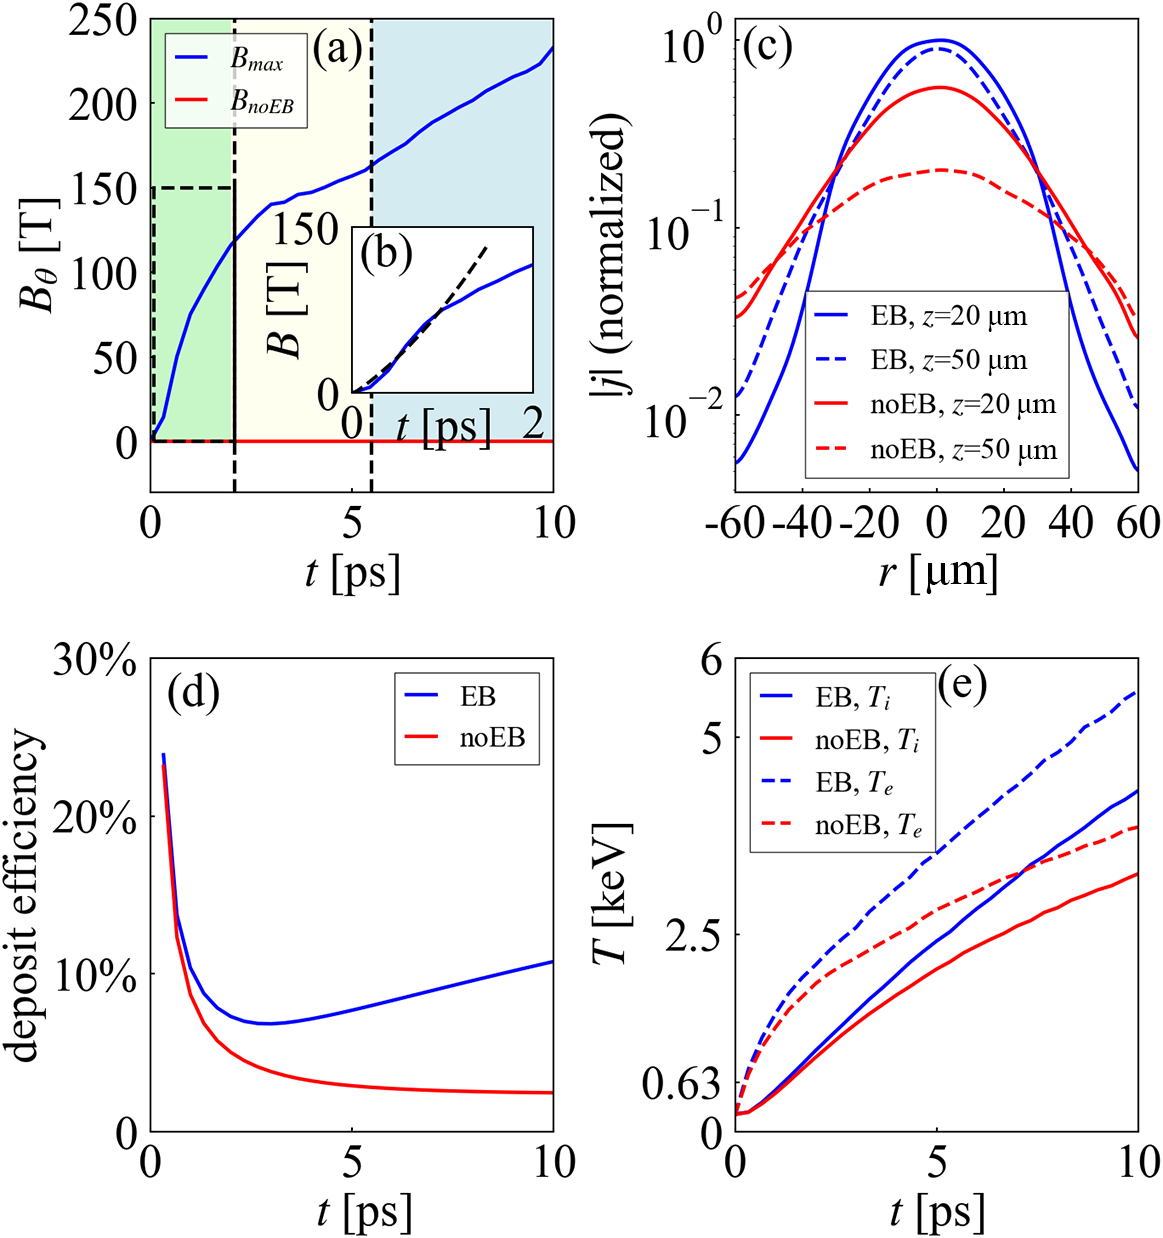
The growth line of maximum ${B}_{\theta }$
is illustrated in Figure 5(a). Due to the divergence of the REB, the equivalent current density along the
${B}_{\theta }$
is illustrated in Figure 5(a). Due to the divergence of the REB, the equivalent current density along the $z$
-axis is lower than that in the one-dimensional (1D) theoretical calculation. However, the simulation results match the theoretical trend well. In the first
$z$
-axis is lower than that in the one-dimensional (1D) theoretical calculation. However, the simulation results match the theoretical trend well. In the first $1\;\mathrm{ps}$
, when the peak temperature of the background electrons is still lower than
$1\;\mathrm{ps}$
, when the peak temperature of the background electrons is still lower than $1\;\mathrm{keV}$
and most of the system is in a degenerate state,
$1\;\mathrm{keV}$
and most of the system is in a degenerate state, ${B}_{\theta }$
increases quadratically, consistent with the prediction of Equation (3), and a considerable magnetic field of about
${B}_{\theta }$
increases quadratically, consistent with the prediction of Equation (3), and a considerable magnetic field of about $100\;\mathrm{T}$
is generated just in this instant. Then, the growth of
$100\;\mathrm{T}$
is generated just in this instant. Then, the growth of ${B}_{\theta }$
goes over the inflection point and slows down, as the plasma is heated up and becomes non-degenerated. Up to
${B}_{\theta }$
goes over the inflection point and slows down, as the plasma is heated up and becomes non-degenerated. Up to $t=5\;\mathrm{ps}$
, the line of
$t=5\;\mathrm{ps}$
, the line of ${B}_{\theta }$
in Figure 5(a) shows a high degree of similarity with the
${B}_{\theta }$
in Figure 5(a) shows a high degree of similarity with the $r=\sigma$
line in Figure 2(b). However, as the magnetic field increases to be strong enough to deflect diverging electrons to the centre, the self-organized pinching effect occurs to concentrate the REB, leading to a boosted increase in the EB field, with
$r=\sigma$
line in Figure 2(b). However, as the magnetic field increases to be strong enough to deflect diverging electrons to the centre, the self-organized pinching effect occurs to concentrate the REB, leading to a boosted increase in the EB field, with ${B}_{\theta }$
increasing from
${B}_{\theta }$
increasing from $150\;\mathrm{T}$
to nearly
$150\;\mathrm{T}$
to nearly $250\;\mathrm{T}$
in the subsequent
$250\;\mathrm{T}$
in the subsequent $5\;\mathrm{ps}$
of the heating process.
$5\;\mathrm{ps}$
of the heating process.
(a) Maximum value of ${B}_{\theta }$
within the statistical region shown in Figure 3(a). The stages of degenerate state, non-degenerate state and pinching are indicated by the green, yellow and blue background colours, respectively. (b) Detailed profile of
${B}_{\theta }$
within the statistical region shown in Figure 3(a). The stages of degenerate state, non-degenerate state and pinching are indicated by the green, yellow and blue background colours, respectively. (b) Detailed profile of ${B}_{\mathrm{max}}$
in the first
${B}_{\mathrm{max}}$
in the first $2\;\mathrm{ps}$
and the corresponding quadratic fitting line (the black dotted line). (c) Profile of
$2\;\mathrm{ps}$
and the corresponding quadratic fitting line (the black dotted line). (c) Profile of $\mid j\mid$
at
$\mid j\mid$
at $t=10\;\mathrm{ps}$
in EB and non-EB simulations along the
$t=10\;\mathrm{ps}$
in EB and non-EB simulations along the $r$
-axis, normalized by the maximum value of the blue solid line. (d) Deposit efficiency of the REB in EB and non-EB simulations. (e) Maximum values of
$r$
-axis, normalized by the maximum value of the blue solid line. (d) Deposit efficiency of the REB in EB and non-EB simulations. (e) Maximum values of ${T}_{\mathrm{i}}$
and
${T}_{\mathrm{i}}$
and ${T}_{\mathrm{e}}$
of plasma in EB and non-EB simulations.
${T}_{\mathrm{e}}$
of plasma in EB and non-EB simulations.
This magnetic field effectively concentrates the deposition of injected electrons. The top half of Figure 3(b), representing the EB case, shows a significantly denser deposition compared to the bottom half, which represents the non-EB case. The black arrows in Figure 3(b) represent the unit vector $-{\widehat{\boldsymbol{j}}}_{\mathrm{f}}=-{\boldsymbol{j}}_{\mathrm{f}}/\!\!\!\mid j\mid$
, indicating the flow direction of the REB. It is noted that in the top half the arrows predominantly point forward due to the collimating effect of the self-generated EB field, whereas in the bottom half, the arrows diverge as initially configured. The direction of the REB’s current density
$-{\widehat{\boldsymbol{j}}}_{\mathrm{f}}=-{\boldsymbol{j}}_{\mathrm{f}}/\!\!\!\mid j\mid$
, indicating the flow direction of the REB. It is noted that in the top half the arrows predominantly point forward due to the collimating effect of the self-generated EB field, whereas in the bottom half, the arrows diverge as initially configured. The direction of the REB’s current density $-{\widehat{\boldsymbol{j}}}_{\mathrm{f}}$
in the EB case is also plotted in Figures 4(a)–4(d). At
$-{\widehat{\boldsymbol{j}}}_{\mathrm{f}}$
in the EB case is also plotted in Figures 4(a)–4(d). At $t=2\;\mathrm{ps}$
,
$t=2\;\mathrm{ps}$
, $-{\widehat{\boldsymbol{j}}}_{\mathrm{f}}$
shows the typical divergence of the REB, as in the initial settings. However, as the magnetic field
$-{\widehat{\boldsymbol{j}}}_{\mathrm{f}}$
shows the typical divergence of the REB, as in the initial settings. However, as the magnetic field ${B}_{\theta }$
grows over
${B}_{\theta }$
grows over $100\;\mathrm{T}$
at
$100\;\mathrm{T}$
at $t=5\;\mathrm{ps}$
, the diverging trend is restrained, and
$t=5\;\mathrm{ps}$
, the diverging trend is restrained, and $-{\widehat{\boldsymbol{j}}}_{\mathrm{f}}$
is gradually collimated to the beam centre. When the simulation duration exceeds
$-{\widehat{\boldsymbol{j}}}_{\mathrm{f}}$
is gradually collimated to the beam centre. When the simulation duration exceeds $8\;\mathrm{ps}$
, most of the
$8\;\mathrm{ps}$
, most of the $-{\widehat{\boldsymbol{j}}}_{\mathrm{f}}$
arrows are pointed forward along the
$-{\widehat{\boldsymbol{j}}}_{\mathrm{f}}$
arrows are pointed forward along the $z$
-axis.
$z$
-axis.
The divergence of the REB can be characterized by the profile of current density $\mid j\mid$
along the z-axis. To attain the multiple relationship clearly,
$\mid j\mid$
along the z-axis. To attain the multiple relationship clearly, $\mid j\mid$
is normalized by the maximum of the counted profiles. As is shown in Figure 5(c),
$\mid j\mid$
is normalized by the maximum of the counted profiles. As is shown in Figure 5(c), $\mid j\mid$
has a broader profile in the non-EB case, and decreases rapidly as
$\mid j\mid$
has a broader profile in the non-EB case, and decreases rapidly as $z$
increases deeper into the plasma, which indicates that the injected electrons have been scattered and the REB is diverging. In contrast, due to the pinching of the self-generated EB field, the REB in the EB case still retains a considerable intensity even after transporting deeply to
$z$
increases deeper into the plasma, which indicates that the injected electrons have been scattered and the REB is diverging. In contrast, due to the pinching of the self-generated EB field, the REB in the EB case still retains a considerable intensity even after transporting deeply to $z=50\;\mu \mathrm{m}$
, and the waist expansion is minimal. In comprehensive consideration, the divergence of the REB during transport is quantified by
$z=50\;\mu \mathrm{m}$
, and the waist expansion is minimal. In comprehensive consideration, the divergence of the REB during transport is quantified by $\mathrm{d}\left({\mathrm{FWHM}}_{\mid j\mid}\right)/\mathrm{d}z$
, obtained through a least-squares fit from
$\mathrm{d}\left({\mathrm{FWHM}}_{\mid j\mid}\right)/\mathrm{d}z$
, obtained through a least-squares fit from $z=10\;\mu \mathrm{m}$
to
$z=10\;\mu \mathrm{m}$
to $80\;\mu \mathrm{m}$
, as shown in Figures 4(e) and 4(f). Due to the diverging angle
$80\;\mu \mathrm{m}$
, as shown in Figures 4(e) and 4(f). Due to the diverging angle ${\theta}_0$
in the initial settings and the collisional scattering, as shown by the red lines in the non-EB case,
${\theta}_0$
in the initial settings and the collisional scattering, as shown by the red lines in the non-EB case, ${\mathrm{FWHM}}_{\mid j\mid }$
broadens as
${\mathrm{FWHM}}_{\mid j\mid }$
broadens as $z$
increases. However, when considering the effect of the EB field, the profile of
$z$
increases. However, when considering the effect of the EB field, the profile of ${\mathrm{FWHM}}_{\mid j\mid }$
changes significantly. Even at
${\mathrm{FWHM}}_{\mid j\mid }$
changes significantly. Even at $t=2\;\mathrm{ps}$
in Figure 4(e), the blue line of the EB case exhibits a slower growth rate than the red line, which indicates a smaller diverging angle. At
$t=2\;\mathrm{ps}$
in Figure 4(e), the blue line of the EB case exhibits a slower growth rate than the red line, which indicates a smaller diverging angle. At $t=5\;\mathrm{ps}$
,
$t=5\;\mathrm{ps}$
, ${\mathrm{FWHM}}_{\mid j\mid }$
in the EB case no longer increases over z, and the REB has been collimated. As for
${\mathrm{FWHM}}_{\mid j\mid }$
in the EB case no longer increases over z, and the REB has been collimated. As for $t$
exceeding
$t$
exceeding $8\;\mathrm{ps}$
, the slope
$8\;\mathrm{ps}$
, the slope $\mathrm{d}\left({\mathrm{FWHM}}_{\mid j\mid}\right)/\mathrm{d}z$
turns negative, which means that the waist of the REB is shrinking over z, and the REB is pinched by the self-generated magnetic field.
$\mathrm{d}\left({\mathrm{FWHM}}_{\mid j\mid}\right)/\mathrm{d}z$
turns negative, which means that the waist of the REB is shrinking over z, and the REB is pinched by the self-generated magnetic field.
3.3 Analysis of the deposit efficiency of the REB and the enhancement of fast heating
The pinching of the REB significantly impacts the deposit of injected electrons. Figure 5(d) illustrates the deposit efficiency of the REB, which is defined as the ratio of the number of injected electrons deposited in the heating region to the total number of injected electrons in the REB. A high deposit efficiency indicates that more injected electrons deposit their energy in a localized region, making the most use of the energy of the REB. According to the profiles of electron and ion temperature shown in Figures 3(c) and 3(d), the heating region of the DT plasma has been estimated as a cylinder, with the lateral radius $r=\sqrt{x^2+{y}^2}$
being less than
$r=\sqrt{x^2+{y}^2}$
being less than $20\;\mu \mathrm{m}$
. It can be noted in Figure 5(d) that in both simulations, the deposit efficiency decreases over time in the beginning stage. However, the blue line representing the EB case increases after
$20\;\mu \mathrm{m}$
. It can be noted in Figure 5(d) that in both simulations, the deposit efficiency decreases over time in the beginning stage. However, the blue line representing the EB case increases after $t=3.5\;\mathrm{ps}$
, which means that more injected electrons are concentrated to the heating region by the large EB field and pinching. At
$t=3.5\;\mathrm{ps}$
, which means that more injected electrons are concentrated to the heating region by the large EB field and pinching. At $t=10\;\mathrm{ps}$
, the deposit efficiency is merely
$t=10\;\mathrm{ps}$
, the deposit efficiency is merely $2.46\%$
for the non-EB case, while it is
$2.46\%$
for the non-EB case, while it is $10.78\%$
for the EB case, showing a significant difference of more than
$10.78\%$
for the EB case, showing a significant difference of more than $8\%$
. Accordingly, the pinching is promotive for the concentrated deposit of the REB to form a localized hot spot for ignition.
$8\%$
. Accordingly, the pinching is promotive for the concentrated deposit of the REB to form a localized hot spot for ignition.
To directly demonstrate the effect of pinching on the ignition, the electron and ion temperatures of the DT plasma are also discussed. The top half of Figures 3(c) and 3(d), representing the EB case, shows a larger and hotter heated region, which extends deeper along the $z$
-axis. The increase of the maximum values of
$z$
-axis. The increase of the maximum values of ${T}_{\mathrm{e}}$
and
${T}_{\mathrm{e}}$
and ${T}_{\mathrm{i}}$
is shown in Figure 5(e). It can be observed that
${T}_{\mathrm{i}}$
is shown in Figure 5(e). It can be observed that ${T}_{\mathrm{i}}$
is always lower than
${T}_{\mathrm{i}}$
is always lower than ${T}_{\mathrm{e}}$
, since the heating of the DT ion is through relaxation with bulk electrons. A temperature difference between the EB and non-EB cases emerges after
${T}_{\mathrm{e}}$
, since the heating of the DT ion is through relaxation with bulk electrons. A temperature difference between the EB and non-EB cases emerges after $1\;\mathrm{ps}$
, when the field has grown beyond
$1\;\mathrm{ps}$
, when the field has grown beyond $100\;\mathrm{T}$
and begins to concentrate injected electrons. As the pinching effect intensifies, the temperature gap finally increases to
$100\;\mathrm{T}$
and begins to concentrate injected electrons. As the pinching effect intensifies, the temperature gap finally increases to $1\;\mathrm{keV}$
at
$1\;\mathrm{keV}$
at $t=10\;\mathrm{ps}$
, when
$t=10\;\mathrm{ps}$
, when ${T}_{\mathrm{i}}$
in the EB case has reached
${T}_{\mathrm{i}}$
in the EB case has reached $4.3\;\mathrm{keV}$
. To save computational resources, the nuclear reaction module is not included in simulations. If considering additional fusion α-particle heating from burning of the DT fuel, the sensitively
$4.3\;\mathrm{keV}$
. To save computational resources, the nuclear reaction module is not included in simulations. If considering additional fusion α-particle heating from burning of the DT fuel, the sensitively $T$
-dependent fusion reactivity in the EB case is nearly two orders of magnitude that in the non-EB case[
Reference Bosch and Hale50], and the gap of
$T$
-dependent fusion reactivity in the EB case is nearly two orders of magnitude that in the non-EB case[
Reference Bosch and Hale50], and the gap of ${T}_{\mathrm{i}}$
between EB and non-EB cases will be far more remarkable. It is expected that the entire heated region in the EB case would exceed
${T}_{\mathrm{i}}$
between EB and non-EB cases will be far more remarkable. It is expected that the entire heated region in the EB case would exceed $5\;\mathrm{keV}$
, forming a hot spot for ignition. Using the same estimation of the heating region as described in the last paragraph, and defining the heating efficiency as the increase of DT ion internal energy in the heated region divided by the total energy injected by the REB, the heating efficiency is
$5\;\mathrm{keV}$
, forming a hot spot for ignition. Using the same estimation of the heating region as described in the last paragraph, and defining the heating efficiency as the increase of DT ion internal energy in the heated region divided by the total energy injected by the REB, the heating efficiency is $11.69\%$
in the non-EB case and rises to
$11.69\%$
in the non-EB case and rises to $19.75\%$
in the EB case, which comes out as nearly a two-fold increase. This result indicates that the effect of the pinching and self-generated EB field in the high-density plasma has been significantly underestimated in previous studies.
$19.75\%$
in the EB case, which comes out as nearly a two-fold increase. This result indicates that the effect of the pinching and self-generated EB field in the high-density plasma has been significantly underestimated in previous studies.
4 Discussion and conclusions
During the transport of fast heating with an REB directly injected into dense and degenerate ( ${n}_{\mathrm{e}}\sim {10}^{25}\;{\mathrm{cm}}^{-3}$
,
${n}_{\mathrm{e}}\sim {10}^{25}\;{\mathrm{cm}}^{-3}$
, $T\sim 100\;\mathrm{eV}$
) plasma generated by the colliding of high-speed plasma jets from two gold cones, we investigate and reveal the significant effect of quantum degeneracy on the rapid growth of the self-generated EB field and the trigger for self-organized pinching, which were neglected in previous works. Due to the favourable spatial configuration of resistivity in the state of degeneracy, the self-generated EB field grows rapidly in the initial stage, and further promotes the concentration of the REB to deposit energy in a limited region. Enhancement of the deposition efficiency of the injected electrons has been observed in the 3D hybrid PIC simulation, and this consequently results in a two-fold heating effect for ignition. In addition, in researches on ultra-intense laser–solid interactions, energetic electron bunches are driven through strongly degenerate solid material or warm dense matter. Hence, the self-organized pinching is also intricately linked to the vast topic of ultra-intense laser-based applications, encompassing laser-driven ion acceleration[
Reference Ziegler, Göthel, Assenbaum, Bernert, Brack, Cowan, Dover, Gaus, Kluge, Kraft, Kroll, Metzkes-Ng, Nishiuchi, Prencipe, Püschel, Rehwald, Reimold, Schlenvoigt, Umlandt, Vescovi, Schramm and Zeil51,
Reference Nishiuchi, Dover, Hata, Sakaki, Kondo, Lowe, Miyahara, Kiriyama, Koga, Iwata, Alkhimova, Pirozhkov, Faenov, Pikuz, Sagisaka, Watanabe, Kando, Kondo, Ditter, Ettlinger, Hicks, Najmudin, Ziegler, Zeil, Schramm and Sentoku52], neutron sources[
Reference Gorlova, Zavorotny, Tsymbalov, Ivanov, Shulyapov, Volkov and Savel’ev53], THz radiation[
Reference Li, Li, Zhou, Wang, Du, Ding, Lin, Liu, Sheng, Peng, Chen, Ma, Lu, Wang, Wei and Zhang54,
Reference Herzer, Woldegeorgis, Polz, Reinhard, Almassarani, Beleites, Ronneberger, Grosse, Paulus, Hübner, May and Gopal55] and the creation of transient warm dense matter.
$T\sim 100\;\mathrm{eV}$
) plasma generated by the colliding of high-speed plasma jets from two gold cones, we investigate and reveal the significant effect of quantum degeneracy on the rapid growth of the self-generated EB field and the trigger for self-organized pinching, which were neglected in previous works. Due to the favourable spatial configuration of resistivity in the state of degeneracy, the self-generated EB field grows rapidly in the initial stage, and further promotes the concentration of the REB to deposit energy in a limited region. Enhancement of the deposition efficiency of the injected electrons has been observed in the 3D hybrid PIC simulation, and this consequently results in a two-fold heating effect for ignition. In addition, in researches on ultra-intense laser–solid interactions, energetic electron bunches are driven through strongly degenerate solid material or warm dense matter. Hence, the self-organized pinching is also intricately linked to the vast topic of ultra-intense laser-based applications, encompassing laser-driven ion acceleration[
Reference Ziegler, Göthel, Assenbaum, Bernert, Brack, Cowan, Dover, Gaus, Kluge, Kraft, Kroll, Metzkes-Ng, Nishiuchi, Prencipe, Püschel, Rehwald, Reimold, Schlenvoigt, Umlandt, Vescovi, Schramm and Zeil51,
Reference Nishiuchi, Dover, Hata, Sakaki, Kondo, Lowe, Miyahara, Kiriyama, Koga, Iwata, Alkhimova, Pirozhkov, Faenov, Pikuz, Sagisaka, Watanabe, Kando, Kondo, Ditter, Ettlinger, Hicks, Najmudin, Ziegler, Zeil, Schramm and Sentoku52], neutron sources[
Reference Gorlova, Zavorotny, Tsymbalov, Ivanov, Shulyapov, Volkov and Savel’ev53], THz radiation[
Reference Li, Li, Zhou, Wang, Du, Ding, Lin, Liu, Sheng, Peng, Chen, Ma, Lu, Wang, Wei and Zhang54,
Reference Herzer, Woldegeorgis, Polz, Reinhard, Almassarani, Beleites, Ronneberger, Grosse, Paulus, Hübner, May and Gopal55] and the creation of transient warm dense matter.
Based on this investigation, further perspective is proposed for practical implementations. To take advantage of the degeneracy, employing a non-exponential energy distribution on the REB, with a reduced proportion of low-energy electrons, is advantageous for fostering the pinching, since this approach prevents excessive heating of the plasma near the injection position. Moreover, the synergistic effect of the exerted assisting magnetic field[
Reference Wang, Gibbon, Sheng and Li56] along the $z$
-axis and the self-generated EB field is also worthwhile investigating in the future.
$z$
-axis and the self-generated EB field is also worthwhile investigating in the future.
There are still some limitations in this investigation. To simulate large-scale, high-density plasma while accounting for both binary collisions and EB fields, we employed a hybrid PIC algorithm[
Reference Wu, Yu, Fritzsche and He44]. However, this approach may overlook microscopic kinetic perturbations, such as filamentation of the REB. The idealized REB model used in the simulation causes a strong magnetic field near the injection edge, which is not supposed to occur in reality. In addition, we applied a piece-wise resistivity model in our theoretical analysis to qualitatively describe the quantum degeneracy effect and the self-organized pinching, while the resulting ${B}_{\theta }$
may quantitatively change as a more accurate description of resistivity is used.
${B}_{\theta }$
may quantitatively change as a more accurate description of resistivity is used.
Experimental validation is planned at the Shenguang II laser facility, where integrated experiments of the DCI scheme are conducted. Three electron spectrometers are planned to be positioned at different angles to the transport direction of the REB, to obtain the angular distribution of the escaping fast electrons passing through the dense plasma, which may provide valuable insights into the role of the EB field and quantum degeneracy in enhancing the heating efficiency of the REB.
Appendix A: Analysis of ohmic and collisional stopping power for high-density plasma
In this section a theoretical analysis of stopping power $\mathrm{d}{E}_{\mathrm{k}}/\mathrm{d}z$
for the transport of the REB in the high-density DT plasma is conducted. Referring to Ref. [Reference Gus’kov and Kuchugov36], in which a comprehensive stopping power model is displayed,
$\mathrm{d}{E}_{\mathrm{k}}/\mathrm{d}z$
for the transport of the REB in the high-density DT plasma is conducted. Referring to Ref. [Reference Gus’kov and Kuchugov36], in which a comprehensive stopping power model is displayed,
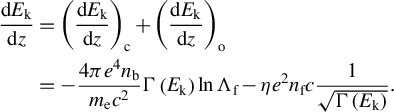 $$ \begin{align} \frac{\mathrm{d}{E}_{\mathrm{k}}}{\mathrm{d}z}&={\left(\frac{\mathrm{d}{E}_{\mathrm{k}}}{\mathrm{d}z}\right)}_{\mathrm{c}}+{\left(\frac{\mathrm{d}{E}_{\mathrm{k}}}{\mathrm{d}z}\right)}_{\mathrm{o}}\nonumber\\&=-\frac{4\pi {e}^4{n}_{\mathrm{b}}}{m_{\mathrm{e}}{c}^2}\Gamma \left({E}_{\mathrm{k}}\right)\ln {\Lambda}_{\mathrm{f}}-\eta {e}^2{n}_{\mathrm{f}}c\frac{1}{\sqrt{\Gamma \left({E}_{\mathrm{k}}\right)}}.\end{align} $$
In Equation (A1), the ohmic component ${\left(\mathrm{d}{E}_{\mathrm{k}}/\mathrm{d}z\right)}_{\mathrm{o}}$
represents the deceleration effect of the electric field of the return current[
Reference Davies23]. The electric field, equal to resistivity times current density,
${\left(\mathrm{d}{E}_{\mathrm{k}}/\mathrm{d}z\right)}_{\mathrm{o}}$
represents the deceleration effect of the electric field of the return current[
Reference Davies23]. The electric field, equal to resistivity times current density, $\boldsymbol{E}=\eta {\boldsymbol{j}}_{\mathrm{b}}=-\eta {\boldsymbol{j}}_{\mathrm{f}}$
, is generated to decelerate fast electrons, where
$\boldsymbol{E}=\eta {\boldsymbol{j}}_{\mathrm{b}}=-\eta {\boldsymbol{j}}_{\mathrm{f}}$
, is generated to decelerate fast electrons, where $\eta$
is the resistivity of the background electrons. Let
$\eta$
is the resistivity of the background electrons. Let $j=\ \mid {\boldsymbol{j}}_{\mathrm{f}}\mid$
, and the ohmic component is written as
$j=\ \mid {\boldsymbol{j}}_{\mathrm{f}}\mid$
, and the ohmic component is written as ${\left(\mathrm{d}{E}_{\mathrm{k}}/\mathrm{d}z\right)}_{\mathrm{o}}= e\eta j$
.
${\left(\mathrm{d}{E}_{\mathrm{k}}/\mathrm{d}z\right)}_{\mathrm{o}}= e\eta j$
.
Meanwhile, the injected fast electrons collide with the background electrons[
Reference Solodov and Betti57], also transforming directional kinetic energy into disordered thermal energy, which corresponds to the collisional component ${\left(\mathrm{d}{E}_{\mathrm{k}}/\mathrm{d}z\right)}_{\mathrm{c}}={\kappa}_0{n}_{\mathrm{i}}\left[{Z}_{\mathrm{i}}\ln {\Lambda}_{\mathrm{f}}+\left(Z-{Z}_{\mathrm{i}}\right)\ln {\Lambda}_{\mathrm{b}}\right]$
, where
${\left(\mathrm{d}{E}_{\mathrm{k}}/\mathrm{d}z\right)}_{\mathrm{c}}={\kappa}_0{n}_{\mathrm{i}}\left[{Z}_{\mathrm{i}}\ln {\Lambda}_{\mathrm{f}}+\left(Z-{Z}_{\mathrm{i}}\right)\ln {\Lambda}_{\mathrm{b}}\right]$
, where ${Z}_{\mathrm{i}}$
and
${Z}_{\mathrm{i}}$
and $Z-{Z}_{\mathrm{i}}$
are respectively the number of free and bound electrons,
$Z-{Z}_{\mathrm{i}}$
are respectively the number of free and bound electrons, $\ln {\Lambda}_{\mathrm{f}}$
and
$\ln {\Lambda}_{\mathrm{f}}$
and $\ln {\Lambda}_{\mathrm{b}}$
are respectively the Coulomb logarithms for collisions with free and bounded electrons and
$\ln {\Lambda}_{\mathrm{b}}$
are respectively the Coulomb logarithms for collisions with free and bounded electrons and ${\kappa}_0=4\pi {e}^4/{m}_{\mathrm{e}}{v}_{\mathrm{f}}^2$
is the stopping factor. For fully ionized DT plasma,
${\kappa}_0=4\pi {e}^4/{m}_{\mathrm{e}}{v}_{\mathrm{f}}^2$
is the stopping factor. For fully ionized DT plasma, ${Z}_{\mathrm{i}}=1$
and
${Z}_{\mathrm{i}}=1$
and $Z-{Z}_{\mathrm{i}}=0$
.
$Z-{Z}_{\mathrm{i}}=0$
.
In an FI scheme, fast electrons have an energy of ${E}_{\mathrm{k}}\sim \mathrm{MeV}$
; therefore,
${E}_{\mathrm{k}}\sim \mathrm{MeV}$
; therefore, ${v}_{\mathrm{f}}$
approximates to c, and a relativistic relationship
${v}_{\mathrm{f}}$
approximates to c, and a relativistic relationship ${v}_{\mathrm{f}}=c/\Gamma \left({E}_{\mathrm{k}}\right)$
is added to stopping power, where
${v}_{\mathrm{f}}=c/\Gamma \left({E}_{\mathrm{k}}\right)$
is added to stopping power, where $\Gamma \left({E}_{\mathrm{k}}\right)={\gamma}^2/\left({\gamma}^2-1\right)$
and
$\Gamma \left({E}_{\mathrm{k}}\right)={\gamma}^2/\left({\gamma}^2-1\right)$
and $\gamma =1+{E}_{\mathrm{k}}/{m}_{\mathrm{e}}{c}^2$
is the Lorentz factor.
$\gamma =1+{E}_{\mathrm{k}}/{m}_{\mathrm{e}}{c}^2$
is the Lorentz factor.
In the high-density regime of $\rho \sim 100\;\mathrm{g}/\mathrm{cm}^3$
, the collisional component
$\rho \sim 100\;\mathrm{g}/\mathrm{cm}^3$
, the collisional component ${\left(\mathrm{d}{E}_{\mathrm{k}}/\mathrm{d}z\right)}_{\mathrm{c}}$
proportional to
${\left(\mathrm{d}{E}_{\mathrm{k}}/\mathrm{d}z\right)}_{\mathrm{c}}$
proportional to ${n}_{\mathrm{e}}$
increases significantly. However, in many previous studies[
Reference Robinson, Strozzi, Davies, Gremillet, Honrubia, Johzaki, Kingham, Sherlock and Solodov6,
Reference Norreys, Batani, Baton, Beg, Kodama, Nilson, Patel, Pérez, Santos, Scott, Tikhonchuk, Wei and Zhang22–
Reference Robinson and Sherlock24], merely the ohmic component has been taken into account. To address this gap, the ratio of the ohmic component to the collisional component of
${n}_{\mathrm{e}}$
increases significantly. However, in many previous studies[
Reference Robinson, Strozzi, Davies, Gremillet, Honrubia, Johzaki, Kingham, Sherlock and Solodov6,
Reference Norreys, Batani, Baton, Beg, Kodama, Nilson, Patel, Pérez, Santos, Scott, Tikhonchuk, Wei and Zhang22–
Reference Robinson and Sherlock24], merely the ohmic component has been taken into account. To address this gap, the ratio of the ohmic component to the collisional component of ${E}_{\mathrm{k}}=1.5\;\mathrm{MeV}$
fast electrons is calculated. The number density of background electrons
${E}_{\mathrm{k}}=1.5\;\mathrm{MeV}$
fast electrons is calculated. The number density of background electrons ${n}_{\mathrm{e}}$
ranges from
${n}_{\mathrm{e}}$
ranges from ${10}^{24}$
to
${10}^{24}$
to ${10}^{26}\;{\mathrm{cm}}^{-3}$
, corresponding to the density of DT plasma
${10}^{26}\;{\mathrm{cm}}^{-3}$
, corresponding to the density of DT plasma $\rho$
ranging from 5 to
$\rho$
ranging from 5 to $500\;\mathrm{g}/\mathrm{cm}^3$
. The temperature is set to be the corresponding Fermi temperature of each density, where the resistivity is the greatest, indicating that
$500\;\mathrm{g}/\mathrm{cm}^3$
. The temperature is set to be the corresponding Fermi temperature of each density, where the resistivity is the greatest, indicating that ${\left(\mathrm{d}{E}_{\mathrm{k}}/\mathrm{d}z\right)}_{\mathrm{o}}$
reaches its maximum under the given density. Besides,
${\left(\mathrm{d}{E}_{\mathrm{k}}/\mathrm{d}z\right)}_{\mathrm{o}}$
reaches its maximum under the given density. Besides, ${\left(\mathrm{d}{E}_{\mathrm{k}}/\mathrm{d}z\right)}_{\mathrm{c}}\sim \ln {\Lambda}_{\mathrm{f}}\sim \ln \sqrt{T}$
is generally insensitive to the variation of temperature.
${\left(\mathrm{d}{E}_{\mathrm{k}}/\mathrm{d}z\right)}_{\mathrm{c}}\sim \ln {\Lambda}_{\mathrm{f}}\sim \ln \sqrt{T}$
is generally insensitive to the variation of temperature.
The calculation result is shown in Figure 6. The intensity of the REB is represented by $I\approx {n}_{\mathrm{f}}{E}_{\mathrm{k}}c,$
since
$I\approx {n}_{\mathrm{f}}{E}_{\mathrm{k}}c,$
since $\Gamma \left({E}_{\mathrm{k}}\right)$
tends to
$\Gamma \left({E}_{\mathrm{k}}\right)$
tends to $1$
on the scale of
$1$
on the scale of ${E}_{\mathrm{k}}\sim \mathrm{MeV}$
. According to Figure 6, the neglect of the collisional component is only applicable in the low-density regime, for instance, when
${E}_{\mathrm{k}}\sim \mathrm{MeV}$
. According to Figure 6, the neglect of the collisional component is only applicable in the low-density regime, for instance, when $\rho \sim 10\;\mathrm{g}/\mathrm{cm}^3$
and the ratio
$\rho \sim 10\;\mathrm{g}/\mathrm{cm}^3$
and the ratio $k={\left(\mathrm{d}{E}_{\mathrm{k}}/\mathrm{d}z\right)}_{\mathrm{o}}/{\left(\mathrm{d}{E}_{\mathrm{k}}/\mathrm{d}z\right)}_{\mathrm{c}}$
exceeds
$k={\left(\mathrm{d}{E}_{\mathrm{k}}/\mathrm{d}z\right)}_{\mathrm{o}}/{\left(\mathrm{d}{E}_{\mathrm{k}}/\mathrm{d}z\right)}_{\mathrm{c}}$
exceeds ${10}^2$
for an REB as intense as
${10}^2$
for an REB as intense as $I\sim {10}^{20}\;\mathrm{W}/{\mathrm{cm}}^2$
. However, in the high-density regime of plasma with
$I\sim {10}^{20}\;\mathrm{W}/{\mathrm{cm}}^2$
. However, in the high-density regime of plasma with $\rho >50\;\mathrm{g}/\mathrm{cm}^3$
,
$\rho >50\;\mathrm{g}/\mathrm{cm}^3$
, ${\left(\mathrm{d}{E}_{\mathrm{k}}/\mathrm{d}z\right)}_{\mathrm{c}}$
has become comparable to
${\left(\mathrm{d}{E}_{\mathrm{k}}/\mathrm{d}z\right)}_{\mathrm{c}}$
has become comparable to ${\left(\mathrm{d}{E}_{\mathrm{k}}/\mathrm{d}z\right)}_{\mathrm{o}}$
. Under the condition for ignition, with
${\left(\mathrm{d}{E}_{\mathrm{k}}/\mathrm{d}z\right)}_{\mathrm{o}}$
. Under the condition for ignition, with $\rho \sim 100\;\mathrm{g}/\mathrm{cm}^3$
and
$\rho \sim 100\;\mathrm{g}/\mathrm{cm}^3$
and $I\sim {10}^{20}\;\mathrm{W}/{\mathrm{cm}}^2$
, the ratio
$I\sim {10}^{20}\;\mathrm{W}/{\mathrm{cm}}^2$
, the ratio $k$
falls close to
$k$
falls close to $0.1$
, which indicates that the collisional component is nearly 10-fold the ohmic component, and dominates the stagnation of the REB.
$0.1$
, which indicates that the collisional component is nearly 10-fold the ohmic component, and dominates the stagnation of the REB.
Ratio of the ohmic component ${\left(\mathrm{d}{E}_{\mathrm{k}}/\mathrm{d}z\right)}_{\mathrm{o}}$
to the collision component
${\left(\mathrm{d}{E}_{\mathrm{k}}/\mathrm{d}z\right)}_{\mathrm{o}}$
to the collision component ${\left(\mathrm{d}{E}_{\mathrm{k}}/\mathrm{d}z\right)}_{\mathrm{c}}$
as a function of background DT plasma’s density
${\left(\mathrm{d}{E}_{\mathrm{k}}/\mathrm{d}z\right)}_{\mathrm{c}}$
as a function of background DT plasma’s density $\rho$
, under the corresponding Fermi temperature of each certain
$\rho$
, under the corresponding Fermi temperature of each certain $\rho .$
The blue, red and black solid lines represent the calculation results with the intensity of the REB
$\rho .$
The blue, red and black solid lines represent the calculation results with the intensity of the REB $I$
equal to
$I$
equal to $8\times {10}^{18}\;\mathrm{W}/{\mathrm{cm}}^2$
,
$8\times {10}^{18}\;\mathrm{W}/{\mathrm{cm}}^2$
, $2\times {10}^{19}\;\mathrm{W}/{\mathrm{cm}}^2$
and
$2\times {10}^{19}\;\mathrm{W}/{\mathrm{cm}}^2$
and $2\times {10}^{20}\;\mathrm{W}/{\mathrm{cm}}^2$
, respectively.
$2\times {10}^{20}\;\mathrm{W}/{\mathrm{cm}}^2$
, respectively.
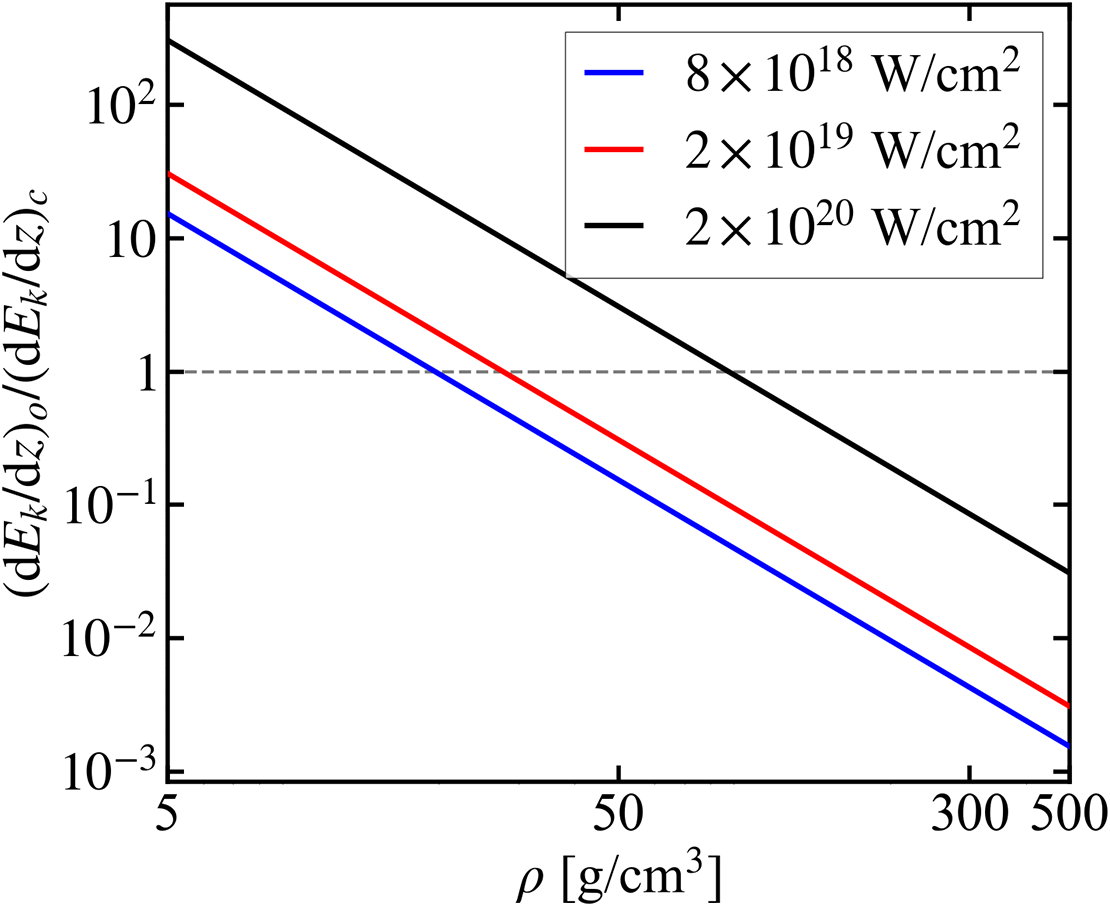
Appendix B: Analysis of the resistivity of degenerate plasma
In order to perform a concise analytical derivation, while representing the essence of quantum degeneracy, a proper piece-wise expression of $\eta$
is applied as follows:
$\eta$
is applied as follows:
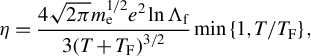 $$\begin{align}\eta =\frac{4\sqrt{2\pi }{m}_{\mathrm{e}}^{1/2}{e}^2\ln {\Lambda}_{\mathrm{f}}}{3{\left(T+{T}_{\mathrm{F}}\right)}^{3/2}}\min \left\{1,T/{T}_{\mathrm{F}}\right\},\end{align}$$
in which $4\sqrt{2\pi }{m}_{\mathrm{e}}^{1/2}{e}^2\ln {\Lambda}_{\mathrm{f}}/3{T}^{3/2}$
originates from the Spitzer model, with
$4\sqrt{2\pi }{m}_{\mathrm{e}}^{1/2}{e}^2\ln {\Lambda}_{\mathrm{f}}/3{T}^{3/2}$
originates from the Spitzer model, with $T$
substituted by
$T$
substituted by $T+{T}_{\mathrm{F}}$
accounting for the quantum degeneracy effect, where
$T+{T}_{\mathrm{F}}$
accounting for the quantum degeneracy effect, where ${T}_{\mathrm{F}}=\left({\mathrm{\hslash}}^2/2{m}_{\mathrm{e}}\right)\cdot {\left(3{\pi}^2{n}_{\mathrm{e}}\right)}^{2/3}$
is the Fermi temperature. In this paper, the Boltzmann constant
${T}_{\mathrm{F}}=\left({\mathrm{\hslash}}^2/2{m}_{\mathrm{e}}\right)\cdot {\left(3{\pi}^2{n}_{\mathrm{e}}\right)}^{2/3}$
is the Fermi temperature. In this paper, the Boltzmann constant ${k}_{\mathrm{B}}$
is omitted, and temperature also possesses the dimension of energy. The Coulomb logarithm is defined as
${k}_{\mathrm{B}}$
is omitted, and temperature also possesses the dimension of energy. The Coulomb logarithm is defined as $\ln {\Lambda}_{\mathrm{f}}=\max \left\{\ln \left(1+{\lambda}_{\mathrm{D}}/b\right),2\right\},$
where
$\ln {\Lambda}_{\mathrm{f}}=\max \left\{\ln \left(1+{\lambda}_{\mathrm{D}}/b\right),2\right\},$
where ${\lambda}_{\mathrm{D}}^{-2}=\sqrt{\lambda_{\mathrm{De}}^{-2}+{\lambda}_{\mathrm{Di}}^{-2}}$
is the Debye length and
${\lambda}_{\mathrm{D}}^{-2}=\sqrt{\lambda_{\mathrm{De}}^{-2}+{\lambda}_{\mathrm{Di}}^{-2}}$
is the Debye length and $b=\max \left\{{e}^2/{m}_{\mathrm{e}}{v}_{\mathrm{th}}^2,\ \mathrm{\hslash}/{m}_{\mathrm{e}}{v}_{\mathrm{th}}\right\}.$
The expressions for
$b=\max \left\{{e}^2/{m}_{\mathrm{e}}{v}_{\mathrm{th}}^2,\ \mathrm{\hslash}/{m}_{\mathrm{e}}{v}_{\mathrm{th}}\right\}.$
The expressions for ${\lambda}_{\mathrm{De}}$
and
${\lambda}_{\mathrm{De}}$
and ${\lambda}_{\mathrm{Di}}$
are given by
${\lambda}_{\mathrm{Di}}$
are given by ${\lambda}_{\mathrm{De}}=\sqrt{\left(T+{T}_{\mathrm{F}}\right)/4\pi {n}_{\mathrm{e}}{e}^2}$
and
${\lambda}_{\mathrm{De}}=\sqrt{\left(T+{T}_{\mathrm{F}}\right)/4\pi {n}_{\mathrm{e}}{e}^2}$
and ${\lambda}_{\mathrm{Di}}=\sqrt{T/4\pi {n}_{\mathrm{i}}{e}^2}$
, respectively. For fully ionized DT plasma, the number density of ions
${\lambda}_{\mathrm{Di}}=\sqrt{T/4\pi {n}_{\mathrm{i}}{e}^2}$
, respectively. For fully ionized DT plasma, the number density of ions ${n}_{\mathrm{i}}$
is equal to
${n}_{\mathrm{i}}$
is equal to ${n}_{\mathrm{e}}$
. A curve for the resistivity of
${n}_{\mathrm{e}}$
. A curve for the resistivity of $300\;\mathrm{g}/{\mathrm{cm}}^3$
DT plasma is displayed in Figure 7.
$300\;\mathrm{g}/{\mathrm{cm}}^3$
DT plasma is displayed in Figure 7.
Resistivity (in Gaussian units) of $300\;\mathrm{g}/{\mathrm{cm}}^3$
DT plasma in the classical Spitzer model, and the Lee–More model in the form of Equation (B1). The upper limit
$300\;\mathrm{g}/{\mathrm{cm}}^3$
DT plasma in the classical Spitzer model, and the Lee–More model in the form of Equation (B1). The upper limit ${\eta}_{\mathrm{max}}$
is shown by the black dotted line. The
${\eta}_{\mathrm{max}}$
is shown by the black dotted line. The $\eta$
in LAPINS code is depicted as scatters of black diamonds.
$\eta$
in LAPINS code is depicted as scatters of black diamonds.
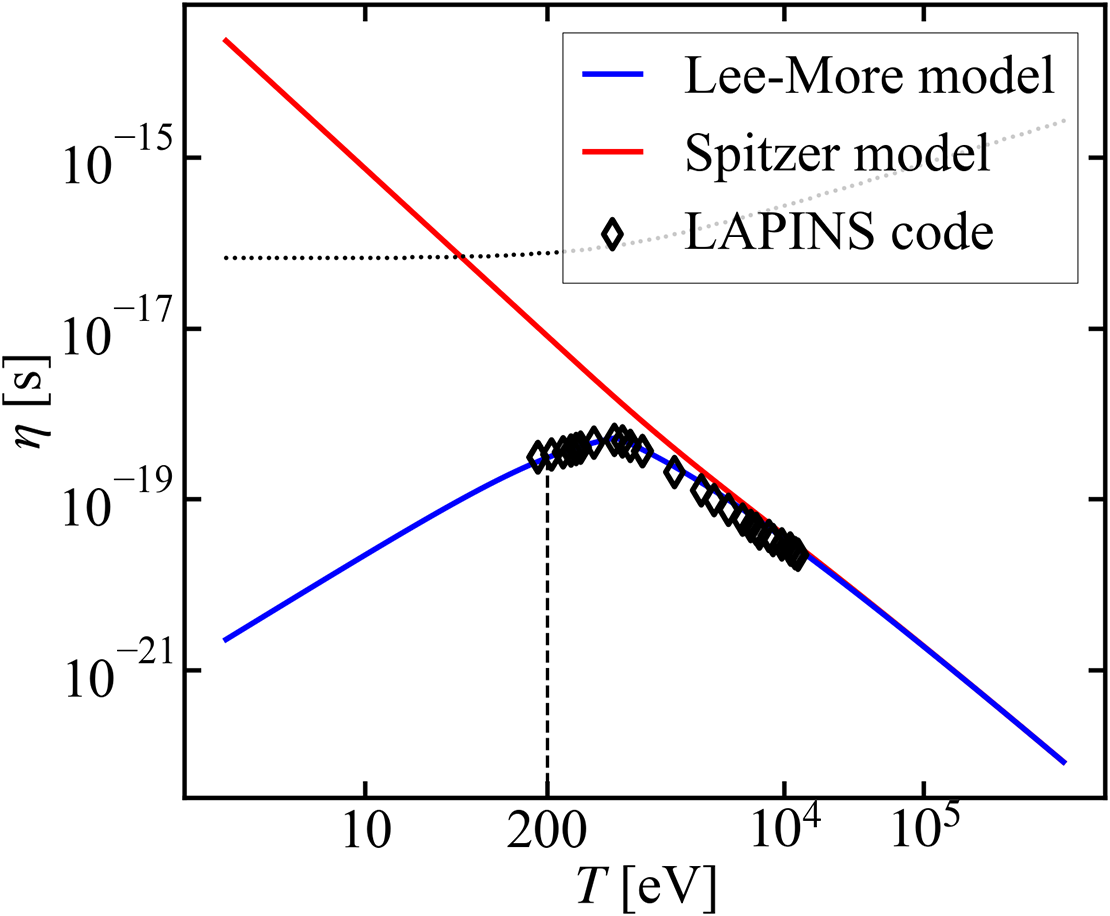
Regarding the upper limit of collision frequency ${\nu}_{\mathrm{max}}$
, the mean free path
${\nu}_{\mathrm{max}}$
, the mean free path ${\lambda}_{\mathrm{mfp}}={v}_{\mathrm{th}}/{\nu}_{\mathrm{max}}$
of the electrons, where
${\lambda}_{\mathrm{mfp}}={v}_{\mathrm{th}}/{\nu}_{\mathrm{max}}$
of the electrons, where ${v}_{\mathrm{th}}=\sqrt{3\left(T+{T}_{\mathrm{F}}\right)/{m}_{\mathrm{e}}}$
is the thermal velocity, should exceed the inter-atomic distance
${v}_{\mathrm{th}}=\sqrt{3\left(T+{T}_{\mathrm{F}}\right)/{m}_{\mathrm{e}}}$
is the thermal velocity, should exceed the inter-atomic distance ${R}_0={\left(4\pi {n}_{\mathrm{e}}/3\right)}^{-1/3}$
[
Reference Faussurier and Blancard58,
Reference Wetta and Pain59]. The upper limit of resistivity in the Drude model,
${R}_0={\left(4\pi {n}_{\mathrm{e}}/3\right)}^{-1/3}$
[
Reference Faussurier and Blancard58,
Reference Wetta and Pain59]. The upper limit of resistivity in the Drude model, ${\eta}_{\mathrm{max}}={m}_{\mathrm{e}}{\nu}_{\mathrm{max}}/{e}^2{n}_{\mathrm{e}}$
, is also illustrated in Figure 7. In the dense regime of
${\eta}_{\mathrm{max}}={m}_{\mathrm{e}}{\nu}_{\mathrm{max}}/{e}^2{n}_{\mathrm{e}}$
, is also illustrated in Figure 7. In the dense regime of $300\;\mathrm{g}/{\mathrm{cm}}^3$
for DT plasma, the expression in Equation (B1) is reasonable, as it is always below the upper limit.
$300\;\mathrm{g}/{\mathrm{cm}}^3$
for DT plasma, the expression in Equation (B1) is reasonable, as it is always below the upper limit.
Appendix C: Benchmark of the range of fast electrons with LAPINS code
The Monte Carlo method[
Reference Nanbu and Yonemura46–
Reference Pérez, Gremillet, Decoster, Drouin and Lefebvre48,
Reference Mishra, Leblanc, Sentoku, Wei and Beg60] is applied in the collision algorithm, and the accuracy of the collision module has been checked for simulations. The collision algorithm in LAPINS code is based on the work of Pérez et al. [
Reference Pérez, Gremillet, Decoster, Drouin and Lefebvre48]. To validate the correctness of the theoretical analysis, a 1D benchmark of the range of $1.5\;\mathrm{MeV}$
monoenergetic REB in
$1.5\;\mathrm{MeV}$
monoenergetic REB in $300\;\mathrm{g}/{\mathrm{cm}}^3$
and
$300\;\mathrm{g}/{\mathrm{cm}}^3$
and $5\;\mathrm{keV}$
DT plasma has been carried out. As shown in Figure 8, the results correspond well to the theory developed by Solodov and Betti[
Reference Solodov and Betti57]. As a supplement to the argument in Ref. [Reference Pérez, Gremillet, Decoster, Drouin and Lefebvre48] regarding the SK numerical algorithm[
Reference Sentoku and Kemp47], it is noted that the alternation between the centre mass frame and the one particle at the rest frame is inaccurate even on condition that one of the colliding particles is non-relativistic in the laboratory frame. This may lead to an incorrect estimation of the range of relativistic electrons, and this deviation is also observed in the open source PIC code EPOCH.
$5\;\mathrm{keV}$
DT plasma has been carried out. As shown in Figure 8, the results correspond well to the theory developed by Solodov and Betti[
Reference Solodov and Betti57]. As a supplement to the argument in Ref. [Reference Pérez, Gremillet, Decoster, Drouin and Lefebvre48] regarding the SK numerical algorithm[
Reference Sentoku and Kemp47], it is noted that the alternation between the centre mass frame and the one particle at the rest frame is inaccurate even on condition that one of the colliding particles is non-relativistic in the laboratory frame. This may lead to an incorrect estimation of the range of relativistic electrons, and this deviation is also observed in the open source PIC code EPOCH.
Benchmark of the range of the $1.5\;\mathrm{MeV}$
REB in
$1.5\;\mathrm{MeV}$
REB in $300\;\mathrm{g}/{\mathrm{cm}}^3$
and
$300\;\mathrm{g}/{\mathrm{cm}}^3$
and $5\;\mathrm{keV}$
DT plasma. The blue solid line is the fitting curve given by Solodov and Betti[
Reference Solodov and Betti57]. The diamonds represent the result of LAPINS code, applying the algorithm of Pérez et al. [
Reference Pérez, Gremillet, Decoster, Drouin and Lefebvre48], with red diamonds indicating a dynamic Debye length. The black dots represent the result applying the algorithm of Sentoku and Kemp[
Reference Sentoku and Kemp47].
$5\;\mathrm{keV}$
DT plasma. The blue solid line is the fitting curve given by Solodov and Betti[
Reference Solodov and Betti57]. The diamonds represent the result of LAPINS code, applying the algorithm of Pérez et al. [
Reference Pérez, Gremillet, Decoster, Drouin and Lefebvre48], with red diamonds indicating a dynamic Debye length. The black dots represent the result applying the algorithm of Sentoku and Kemp[
Reference Sentoku and Kemp47].
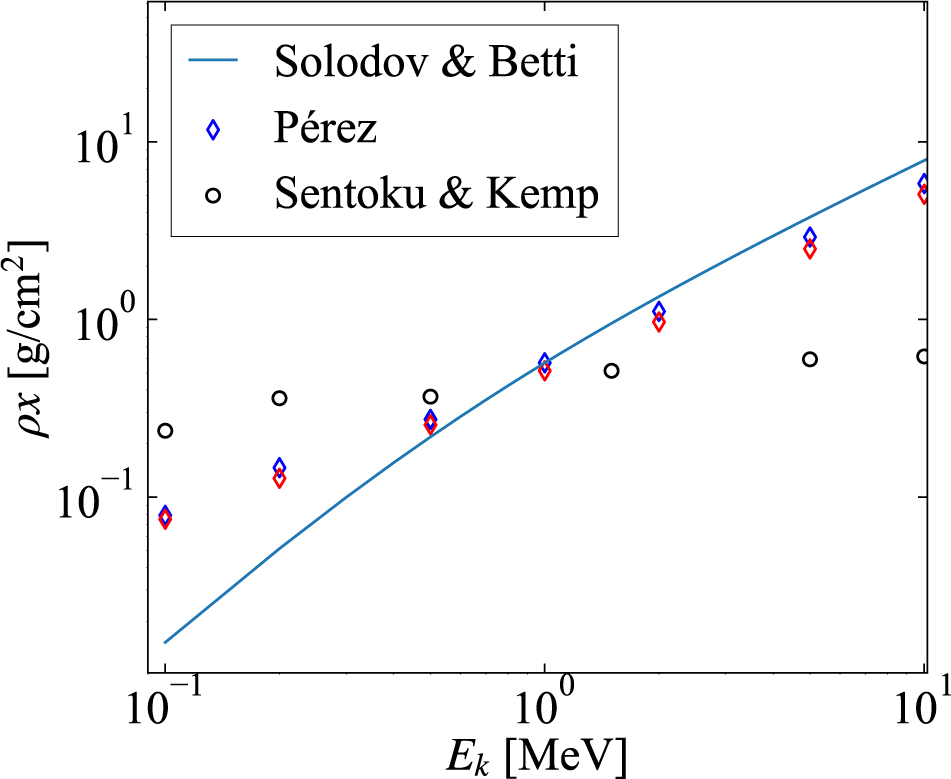
In particular, LAPINS code employs a dynamic Coulomb logarithm $\ln \Lambda =\ln \left(1+{\lambda}_{\mathrm{D}}^{\prime }/{b}^{\prime}\right)$
[
Reference He and Wang61], with
$\ln \Lambda =\ln \left(1+{\lambda}_{\mathrm{D}}^{\prime }/{b}^{\prime}\right)$
[
Reference He and Wang61], with ${\lambda}_{\mathrm{D}}^{\prime}=\sqrt{\left(T/4\pi {n}_{\mathrm{e}}{e}^2\right)\left[1+\left({\beta}^2/{v}_{\mathrm{th}}^2\right)\right]}$
and
${\lambda}_{\mathrm{D}}^{\prime}=\sqrt{\left(T/4\pi {n}_{\mathrm{e}}{e}^2\right)\left[1+\left({\beta}^2/{v}_{\mathrm{th}}^2\right)\right]}$
and ${b}^{\prime}=\min \{{e}^2/{m}_{\mathrm{e}}{\beta}^2, \mathrm{\hslash}/{m}_{\mathrm{e}}\beta \}$
, where
${b}^{\prime}=\min \{{e}^2/{m}_{\mathrm{e}}{\beta}^2, \mathrm{\hslash}/{m}_{\mathrm{e}}\beta \}$
, where $\beta$
is the relative velocity of two particles and
$\beta$
is the relative velocity of two particles and ${v}_{\mathrm{th}}=\sqrt{3T/{m}_{\mathrm{e}}}$
is the average thermal velocity. In the slow velocity limit
${v}_{\mathrm{th}}=\sqrt{3T/{m}_{\mathrm{e}}}$
is the average thermal velocity. In the slow velocity limit ${v}_{\mathrm{f}}\ll {v}_{\mathrm{th}}$
,
${v}_{\mathrm{f}}\ll {v}_{\mathrm{th}}$
, $\beta$
is equal to
$\beta$
is equal to $\sqrt{2}{v}_{\mathrm{th}}$
and
$\sqrt{2}{v}_{\mathrm{th}}$
and $\ln {\Lambda}_{\mathrm{D}}^{\prime }$
reduces to the static Coulomb logarithm
$\ln {\Lambda}_{\mathrm{D}}^{\prime }$
reduces to the static Coulomb logarithm $\ln {\Lambda}_{\mathrm{D}}$
, differing by a negligible constant
$\ln {\Lambda}_{\mathrm{D}}$
, differing by a negligible constant $\ln\, \sqrt{3}$
. In a high-velocity regime, the range of fast electrons with the dynamic Coulomb logarithm model is lower, as is shown in Figure 8.
$\ln\, \sqrt{3}$
. In a high-velocity regime, the range of fast electrons with the dynamic Coulomb logarithm model is lower, as is shown in Figure 8.
Acknowledgements
This work was supported by the Strategic Priority Research Program of the Chinese Academy of Sciences (Grant Nos. XDA25010100 and XDA25050500), the National Natural Science Foundation of China (Grant No. 12075204) and the Shanghai Municipal Science and Technology Key Project (Grant No. 22JC1401500). Dong Wu acknowledges the sponsorship of the Yangyang Development Fund.


 Open access