


Introduction
The autism-spectrum quotient (AQ; Baron-Cohen et al., Reference Baron-Cohen, Wheelwright, Skinner, Martin and Clubley2001) is a questionnaire used as a screening tool for autism in psychiatric and psychological diagnostics (Huang et al., Reference Huang, Arnold, Foley and Trollor2020; Woodbury-Smith et al., Reference Woodbury-Smith, Robinson, Wheelwright and Baron-Cohen2005). It is also applied in research to measure autistic traits in the general population (e.g., Lewton et al., Reference Lewton, Ashwin and Brosnan2019; Lin et al., Reference Lin, Cui, Zeng and Huang2020; Yaxu et al., Reference Yaxu, Ren, Ward and Jiang2020). In particular, its ten-item short form (AQ-10; Allison et al., Reference Allison, Auyeung and Baron-Cohen2012) can be an efficient measure for research purposes (e.g., Bertrams & Schlegel, Reference Bertrams and Schlegel2020; Gollwitzer et al., Reference Gollwitzer, Martel, McPartland and Bargh2019; Lundin et al., Reference Lundin, Kosidou and Dalman2019). However, recently, the AQ-10 has been demonstrated to be psychometrically insufficient (Taylor et al., Reference Taylor, Livingston, Clutterbuck and Shah2020). Re-analysing a large sample of 6,595 participants recruited online, Taylor et al. (Reference Taylor, Livingston, Clutterbuck and Shah2020) found that the AQ-10 showed poor internal reliability defined by metrics <.70. Moreover, there was no unifactorial structure, indicating that the AQ-10 partly consists of unrelated dimensions, which explains the low internal reliability. In sum, in its current form, the AQ-10 appears to be limited in measuring autistic traits in the general population.
One aim of the present study was to examine whether a change in the response format of the AQ-10 would increase the inner consistency of the measure. Usually, the AQ-10 is answered using four-point response scales (definitely agree, slightly agree, slightly disagree, definitely disagree). Reliability and validity may be decreased with only four compared to more response categories, as greater categorization is associated with a greater loss of information and, in turn, a greater attenuation of the relationships between items (Lozano et al., Reference Lozano, García-Cueto and Muñiz2008). After a literature review, Gries et al. (Reference Gries, Berry, Harrington, Crescioni, Patel, Rudell, Safikhani, Pease and Vernon2018) concluded that five-point or six-point verbal rating scales are more informative and discriminative than scales with fewer response options. Therefore, in the present research, the six-point response scale was tested for the AQ-10. Due to the even number of categories, the forced choice format of the AQ-10 was maintained, and for most people in the general population, six categories should still be easily mentally processable given the frequent use of scales with more response categories in psychological research.
As another aim of the present work, correlational and confirmatory factor analyses (CFA) were applied to investigate which subdimensions/items would lower the inner consistency of the AQ-10. The AQ-10 captures five subdimensions of autistic traits, each measured with two items (Allison et al., Reference Allison, Auyeung and Baron-Cohen2012): attention to detail, attention switching, communication, imagination, and social. It can be assumed that measuring attention to detail by self-report is problematic, as people may not be aware that their so-called central coherence is lower compared to that of other people (Freitag et al., Reference Freitag, Retz-Junginger, Retz, Seitz, Palmason, Meyer, Meyer, Rösler and von Gontard2007). This may be why most of the respective AQ items showed insufficient psychometric properties in Freitag et al.’s (Reference Freitag, Retz-Junginger, Retz, Seitz, Palmason, Meyer, Meyer, Rösler and von Gontard2007) study, leading to the deletion of the attention to detail subdimension in their AQ adaptation. In addition, one of the two attention to detail items had no substantial loading on any factor in Taylor et al.’s (Reference Taylor, Livingston, Clutterbuck and Shah2020) reanalysis. Furthermore, the AQ-10 item “I like to collect information about categories of things (e.g. types of car, types of bird, types of train, types of plant, etc.)” from the subdimension imagination has an obvious lack of content validity. Unsurprisingly, this item did not load on any of the factors in Taylor et al.’s (Reference Taylor, Livingston, Clutterbuck and Shah2020) study. Thus, it was expected that the attention to detail and imagination subdimensions would not fit well with the remaining subdimensions of the AQ-10. Based on the recent merging of the social communication and social interaction areas in the Diagnostic and Statistical Manual of Mental Disorders (American Psychiatric Association, 2013), an additional CFA model was tested in which the subdimensions communication and social were combined into one common factor.
Methods
The initial sample consisted of 1,025 individuals from the United States recruited from the Mechanical Turk platform. Due to a failed attention check, 149 individuals were excluded from the analyses. As the present study involved measuring autistic traits in the general population, the data of another 79 individuals who indicated they had an autism diagnosis or were not sure about it were excluded (auxiliary analyses showed that the results remained the same when these data were included). Thus, the final sample included 797 participants (52% male, 48% female; range of age: 18–89 years).
After giving their informed consent, the participants provided sociodemographic data (details are available from the author). This was followed by an attention check measure (Bertrams & Schlegel, Reference Bertrams and Schlegel2020): The question “Who was the first president of the United States of America?” was combined with the instruction not to check any of the three response options (Abraham Lincoln, George Washington, Thomas Jefferson), but to click “continue” instead.
Next, the participants completed the AQ-10 (Allison et al., Reference Allison, Auyeung and Baron-Cohen2012) with the alternative six-point response format. Between the conventional response categories “slightly agree” and “definitely agree,” the intermediate category “agree” was inserted, and analogously, “disagree” was placed between “slightly disagree” and “definitely disagree.” All responses were coded with values from 1 to 6, with higher numbers always indicating a more autistic characteristic (e.g., higher values on the subdimension imagination actually reflect a relative lack of imagination). After the AQ-10, the participants were thanked and debriefed, and they received US$0.25 for participation.
Results
With the present six-point response scales, the internal reliability and homogeneity of the AQ-10 (McDonald’s ω = .65, Cronbach’s α = .59, Gutmann’s λ6 = .70, average interitem correlation = .13) was slightly higher than in Taylor et al.’s (Reference Taylor, Livingston, Clutterbuck and Shah2020) study with four-point response scales (McDonald’s ω = .58, Cronbach’s α = .50, Gutmann’s λ6 = .58, average interitem correlation = .11).
As shown in Table 1, the attention to detail subdimension did not correlate with any of the other AQ-10 subdimensions (ps > .12). The subdimension imagination weakly negatively correlated with the subdimension attention switching and positively with the subdimension social, and it was uncorrelated with the other two subdimensions (ps > .12). The other three subdimensions (attention switching, communication, and social) were intercorrelated.
Means, Standard Deviations, and Correlations.

Note. N = 797. Overall scores of the AQ-10 and the AQ-10 subdimensions were obtained by averaging the responses to the items of the scale/subdimensions. Total = AQ-10 total score (10 items). AtD = the subdimension attention to detail, AS = the subdimension attention switching, C = the subdimension communication, I = the subdimension imagination, S = the subdimension social, C&S = the subdimensions communication and social combined into one common factor.
* p < .05.
** p < .01.
*** p < .001.
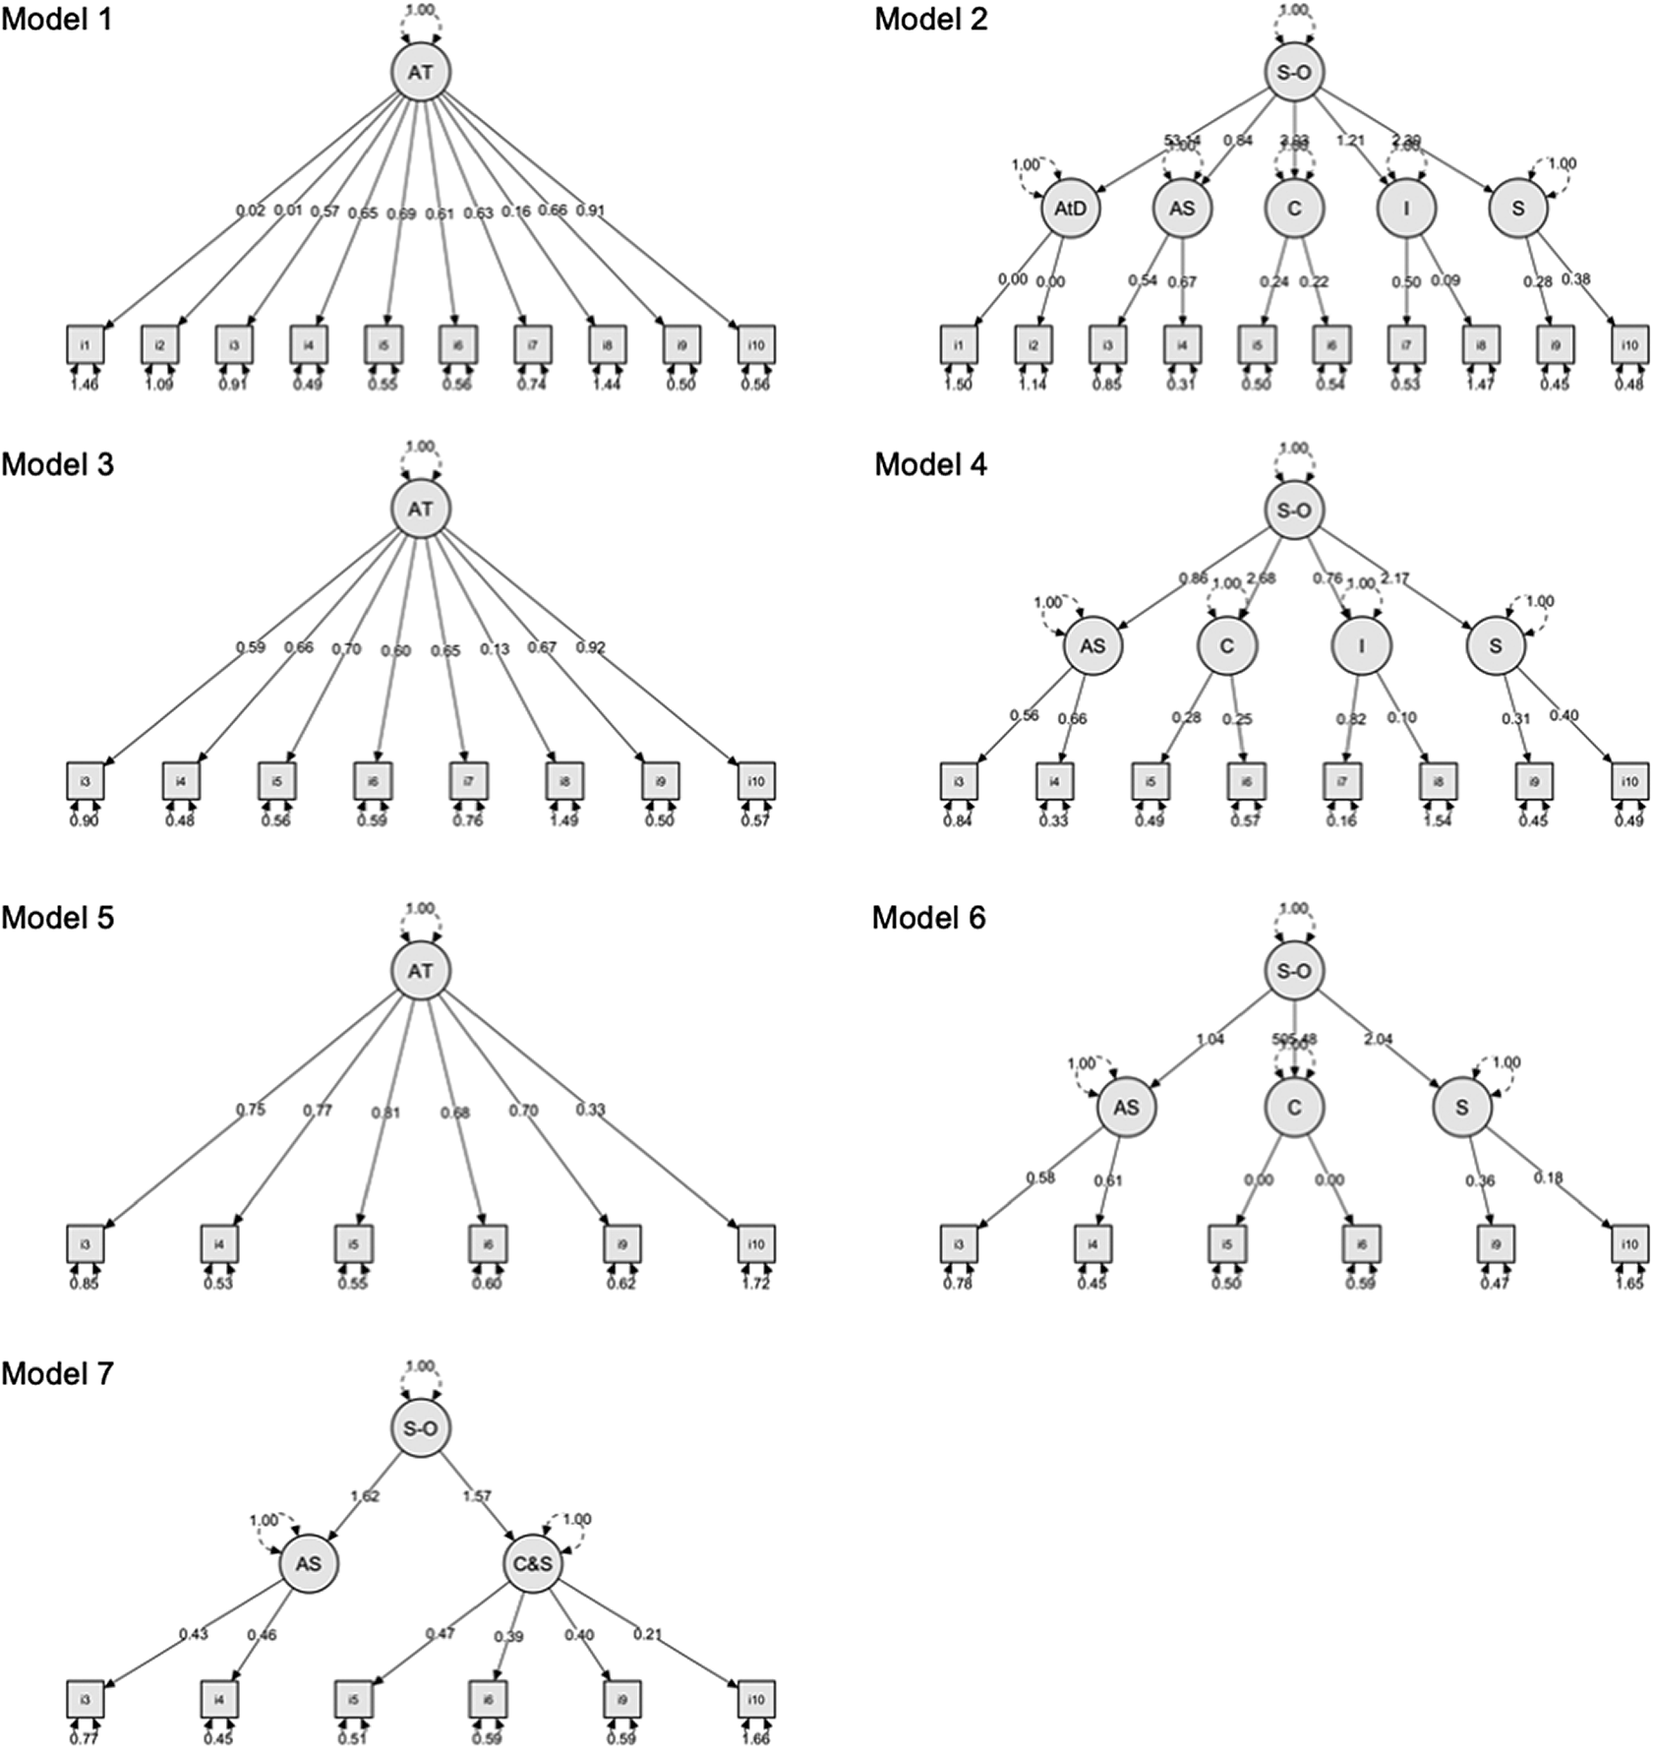
Table 2 and Figure 1 present the models and the results of the model tests from the CFAs. As can be observed, all models involving the subdimensions attention to detail and imagination failed to provide an acceptable fit. The two models without these two subdimensions and with a second-order factor (models 6 and 7) fit best. With only the six items of models 6 and 7, the internal reliability and homogeneity were as follows: McDonald’s ω = .77, Cronbach’s α = .74, Gutmann’s λ6 = .75, average interitem correlation = .34.
Confirmatory Factor Analyses.
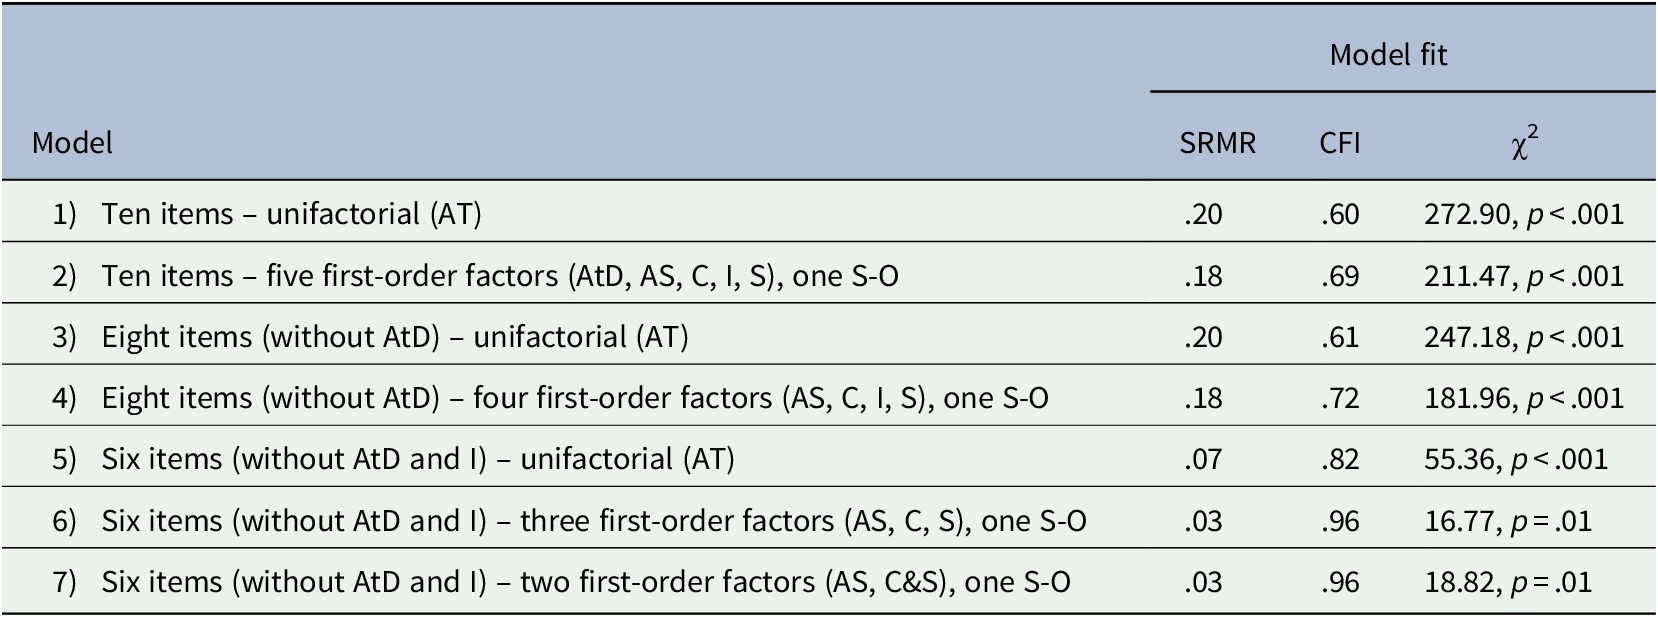
Note. N = 797. The robust weighted least squares estimation was applied. The standardized root mean square residual (SRMR) and the comparative fit index (CFI) were used to evaluate the model fit (Hu & Bentler, Reference Hu and Bentler1998). AT = all items in one common autistic traits factor, S-O = second-order factor for all involved first-order factors, AtD = the subdimension attention to detail, AS = the subdimension attention switching, C = the subdimension communication, I = the subdimension imagination, S = the subdimension social, C&S = the subdimensions communication and social combined into one common factor.
Illustration of the seven models tested by confirmatory factor analyses and the estimates obtained. AT = all items in one common autistic traits factor, S-O = second order factor for all involved first-order factors, AtD = the subdimension attention to detail, AS = the subdimension attention switching, C = the subdimension communication, I = the subdimension imagination, S = the subdimension social, C&S = the subdimensions communication and social combined into one common factor. N = 797.
Discussion
The present study showed that the AQ-10 with six-point rather than four-point response scales gained somewhat more internal consistency and homogeneity. However, overall, the parameters were still unsatisfactory with McDonald’s ω and Cronbach’s α < .70 (Taylor et al., Reference Taylor, Livingston, Clutterbuck and Shah2020) and the average interitem correlation was < .20 (Briggs & Cheek, Reference Briggs and Cheek1986).
Furthermore, as the intercorrelations of the subdimensions implied, no acceptable model fit was achieved when the subdimensions attention to detail and imagination were included in the CFAs. Freitag et al. (Reference Freitag, Retz-Junginger, Retz, Seitz, Palmason, Meyer, Meyer, Rösler and von Gontard2007) argued that people may not be able to perceive or report on their attention to detail or neglect of context, respectively. Regarding imagination, one of the two items in the AQ-10 seems poorly chosen. As mentioned in the introduction, the item is not directly related to imagination—the occurrence of a reality-based hobby (collecting information about categories of things) does not allow for concluding that there is a lack of imaginative ability or motivation. With only one item left, no imagination factor could be further examined.
The six items of the AQ-10 subdimensions attention switching, communication, and social fit adequality together under the umbrella of autistic traits. Together, they also demonstrated sufficient internal reliability and homogeneity (at least, in combination with six-point response scales). These six items might therefore be used to selectively measure crucial aspects of autistic personality in the general population. However, when used as an “AQ-6” in the future, other important aspects would be neglected (e.g., adherence to routines, hyper- or hyporeactivity to sensory input). As an aspect of construct validity, it is also yet unclear whether such a shortened scale would measure autism. Thus, it is desirable to find appropriate complementary items for the efficient measurement of autistic traits and examine the validity of the newly developed instrument. In contrast to the empirically guided item selection procedure for the AQ-10 (Allison et al., Reference Allison, Auyeung and Baron-Cohen2012), theoretical considerations should be included.
Author Contributions
AB conceived and designed the study, conducted the data gathering, performed the statistical analyses, and wrote the article.
Funding Information
This work was supported by a grant from the Uranus Foundation.
Conflicts of Interest
The author declares no conflicts of interest.
Ethics Statement
The author asserts that all procedures contributing to this work comply with the ethical standards of the relevant national and institutional committees on human experimentation and with the Helsinki Declaration of 1975, as revised in 2008.
Data Availability Statement
The dataset generated for this study is available on request from the author.


 Open access
Comments
Comments to the Author: This is a valuable contribution to the literature, outlining how autism trait measures may be improved in light of recent psychometric concerns. The paper is concise and well written. However, a few additions could be included. First, the authors could comment on whether the pattern of results are the same with the diagnosed/unsure participants included. By excluding such participants, the variance of autistic traits in the sample was greatly reduced. When using AQ measures for research in the general population, diagnosis is not often screened for. Therefore, it is important to consider the psychometric properties of the measure with such individuals included, as this will more likely represent the use of the AQ in the research context described by the authors (i.e., autistic traits measured in the general population). If the pattern of results is different, this could be reported as a supplementary analysis. In line with this, it would be helpful to include some brief descriptive statistics as an indication of the AQ variance within the sample. Finally, while the authors identify 6 items that together have good psychometric properties, whether they measure autism is unclear (i.e. the construct validity). A comment should be included emphasising this.