


1. Introduction
A crucial aspect in the understanding and modelling of sediment transport concerns the modification of the flow turbulence in the presence of solid particles, usually referred to as turbulence modulation. Experimentally, many phenomena are observed (Lumley Reference Lumley1976) but it is accepted in the literature that, for low volumetric particle concentration  $c \le {10^{ - 6}}$, particles have a negligible impact on flow turbulence because the momentum transfer from the transported sediments to turbulence is negligible (Elghobashi Reference Elghobashi1994). In such conditions, particles act as a passive scalar and turbulent boundary layer flow properties remain unchanged compared with their equivalent clear-water (sediment-free) flows. For this case, the simplest models considering one-way coupling from the fluid to the sediment phase, are justified. For flows with modest concentrations
  $({10^{ - 6}} \lt\ c < {10^{ - 3}})$, particles can significantly modulate the turbulent kinetic energy spectrum (two-way coupling), and for dense suspensions
  $(c > {10^{ - 3}})$, fluid–particle as well as particle–particle interactions give rise to potential four-way coupling due to particle collisions, drafting and granular friction (Finn & Li Reference Finn and Li2016).
The characteristic length and time scales of both the turbulent flow eddies and the entrained sediment phase play a major role in the interaction process between flow turbulence and particles. The ratio between sediment response time  $({\tau _p})$ and turbulent time scale
  $({\tau _f})$ is defined as the (particle) Stokes number
 \begin{equation}St = \frac{{{\tau _p}}}{{{\tau _f}}}.\end{equation}
 Elghobashi (Reference Elghobashi1994) suggested that a large St will enhance turbulence production, while a small St will enhance dissipation. In his classification map of turbulence–particle interactions, the control parameters are the Stokes number St based on the Kolmogorov time scale  ${\tau _k}$, and the volumetric concentration of entrained particles. He suggested that, for a given concentration, lower values of St (for example due to the decrease in particle diameter) increase the fluid energy dissipation rate due to the larger surface area of the particulate phase. On the other hand, increasing St at the same concentration leads to higher particle Reynolds number Rep, and beyond a certain threshold value (Rep > 400), vortex shedding occurs in the particle's wake region, giving rise to enhanced production of fluid turbulence. Balachandar (Reference Balachandar2009) has described particle–turbulence interactions for dilute flow
  $(c \le {10^{ - 3}})$ based on
  $St$ and
  $R{e_p}$, through 3 possible fluid–particle interaction regimes. Only the following two are of interest in geophysical flows:
– For
 ${\tau _p} < {\tau _k}$: both Rep and $St$ are less than one, and the particle relative velocity is influenced primarily by the smallest turbulent flow scale as the Kolmogorov scale.
–
${\tau _k} < {\tau _p} < {\tau _L}$: the particle time scale is larger than the Kolmogorov scale but smaller than the integral scale of turbulence. Particle relative velocity is then influenced primarily by an intermediate-scale eddy in the inertial range that has the same time scale as the particle. The typical size of this eddy is ${l_i} = \tau _p^{3/2}{\epsilon ^{1/2}}$.


Finn & Li (Reference Finn and Li2016) applied the scaling arguments of Elghobashi (Reference Elghobashi1994) and Balachandar (Reference Balachandar2009) to the sediment transport problem. They proposed a modified Shields diagram, representing all possible turbulence–particle interaction regimes on the map of Shields number (immersed sediment-weight-normalized bed shear stress) versus Galileo number (ratio of gravitational to viscous forces on a sediment). Figure 1 shows this modified Shields diagram partitioned into 5 distinct domains, based on the  $R{e_p}$ and
  $St$ values. The first regime refers to the sediment no motion regime when the mean bed shear stress is below the critical value of initiation of sediment movement. The other four regimes are denoted:
– Gravitational settling regime, for which the particle relative velocity (both for St < 1 and St > 1) is primarily dictated by gravitational settling.
– Kolmogorov interactions regime, concerning small-sized sediments at high Shields number values. In this regime
$St < 1$ and particles behave like passive flow tracers. Turbulence is subject to damping by (sediment) density stratification when the Richardson flux number exceeds locally a critical threshold of approximately 25 %.– Inertial range dissipation regime:
$St > 1,R{e_p} < R{e_{tr}} = 400$, there is a net dissipative effect on the flow turbulence via both drag force interaction and/or potential stable stratification effects.– Inertial range production regime:
$St > 1,R{e_p} > R{e_{tr}} = 400$, the presence of particles enhances the net turbulent kinetic energy (TKE) production rate via particle wake turbulence due to vortex shedding.


The modified Shields diagram was proposed by Finn & Li (Reference Finn and Li2016) to provide guidance in the selection of appropriate turbulence modelling approaches for numerical simulations of a given sediment transport flow defined in terms of Shields, Galileo and suspension number values rather than in terms of particle Reynolds and Stokes numbers and particle concentration values. The latter dimensionless numbers require the estimation of the (fluid–particle) lag velocity, turbulence microscales and the local particle concentration as small-scale process quantities. These parameters are difficult to predict accurately compared with the bulk flow quantities involved in the Shields, Galileo and suspension numbers. In the present study, the diagram is used to identify the established turbulence–particle interaction regime for the studied sediment-laden open-channel flow experiments. The shaded rectangle in figure 1 represents the covered domain for which two regimes are expected: the gravitational settling regime, for which the particle Reynolds number is primarily controlled by the gravitational sediment settling velocity, and the inertial range dissipation regime, for which drag and stratification-induced damping of flow turbulence are expected. Whether the measured sediment-laden flow properties support these predictions will be examined in detail here on the basis of mean TKE budget observations.

Figure 1. Proposed regime map for particle–turbulence interactions from Finn & Li (Reference Finn and Li2016), in terms of Galileo number G versus Shields number  $\theta $; adapted to density ratio s = 1.19. The shaded rectangle represents the range of conditions investigated in the present work.
Estimation of the TKE budget differs from classical turbulence observations reported in the literature on clear-water, sediment-laden open-channel and wall-bounded boundary layer flows (Wallace, Eckelmann & Brodkey Reference Wallace, Eckelmann and Brodkey1972; Brodkey, Wallace & Eckelmann Reference Brodkey, Wallace and Eckelmann1974; Nakagawa & Nezu Reference Nakagawa and Nezu1977; Raupach Reference Raupach1981; Nezu & Rodi Reference Nezu and Rodi1986; Lyn Reference Lyn1988; Kironoto & Graf Reference Kironoto and Graf1994; Graf & Cellino Reference Graf and Cellino2002; Hurther & Lemmin Reference Hurther and Lemmin2003; Cellino & Lemmin Reference Cellino and Lemmin2004; Blanckaert & de Vriend Reference Blanckaert and de Vriend2005). This can mainly be attributed to difficulties in measuring accurately all terms involved in the production, dissipation and transport of mean TKE. Even rarer is the measurement of the TKE budget in sediment-laden flows, which requires additional high-resolution particle flux measurements to account for the TKE spent by the flow to transport sediments. As a result, little is known concerning the impacts of particles on TKE. In this paper, extensive measurements of the TKE budget are presented for each flow condition, in clear-water (CW) and the corresponding sediment-laden (SL) flow. For each SL flow, the injected sediment load will vary from under capacity up to full (transport) capacity in order to examine the effects of sediment concentration and particle size on the TKE budget. In Guta, Hurther & Chauchat (Reference Guta, Hurther and Chauchat2022), the authors have presented experimental results in intense SL open-channel flows with a single 3 mm Plexiglas particle size. The measured turbulent mixing length, sediment and momentum diffusion coefficients as well as the turbulent Schmidt number were discussed. A detailed quantitative analysis of the bedload layer properties and their impact on the above lying turbulent suspension layer was carried out. In particular, a modified Rouse formulation was proposed and validated experimentally for SL flows with bedload layer thicknesses  $\delta $ exceeding the typical 5 % of the flow depth. This empirical level is often taken as the reference height above which suspension-dominated sediment transport occurs and the Rouse formulation applies. It was shown that this can lead to significant errors in sediment transport rate predictions using the classical Rouse formulation. In addition, effects of sediments on the logarithmic velocity profile were shown. In the present paper, new extensive experiments were carried out with a smaller particle diameter (dp = 1 mm) in order to extend the range of studied flow conditions. As a result, the present new dataset will investigate energetic SL boundary layer flows varying from bedload dominated, transitional and up to suspension-dominated conditions.
The difficulty in the description of SL flows stems also from the incomplete understanding of wall turbulence in clear-water flows (Elghobashi Reference Elghobashi1994; Lyn Reference Lyn2008). Specifically, open-channel flows over smooth and rough beds exhibit unclear differences. Grass (Reference Grass1971) already reported the effect of wall roughness on turbulence intensities. He observed a significant damping of streamwise turbulence intensities, accompanied by an increase in smaller proportions of the vertical turbulence intensities as the roughness height is increased. He also reported on the importance in the production of TKE of (large-scale) turbulent coherent flow structures as sweep- and ejection-type shear-stress events, in both smooth- and rough-wall flows. After observing important differences in the TKE budget over different types of rough walls, Krogstad & Antonia (Reference Krogstad and Antonia1999) concluded that clear-water boundary layer flows over different types of wall roughness pose a significant challenge for numerical modelling. Similarly, Nezu & Nakagawa (Reference Nezu and Nakagawa1993) concluded that near-wall turbulence production and transport mechanisms in rough open-channel flows differ strongly from those over smooth walls. In particular, the near-wall dominance of shear-stress contribution associated with ejection-type events was found for smooth-wall open-channel flows (Wallace et al. Reference Wallace, Eckelmann and Brodkey1972; Lu & Willmarth Reference Lu and Willmarth1973; Nakagawa & Nezu Reference Nakagawa and Nezu1977; Raupach Reference Raupach1981), whereas the sweep-type contribution was observed to dominate in rough-wall clear-water flows (Nezu & Nakagawa Reference Nezu and Nakagawa1993; Hurther, Lemmin & Terray Reference Hurther, Lemmin and Terray2007; Mignot et al. Reference Mignot, Barthelemy and Hurther2009a). As suggested by the parametrization proposed by Raupach (Reference Raupach1981), Hurther et al. (Reference Hurther, Lemmin and Terray2007) confirmed that the origin of downward oriented net (diffusive) TKE flux in rough-wall flows results from the excess in Reynolds shear stress associated with large-scale coherent flow structures of sweep type. Whether these clear-water boundary layer flow properties hold in SL flows has not been examined thoroughly so far. This is principally due to the difficulties in turbulence-resolved measurements in SL flows involving both bedload and suspended sediment transport. In the last decades, there has been a notable focus on examining the dynamics of coherent structures in open-channel flows, particularly regarding their impact on sediment entrainment (also known as pick up) and the suspension of sediments as a form of turbulent erosion flux. For instance, Sumer & Deigaard (Reference Sumer and Deigaard1981) illustrated through tracking individual particle paths that particle movement aligns well with the bursting motions of ejection and sweep types in both smooth and rough flows. Niño & Garcia (Reference Niño and Garcia1996) experimentally established that, regardless of roughness conditions, coherent flow structures significantly influence particle entrainment. Sechet & Le Guennec (Reference Sechet and Le Guennec1999) observed that the time intervals between successive particle jumps correlate with corresponding ejection periods, a finding derived from combining measurements of instantaneous velocity and particle trajectory.
The present study is devoted to detailed analysis of the mean TKE budget in both clear-water and SL boundary layer flows and its link to coherent flow structure dynamics. For this purpose, conditional statistics will be applied using the well-known uw-quadrant threshold method developed by Lu & Willmarth (Reference Lu and Willmarth1973) for turbulence analysis in clear-water wall-bounded flows. This method has been adapted and applied in sediment suspension-dominated open-channel flows by Nikora & Goring (Reference Nikora and Goring2002), Hurther & Lemmin (Reference Hurther and Lemmin2003) and Cellino & Lemmin (Reference Cellino and Lemmin2004). Revil-Baudard et al. (Reference Revil-Baudard, Chauchat, Hurther and Barraud2015, Reference Revil-Baudard, Chauchat, Hurther and Eiff2016) and Cheng, Hsu & Chauchat (Reference Cheng, Hsu and Chauchat2018) applied the same method to bedload- and suspension-dominated sheet flows, revealing the important sweep and ejection contributions, even inside the dense bedload layer. Based on the same technique, Nikora & Goring (Reference Nikora and Goring2000) had previously shown the important role of these structures in weakly mobile gravel beds. Turbulent flow–particle interactions are usually assumed negligible in this transport layer.
The mean TKE budget for CW and SL open-channel flows is first presented in § 2. The experimental set-up, protocols and methodological aspects are described in § 3. Section 4 presents the main results of the study before the paper's conclusions listed in § 5.
2. Experimental set-up and protocol
Experiments using low density  $({\rho _p} = 1192\ \textrm{kg}\ {\textrm{m}^{ - 3}})$ Poly-Methyl MethAcrylate (PMMA) particles with median diameters dp = 1 mm (dp1) and 3 mm (dp3) were carried out in the tilting flume at Laboratoire des Écoulements Géophysiques et Industriels (LEGI)/École d'Ingénieurs pour l'Énergie, l'Eau et l'Environnement (ENSE3). The flume is 10 m long and 0.35 m wide. The settling velocity of the particles is
  ${w_s}= 2.2$ and 5.6 cm s−1, for dp1 and dp3, respectively, with an associated uncertainty of 17 %. The fixed bed is covered by glued particles, with the same properties as dp3. The flow was highly turbulent, hydraulically rough and subcritical (see tables 1 and 2). To ensure the full development of the turbulent shear boundary layer (Revil-Baudard et al. Reference Revil-Baudard, Chauchat, Hurther and Barraud2015), a honeycomb at the flume inlet is used and a macro-roughness bed surface extends over the first 50 cm of the channel.
Table 1. Flow conditions for  $d_{p}=3\ {\rm mm}$.

Note:  ${u_\mathrm{\ast }}$: friction velocity;
  $\theta = \rho u_\mathrm{\ast }^2/({\rho _s}g - {\rho _w}g){d_p}$: Shields number; S: suspension number
  $({w_s}/{u_\mathrm{\ast }})$; Q: flow discharge; S0: Slope of the channel; U: bulk mean velocity; Hf: water depth; Re = 4URh/v: bulk Reynolds number;
  $R{e_\ast } = {u_\ast }{k_s}/\nu $: roughness Reynolds number; Froude number:
  $Fr = U/\sqrt {g{H_f}} $; qs: measured solid load per unit width;
  $\bar{C}$: measured depth-averaged volumetric concentration.
Table 2. Flow conditions for  $d_{p}=1\ {\rm mm}$.

The experiments were performed in sequence of at least two runs, consisting of one CW flow for reference, followed by 1 to 3 SL flow runs, each with a duration of 300 s, for sufficient statistical convergence of the turbulent flow quantities. Thus, the maximum number of experimental runs in the same sequence was limited to four. No modifications in the experimental set-up were made between the CW and the subsequent SL flow runs. This ensured that they were all performed in the exact same configuration, differing only by the introduction of sediments.
Three flow conditions for each particle diameter were studied. For each forcing condition there is one CW and three solid transport regimes. This is repeated three times for reproducibility purposes, leading to 27 runs of SL flow for each particle dimeter. The injected solid load in full capacity was determined experimentally, as a function of the progressive saturation of the sediment transport rate associated with the beginning of sediment deposition at the bed. The injected solid load  $Q_s^{inj}$ for the two regimes below full capacity was fixed based on the desired mean volumetric concentration, given as the ratio between the injected solid load and the flow discharge, such that
  ${C^{inj}} = Q_s^{inj}/Q$. The defined mean volumetric concentrations are approximately
  ${C^{inj}} \approx 6 \times {10^{ - 4}}$ and
  $2 \times {10^{ - 3}}$, for the lower (LOW) and the intermediate (MED) solid load cases, respectively. Close values of mean concentration under capacity regimes were defined for all forcing conditions. This allows comparison of SL flows with similar mean concentrations but different turbulence levels. More details on the experimental protocol can be found in Guta et al. (Reference Guta, Hurther and Chauchat2022).
The position of the solid boundary can be easily detected by ADVP (acoustic Doppler velocity profiler) systems in CW, as it corresponds to the position of a peak in the echo intensity due to sound reflection by the rigid channel bed. The position of the fixed rigid bed (the zero vertical level) for all SL runs is detected based on the corresponding CW runs. Indeed, bed detection is more robust without a moving sediment layer covering the flow bed. This procedure provides very accurate bed positions (with an accuracy of ±750 μm) under our controlled transport conditions, avoiding a permanent sediment deposition (i.e. no particles at rest over the fixed rigid bed), even under capacity conditions.
The measurements are performed with the ACVP (acoustic concentration and velocity profiler) technology, which provides co-located profiles along the bed-normal direction of streamwise and wall-normal velocity components, particle volumetric concentration and particle flux across both the bedload and suspension layers (Revil-Baudard et al. Reference Revil-Baudard, Chauchat, Hurther and Barraud2015, Reference Revil-Baudard, Chauchat, Hurther and Eiff2016; Fromant et al. Reference Fromant, Mieras, Revil-Baudard, Puleo, Hurther and Chauchat2018, Reference Fromant, Hurther, Van der Zanden, Van Der A, Caceres, O'Donoghue and Ribberink2019; Guta et al. Reference Guta, Hurther and Chauchat2022). The ACVP combines the ADVP and acoustic backscattering system technologies in a single instrumentation. The sampling frequencies in the present study are set to 100 Hz and 5 Hz for velocity and concentration, respectively. The acoustic frequency of 1 MHz with a pulse duration of 2 μs leads to a vertical resolution of Δz = 1.5 mm. By employing particles having diameters dp ≥ 1 mm, the present spatial resolution resolves the bedload layer, that extends typically over several particle diameters in intense particle-transport conditions. In order to minimize flow intrusiveness, the system sensors are placed into a vacuum box, with its lower end slightly below the free surface. Since the ACVP box disturbs locally the free surface, the profiles discussed herein are restricted to the lower 60 % of the flow depth.
As observed in tables 1 and 2, the mean bulk flow quantities (flow discharge, flow depth, bed friction velocity, etc.) are negligibly affected by the presence of sediments in contrast to internal flow structure parameters (von Kármán constant, turbulent mixing length, turbulent diffusivity, sediment diffusivity, turbulent, Schmidt number) as addressed in Guta et al. (Reference Guta, Hurther and Chauchat2022).
3. The TKE budget in sediment-laden flows
3.1. The TKE balance equation
Given that the hydro-acoustic velocity measurements performed in the present study are attributed to the water–sediment mixture without distinction of fluid and particle phases, the considered governing equations for the mean TKE are those based on the Boussinesq approximation. The sediment presence is taken into account by a density stratification term due to the mean sediment concentration gradients. Buoyancy forces arise due to this density gradient.
We can derive the TKE balance equation from the Navier–Stokes equations. In the framework of sediment-induced density stratification, it becomes (Barenblatt Reference Barenblatt1955; Monin & Yaglom Reference Monin and Yaglom1971; Kundu & Cohen Reference Kundu and Cohen1990; Guo & Julien Reference Guo and Julien2001)
 \begin{equation}\frac{{\partial k}}{{\partial t}} ={-} \overline {u^{\prime}w^{\prime}} \frac{{\partial \bar{u}}}{{\partial z}} - (s - 1)\overline {w^{\prime}c^{\prime}} g - \frac{\partial }{{\partial z}}\left( {\overline {kw^{\prime}} + \frac{1}{\rho }\overline {p^{\prime}w^{\prime}} - {\nu_m}\frac{{\partial k}}{{\partial z}}} \right)-\varepsilon ,\end{equation}
 where the term on the left-hand side is the rate of change in mean TKE  $k = 0.5(\overline {{{u^{\prime}}^2}} + \overline {{{v^{\prime}}^2}} + \overline {{{w^{\prime}}^2}} )$, with
  $u^{\prime},v^{\prime}\ \textrm{and}\ w^{\prime}$ as the longitudinal, transverse and vertical Reynolds velocity components, respectively. The first term on the right-hand side, the work done by turbulent shear stress against the mean flow deformation, represents transfer of mean TKE from the mean flow to the fluctuating motions. Therefore, this term corresponds to the TKE production rate in the present TKE budget. The second term is the buoyancy or sediment suspension due to density fluctuations. The third term on the right-hand side is the turbulent energy diffusion by transport. The fourth term is the energy diffusion by pressure fluctuations. The fifth term corresponds to the viscous transport of energy. The sixth term is the mean TKE dissipation rate into heat due to molecular viscosity. In this wall-bounded unidirectional mean open-channel flow, the mean TKE is only produced in the streamwise x-direction, through the first term on left-hand side. Other components (
 $1/2\ \overline {{{v^{\prime}}^2}} $ and
  $1/2\overline {{{w^{\prime}}^2}} $) gain energy via nonlinear pressure–velocity interactions not represented in the mean TKE budget but in the individual Reynolds stress transport equations (Tennekes & Lumley Reference Tennekes and Lumley1972). The terms in parenthesis correspond to the sum of all potential TKE fluxes contributing to a TKE transport in the vertical direction.
3.2. Methodological considerations
The method for the estimation of the mean TKE dissipation rate is presented later in this section. The mean dissipation rate is applied here for the estimation of the local turbulent flow microscale as
 \begin{equation}{\tau _K} = {\left( {\frac{\nu }{\varepsilon }} \right)^{1/2}},\end{equation}
 where  ${\tau _K}$ is the Kolmogorov time scale. Based on this time scale, the Stokes number
  $S{t_\kappa } = {\tau _p}/{\tau _\kappa }$ is estimated, using for the particle time scale
  ${\tau _p} \approx {w_s}/[g(s - 1)/s]$, with
  $s = {\rho _p}/\rho $. The resulting depth-averaged values of the Stokes number are
  $S{t_\kappa } \approx 0.5- 0.8$ for dp1 and
  $S{t_\kappa } \approx 2- 3$ for dp3. According to Finn & Li (Reference Finn and Li2016), who recast and developed scaling arguments from Elghobashi (Reference Elghobashi1994) and Balachandar (Reference Balachandar2009), at low concentrations
  $(c \le {10^{ - 3}})$, negligible effects of particles on the flow turbulence are expected for
  $S{t_K} < 1$, whilst a dissipative regime (i.e. as a fluid turbulence damping) occurs with
  $S{t_K} > 1$, as long as the particle Reynolds number
  $R{e_p}$ does not exceed the critical value
  $R{e_p} \approx 400$ (Elghobashi Reference Elghobashi1994). This seems consistent with the present observations, as will be shown in § 4.2. Since the relative velocity
  ${u_p} - {u_f}$ cannot be measured, Rep is estimated with the particle settling velocity as
  $R{e_p} = {d_p}{w_s}/\nu = 168$ and 19, for dp3 and dp1, respectively. Although the value for the larger particles is one order of magnitude larger than for the smaller particles, the value remains below
  $R{e_p} \approx 400$ for enhancement of fluid turbulence via particle-induced vortex shedding.
To estimate the TKE budget from experimental measurements, different approximation methods are applied for the terms of (3.1). The first is the assumption that the pressure diffusion transport term becomes negligible above a certain distance from the flow bed. Because the measurement accuracy of the mean turbulent particle flux  $\overline {c^{\prime}w^{\prime}} $ is questionable in the absence of a two-phase flow–particle velocity measurement ability, this term is replaced by the settling flux
  ${w_s}\bar{c}$ (Rouse Reference Rouse1938), which is measured with greater confidence. This is justified by the present steady-state, uniform (in the streamwise direction), SL flow conditions.
In the absence of the measurement of the transverse velocity v, a common approximation for the turbulent diffusion term in two-dimensional mean flows is  $\overline {{{v^{\prime}}^2}w^{\prime}} = 0.5(\overline {{{u^{\prime}}^2}w^{\prime}} + \overline {{{w^{\prime}}^3}} )$, as reported by Raupach (Reference Raupach1981). This leads to
 \begin{equation}{F_k} = \overline {kw^{\prime}} = 3/4(\overline {{{u^{\prime}}^2}w^{\prime}} + \overline {{{w^{\prime}}^3}} ),\end{equation}
 where Fk is the mean vertical TKE flux. Although not shown herein, a good qualitative and quantitative agreement exists between Direct Numerical Simulations (DNS) results of Ikeda & Durbin (Reference Ikeda and Durbin2007), experimental literature results (Nakagawa & Nezu Reference Nakagawa and Nezu1977; Hurther et al. Reference Hurther, Lemmin and Terray2007; Mignot, Hurther & Barthelemy Reference Mignot, Hurther and Barthelemy2009b; Dey & Das 2012) and our measurements. Ikeda & Durbin (Reference Ikeda and Durbin2007, figure 23), found that  ${F_k}/u_\mathrm{\ast }^3$ was nearly constant and equal to 0.4 for
  $2 < z/{k_s} < 6$, and it gradually decreased in the outer layer. Such a trend was observed in all previously cited experimental studies and in the present measurements (discussed in § 4.3), confirming the validity of the approximation applied in (3.3).
In homogeneous turbulence, the mean dissipation rate is determined from Kolmogorov's second hypothesis
 \begin{equation}{E_u}({k_u}) = {C_1}{\epsilon ^{2/3}}k_u^{ - 5/3},\end{equation}
 where  ${E_u}(u)$ is the one-dimensional energy spectra, ku is the wavenumber and C 1 is a constant with a value of 0.5 (Monin & Yaglom Reference Monin and Yaglom1975; Pope Reference Pope2000). Obtaining
  ${E_u}({k_u})$ directly from measurements is impossible with a one-dimensional vertical profiling system. Instead, the frequency spectrum
  ${F_{11}}(f)$, is used after the application of Taylor's frozen turbulence hypothesis (Townsend Reference Townsend1976) for the estimation of the one-dimensional wavenumber spectra, as
 \begin{equation}{E_u}({k_u}) = \frac{{\bar{u}}}{{2{{\rm \pi} }}}{F_{11}}(f)\quad \textrm{with}\ {\kappa _u} = \frac{{2{{\rm \pi} }f}}{{\bar{u}}}.\end{equation}
The mean TKE dissipation rate can then be approximated as
 \begin{equation}\varepsilon = \frac{{2{{\rm \pi} }}}{{\bar{u}}}{\left( {\frac{{{F_{11}}(f){f^{5/3}}}}{{{C_1}}}} \right)^{3/2}}.\end{equation}
 It should be stressed that the turbulence spectra are not well resolved near the wall for  $z/{H_f}< 0.1- 0.15$) due to the limited spatial resolution of ±1.5 mm of the ACVP instrument. As a result, the dissipation rate estimations are subject to underestimations in the inner flow region. Consequences of this lack of resolution on TKE budget estimates is discussed at the end of this section. The turbulence spectra of streamwise and vertical velocity fluctuations are presented in figure 2, at a vertical elevation z/Hf = 0.4, for CW and SL flows. As expected, the spectra of longitudinal velocity fluctuations is O(10) larger than for the vertical in the lower frequency band (f < 1 Hz) corresponding to the production frequency range. The longitudinal and vertical velocity spectra display closer values in the frequency range f > 6 Hz. This trend is observed for all hydrodynamic conditions but it is more established for flows with the highest Reynolds number values (column (d)). These spectral trends confirm the anisotropy of the large-scale turbulent eddies associated with TKE production at the low frequencies, and the tendency towards isotropy for the small-scale turbulent flow structures when entering the inertial subranges, as proposed by Kolmogorov's first hypothesis (Bradshaw Reference Bradshaw1971; Tennekes & Lumley Reference Tennekes and Lumley1972). Moreover, the convergence to the −5/3 slope of all spectra is observed systematically, in agreement with Kolmogorov's second hypothesis, except for the flow with the lowest Reynolds number (column a) for which the inertial subrange is not well established and captured by the ACVP for f > 25 Hz. For the studied flows with higher Reynolds numbers, the spectra in the inertial subrange begin at lower frequency, reach higher frequencies (due to the decrease of the Kolmogorov scale with Reynolds number) and have larger magnitudes (due to the increase of TKE dissipation rate with Reynolds number). Although not shown herein, it was observed that the tendency towards isotropy (and the −5/3 slope) can be observed at further distances from the wall. Laufer (Reference Laufer1954) observed the same behaviour in his measurements of turbulence in fully developed pipe flows. This is because the inertial subrange becomes wider with distance above the flow bed, as reported by Nikora & Goring (Reference Nikora and Goring2002). These general trends prevail both in CW and SL flows, as found by Cellino & Graf (Reference Cellino and Graf1999) and Nikora & Goring (Reference Nikora and Goring2002).

Figure 2. Spectra of streamwise SL (thick blue, -) and vertical SL (thick blue, - -) velocity fluctuations at z/Hf = 0.4 (the corresponding wall units are  ${z_ + } \approx 1600$ in column (a),
  ${z_ + } \approx 2500$ in columns (b) and (c) and
  ${z_ + } \approx 4340$ in column (d)); for dp1 (θ ≈ 0.4 (a), θ ≈ 1.2 (b)) and dp3 (θ ≈ 0.35 (c), θ ≈ 0.8 (d)) for lower concentration (bottom), intermediate (middle) and saturated (top). Thin black line is for the corresponding reference CW velocity fluctuations, with (-) for streamwise and (–) for vertical directions, respectively. The thick black line (-.) shows the −5/3 slope.
Following the considerations above, as well as neglecting the viscosity driven transport term (because of its negligible value compared with the diffusion-induced TKE transport term), the TKE budget equation can be simplified as
 \begin{equation}I ={-} \overline {u^{\prime}w^{\prime}} \frac{{\partial \bar{u}}}{{\partial z}} - (s - 1){w_s}\bar{c}g - \frac{{\partial \overline {kw^{\prime}} }}{{\partial z}} - \varepsilon ,\end{equation}
where the term I represents the imbalance (or residue) in the TKE budget, such that I = 0 if the budget is closed. Several causes can provoke non-negligible values of the imbalance term profile: a non-negligible contribution of the turbulent pressure transport term (because it is not estimated) or measurement uncertainties due to statistical bias or measurement errors associated with a lack of measurement precision. In the following, estimation of measurement uncertainties is provided on the basis of a comparative analysis of our measured TKE budget results to numerical DNS (for CW flow case) and Large Eddy Simulations (LES) (for SL flow case) reported in the literature. Figure 3 compares the TKE budget in a rough-wall boundary layer obtained with DNS (figure 3a) by Ikeda & Durbin (Reference Ikeda and Durbin2007) with our CW measurements in figure 3(b) (for run P3S03D10_CW in table 1). Although not shown herein, figure 5 in Yuan & Piomelli (Reference Yuan and Piomelli2014b) is also used for reference DNS estimates of the TKE budget. The latter study includes one smooth-wall case and two (increasing) rough-wall cases. Figure 4 compares the numerical LES of the TKE budget obtained by Cheng et al. (Reference Cheng, Hsu and Chauchat2018) in a SL flow condition with our very similar dp3 SL flow case under a full-capacity condition (run P3S03D10_SAT in table 1).

Figure 3. The TKE budget from (a) Ikeda & Durbin (Reference Ikeda and Durbin2007) and (b) present experiments in CW (P3S03D10_CW); normalized by  $u_\ast ^4/\nu $; production (o), dissipation (+), turbulent diffusion (×), pressure diffusion (Δ) and imbalance/residue (-).

Figure 4. The TKE budget from (a) LES results from Cheng et al. (Reference Cheng, Hsu and Chauchat2018) and (b) present experiments in saturation with dp3 (P3S03D10_SAT); normalized by  $u_\ast ^3/{H_f}$; production (o), dissipation (+), turbulent diffusion (×), stratification (□), drag dissipation (◊), pressure diffusion (Δ) and imbalance (-).
In figures 3(b) and 4(b), the imbalance term can be considered as the uncertainty in the TKE budget, as long as the turbulent pressure transport term is negligibly low. The DNS results in figure 4(a) show that, for rough-wall CW flows, the pressure term is indeed negligible above a distance matching the height of the wall-roughness elements (i.e. for z/Hf > 0.05). Same result is also observed in the DNS results of in Yuan & Piomelli (Reference Yuan and Piomelli2014a, figure 5) for two increasingly rough wall-bounded flows. In the present CW flow case, as shown in figure 3(b), turbulent pressure transport can be considered negligible for z/Hf > 0.02. These values are not identical because the relative submergence values in our flow conditions are much larger than for the flow studied in Ikeda & Durbin (Reference Ikeda and Durbin2007). Above the referred height, the imbalance term represents the measurement uncertainty with values below 15 % (of the TKE production) for z/Hf > 0.1 and below 29 % for 0.02 < z/Hf < 0.05. In the latter flow range, the gradual increase of I with proximity to the wall is attributed to the lack of spatial measurement resolution. The limited spatial resolution induces an underestimation of the TKE dissipation rate which increases with proximity to the channel wall. The TKE production and turbulent transport rates are weakly affected by the lack of spatial measurement resolution because they are primarily controlled by turbulent macro-scales in contrast to the TKE dissipation rate that is associated with turbulence micro-scales. The good agreement between the numerical results and the measured TKE production and TKE transport terms confirms that we can better resolve these quantities compared with TKE dissipation.
The numerical results of Ikeda & Durbin (Reference Ikeda and Durbin2007 in figure 3a) and in Yuan & Piomelli (Reference Yuan and Piomelli2014a, figure 5) show that a TKE production peak and a TKE dissipation peak are found in rough-wall CW flows close to the top of the wall-roughness elements at  $z/{k_s} \approx 1$. Furthermore, the simulated TKE transport term is seen to act as a local energy source term below this level, which corresponds to the interior of the roughness sublayer. In our measured CW case (figure 4b) the peaks in TKE production and dissipation rates and the source of transported TKE are not observed. This is explained by the fact that the height of the bed roughness elements is close to the vertical measurement resolution in our CW flow cases. Consequently, the peaks are not detected in our CW flow cases. However, two clear peaks in TKE production and dissipation rates are observed in our measurements (figure 4b) for the dp3 SL flow cases subject to a thick bedload layer transport. This point is addressed in detail in the results section as a main result of the present study.
Although both DNS results discussed above allowed us to verify the key assumptions of the measured TKE budget, a notable difference in the flow structure in figures 3(a) and 3(b) is discernible. The decay in the peaks of the different TKE budget terms occurs significantly faster in the DNS results. We attribute the differences mainly to very distinct relative submergences and potentially the application of rib-type roughness elements in the DNS simulations.
The good agreement in profile shape and magnitude between all measured and simulated TKE budget terms for the SL flows (see figure 4) further confirms the agreement between mixture-velocity-based measurements and fluid-velocity-based simulations. The small differences observed between measurements and simulations might be attributed to differences between mixture-velocity- and fluid-velocity-based estimates. However, as addressed in the results section below, these differences are significantly smaller than the addressed differences due to bedload layer effects.
4. Results
In this section, the TKE budget in SL flows is presented for the less and most energetic flow conditions and for the two particle sizes. This allows us to appreciate the results’ sensitivity to the Shields, Reynolds and Stokes numbers and more particularly to the suspension number. For the less and most energetic flows, the SL flows have the largest and smallest suspension number,  ${w_s}/{u_\ast }$, values, respectively, for each particle diameter. The largest and smallest suspension number values correspond to bedload- and suspension-dominated SL flow, respectively. Moreover, for each of these four SL flows, the effect of increasing particle concentration will be examined starting from CW, low, moderate to full-capacity (also named saturated) conditions. Note, however, that the present TKE budget analysis was carried for all conditions shown in tables 1 and 2 but only one out of the 3 repeated runs and its reference CW run will be shown and discussed (the repeated runs will be shown for a limited number of cases). The following results showed a high degree of repeatability over the three repeated runs (Guta et al. Reference Guta, Hurther and Chauchat2022). Before discussing the TKE budget in detail, the validity of the logarithmic profile is addressed in the following section.
4.1 Logarithmic velocity profile
To evaluate the existence of a logarithmic distribution of mean streamwise velocity, a fitting was performed in figure 5 based on the following log formulation, valid for hydraulically rough open-channel flows (Graf & Altinakar Reference Graf and Altinakar1998; García Reference García2008):
 \begin{equation}\frac{u}{{{u_\ast }}} = \frac{1}{\kappa }\ln \left( {\frac{{z - {z_d}}}{{{k_s}}}} \right) + {B_r},\end{equation}
Figure 5. Profiles of normalized velocity distribution with the same hydrodynamic conditions with dp1 (P1S10D8_SAT (Δ)) and dp3 (P3S03D10_SAT (o)); all in capacity conditions.
where Br is the integration constant, zd is the displacement height of the best fit linear mixing length profile and  ${k_s}$ is the roughness height. The linear best fit of the measured profile values of u/u* on a log scale of (z–zd) values allows us to evaluate the slope
  $1/\kappa $ and
  ${B_r}$ (see table 1), prescribing
  ${u_\ast }$,
  ${z_d}$ and
  ${k_s}$. The adopted shear velocity
  ${u_\ast }$ is based on the linear extrapolation of the Reynolds shear stress at the bed level height z = 0 (the profiles of Reynolds shear stress are shown in the Appendix, and have been discussed in detail in Guta et al. Reference Guta, Hurther and Chauchat2022). The displacement height corresponds to the vertical level at the origin of the best fit linear mixing length profile. The roughness height
  ${k_s}$ was estimated from the Colebrook and White formulation for rectangular open-channel flows. Figure 5 shows profiles of the normalized velocity distribution with the same hydrodynamic conditions for dp3 and dp1 SL flows under full-capacity conditions. It can be seen that the deviation from the logarithmic distribution occurs in the lower flow region, due to wall-roughness effects, in both dp3 and dp1 flow cases. However, this deviation from the logarithmic distribution occurs at a higher vertical level
  $(z - {z_d}/{k_s} > 2)$ for dp3 due to the presence of a thick bedload layer. Indeed, the bedload layer for dp3 exceeds
  $z/{H_f} \approx 0.1(z/{d_p} \approx 7)$ in the full-capacity condition, while it remains below
  $z/{H_f} \approx 0.05(z/{d_p} \approx 1- 2)$ for dp1. Blanckaert, Heyman & Rennie (Reference Blanckaert, Heyman and Rennie2017) obtained bedload thicknesses values up to
  $\delta /{d_p} \approx 10$ under similar energetic SL flow conditions using the same velocity-based methodology. As detailed in Guta et al. (Reference Guta, Hurther and Chauchat2022), the log layer is shifted towards a higher vertical elevation in the presence of a thick bedload layer. Therefore, if the high concentration in the vicinity of the bottom displaces the suspension layer towards high vertical levels, it might be questionable that the log layer still exists. The assumptions of the log law are valid in the wall region since some authors (Nezu & Rodi Reference Nezu and Rodi1986; Lyn Reference Lyn1988; Graf & Cellino Reference Graf and Cellino2002) have argued that, in the outer layer (z/Hf > 0.2) of open-channel flows, the wake effects may be pronounced, and a velocity defect law in terms of a log-wake law is more suitable (Nezu & Nakagawa Reference Nezu and Nakagawa1993). Similar observations were made by Lyn (Reference Lyn1988), based on the velocity profiles. He reported that, in the lower and outer flow regions, the velocity profiles were not strictly logarithmic in SL flows. He concluded that a log layer occurred in the intermediate region, and that, as the solid load was increased, the log layer became narrower and almost vanished for the flows with the highest concentrations.
Since the log layer corresponds to the equilibrium layer between TKE production and its viscous dissipation, we can anticipate that, for dp3, it will be located at a higher vertical elevation compared with dp1. This is discussed in the following subsection.
4.2 The TKE budget
The TKE budget is shown in figure 6, from CW in the bottom row to maximum sediment concentration (full capacity) in the upper row. As expected from the previous figure 4, the TKE budgets of all shown steady, subcritical, uniform and highly turbulent boundary layer SL flows are dominated by four terms associated with the rates of production, sediment transport (or sediment density stratification), turbulent transport and viscous dissipation. A discussion of each term is presented in the following.

Figure 6. The TKE budget normalized by  ${H_f}/u_\ast ^3$; production (black,o), dissipation (red,+), turbulent diffusion (green,×), stratification (blue, □) for dp1 (θ ≈ 0.4 (a), θ ≈ 1.2 (b)) and dp3 (θ ≈ 0.35 (c), θ ≈ 0.8 (d)); with increasing concentration from CW (bottom row) to saturation (top row).
4.2.1. The TKE production rate
The production in the SL flows is seen to be reduced in the inner region, with the maximum value having smaller normalized magnitude compared with the reference CW flow, regardless of particle diameter. This is consistent with lower values of mean Reynolds shear stress in the near-bed region for z/Hf < 0.10 for both particle sizes (figures 13(c) and 14(c) in the Appendix). Importantly, for dp3 only, the TKE production peaks at a higher normalized distance from the bed and the mean velocity gradients are also significantly reduced near the bed, contributing to the reduction of TKE production rate seen in figure 6. The signature of the production term is confirmed by the previously presented DNS (Ikeda & Durbin Reference Ikeda and Durbin2007) in CW as well as by the LES results of Cheng et al. (Reference Cheng, Hsu and Chauchat2018) in SL flows. The increase in roughness results not only in the upshift of the peak of TKE production, but also in the reduction of the peak value (Ikeda & Durbin Reference Ikeda and Durbin2007).
The estimation of the bulk TKE production rate, defined as the depth-integrated TKE production, is found to be reduced in dp3 SL flows compared with their reference CW flows. The attenuation factor, defined as the ratio between CW and SL bulk production rates, in saturated conditions remains in the range of values between 1.1 and 1.3, for all saturated conditions for dp3 and dp1. The observed reduction in near-bed local and bulk TKE production rates for all investigated dp1 and dp3 SL flows supports the establishment of the inertial range dissipation regime defined by Finn & Li (Reference Finn and Li2016) in terms of turbulence–sediment interaction.
4.2.2. The TKE dissipation rate
It is difficult to quantify accurately the modifications of the TKE dissipation rate in the lower part of the inner flow region due to the above-mentioned measurement resolution limitations. Nevertheless, we can infer some distinct features for z/Hf > 0.10–0.15, where the TKE budget is fairly closed due to the negligible value of the imbalance term I. Above z/Hf = 0.10–0.15, equilibrium between the turbulence production and dissipation rates is found and confirmed by the validity of the logarithmic velocity distribution shown in figure 5. Around the production peak elevation, production exceeds dissipation. The upshift of the production peak for dp3 SL flows seems to be accompanied by a similar peak upshift in the TKE dissipation rate. Therefore, given that the lower part of the inner region is not fully resolved, we cannot infer the trend of (vertically integrated) bulk TKE dissipation rate for dp3.
4.2.3. The TKE transport rate
As can be seen for all CW and SL flows in figure 6, the transport of TKE is maximal near the peak of TKE production. For all CW flows and dp1 SL flows only, this region of TKE excess is restricted to the lower part of the inner flow region below the equilibrium region. Because for all CW and dp1 SL flows only, the TKE transport is an energy sink (positive sign) over almost the entire measured domain (i.e. for 0.01–0.02 < z/Hf < 0.6) and because the transport terms must be in equilibrium vertically (in a two-dimensional mean flow), the transported TKE must become an energy source in the (non-measured) upper flow region z > 0.6Hf. Furthermore, due to the negligible shear-stress-induced TKE production for z > 0.6 Hf, it can be deduced from the present TKE budget that the transported TKE originating from the inner flow region is primarily dissipated into heat in the upper flow region near the free surface (not shown here). This also holds for the dp1 SL flows because the suspended sediment transport makes a minor contribution for z > 0.6 Hf. This vertical redistribution process of TKE has no importance for sediment transport but it is known to play a leading role for dissolved gas-exchange processes at the air–water interface of highly turbulent free-surface flows (Moog & Jirka Reference Moog and Jirka1999; Nimmo Smith, Thorpe & Graham Reference Nimmo Smith, Thorpe and Graham1999). Note, however, that, in addition to the TKE transport to the upper flow region z > 0.6 Hf, the turbulent diffusion also becomes a source term inside a very narrow region near the wall z/Hf < 0.01, that corresponds to the roughness (canopy) sublayer. This is observed through its positive values near the wall for some CW and dp1 SL flows. We did not capture systematically this change in sign since it occurs in the very narrow roughness sublayer for CW and dp1 SL flow cases, as explained above in the interpretation of figure 3 in § 3.2. These results are in agreement with previous studies (Krogstad & Antonia Reference Krogstad and Antonia1999; Mignot et al. Reference Mignot, Barthelemy and Hurther2009a), where negative values of the TKE diffusion term were noted near the wall only in fully rough turbulent wall-bounded flows. This point will be further developed in the following paragraphs.
A very distinct behaviour of the TKE transport is observed for all large particle dp3 flows compared with their reference CW and all other dp1 SL and reference CW flows. A systematic positive TKE transport (acting as a source of energy) is found in the vicinity of the flow bed for z < 0.1Hf . This region is found to be much larger for the SL dp3 flows compared with all other CW and dp1 SL flows. Similarly to the TKE production term, the region of positive TKE transport term is found to be upshifted in comparison with the corresponding reference CW flows. Above this layer, an equilibrium region is reached as in all other flows (confirming the existence of a log layer) but over a smaller vertical range than the corresponding reference CW and all other dp1 SL flows. This point is in good agreement with the observations in figure 5 (§ 3.2) of a vertically restricted log layer for the dp3 SL flows. The vertical upshift of the (positive) TKE transport region (i.e. the TKE production excess region) appears to be accompanied by the underlying near-wall region of negative value. This source of kinetic energy might increase the TKE dissipation rate (which is difficult to verify here due to the limited measurement resolution mentioned above) or might be at the origin of the sediment density stratification term associated with the transport of sediments. It appears that the vertical height of the near-wall TKE source region roughly matches the thickness of the sediment transport layer as bedload. Furthermore, the TKE involved (in terms of magnitude and associated area below the negative curve) is locally in equilibrium with the magnitude (multiplied by −1) and the area of the sediment stratification term. The LES results from Cheng et al. (Reference Cheng, Hsu and Chauchat2018) in similar flow conditions also show a near equilibrium between the TKE transport term and the drag dissipation term. The latter is the main sediment-related TKE loss term in TKE budget (Hsu, Jenkins & Liu Reference Hsu, Jenkins and Liu2004) in contrast to the stratification term in the mixture velocity formalism of (3.1). This suggests that TKE diffusion could potentially be an important mechanism of energy transfer towards the sediments moving as bedload, a quite unusual aspect for bedload transport modelling. This should be further justified through the discussion on coherent structure dynamics.
The possibility of a TKE diffusion term acting as a local energy source in the near-wall region has already been shown in the literature for rough-wall boundary layer flows. Krogstad & Antonia (Reference Krogstad and Antonia1999) measured a TKE transport term of the same sign as the TKE production term for their rough-wall flow case up to a region of approximately 0.18Hf. Similar trends were confirmed by DNS simulations in Miyake, Tsujimoto & Nakaji (Reference Miyake, Tsujimoto and Nakaji2001) and by measurements in Mignot et al. (Reference Mignot, Barthelemy and Hurther2009a, figure 9) for open-channel flows over a gravel bed. The thickness of this energy source layer was found to be determined by the elevation of the bed roughness elements. For all these rough-wall CW flow studies, the presence of a near-wall transport-induced TKE source was accompanied by an upshift of the peak TKE production position, which seems to induce the downward directed transport of TKE. The present results support these observations, as for all CW flows the diffusive TKE transport term is negative in a thin near-wall region, with its maximum (positive) values at the same vertical elevation as the TKE production peak. For the dp3 SL flows, it seems that the large bedload layer has a similar effect on the TKE production and transport terms, which suggests that the bedload layer has the same effect on the near-wall TKE budget as the increase of wall roughness in CW flows. The dp1 SL flows display the same trend as their respective CW flows, suggesting that the roughness sublayer remains unaffected by the presence of the dp1 bedload layer. This aspect will be further discussed in the following sections.
4.2.4. Sediment transport-induced density stratification
Sediment transport is classified into two modes of transport and corresponding layers of transport known as the bedload and suspension layers. In the suspension layer, the sediment-induced stratification term increases locally with mean suspended sediment concentration, hence it remains relatively small (usually below O(10−3) in volumetric concentration) in the outer flow region due its exponential decay with z following the well-known Rouse profile. It can be seen in figure 7 that sediment stratification increases significantly in the near-bed flow region, particularly for dp3 experiments, where it coincides with the bedload transport layer for all dp3 SL flows. The sharp increase in the sediment stratification term is not seen for the dp1 SL flows, which can be explained by the much lower suspension number values  ${w_s}/{u_\mathrm{\ast }}$ indicating a fully suspension-dominated sediment transport driven by turbulent mixing. Given the greater proportion of bedload transport for dp3 SL flows, high concentrations well above 8 % are reached in the bedload layer compared with all dp1 SL flows. The fraction of TKE spent by the flow to carry sediment in suspension can be estimated by the magnitude of the flux Richardson number as
 \begin{equation}Ri = g(s - 1)\frac{{{w_s}\bar{c}}}{{ - u^{\prime}w^{\prime}\,\textrm{d}\bar{u}/\textrm{d}z}} ={-} g(s - 1) \frac{{{\epsilon _s}}}{{{\epsilon _{ms}}}} \frac{{ \textrm{d}\bar{c}/\textrm{d}z}}{{{{(\textrm{d}\bar{u}/\textrm{d}z)}^2}}},\end{equation}
Figure 7. Comparison of flux Richardson number with the same hydrodynamic conditions with dp1 (P1S10D7_SAT (∇) and P1S10D8_SAT (Δ)) and dp3 (P3S03D9_SAT (□), P3S03D10_SAT (o) and P3S03D11_SAT (◊)); all in capacity conditions.
where  ${\epsilon _s}$ and
  ${\epsilon _{ms}}$ are the sediment and turbulent momentum diffusivities, respectively. Note that, for the same forcing condition,
  ${w_s}\bar{c}$ will be larger for higher values of
  ${w_s}/{u_\mathrm{\ast }}$ (bedload proportion, and therefore the local concentration in the inner layer increases with
  ${w_s}/{u_\mathrm{\ast }}$). Consequently,
  $Ri$ will be higher and the stratification effects on flow turbulence will be more pronounced. This point will be further discussed in the next paragraph by comparing the SL flows with the same hydrodynamic conditions but with different particle diameters.
Figure 7 represents the vertical profiles of the flux Richardson numbers for two full-capacity dp1 and dp3 SL flows under the same flow condition (S10 for dp1 and S03 for dp3). It can be seen that the  $Ri$ value of dp1 is larger than dp3 in the suspension layer, but it remains generally well below the critical value of
  $Ri < 0.2$ excluding flow stratification effects. On the other hand, for dp3,
  $Ri > 0.2$ in the bedload layer, which suggests significant stratification-induced damping of flow turbulence. Therefore, differently from dp3, the stratification term for dp1 does not represent a significant local TKE loss even in the near-bed region. This strongly supports the nearly unchanged signature of the production and diffusion terms for all dp1 SL flows compared with their reference CW flows. Furthermore, the energy excess region (where production exceeds slightly dissipation) in saturated dp1 flows is seen to occur at the same level (just above the bed) as in its reference CW flow. This suggests that the roughness sublayer is still dominated by the wall roughness rather than the bedload layer thickness in the dp1 SL flow cases. This aspect will be analysed in the following on the basis of coherent flow structure dynamics.
In conclusion of this section on the TKE budget, the present measurements reveal strong persistent modification in the signature of the diffusive TKE transport term, from CW to SL flows in dp3 experiments. This is highlighted in figure 8, by comparing flows with same hydrodynamic conditions but with different particle diameters. We display the results for repeated runs to show the high degree of repeatability (differences below 20 %) of the measured TKE budget. The profiles of normalized streamwise velocity (by the depth-averaged value U) and concentration (by the maximum concentration) are also shown. Note that the two CW production terms converge towards a similar (absolute) value near the bed, supporting identical hydrodynamic forcing for both flows. For dp3, the stratification term near the wall is relatively high, reaching around 50 % of the local production, as indicated by the value of the local flux Richardson number ( $Ri \approx 0.5$, in figure 7). Since the dissipation rate has a similar magnitude as the production term, the energy loss via the stratification term cannot be explained by the local production. The balance appears to originate primarily through the TKE transport terms, which becomes a local source of TKE. This is supported by the similar magnitudes and profile shapes of the TKE transport and the sediment density stratification terms in figure 8(b). Hence, the TKE transported by turbulent diffusion from the upshifted height of peak TKE production towards the near-bed region could play an important role in the transport of particles as bedload.

Figure 8. The TKE budget of repeated runs for flows of same hydrodynamic conditions with dp1 (a), maximum Shields regime S10 and dp3 (b), minimum Shields regime S03, at maximum concentration (top) and CW (bottom); symbols as in figure 6. Column (c) corresponds to the normalized streamwise velocity (Δ for dp1 and o for dp3) and concentration (∇ for dp1 and □ for dp3).
4.3 Coherent flow structure dynamics
The present section is devoted to the analysis of coherent flow structures and their dynamics in relation to the TKE budget properties observed for dp1, dp3 SL flows and their respective reference CW flows. For this purpose, conditional statistics of the Reynolds shear stress −ρ u′w′ will be quantified by the application of the so-called quadrant threshold method (Lu & Willmarth Reference Lu and Willmarth1973; Nakagawa & Nezu Reference Nakagawa and Nezu1977; Raupach Reference Raupach1981). This conditional sampling technique allows to evaluate the decomposition of the mean velocity co-variance  $\overline {u^{\prime}w^{\prime}} $ at a given vertical position, into contributions from instantaneous
  $u^{\prime}w^{\prime}$ events oriented along the four quadrants constituting the
  $(u^{\prime},w^{\prime})$ plane and having a magnitude larger than
  $H\overline {u^{\prime}w^{\prime}} $; H is called the threshold level. The four quadrants events are defined as: outward interactions
  ${Q_1}(u^{\prime} > 0,w^{\prime} > 0)$, ejections
  ${Q_2}(u^{\prime}< 0,\ w^{\prime}> 0)$, inward interactions
  ${Q_3}(u^{\prime} < 0,w^{\prime}0)$ and sweeps
  ${Q_4}(u^{\prime} > 0,w^{\prime} < 0)$. The instantaneous
  $u^{\prime}w^{\prime}$ events with magnitude strictly smaller than
  $H\overline {u^{\prime}w^{\prime}} $ are referred to as hole events. The u′w′ events in a given quadrant Q and of magnitude larger than
  $H\overline {u^{\prime}w^{\prime}} $ can be estimated (and averaged) as
 \begin{equation}{\overline {u^{\prime}w^{\prime}} _{Q,H}} = \frac{1}{T}\int_0^T {u^{\prime}w^{\prime}{I_{Q,H}}(t)\,\textrm{d}t} ,\end{equation}
 where the subscripts Q and H refer to the quadrant index and the value of the threshold level H, respectively; T is duration over which the conditionally sampled  $u^{\prime}{w^{\prime}_H}$ is averaged and
  ${I_{Q,H}}$ is the u′w′ sampling function, given by
 \begin{equation}{I_{Q,H}}(t) = \left\{
{\begin{array}{*{20}{@{}l}} { 1\quad \textrm{if}\
u^{\prime}w^{\prime}\ \textrm{is}\ \textrm{in}\
\textrm{quadrant}\ Q\ \textrm{and}\
|u^{\prime}w^{\prime}|> H{u_{rms}}{w_{rms}}}\\ {0\quad
\textrm{otherwise}} \end{array}}
\right..\end{equation}
\begin{equation}{I_{Q,H}}(t) = \left\{
{\begin{array}{*{20}{@{}l}} { 1\quad \textrm{if}\
u^{\prime}w^{\prime}\ \textrm{is}\ \textrm{in}\
\textrm{quadrant}\ Q\ \textrm{and}\
|u^{\prime}w^{\prime}|> H{u_{rms}}{w_{rms}}}\\ {0\quad
\textrm{otherwise}} \end{array}}
\right..\end{equation} The relative contribution to the mean Reynolds shear stress  $\overline {u^{\prime}w^{\prime}} $ of u′w′ events in each quadrant Q and of magnitude larger than
  $H\overline {u^{\prime}w^{\prime}} $ is given by the ratio
 \begin{equation}R{S_Q} = \frac{{{{\overline {u^{\prime}w^{\prime}} }_{Q,H}}}}{{\overline {u^{\prime}w^{\prime}} }}.\end{equation}
 In the present study, the quadrant analysis is not only applied to analyse the dynamics of Reynolds shear stress  $u^{\prime}w^{\prime}$ in SL flows, but also extended to the TKE flux
  $kw^{\prime}$ and vertical particle flux
  $c^{\prime}w^{\prime}$. For this purpose, the detection function in (4.4) is not modified since we are interested in observing how selected
  $u^{\prime}w^{\prime}$ shear-stress events contribute to the mean TKE flux
  $kw^{\prime}$ and to the mean vertical turbulent particle flux
  $c^{\prime}w^{\prime}$.
Figure 9 represents the profiles of mean vertical TKE flux  ${F_k} = \overline {kw^{\prime}} $ and the profiles of the parameter RS 4/RS 2, for a threshold value H = 0. This parameter as the ratio of sweep over ejection contributions has been studied in great detail in the literature on CW boundary layer and open-channel flows (Nezu & Nakagawa Reference Nezu and Nakagawa1993). For the SL flows studied herein, figure 12 reveals an almost perfect match between the positions of Fk = 0 and RS 4/RS 2 = 1, both in CW and all dp1 and dp3 SL flows. This strongly supports that the coherent flow structures governing the shear-stress parameter RS 4/RS 2 are the ones governing the vertical transport of TKE. In particular, the dominance of sweep events in the near-bed region where RS 4/RS 2 > 1 is responsible of the downward transport of TKE (Fk < 0). This is in good agreement with results found by Raupach (Reference Raupach1981) and Krogstad, Antonia & Browne (Reference Krogstad, Antonia and Browne1992) in rough-wall boundary layer flows, by Hurther et al. (Reference Hurther, Lemmin and Terray2007) in hydraulically rough CW open-channel flows and by DNS simulations of Yuan & Piomelli (Reference Yuan and Piomelli2014b). The dominance of ejection-type shear-stress events in the region delimited by RS 4/RS 2 < 1, is responsible for the transport TKE upwards (Fk > 0). Raupach (Reference Raupach1981) provided quantitative evidence of the governing role played by ejection- and sweep-type coherent flow structures in the transport of TKE. This is also confirmed here for all investigated SL flows.

Figure 9. Turbulence transport Fk (× for SL and - - for CW) and RS 4/RS 2 (+ for SL and – for CW); with increasing concentration from lower (bottom row) to saturation (top row); for dp1 (θ ≈ 0.4 (a), θ ≈ 1.2 (b)) and dp3 (θ ≈ 0.35 (c), θ ≈ 0.8 (d)).
It can further be seen in figure 9 that, only for dp3 SL flows, the level corresponding to the upper limit of the sweep-dominated region is systematically upshifted with increasing concentration while maintaining a good agreement between the positions where Fk = 0 and RS 4/RS 2 = 1. This result is consistent with the significant upshift of the peaks in TKE production and dissipation rates for dp3 flow cases. Hence, in the presence of a thick bedload layer, there is an increased dominance of sweep events, which transports TKE downwards into the bedload layer. Interestingly, the change of signature in presence of sediment is barely noticeable for dp1. This supports that the presence of a bedload layer larger than the sweep-dominated layer for the same CW condition is the cause of the modified signature, for dp3. This suggests that, for dp1, the sweep-dominated layer has the same extension as in CW because the thickness of the bedload layer remains smaller than the (bed-roughness-induced) sweep-dominated layer. In other words, the roughness sublayer thickness in the CW flows for dp1 remains larger than the bedload layer thickness and, hence, no clear modification of the TKE budget is observed in figure 6 between the dp1 SL flows and their reference CW flows.
The dependence and sensitivity of the production and turbulent diffusion terms to the bed roughness conditions is well documented in the literature. Nakagawa & Nezu (Reference Nakagawa and Nezu1977) have shown that the magnitude of sweep over ejection contributions, RS 4/RS 2 increases with roughness, and that the thickness of the near-bed region where sweeps exceed ejections (RS 4/RS 2 > 1) increases with bed roughness. In addition, they found that negative values of mean Fk are only found for rough walls in contrast to smooth walls and that the vertical range of negative values of Fk increases with roughness. Raupach (Reference Raupach1981) confirmed these observations and presented an explicit relationship between Fk and the coherent flow structure parameter  $\Delta RS = R{S_4} - R{S_2}$. One major difference between the present SL flow results with dp3 and the typical CW rough flows is that, in the latter, the increased downwards TKE transport in the absence of sediments is balanced by an increased viscous dissipation rate (or by a turbulent pressure transport) compared with smooth-wall flows, whereas the downward transported TKE can potentially cause sediment transport as bedload. The remaining energy excess might also increase locally viscous dissipation but to a lesser degree.
To gain further insights into the transport of TKE by coherent flow structures, Fk was conditionally sampled (considering all 4 quadrants), with different values of threshold level H, as shown in figure 10, only for the SL flows under capacity condition. The average operator, defined by (4.3), is here applied to Fk. It is seen that up to approximately H = 4, the signature and magnitude of conditionally sampled FkH is almost unchanged compared with the mean Fk which means that shear-stress events of level below H = 4 make a negligible contribution to Fk. Only for H = 6 does FkH start to decrease noticeably with a maximal reduction of approximately 25 %. This suggests that TKE flux Fk is mainly driven by strong shear-stress events. This result was previously highlighted by Hurther et al. (Reference Hurther, Lemmin and Terray2007) and Mignot et al. (Reference Mignot, Barthelemy and Hurther2009a), based on ADVP measurements in turbulent, rough CW open-channel flows. A similar analysis was performed by taking only Q2 and Q4 events into account. It was seen that FkH is even larger than Fk, indicating that Q2 and Q4 shear-stress events are the dominant contributors to turbulent TKE transport. Hence, it can be inferred that the transport of TKE into the bedload layer is due to occurrence of very intense and intermittent coherent structures. The intermittency of the intense shear events is well described by the time fraction of their occurrence Tf. For instance, coherent flow structures with threshold values H = 2.5, 4.0 and 6.0, responsible for generating most of Fk, have very low time fractions  ${T_f} = 12\,\textrm{\%},6\,\textrm{\%}$ and 2 %, respectively.

Figure 10. Mean Fk (bo) and conditionally sampled FkH (all four quadrants), for H = 2.5 (+), H = 4 (-+) and H = 6 (-); for dp1 (θ ≈ 0.4 (a), θ ≈ 1.0 (b)) and dp3 (θ ≈ 0.35 (c), θ ≈ 0.8 (d)) only runs in saturation.
Now that it has been shown that coherent structures are highly correlated with the transport of momentum  $(\overline {u^{\prime}w^{\prime}} )$ and of turbulent energy
  $(\overline {kw^{\prime}} )$, their importance in the transport of sediments
  $(\overline {c^{\prime}w^{\prime}} )$ can be examined. We take only the runs with maximum concentration (in saturation). It should be recalled that the accuracy of measured vertical turbulent sediment fluxes
  $\overline {c^{\prime}w^{\prime}} $ in the present highly inertial conditions is questionable because w′ corresponds to a mixture velocity rather than the sediment-phase velocity. Nevertheless, we are interested mostly in the relative contributions and general trends of conditionally sampled
  $\overline {c^{\prime}w^{\prime}} $, rather than absolute values.
As for the fractional contributions of conditionally sampled shear events (4.5), in figure 11, the fractional contributions of the conditionally sampled vertical turbulent particle flux  $c^{\prime}{w^{\prime}_H}$ (taking all 4 quadrants) and its mean value
  $\overline {c^{\prime}w^{\prime}} $ are represented, for different values of threshold level H. It is seen that, for H = 1.0, 2.5 and 4.0, the relative contributions to the mean vertical solid flux are approximately
  $c^{\prime}{w^{\prime}_H}/\overline {c^{\prime}w^{\prime}} = 0.70{-} 0.8,0.35{-} 0.5$ and
  $0.2{-} 0.28$, respectively. These relative contributions confirm the strong correlation between the large-scale coherent motions and the vertical particle fluxes for all SL conditions, irrespective of particle size and of suspension number value. The time fractions occupied by the conditionally sampled events having values of H = 1.0, 2.5 and 4.0 are
 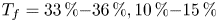 ${T_f} = 33\,\% {-} 36\,\%,10\,\% {-} 15\,\%$ and 3 %–7 %, respectively, supporting the high intermittency of
  $c^{\prime}w^{\prime}$ originating from the highly intermittent ejection and sweep events. One important feature is the higher particle entraining efficiency of the strongest events, for dp3. Note that, in (c) and (d), the ratio is systematically larger than in (a) and (b), indicating greater correlation between
  $c^{\prime}w^{\prime}$ and
  $u^{\prime}w^{\prime}$ events. This result supports the argument of Gyr (Reference Gyr1983) that large particles can only be entrained by intense coherent flow structures. To verify the importance of ejections and sweeps for this case, the same ratio was estimated taking only Q2 and Q4 events. Very similar magnitudes as in the case of the four quadrants (figures 11c and 11d) were found, confirming the leading role in particle dynamics played by ejection- and sweep-type events of high threshold values. Similar dynamics was found by Hurther & Lemmin (Reference Hurther and Lemmin2003), for sediment-laden flows in the suspension regime
  $({w_s}/{u_\mathrm{\ast }} < 0.6)$. The same dominant role played by ejection- and sweep-type events is observed here for SL flows with much higher values of the suspension number.

Figure 11. Fractional contribution of selected events (taking all four quadrants) to the mean vertical turbulent sediment flux; with H = 1 (-), H = 2.5 (+) and H = 4(+-); for maximum sediment concentration regime (SAT); Panels as in figure 10.
The good correlation between the intense large-scale coherent motions and particle motions supports the hypothesis that the increased downwards TKE flux by sweep events might be an important mechanism of energy transfer towards the particles inside the bedload layer.
4.4 Log-law roughness height
The bedload layer-induced bed roughness analogy observed in the signatures of the TKE budget and coherent flow structure dynamics for the dp3 SL flows are analysed here on the basis of the roughness height parameter  ${k_s}$ in the logarithmic velocity profile. In the presence of a bedload layer transport reaching a thickness larger than the standard reference height of 0.05 Hf (as the lower limit of the Rouse formulation applicability), Guta et al. (Reference Guta, Hurther and Chauchat2022) derived the following equation from direct measurements of turbulent mixing length profiles for the dp3 SL flows:
 \begin{equation}u = \frac{{{u_\ast }}}{{{\kappa _s}}}\ln \left( {\frac{{z - {z_d}}}{{\delta - {z_d}}}} \right) + {u_\delta },\end{equation}
 where  $\delta $ is the thickness of the bedload layer,
  ${\kappa _s}$ is the von Kármán parameter in SL flows,
  ${z_d}$ is the origin of the best fitted linear mixing length and
  ${u_\delta }$ is the velocity at the level
  $\delta $. Equation (4.6) is equivalent to common parametrizations of the velocity distributions in rough CW open-channel flows, such as (4.1). From (4.1) and (4.6), we obtain
  ${k_s} \approx \delta - {z_d}$, implying that the roughness height increases with bedload layer thickness
  $\delta $. In figure 12 we compare the measured values of
  $\delta - {z_d}$ in our dp3 SL flows with classic parametrizations of
  ${k_s}$ in sheet flows, namely Wilson (Reference Wilson1987) and Sumer et al. (Reference Sumer, Kozakiewicz, Fredsøe and Deigaard1996). A third, more recent, parametrization proposed by Schretlen (Reference Schretlen2012) is also tested for comparison. These parametrizations are given by
 \begin{gather}\textrm{Wilson}\ (\mbox{1987}):\ {k_s}/{d_p} = 5\theta \quad \textrm{for}\ \theta > 1,\end{gather}
 \begin{gather}\textrm{Schretlen}\ (\mbox{2012}):\ {k_s}/{d_p} = 6.55{\theta ^{0.7}}\quad \textrm{for}\ \theta > 0.5,\end{gather}
 \begin{gather}\textrm{Sumer}\ et\ al.\
(\mbox{1996}):\left\{ {\begin{array}{*{20}{@{}l}}
{{k_s}/{d_p} = 2 + 0.6{\theta^{2.5}}}&{\textrm{for}\
{w_s}/{u_\ast } > 1}\\ {{k_s}/{d_p} = 4.5 +
\dfrac{1}{8}\exp \left[ {\left( {0.6{{\left(
{\dfrac{{{w_s}}}{{{u_\ast }}}} \right)}^4}{\theta^2}}
\right)} \right]{\theta^{2.5}}}&{\textrm{for}\
{w_s}/{u_\ast }< 0.8- 1} \end{array}}
\right..\end{gather}
\begin{gather}\textrm{Sumer}\ et\ al.\
(\mbox{1996}):\left\{ {\begin{array}{*{20}{@{}l}}
{{k_s}/{d_p} = 2 + 0.6{\theta^{2.5}}}&{\textrm{for}\
{w_s}/{u_\ast } > 1}\\ {{k_s}/{d_p} = 4.5 +
\dfrac{1}{8}\exp \left[ {\left( {0.6{{\left(
{\dfrac{{{w_s}}}{{{u_\ast }}}} \right)}^4}{\theta^2}}
\right)} \right]{\theta^{2.5}}}&{\textrm{for}\
{w_s}/{u_\ast }< 0.8- 1} \end{array}}
\right..\end{gather}
Figure 12. Comparison between  $\delta - {z_d}$ and ks as parametrized by Wilson (Reference Wilson1987) (-.), Sumer et al. (Reference Sumer, Kozakiewicz, Fredsøe and Deigaard1996) (- -) and Schretlen (Reference Schretlen2012) (.); (-) is the parametrization that represents best the present data (4.10).
As previously shown by Guta et al. (Reference Guta, Hurther and Chauchat2022), the bedload layer thickness of a dp3 SL flow at a fixed hydraulic condition (i.e. for a given Shields number value) is found to increase with sediment load up to the full-capacity load. This was observed for the three studied Shields number values of dp3 SL flows (see table 1).
It can be seen in figure 12 that the  $\theta $ dependence of the measured
  $\delta - {z_d}$ is well captured by Wilson's (Reference Wilson1987) and Schretlen's (Reference Schretlen2012) parametrizations. The experimental data are within the upper limit and lower limits set by Schretlen's and Wilson's models, respectively (except for one point). The two constant values predicted by Sumer et al. (Reference Sumer, Kozakiewicz, Fredsøe and Deigaard1996) do not capture accurately the trend with
  $\theta $, however, the magnitude of the values is similar to the measurements. This overall good agreement strongly supports that bedload transport by highly turbulent boundary layer SL flows leads to an increased roughness height via the parameter
  ${k_s}$ in the log-velocity profile. In the same figure, a parametrization that best fits the present experiments is also represented. It can be written as
 \begin{equation}\frac{{\delta - {z_d}}}{{{d_p}}} = \frac{{ks}}{{{d_p}}} = 6{\theta ^{0.8}}\quad \textrm{for}\ 0.35 < \theta < 1.5.\end{equation}
Possibly the parametrization is insufficient to capture the evolution of the roughness height over an extended range of Shields number. Camenen, Bayram & Larson (Reference Camenen, Bayram and Larson2006) reported that the Shields number alone is not sufficient to describe accurately the evolution of the roughness height over a very wide range of transport conditions.
The present data suggest that  ${z_d} \approx 0.5\delta $ for dp3 (see Guta et al. Reference Guta, Hurther and Chauchat2022), which agrees well with the results of Sumer et al. (Reference Sumer, Kozakiewicz, Fredsøe and Deigaard1996). Since
  $\delta - {z_d} \approx {k_s}$, as discussed above, it results that
  ${z_d} \approx {k_s}$, leading to
  $\delta \approx 2{k_s}$. This relationship between
  $\delta $ and
  ${k_s}$ is consistent with Wilson (Reference Wilson1987) who proposed
 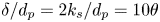 $\delta /{d_p} = 2{k_s}/{d_p} = 10\theta $.
5. Conclusion
In the present study, new experiments of high-resolution ultrasonic measurements of the velocity, particle concentration and particle flux profiles have been carried out in SL open-channel flows to analyse the mean TKE budget properties and their link to the dynamics of turbulent coherent flow structures. Two particle sizes (dp = 3 and 1 mm) were studied in order to cover a wide range of Shields numbers 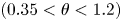 $(0.35 < \theta < 1.2)$, suspension numbers
 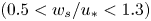 $(0.5 < {w_s}/{u_\ast } < 1.3)$ and Stokes numbers (0.5 < St < 3).
The effects of sediments on the TKE budget are found to be significant in all experiments with the large, highly inertial dp3 particles, for which a dominant fraction of particle transport occurs as bedload. It is found that the turbulent production term is strongly reduced in the near-wall layer corresponding to the bedload layer. A characteristic signature in these experiments is that the peak of the maximal turbulence production rate occurs at the top of the bedload layer where the vertical mean concentration gradient is maximal along the vertical direction. When compared with the reference CW boundary layer flows, this induces a vertical upshift of the peak TKE production region with an increased downward diffusion of TKE towards the flow bed, acting locally as a potential TKE source term. The amount of downward transported TKE is sufficient to balance, locally, the total energy spent by the flow to transport particles, mainly as bedload transport for the dp3 experiments. This suggests turbulence–particle interactions to be a dominant momentum transfer mechanism, even for bedload-dominated SL flows corresponding herein to sheet flows. Importantly, these features are not observed in the experiments with smaller (dp = 1 mm) particles dominated by suspended sediment transport. It is observed that a downward oriented TKE transport also exists as a very thin layer of TKE source, but it remains limited to the roughness sublayer independently of the hydraulic regime and the dp1 sediment load. This thin layer of low TKE source seems to be controlled by the size of the fixed bed roughness rather than by a particle-transport-related phenomenon.
The mechanism of this energy transfer was further analysed in relation to the dynamics of turbulent coherent flow structures dominated by ejection- and sweep-type Reynolds shear-stress events. It was found that these large-scale flow structures are strongly connected to the mean TKE budget through the mean TKE flux along the streamwise normal flow direction. This was shown by the good agreement between the level where the profile of TKE flux  $Fk$ vanishes to a nearly zero value and the level where the sweep and ejection contributions become identical, i.e. when the ratio
  $RS4/RS2$ reaches a value close to 1, both in CW and SL flows. Importantly, only for the larger dp3 particle experiments was the transition level significantly upshifted, following the same upshift as the peak TKE production at the origin of the increase of downward diffused TKE. The trend is similar to that observed due to increased wall roughness in turbulent CW boundary layer flows. This suggests that the bedload transport has similar effects on the mean TKE budget and dynamics of coherent flow structures as the effects induced by the increase of wall roughness in clear-water flows. This bedload-induced analogy with wall-roughness effects was further supported by the increase of the roughness parameter ks in the logarithmic velocity profile. For the dp1 experiments, the levels of
  $Fk = 0$ and
  $RS4/RS2 = 1$ remained independent of hydraulic and sediment transport conditions, supporting a wall-roughness-dominated ks rather than a bedload layer-dominated ks for all dp1 SL flows. This suggests that, for the dp1 flows, the bedload layer remained small compared with the wall-roughness governed roughness sublayer. For the dp3 flows, the roughness parameter ks was seen to scale with the bedload layer thickness as
  ${k_s} \approx \delta - {z_d}$. It was further confirmed that ks scales with the Shields number
  $\theta $ through a nearly linear relationship, as initially suggested by Wilson (Reference Wilson1987).
Funding
The ANR SHEET-FLOW project (ANR-18-CE01-0003), financed by the French National Research Agency (ANR), provided partial funding for H. Guta's PhD thesis. The remainder financial support was provided by a PhD fellowship from the French Ministry of Foreign Affairs and the French DGA-funded ANR Astrid Maturation project MESURE (ANR- 16-ASMA-0005).
Declaration of interests
The authors report no conflict of interest.
Appendix A
A.1. Mean profiles
In figures 13 and 14, the mean profiles of velocity, concentration and Reynolds shear stress, for saturated (upper row), moderate (second row), low (third row) particle loading and for the corresponding reference CW flow (bottom row) are shown for dp1 and dp3, respectively. These figures include all runs of SL flows. For the sake of clarity, only three CW runs (one in three) are included for each hydraulic condition, even if a clear-water flow run was acquired before each SL run (see tables 1 and 2). The similar profiles of the three repeated runs for the same solid-load regime confirm the high degree of the experiments repeatability. Some variability is observed for the two hydraulic regimes with highest flow intensities for particles dp1. These differences in absolute values do not affect the trend of the profiles discussed in the paper and are considered negligible for the repeated runs.

Figure 13. Mean velocity (a), concentration (b) and Reynolds shear-stress (c) profiles for dp3; for the three repeated SL runs (o, □ and +); with increasing concentration from CW (bottom row) to saturation (top row); the three hydrodynamic forcings are distinguished by the magnitude of the measured profiles; the three colours for each forcing condition correspond to the three repeated runs.

Figure 14. Mean velocity (a), concentration (b) and Reynolds shear-stress (c) profiles for dp1; with increasing concentration from CW (bottom row) to saturation (top row); for the three repeated SL runs (o, □ and +); with increasing concentration from CW (bottom row) to saturation (top row); the three hydrodynamic forcings are distinguished by the magnitude of the measured profiles; the three colours for each forcing condition correspond to the three repeated runs.
Figures 13(a) and 14(a) show the mean streamwise velocity  $\bar{u}$ profiles versus the normalized distance z/Hf above the bed. In general, a nearly logarithmic trend of the velocity profiles is observed both in CW and SL flows. The effect of sediment seems negligible at lower and intermediate concentrations, except for the dp3–S03 runs
  $(\theta \approx 0.35)$, which has a high proportion of bedload. The significant impact of the bedload on the velocity and sediment concentration has been discussed in Guta et al. Reference Guta, Hurther and Chauchat2022). It is found that, for dp3 SL flows, the streamwise velocity profiles are significantly reduced in the bedload layer, with a clear deviation from the logarithmic distribution and with a quasi-linearly evolving velocity distribution. Above the bedload layer, the mean velocity gradually evolves toward the logarithmic profile. This trend differs from the dp1 SL flows, which retain the classical logarithmic distribution along the flow depth, even at maximum concentration.
The time-averaged concentration  $\bar{c}$ profiles shown in figures 13(b) and 14(b) show the increase in injected particle load from the lower to the upper panels. Moreover, for a given solid-load regime (SAT, MED or LOW), the differences in the vertical distribution of particle concentration with hydraulic forcing condition can be analysed. It can also be seen that the vertical extension of the concentration profile increases with flow velocity (hydrodynamic forcing). This is often described in terms of suspension number value
  ${w_s}/{u_\ast }$, which decreases as the flow becomes more energetic. As expected, the concentration profiles confirm that fewer particles are transported in suspension as
  ${w_s}/{u_\ast }$ increases. The corresponding concentration profile for the high suspension number value exhibits higher vertical gradients, suggesting less turbulent particle mixing along the streamwise normal z-direction.
The profiles of Reynolds shear stress  $ - {\rho _m}\overline {u^{\prime}w^{\prime}} $ (where
  ${\rho _m} = (1 - \bar{c}){\rho _f} + \bar{c}{\rho _p}$ is the mixture density) are shown in figures 13(c) and 14(c). All flow conditions exhibit a linear profile for z/Hf > 0.2, although small deviations are observed, particularly when the SL flows are under full-capacity conditions. The linearity indicates the high degree of flow uniformity in the streamwise direction (Kironoto & Graf Reference Kironoto and Graf1994; Dey Reference Dey2014). The bed friction velocity values in tables 1 and 2 are estimated from the linear extrapolation of these profiles to the flow bed position (z = 0) with an uncertainty in
  ${u_\ast }$ of approximately 10 %. It can be seen that the bed shear stress of the most energetic flow regime is approximately twice that of the less energetic one, both in dp3 and dp1. Despite minor differences in profile shapes and maximum location inside the inner flow region (z/Hf < 0.2), the values of bed friction velocity do not vary more than 20 % between CW and SL flows and with no clear trends of increase or decrease. Please note that secondary currents due to sidewall and bottom wall-induced boundary layer interactions as well as flow perturbations due to the ACVP holding box may affect the vertical distribution of the shear-stress profiles for z/Hf > 0.6. For this reason, all profiles are restricted to the flow region z/Hf ≤ 0.6.


 Open access