

Currently, there are many soya beverages (SB) in the market. These beverages are based on soya extract, supplemented with or without nutrients and do not meet the recommendations of infant feeding, because of either their protein quality or mineral content, and hence cannot receive the name of infant formula( Reference Fenollosa and Dalmau 1 ).
In the beginning, the consumption of SB was limited mainly to people with lactose intolerance as a low-cost substitute for cows’ milk (CM), to vegetarians and to people with food restrictions( 2 , Reference Rosenthal, Deliza and Cabral 3 ). However, this product is now being widely used for its good acceptance and is being consumed on a large scale, indicating that the consumers have introduced it into their eating practices( Reference Behrens and da Silva 4 ).
According to the studies that evaluated the knowledge of paediatricians and nutritionists regarding CM and its derivatives in exclusion diets, with emphasis on infant feeding, beverages or juice based on soybean extract were considered by several professionals as possible substitutes for CM protein( Reference Cortez, Medeiros and Speridião 5 , Reference Faria, Cortez and Speridião 6 ).
Raw soyabean has antinutritional factors in its composition that are capable of producing negative effects on human health. Among them, phytates are prominent, which can interact with minerals such as Fe and Ca and reduce their absorption( 2 , Reference Osman, Reid and Weber 7 , Reference Bajpai, Aparna Sharma and Gupta 8 ). Phytic acid has long been considered an antinutritional factor because it can form complexes with proteins and metal ions and prevent optimal absorption of minerals from the intestine( Reference Sandberg and Andlid 9 ). In this sense, high phytate concentrations in soya-based beverages decrease the bioavailability of many minerals, including Ca and Fe( Reference Lopez, Leenhardt and Coudray 10 ).
Ca and Fe are elements of great nutritional importance. Ca is the main mineral present in bone tissue, and its importance is imperative for adequate growth( Reference Pereira, Genaro and Pinheiro 11 ). Similarly, Fe is also as important and is found to be lacking in Fe-deficiency anaemia, particularly during childhood; this deficiency is characterised as an important nutritional problem in this phase of life( 12 ). Thus, optimising the bioavailability of Fe and Ca present in foods is an important action to prevent their deficiency. In this sense, the interactions between different nutrients in the bioavailability of Fe and Ca and other minerals have been investigated in the last few decades.
In this scenario, prebiotics have received special attention regarding the physiological aspects of Ca and Fe absorption( Reference Tako, Glahn and Welch 13 – Reference Lobo, Colli and Filisetti 16 ). Prebiotics act on the absorption of minerals, promoting the synthesis of short-chain fatty acids, generating soluble complexes and increasing surface absorption and the number of receptors and beneficial bacterial populations, among other mechanisms( Reference Freitas, Amâncio and de Morais 17 , Reference Tako and Glahn 18 ). Among the prebiotics, fructo-oligosaccharides (FOS) are one of the most studied and well-established prebiotics( Reference Tako, Glahn and Knez 19 , Reference Mugambi, Musekiwa and Lombard 20 ), and recent studies have shown their benefits associated with mineral absorption( Reference Freitas, Amâncio and de Morais 17 , Reference Freitas, Amancio and Novo 21 – Reference Carvalho, Brait and Vaz 23 ) without presenting damage to the body growth of animals. However, these studies did not evaluate the effects of prebiotics added to SB when compared with CM.
Thus the present study was performed based on the fact that there are few studies in the literature that have evaluated the absorption of Ca and Fe from SB compared with CM. Moreover, in general, the existing studies used a single test meal( Reference Bosscher, Dyck and Robberecht 24 – Reference Promchan and Shiowatana 28 ). There is no study on the effect of prebiotics on soya-based beverages compared with CM during periods when significant growth occurs. This study was developed as an experimental model with rats, which allows the evaluation of not only food intake but also somatic growth and apparent absorption and retention, and also analyses the performance that may address our objective. In consideration of the abovementioned view, the objective of the study was to evaluate the effects of FOS supplementation in SB on intestinal absorption of Ca and Fe, dietary intake, body growth, intestinal weight and caecal pH in recently weaned rats compared with recently weaned rats fed with CM with and without FOS.
Methods
Animals and diets
A total of thirty-two male Wistar rats, 21-d-old (on the first day of weaning), were taken from the Experimental Models Development Centre (Centro de Desenvolvimento de Modelos Experimentais – CEDEME) of the Federal University of Sao Paulo (Universidade Federal de São Paulo – UNIFESP) and kept in the Research Laboratory of the Department of Paediatrics of the Federal University of Sao Paulo – Paulista Medical School (Escola Paulista de Medicina), São Paulo, SP, in individual metabolic cages made of acrylic and stainless steel (Nalgene Metabolic Cages 650-0100, Tecniplast) under a light cycle of 12 h and at a temperature of 23±1°C. Each cage was adapted with two troughs previously rinsed in deionised water. The use of these cages prevented coprophagy and the contamination of Fe and allowed evaluations of apparent absorption and retention because urine and faeces were collected and maintained separately. There were four groups of eight animals each, which received the following diets: cows’ milk (CM) – animals that received lactose-free CM; cows’ milk + FOS (CMF) – animals that received lactose-free CM supplemented with FOS (0·8 g/100 ml); soya beverage (SB) – animals that received soya extract-based beverage; and soya beverage+FOS (SBF) – animals that received soya extract-based beverage supplemented with FOS (0·8 g/100 ml). The CM and CMF groups were considered as control groups.
Dietary intake and diet composition
During the entire study period (seven consecutive days), the animals received deionised water from a MilliQ Plus system (Millipore Indústria e Comércio Ltda.) and a liquid diet ad libitum. The volumes consumed were measured daily, and the troughs were sanitised at each meal change (diet split two times a day: 50 ml in the morning and 100 ml in the evening). Water (100 ml) was offered once a day.
Food intake was determined according to the ingested volume within 7 d of the experiment. Evaluation of the daily food intake allowed the calculation of the feed efficiency coefficient, which was expressed as follows: weight gain (g)/intake of ingested diet (ml).
Regarding SB, a well-known and widely marketed brand in the Brazilian market with an original flavour was used. Ultra-high temperature CM, semi-skimmed without lactose was also used. Regarding the nutritional content, the values declared on the labels were considered, except for the Fe and Ca contents, which were obtained by chemical analysis, tested in triplicate, from different batches and performed in the Laboratory of Food Science and Microbiology of the Federal University of São Paulo – Paulista Medical School, São Paulo, SP, Brazil using standardised techniques. The full nutrient composition of the diets and ingredients used were reported in Table 1.
Nutritional composition of the diets offered during the experiment according to the information on the label of each product
CM, animals fed lactose-free cows’ milk; CMF, animals fed lactose-free cows’ milk supplemented with fructo-oligosaccharides; SB, animals fed with soya-based beverage; SBF, animals fed with soya-based beverage supplemented with fructo-oligosaccharides.
* Value determined by laboratory analysis.
† Ingredients of CM and CMF according to manufacturer's information: semi-skimmed milk, lactase enzyme and stabilisers sodium citrate, sodium triphosphate, sodium monophosphate and sodium diphosphate.
‡ Ingredients of SB and SBF according to manufacturer's information: soya extract, water, sugar, vitamins (C, E, B2, B6, A, folic acid, D and B12), minerals (Ca, Zn), salt, stabilisers gellan gum, trisodium citrate and xanthan gum, flavouring and emulsifying soya lecithin.
In the present study, the cows’ milk control groups (CM and CMF) received lactose-free CM, considering that in previous studies, it was verified that the weaned animals that received infant formulas with lactose presented with higher amounts of softened faeces, which may suggest lactose malabsorption( Reference Costa, Freitas and Amâncio 29 , Reference Farjalla 30 ). Thus, lactose-free CM, such as soya extract-based beverage, was used.
The prebiotic dose (FOS) used in the study was given at the concentration of 0·8 g for each 100 ml, analogous to commercialised infant formulas; in addition, this dose is the maximum value recommended by the National Sanitary Surveillance Agency (Agência Nacional de Vigilância Sanitária – ANVISA)( 31 ). Furthermore, as observed in previous pilot studies in our laboratory, supplementation with this prebiotic concentration did not promote diarrhoea in the animals.
Experimental procedures
The experiment was performed in two stages. Each stage had 16 animals, with a total of thirty-two rats. They were divided into four groups of four rats in each group. On the first day of the study, four similar groups were formed, and the animals were weighed and measured. The weights were measured with a digital electronic scale, CG-Libror L-600 (CG Instrumentos Científicos Ltda.), with a maximum capacity of 600 g and a sensitivity of 0·1 g. The length was expressed in centimetres, considering the body and tail measurements. These same procedures were repeated on the fourth and seventh day (28 d of animal life).
On the second day of the experiment, faecal occult blood tests were performed on each animal using the Hemoplus kit (Newprov – Produtos para Laboratórios Ltda.). This same procedure was repeated on the seventh day.
From the third day of the experiment, stool collection was performed to determine faecal balance and subsequent calculation of apparent Ca and Fe absorption levels. For this assay, 0·1 g of pink-carmine dye (Merck®) was added to the diet of each animal, and for three consecutive days, the eliminated faeces were collected from the time the colour change (reddish) occurred. After 72 h of the addition of rose-carmine, Evans blue dye (Inlab, soluble in water) was added to the diets. The collection was interrupted at the beginning of bluish colour faeces elimination. The faeces collected during the 3 d were weighed on an analytical electronic scale (Metler Toledo – model AB204), with a sensitivity of 0·0001 g, and stored in a freezer (–20°C). During the same period of faeces collection, all of the eliminated urine were also collected for further determination of apparent Ca retention. The urine collected during these three consecutive days was duly identified, measured with a glass test tube and stored at –20°C.
At 28 d of age (the seventh day of the experiment), the animals were previously anaesthetised with ketamine and xylazine (66·6 and 13·3 mg/kg, respectively), and blood from the heart was collected and centrifuged at 2500 rpm for 15 min to obtain serum, which was stored at –80°C for further analysis of serum Ca and 25-hydroxyvitamin D (25(OH)D). In addition, small blood samples (0·1 ml) from the heart were collected and separated for determination of Hb and haematocrit (Ht). Afterwards, the animals were submitted to euthanasia by exsanguination of the vena cava.
A median incision of the abdominal wall and peritoneum was performed, and the duodenum (standardising 5 cm of the pylorus) and caecum (sectioning it between the ileocaecal valve and the beginning of the proximal colon) were isolated. After the caecum, the colon was separated. Next, liver excision was performed. All intestinal portions and organs were weighed fresh, after washing with physiological saline to withdraw the contents of the lumen, weighed on an analytical electronic scale (Shimadzu model AY220) with a sensitivity of 0·0001 g and placed immediately in liquid nitrogen, stored at –80°C and used for quantification of divalent metal transporter 1 (DMT1), ferroportin and hepatic Fe. At that time, the pH of the caecal contents was also evaluated. For this assay, the animals were sacrificed between 06.00 and 10.00 hours, during which time the intestinal fermentation is more active (Younes et al., 2001). The pH of the caecal content was measured with disposable pH test strips, PHBIO ® (Photogenesis Biotecnologia).
Dose of serum calcium and 25-hydroxyvitamin D
The serum Ca level was determined using a colorimetric method, and the 25(OH)D dosage was determined using a chemiluminescence method.
Apparent absorption of calcium and iron
To determine the apparent absorption of Ca and Fe, the faeces collected for 72 h were then dried in an oven at 105°C, and after 22 h, they were weighed at intervals of 30 min, until two consecutive weights were obtained with less than 1·0 mg of difference. Stool moisture was calculated using the formula (((faeces fresh weight–faeces dry weight)/faeces fresh weight)×100)( Reference Marks, Moore and Kanabrocki 32 ).
Subsequently, 500 mg of dry faeces from each animal was separated into two 250 mg (duplicate) samples, which were subjected to liquid digestion using nitric acid and perchloric acid (volumes: 4 ml of nitric acid and 2 ml of perchloric acid; temperature of the digester: 200°C; wavelengths: Fe: 248·3 nm, Ca: 422·7 nm, slit: 0·7 nm, flame air/acetylene, energy: Fe: 60, Ca: 67) and then diluted in lanthanum chloride (Merck®) to a final concentration of 1 % for Ca analysis and in deionised water for Fe analysis, allowing the evaluation in an atomic absorption spectrophotometer( Reference Sarriá, López-Fandiño and Vaquero 33 ) (Perkin-Elmer model 5100 PC). The amounts of Ca and Fe ingested over the same period of time were also calculated. The percentage of Ca absorbed was calculated using the following formula( Reference Sarriá and Vaquero 34 ): (((amount of ingested Ca–amount of excreted faecal Ca)/amount of ingested Ca)×100). Absorption of Fe was calculated with a similar formula( 31 ).
Apparent retention of calcium
To determine the apparent retention of Ca, the urine collected during the faeces collection period was subsequently filtered on filter paper (Whatman Filter Papers 40, ashless, circles, 90 mmØ, Whatman Corp.) and diluted, allowing evaluation using an atomic absorption spectrophotometer( Reference Fernandez and Kahn 35 ). For analysis of Ca, lanthanum chloride (Merck®) was added to the samples (final concentration: 0·5 % lanthanum). Thus, the following formula was used to calculate the percentage of retained Ca: (((amount of ingested Ca–amount of faecal Ca excreted–amount of excreted urinary Ca)/amount of ingested Ca)×100).
Hb and haematocrit concentrations
The Hb concentration was determined using the cyanmethaemoglobin method, and the microhaematocrit was determined using the Wintrobe method( Reference Wintrobe, Mollin and Herbert 36 ).
Hepatic iron
The determination of hepatic Fe was also performed after liquid digestion of dry tissue, similar to that cited for faeces( Reference Marks, Moore and Kanabrocki 32 ). For this, the livers collected on the sacrifice day were oven dried at 120°C and after 22 h, they were weighed at intervals of 30 min, until two consecutive weighings with a difference of less than 1·0 mg were obtained. Subsequently, 500 mg of dried livers of each animal were weighed, divided into two 250 mg (duplicate) samples that were submitted to liquid digestion using nitric acid and perchloric acid, making possible the evaluation in atomic absorption spectrophotometer.
Western blot analysis
Samples of the duodenum, caecum and colon were placed in 800 μl of specific buffer, prepared on the day of the experiment, with the following composition to obtain total protein extracts: 100 mM Trizma base pH 7·5, 20 mM ethylenediaminetetraacetic acid, 100 mM sodium fluoride, sodium pyrophosphate 100 mM, 10 mM sodium orthovanadate, 2 mM phenylmethylsulfonyl fluoride and 0·1 mg/ml aprotinin. The tissues were quickly homogenised using a Polytron homogeniser, and 800 μl of 1 % Triton X-100 was then added and incubated for 30 min. The homogenate was centrifuged for 40 min at 14 000 rpm at 4°C. The supernatant was kept on ice, and the total protein content was determined by the Bradford method (Bio-Rad), which uses bovine serum albumin as a reference.
Protein samples were added to Laemmli buffer (0·01 % bromophenol blue, 100 mM sodium phosphate pH 7·0, 50 % glycerol and 10 % sodium dodecyl sulphate) at the ratio of 4:1 with 100 mM dithiothreitol. Volumes containing 75 μg of protein (caecum and colon) and 100 μg of protein (duodenum) were heated for 5 min before being subjected to 10 % denaturing sodium dodecyl sulphate-polyacrylamide gel electrophoresis in a Bio-Rad miniature slab gel apparatus. After electrophoresis, the samples were electrophoresed to nitrocellulose membrane for 1·5 h per four gels at room temperature at 15 V (constant) in a semi-dry transfer apparatus (Bio-Rad). To reduce non-specific protein binding, the membrane was blocked in 5 ml of a blocking solution (100 mM Trizma base pH 7·5, 500 mM NaCl, 500 µl/ml Tween-20) containing 1 % bovine serum albumin for 4 h. Subsequently, the membrane was incubated overnight at 22°C in blocking solution with primary antibodies against DMT1 (1:1000 – Santa Cruz Biotechnology) and ferroportin (1:1000 – Santa Cruz Biotechnology) or β-tubulin (1:10 000 – Cell Signaling Technology). The membranes were washed for 30 min in basal solution, shaken every 10 min and then incubated with the respective peroxidase-conjugated secondary antibodies for 1 h at 22°C. The secondary antibodies were anti-goat for ferroportin (1:5000), anti-mouse for DMT1 (1:5000) and anti-rabbit for β-tubulin (1:5000) (Sigma). The membranes were then re-subjected to 30 min of lavage with basal solution with shaking every 10 min and were then incubated with enhanced chemiluminescence Reagent from Amersham/GE and exposed to an Alliance 4.7 device (Uvitec) for photo documentation. The intensities of the bands of interest were identified by the electrophoretic migration patterns and quantified by optical densitometry using the Scion Image program (Scion Image-Released Beta 3b).
Statistical analysis
The data were submitted to the Shapiro–Wilk (normality), Levene (homogeneity) and/or Mauchly (sphericity) quality tests. When necessary, the data were standardised for Naperian Log. Two-way ANOVA or ANOVA for repeated measures was used to verify the effects of treatment and comparisons between groups, followed by post hoc Tukey or Kruskal–Wallis tests, followed by Dunn when necessary. All statistical tests were performed in SigmaPlot 12.0, and the other tasks were performed in Microsoft Excel 2016 and GraphPad Prism 5.0. The results are expressed as the means±standard errors of the mean (sem) or medians and 25th and 75th percentiles when necessary, and the level of significance was set at P<0·05.
Sample size calculation was based on a preliminary experiment. It was calculated that at least three samples in each group were needed to reach significance level between study groups when differences of P values <0·05 was assumed.
Ethical considerations
All animal care and use procedures were approved (CEUA 3498100315) by the Experimental Research Ethics Committee of the Federal University of São Paulo and performed in accordance with the relevant institutional and national guidelines, and the manuscript conform to the ARRIVE Guidelines for Reporting Animal Research.
Results
Baseline data
Three animals were excluded from the sample because they did not complete the entire study period due to post-anaesthesia death without apparent cause. One animal was from the CM group, one was from the CMF group and the other was from the SB group.
Food consumption, feed efficiency coefficient and weight gain
Table 2 shows the mean food intake (volume of ingested diet, Ca intake and Fe consumption), the feed efficiency coefficient and weight gain.
Calcium intake, iron intake and feed efficiency during the 7 d of the experiment in rat pups from the four diet groups* (Mean values with their standard errors)
CM, animals fed lactose-free cows’ milk; CMF, animals fed lactose-free cows’ milk supplemented with fructo-oligosaccharides; SB, animals fed with soya-based beverage; SBF, animals fed with soya-based beverage supplemented with fructo-oligosaccharides; FEC, feed efficiency coefficient.
* Two-way ANOVA test.
† P=0·018 v. SBF.
‡ P=0·004 v. SBF.
§ P<0·001 v. CM.
|| P<0·001 v. CMF.
¶ P=0·005 v. SB.
** P=0·004 v. SB.
The mean volume of consumed diet in the CM, CMF, SB and SBF groups were 442·86 (se 12·22), 409·29 (se 20·26), 429·57 (se 15·65) and 373·38 (se 14·63) ml, respectively (P<0·05). The volume of consumed diet was significantly higher in the SB group compared with the SBF group (P=0·018).
The mean Ca intake in the CM, CMF, SB and SBF groups were 566·86 (se 15·65), 523·89 (se 25·93), 549·85 (se 20·03) and 477·92 (se 18·72) mg, respectively (P<0·05), and those of the Fe intake were 1·51 (se 0·04), 1·39 (se 0·07), 2·92 (se 0·11) and 2·54 (se 0·10) mg, respectively (P<0·05). Ca intake in the SB group was higher in relation to the SBF group (P=0·018). The SB group had significantly higher Fe consumption than the CM (P<0·001) and SBF (P=0·004) groups. In addition, the SBF group presented significantly higher Fe consumption compared with the CMF group (P<0·001).
The mean weight gain in the CM, CMF, SB and SBF groups were 24·16 (se 2·39), 24·33 (se 2·55), 15·85 (se 0·65) and 14·10 (se 1·34) g, respectively (P<0·05), and those of the feed efficiency coefficient were 0·05 (se 0·00), 0·06 (se 0·00), 0·04 (se 0·00) and 0·04 (se 0·00) g/ml, respectively (P<0·05). Throughout the experiment, weight gain was significantly higher in the CM group compared with the SB group (P=0·005) and in the SBF group compared with the CMF group (P<0·001). The feed efficiency coefficient (g/ml) of the CM group was higher when compared with the SB group (P=0·004). The feed efficiency coefficient (g/ml) was also significantly higher in the SBF group compared with the CMF group (P<0·001).
Weights of different portions of the intestine and liver and pH of the caecal content
There were no significant differences between the groups regarding the rats’ duodenum, colon or liver weights in the CM, CMF, SB and SBF groups. The mean duodenum weights were 0·28 (se 0·03), 0·26 (se 0·03), 0·23 (se 0·03) and 0·25 (se 0·03) g, respectively (P>0·05), and those of the liver were 3·09 (se 0·20), 3·17 (se 0·23), 2·87 (se 0·16) and 2·63 (se 0·20) g, respectively (P>0·05). The medians and 25th and 75th percentiles of the colon were 0·41 (0·32–0·48), 0·45 (0·34–0·63), 0·46 (0·44–0·68) and 0·46 (0·43–0·59) g, respectively (P>0·05). The mean caecum weights in the CM, CMF, SB and SBF groups were 1·89 (se 0·33), 3·81 (se 0·38), 1·53 (se 0·13) and 3·50 (se 0·35) g, respectively (P<0·001), with significant differences between the CMF and CM groups (P<0·001) and between the SBF and SB groups (P<0·001). There was no significant difference between the groups that received prebiotics (P>0·05). The medians and 25th and 75th percentile values of the caecal content pH levels in the CM, CMF, SB and SBF groups were 8·00 (8·00–8·00), 6·00 (6·00–7·00), 7·00 (7·00–7·00) and 6·00 (5·00–6·00), respectively, with a significant difference between the CMF and CM groups (P<0·05) and between the SBF and SB groups (P<0·05). No significant difference was observed among the groups that received prebiotics (P>0·05).
Serum calcium concentration, 25-hydroxyvitamin D, apparent absorption and retention of calcium
The mean serum Ca in the CM, CMF, SB and SBF groups were 11·00 (se 0·34), 11·57 (se 0·36), 12·06 (se 0·63) and 11·64 (se 0·29) mg/dl, respectively (P>0·05). No significant differences were found between the groups when the serum Ca concentration was analysed (Fig. 1(a)).
Serum calcium concentration (a), serum concentration of 25-hydroxyvitamin D (25(OH)D) (b), apparent absorption of calcium (c) and apparent retention of calcium (d). CM, animals fed lactose-free cows’ milk; CMF, animals fed lactose-free cows’ milk supplemented with fructo-oligosaccharides; SB, animals fed with soya-based beverage; SBF, animals fed with soya-based beverage supplemented with fructo-oligosaccharides. Values are means with their standard errors. Two-way ANOVA test or Kruskal–Wallis test. The number in parentheses refers to the sample size. † P=0·003 v. CM. ‡ P=0·032 v. CMF. § P<0·001 v. SB. || P<0·001 v. SBF. To convert calcium in mg/dl to mmol/l, multiply by 0·25.
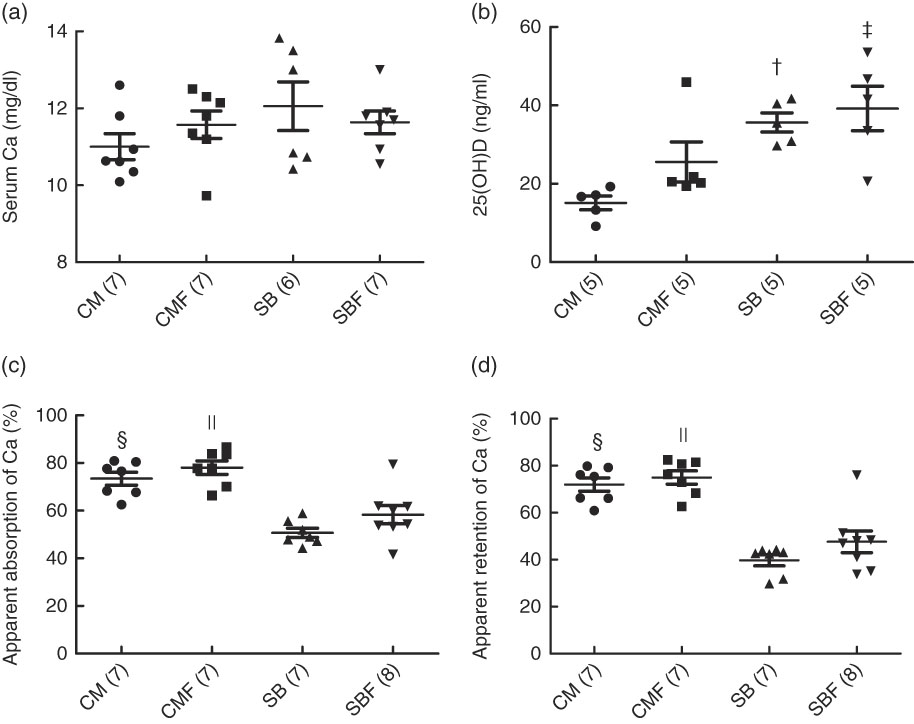
The mean serum concentration of 25(OH)D in the CM, CMF, SB and SBF groups were 15·12 (se 1·76), 25·56 (se 5·10), 35·64 (se 2·42) and 39·18 (se 5·68) ng/ml, respectively (P>0·05). In the SB group, the serum concentration of 25(OH)D was higher compared with the CM group (P=0·003). In addition, the serum concentration of 25(OH)D in the SBF group was higher compared with the CMF group (P=0·032) (Fig. 1(b)).
The mean apparent Ca absorption in the CM, CMF, SB and SBF groups were 73·44 (se 2·72), 78·04 (se 2·84), 50·71 (se 1·94) and 58·29 (se 3·81) %, respectively (P>0·05), and those of the apparent retention of Ca, the medians and 25th and 75th percentiles were 75·41 (66·10–79·24), 76·29 (68·25–81·49), 42·74 (31·79–43·98) and 47·51 (36·64–50·64) %, respectively (P>0·05). The apparent Ca absorption, evaluated for 72 h, which considered the difference between the total ingested and the total excreted in the faeces, was significantly greater in the CM group than in the SB group (P<0·001). In addition, the apparent absorption of Ca in the CMF group was higher in relation to that in the SBF group (P<0·001) (Fig. 1(c)). Regarding the apparent retention of Ca evaluated over 72 h, which considered the differences between the total ingested and total excreted in the faeces and urine, retention was significantly higher in the CM group than in the SB group (P<0·001). In addition, a significantly greater apparent retention of Ca was observed in the CMF group compared with the SBF group (P<0·001) (Fig. 1(d)).
Hb concentration, haematocrit, apparent iron absorption and hepatic iron content
The mean Hb concentrations in the CM, CMF, SB and SBF groups were 5·42 (se 0·17), 7·84 (se 0·58), 9·77 (se 0·67) and 11·83 (se 0·64) g/dl, respectively (P<0·05), and those of the Ht concentrations were 19·25 (se 1·11), 25·43 (se 1·48), 32·57 (se 1·19) and 37·83 (se 1·54) %, respectively (P<0·05). At the end of the experiment, the Hb concentrations of the CMF and SB groups were significantly higher compared with the CM group (P=0·025 and P<0·001, respectively). In addition, in the SBF group, the Hb concentration was higher compared with the SB and CMF groups (P=0·030 and P<0·001, respectively) (Fig. 2(a)). Likewise, the Ht concentrations in the CMF and SB groups were higher in relation to the CM group (P=0·010 and P<0·001, respectively). In addition, the Ht concentration was higher in the SBF group than in the SB and CMF groups (P=0·013 and P<0·001, respectively) (Fig. 2(b)).
Hb concentration (a), haematocrit (Ht) concentration (b), apparent absorption of iron (c) and hepatic iron content (d). CM, animals fed lactose-free cows’ milk; CMF, animals fed lactose-free cows’ milk supplemented with fructo-oligosaccharides; SB, animals fed with soya-based beverage; SBF, animals fed with soya-based beverage supplemented with fructo-oligosaccharides. Values are means with their standard errors. Two-way ANOVA test or Kruskal–Wallis test. The number in parentheses refers to the sample size. † P=0·025 v. CM. ‡ P<0·001 v. CM. § P=0·030 v. SB. || P<0·001 v. CMF. ¶ P=0·010 v. CM. **P=0·013 v. SB. To convert Hb in mg/dl to mg/l, multiply by 10.
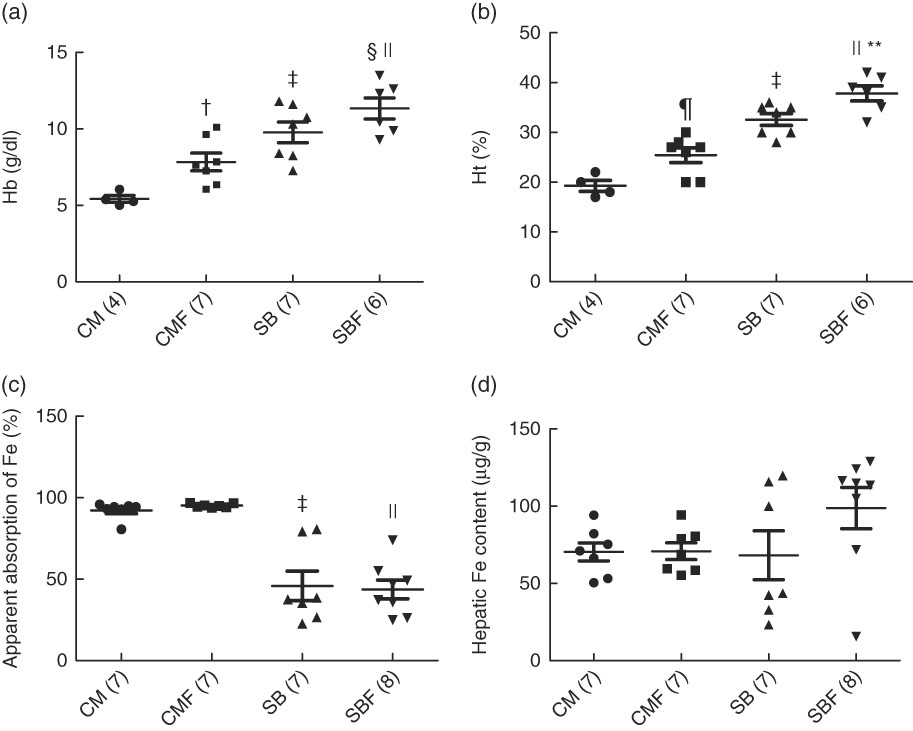
The medians and 25th and 75th percentiles apparent Fe absorption in the CM, CMF, SB and SBF groups were 94·27 (92·80–94·86), 94·92 (94·18–96·62), 37·61 (26·63–79·24) and 42·27 (28·62–53·57) %, respectively (P<0·05). The apparent Fe absorption in the CM group was significantly higher when compared with the SB group (P<0·001). Furthermore, in the CMF group, the apparent Fe absorption was higher in relation to the SBF group (P<0·001) (Fig. 2(c)).
The mean hepatic Fe content in the CM, CMF, SB and SBF groups were 70·39 (se 5·86), 70·85 (se 5·43), 68·23 (se 15·81) and 98·83 (se 13·39) µg/g, respectively (P>0·05). Regarding hepatic Fe content, no significant differences were found between the groups (Fig. 2(d)).
Protein expression of the divalent metal transporter 1 and ferroportin in the intestines
Regarding ferroportin protein expression in the duodenum, caecum and colon, no differences were found between the groups (Fig. 3(a) and (b)). The mean ferroportin protein expression in the duodenum were 100·00 (se 10·84), 79·51 (se 18·25), 92·67 (se 28·39) and 52·66 (se 8·28) arbitrary units, respectively (P>0·05), and those of the ferroportin protein expression in the caecum were 100·00 (se 18·63), 158·70 (se 27·73), 117·38 (se 16·79) and 93·33 (se 20·42) g, respectively (P>0·05). The mean ferroportin protein expression in the colon were 100·00 (se 11·68), 89·16 (se 17·55), 87·87 (se 22·64) and 118·61 (se 24·95) arbitrary units, respectively (P<0·05).
Protein expression levels of divalent metal transporter 1 (DMT1) (a) and ferroportin (b) in the duodenum, caecum and colon of rat pups from the CM (
![]() ), CMF (
), CMF (
![]() ), SB (
), SB (
![]() ) and SBF (
) and SBF (
![]() ) groups. CM, animals fed lactose-free cows’ milk; CMF, animals fed lactose-free cows’ milk supplemented with fructo-oligosaccharides; SB, animals fed with soya-based beverage; SBF, animals fed with soya-based beverage supplemented with fructo-oligosaccharides; AU, arbitrary units. Protein levels were determined by Western blot analysis and normalised to the levels of β-tubulin. Values are means (n 3–7) with their standard errors represented by vertical bars. † P=0·005 v. SB. ‡ P=0·001 v. CMF.
) groups. CM, animals fed lactose-free cows’ milk; CMF, animals fed lactose-free cows’ milk supplemented with fructo-oligosaccharides; SB, animals fed with soya-based beverage; SBF, animals fed with soya-based beverage supplemented with fructo-oligosaccharides; AU, arbitrary units. Protein levels were determined by Western blot analysis and normalised to the levels of β-tubulin. Values are means (n 3–7) with their standard errors represented by vertical bars. † P=0·005 v. SB. ‡ P=0·001 v. CMF.
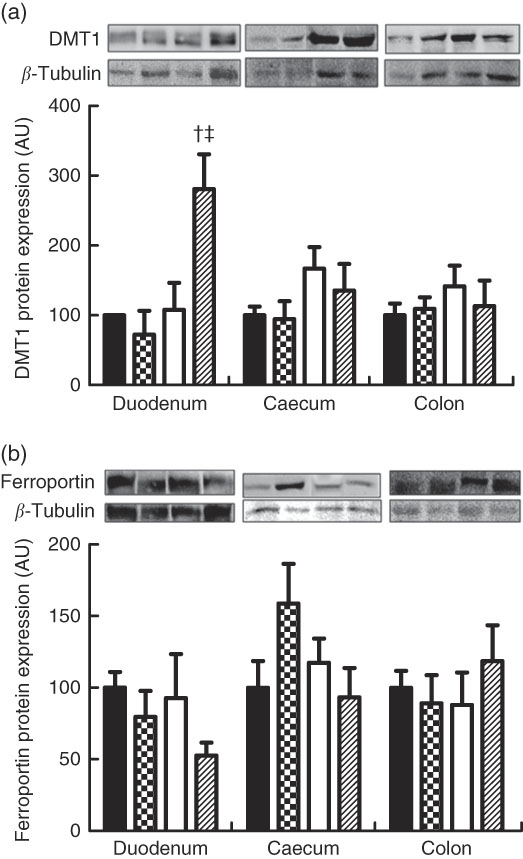
The mean DMT1 protein expression in the duodenum were 100·00 (se 0·00), 72·07 (se 34·28), 107·82 (se 38·69) and 280·92 (se 39·58) arbitrary units, respectively (P<0·05). DMT1 protein expression in the duodenum in the SBF group was higher in relation to the SB and CMF groups (P=0·005 and P=0·001, respectively). No differences were found between the groups when DMT1 protein expression was analysed in the caecum and colon (Fig. 3(b)). The mean DMT1 protein expression in the caecum were 100·00 (se 12·35), 94·60 (se 23·42), 166·84 (se 25·40) and 135·36 (se 31·13) arbitrary units, respectively (P>0·05). The mean DMT1 protein expression in the colon were 100·00 (se 16·86), 109·24 (se 15·10), 141·39 (se 24·23) and 113·21 (se 33·48) arbitrary units, respectively (P>0·05).
Discussion
The animal model used to conduct the present study was quite satisfactory and showed that the animals fed SB, with and without addition of FOS, presented inferior growth (weight gain) in relation to the animals in the control groups (CM and CMF). It was also observed that in the groups fed SB with and without FOS, there were higher concentrations of 25(OH)D and lower apparent absorption and retention of Ca. However, there were no increases in serum Ca, 25(OH)D or apparent absorption and retention of Ca among groups with the addition of FOS. In addition, higher concentrations of Hb and Ht and lower apparent Fe absorption were observed in the SB groups, with and without FOS, with the benefit of prebiotic on Hb and Ht concentrations in the CM and SB groups and DMT1 protein expression in the duodenum in the SB group.
Another point of equal importance is the fact that this is the first study that compares SB in relation to CM with and without the addition of FOS for a continuous period sufficient to promote significant changes in the nutritional state of the animal. This study used an experimental model previously developed in our laboratory that allowed us to evaluate the nutritional interactions in recently weaned rats exclusively fed on different types of liquid formulas( Reference Costa, Freitas and Amâncio 29 , Reference Farjalla 30 , Reference Silva, Speridião and Marciano 37 , Reference Silva, Speridião and Marciano 38 ). During the experiment, the animals did not receive solid feed, with their food intake limited to SB and CM, according to the study group.
Considering the resources available for the research, the total number of animals used was limited. In this sense, it was unnecessary to form a group with conventional feed (e.g. American Institute of Nutrition-93G (AIN-93G)) because the objective of the study was to analyse the interaction of foods (CM, SB and FOS) to simulate what would occur in humans. That is, the feeding strategy was not intended to meet the needs of the animals involved in the experiment( Reference Costa, Freitas and Amâncio 29 , Reference Farjalla 30 , Reference Silva, Speridião and Marciano 37 , Reference Silva, Speridião and Marciano 38 ).
In our study, animals fed FOS in the soya beverage (SBF) consumed less volume of fluid diet than the animals fed with soya beverage without FOS (SB), and consequently, there was less consumption of fluid diet and lower consumption of Ca and Fe; however, there was no impairment in growth (weight gain) between these groups. This finding is similar to the results of other studies. Freitas et al. ( Reference Freitas, Amancio and Novo 21 ) and Carvalho et al. ( Reference Carvalho, Brait and Vaz 23 ) did not find significant differences with the use of partially hydrolysed guar gum on growth and body weight of growing rats. Other soluble fibres such as oligofructose and inulin also did not affect the growth of the animals( Reference Tako, Glahn and Welch 13 , Reference Freitas, Amâncio and de Morais 17 , Reference Marciano, Santamarina and de Santana 22 ). Thus, it can be speculated that the presence of FOS in the SB provided larger satiety effect in these animals and consequently they had lower consumption dietary.
The results also showed that weight gain was lower in the groups fed with soya beverage (SB and SBF), although dietary intake was similar to that of the control groups (CM and CMF). In a study performed previously in our department( Reference Silva, Speridião and Marciano 37 ), weight gain was lower in the groups fed with soya products (soya extract-based beverage and soya-based infant formula) than those fed CM protein-based infant formula. In the present study, this result could also be simply attributed to the nutritional composition of the soya-based beverage having a lower protein content when compared with that of CM. In addition, it is important to remember that soyabean contains antinutritional factors that may interfere with the availability of nutrients, contributing to this finding( Reference Liener 39 ). Another justification may be related to the fact of the lower food efficiency in terms of weight gain per diet consumption in the groups fed with soya beverage.
It is worth noting that despite the differences in weight gain between the four groups, in general, the animals in this experiment presented growth similar to that presented by rats of the same age and fed with conventional feed( Reference Lopes 40 ). This aspect is very important because it reinforces the innocuous nature of our experimental model owing to the non-detriment in the growth of animals fed with a liquid diet.
After euthanasia, the fresh weights of the liver, duodenum and colon did not differ among the animals of the four groups, but a significant increase was observed in the weight of the caecum, along with a reduction in the pH of the caecal contents of the animals of the groups that received CM with FOS and soya beverage with FOS (CMF and SBF) in relation to the animals of the groups without prebiotic (CM and SB), indicating the effects of FOS in addition to the liquid diets, which would facilitate the solubilisation and absorption of Ca and Fe. These findings have also been verified in other studies( Reference Freitas, Amancio and Novo 21 – Reference Carvalho, Brait and Vaz 23 ).
There are only four articles in the literature that have evaluated the absorption of Ca using SB. However, these studies did not evaluate the effects of prebiotics added to SB when compared with CM.
According to an in vitro study( Reference Bosscher, Dyck and Robberecht 24 ) in which the bioavailability of Ca and zinc from CM and soya-based foods was evaluated, both with similar Ca contents, it was found that the bioavailability of Ca is significantly higher in soya-based beverages compared with CM.
Heaney et al. ( Reference Heaney, Dowell and Rafferty 25 ) compared the Ca bioavailability of soya beverage (BS) enriched with tricalcium phosphate with that of CM and demonstrated that the Ca bioavailability of BS corresponded to 75 % of that of CM. The authors suggest that to achieve equivalence of bioavailability between the two beverages, it is necessary that BS be enriched with 500 mg of Ca/portion and not only with the current 300 mg/portion reported by most manufacturers. This study was performed based on labelled isotope analysis in 16 men aged 22–51 years old.
Zhao et al. ( Reference Zhao, Martin and Weaver 26 ) compared Ca absorption from SB enriched with tricalcium phosphate and calcium carbonate in relation to CM in 20 healthy young women with a mean of 23 years of age and verified that the Ca absorption with the SB enriched with Ca carbonate was similar to that of CM, and both presented better results when compared with SB enriched with tricalcium phosphate.
Tang et al. ( Reference Tang, Walker and Wilcox 27 ) compared the absorption of Ca of SB enriched with Ca phosphate compared with CM in 12 osteopaenic postmenopausal women and showed that the absorption of Ca from the enriched soya milk was comparable with that of CM.
Raw soyabean contains antinutritional factors capable of provoking negative effects on human health. Among them, phytates are prominent, which can interact with minerals such as Ca, reducing their absorption( 2 , Reference Osman, Reid and Weber 7 , Reference Bajpai, Aparna Sharma and Gupta 8 ). Phytic acid has long been considered an antinutritional factor because it can form complexes with proteins and metal ions, preventing the ideal absorption of minerals from the intestine( Reference Sandberg and Andlid 9 ). In this sense, high levels of phytate in the SB decrease the bioavailability of many minerals, including Ca and Fe( Reference Lopez, Leenhardt and Coudray 10 ).
Although differences in the apparent absorption and retention of Ca are observed between the groups, in which the values were greater in the CM group compared with those of the SB group and the CMF group, they were higher in relation to the SBF group; however, serum Ca did not present this same effect. It is known that serum Ca reflects instantaneous absorption. However, the observed increase tends to be small because Ca homeostasis prevents extensive modifications. Therefore, this method of detection presents low sensitivity( Reference Heaney 41 ). In addition, it should be noted that the time of study was insufficient, thus impacting serum Ca.
Regarding 25(OH)D, it can be assumed that the higher concentrations found in the groups fed with soya beverage (SB and SBF) may have been influenced by a defence mechanism to increase the apparent Ca absorption in these animals because the apparent absorption of Ca in these groups was smaller. It is important to note that this effect was not verified in another study, which is a hypothesis based on the present study and guided by the mechanisms related to the intestinal absorption of Ca, considering that the main action of calcitriol that contributes to elevate the calcemia is the stimulation of the intestinal absorption of Ca. In addition, it can be speculated that the presence of vitamin D in SB composition could be another contributing factor for the higher concentration of 25(OH)D in animals fed SB with and without FOS, whereas there was no vitamin D in the CM diet.
In this experiment, the animals fed soya beverage without FOS (SB) presented lower apparent absorption and retention of Ca than the animals fed with cows’ milk without FOS (CM). Apparently, our results are in agreement with Zhao et al. and Tang et al., with no difference in serum Ca concentration between treatments.
Regarding Fe, only one study was found in the literature in which Fe absorption with SB was evaluated in comparison to CM. In this in vitro study( Reference Promchan and Shiowatana 28 ), the bioavailability of Fe from different types of milk (CM, cereal milk and soya-based beverage) with different contents of Ca and vitamins was evaluated and showed that the bioavailability of Fe is significantly higher in soya-based beverage compared with CM. In the present study, animals fed soya beverage without FOS (SB) had lower apparent Fe absorption and higher Hb and Ht concentrations than the animals fed cows’ milk without FOS (CM).
The Hb and Ht concentrations after the 7 d of prebiotic ingestion presented higher Hb recovery in the groups that received cows’ milk and soya beverage (CMF and SBF). These results are in agreement with the literature, showing that prebiotics can be effective in the regeneration of Hb mass( Reference Freitas, Amâncio and de Morais 17 , Reference Ohta, Ohtsuki and Baba 42 , Reference dos Santos, Tsuboi and Araújo 43 ). The evaluation of Fe absorption by apparent absorption and hepatic Fe content did not confirm the results obtained for Hb and Ht concentrations.
Malabsorption of Fe leads to anaemia, as indicated by the reductions in Hb and Ht concentrations. In this sense, as observed previously( Reference Costa, Freitas and Amâncio 29 ), the decreased Fe absorption was impacted by the use of CM. CM has low bioavailability and Fe density and excess protein and minerals, particularly Ca, and is associated with intestinal microhaemorrhages, particularly in human infants, interfering with the absorption of Fe from other foods. In addition, it has low vitamin C content, considered to be an incentive factor for Fe absorption, and a high phosphorus content, a factor that reduces Fe absorption( Reference Oliveira and Osório 44 ). In the present study, the occult blood tests were negative in all groups of all animals. Thus, these factors could contribute to the lower concentrations of Hb and Ht in the control (CM and CMF) groups.
There are no excretory mechanisms for Fe: the absorption of Fe by the small intestine is regulated according to the needs of the body. Thus, in anaemia, an adaptive mechanism occurs, in which the Fe absorption regulating gene expression increases in both the duodenum and the caecum and colon( Reference Takeuchi, Bjarnason and Laftah 45 , Reference Johnston, Johnson and Marks 46 ) to increase Fe absorption. Genes involved in Fe metabolism, such as DMT1 and ferroportin, are also expressed in the large intestine but at significantly lower levels than in the duodenum( Reference Wang and Pantopoulos 47 , 48 ). DMT1 transports ferrous Fe to enterocytes and macrophages. Fe can be stored as ferritin or transferred through the basolateral membrane into the plasma by ferroportin( Reference Frazer, Wilkins and Becker 49 ). Ferroportin is found in the basolateral membrane where Fe efflux permeates( Reference Ganz 50 ). The importance and function of these genes in the large intestine are still not clearly understood( Reference Takeuchi, Bjarnason and Laftah 45 ). Studies show increased protein expression of DMT1 and ferroportin in anaemic animals that received prebiotic( Reference Tako, Glahn and Welch 13 , Reference Marciano, Santamarina and de Santana 22 , Reference Carvalho, Brait and Vaz 23 , Reference Yasuda, Dawson and Wasmuth 51 ).
This study showed that the control animals (CM and CMF) presented higher apparent Fe absorption in relation to the animals that received SB with and without FOS (SB and SBF). It can be speculated that this finding is dependent on the lower concentrations of Hb in the control (CM and CMF) groups because in Fe-deficiency anaemia, mechanisms are activated to increase Fe absorption( Reference Takeuchi, Bjarnason and Laftah 45 , Reference Johnston, Johnson and Marks 46 ).
The present study also showed that the FOS added in the SBF significantly increased DMT1 protein expression in the duodenum, with an increase of 173 % when compared with the group that received SB and a 208 % increase when compared with the group that received CMF, in line with other studies( Reference Tako, Glahn and Welch 13 , Reference Yasuda, Dawson and Wasmuth 51 ) that observed increased gene expression of DMT1 in the duodenum with ingestion of prebiotics in anaemic pigs. This result shows that there was greater uptake of Fe into the tissue observed in the SBF. This effect could have contributed to some results, considering that FOS supplementation in the group receiving soya beverage (SBF) resulted in a significant increase in the Hb and Ht concentrations in relation to the group fed with soya beverage only (SB). In addition, animals receiving FOS in soya beverage (SBF) showed higher concentrations of Hb and Ht than animals receiving CMF.
The increase in duodenal expression of DMT1 in the SBF group was surprisingly associated with lower Fe absorption. Thus, other factors such as the expression of Dcyt-b, hephaestin, haeme Fe-bearing protein in addition to the transferrin receptor, hepcidin and ferritin could be altered and explain the lower Fe absorption in this group. Unfortunately, in this project it was not possible to determine the protein expression of all these factors, and hence should be explored in future studies. The study also showed that the CM group induced anaemia, presented greater apparent Fe absorption and the addition of FOS in this group showed a significant increase in Hb and Ht (CMF) concentration. No alterations of DMT1 were observed in the caecum and colon and ferroportin in the intestinal segments in some experimental group. Thus, it may be speculated that the protein expression of the Fe absorption factors mentioned above could be increased.
Prebiotics differ in their degree of polymerisation, and structural differences in prebiotics can affect Ca and Fe homeostasis and generate different physiological responses. In this study, the FOS used had a degree of polymerisation between 2 and 8, being degraded more rapidly, with effects in proximal regions of the large intestine( Reference Roberfroid 52 ). Thus, the magnitude of the effect on trace element absorption is affected by the type and dose of fructan( Reference Scholz-Ahrens and Schrezenmeir 53 ). Thus, it can be speculated that because of the FOS concentrations used, positive effects of FOS on Ca bioavailability, apparent Fe absorption and hepatic Fe content were not observed in the present study.
It can be speculated that the greater stimulus to Ca absorption could inhibit Fe absorption because studies clearly show an antagonistic relationship between Ca and dietary Fe( Reference Hallberg, Brune and Erlandsson 54 ).
In general, studies with different types, combinations and concentrations of prebiotics did not observe any negative effect on the absorption of Ca and Fe. In contrast to previous evidence, FOS increased levels of Hb and Ht and DMT1 protein expression in the duodenum or, at least, did not limit the absorption of Ca and Fe.
Finally, it should be noted that there are no studies similar to the present study that prevents the direct comparison of the results. Another limitation relates to the difficulties of extrapolating the results obtained to humans. However, the importance of experimental models with animals cannot be disregarded, particularly in situations in which experiments involving humans cannot be designed to evaluate the repercussions of a food provided over periods of several days instead of in a single meal test.
Acknowledgements
The authors thank the staff of the Physiology of Nutrition Discipline wing of the Department of Physiology, Federal University of São Paulo.
The present study was supported by the National Council of Technological and Scientific Development – CNPq, Brazil (2015/CEUA no. 3498100315). The funder had no role in the design and analysis of the study or in the writing of this article.
The authorship of this manuscript received the following contributions: M. d. L. C. S., P. d. G. L. S., L. M. O. and M. B. d. M. contributed to project design, data analysis, statistical analysis, final review, manuscript presentation and critical review of the manuscript for important intellectual content; M. d. L. C. S. conducted animal experiments; M. d. L. C. S. and L. M. O. performed laboratory tests.
The authors declare that there are no conflicts of interest.


