

World War II (WWII) remains the deadliest conflict in history. In Europe alone, some 39 million people died, and many more were wounded. Millions became prisoners of war (POWs). Nazi Germany captured 5.7 million Soviet soldiers, more than half of whom died in captivity. At the same time, about 11 million German soldiers, or more than one in two, became POWs (Ratza Reference Ratza and Mascke1974), and 5.2 million were injured in the war (Müller Reference Müller2016). Many civilians were killed or forcibly uprooted. After the war, at least 12 million Germans were displaced from Eastern Europe in one of the largest population transfers in history. What are the long-term consequences of such traumatic events for the labor market careers of the survivors?
Using individual-level data from West Germany, we study three of the most common consequences of war: battlefield injuries, imprisonment, and displacement. We show that a life-cycle perspective is crucial, as the labor market effects of individual war experiences become visible only at certain life stages and often long after the war has ended. Moreover, the same shock can have very different effects depending on the survivors’ age at exposure. Standard life-cycle theory can rationalize these patterns, as we show in a Ben-Porath model with endogenous retirement decisions (Hazan Reference Hazan2009). Consequently, policies aimed at mitigating the economic effects of war shocks should be designed with a life-cycle framework in mind. Such policies were central after WWII when many belligerent countries, including Germany and the United States, spent between 10 and 35 percent of total social spending on war victims (Obinger and Schmitt Reference Obinger and Schmitt2018).
Our study relies mainly on nationally representative life course data for the birth cohort 1919–21 from the German Life History Study (GHS), which offers two major merits. First, the GHS captures complete educational, employment, and family histories. This feature allows us to construct life-cycle profiles of respondents. Second, the survey asked individuals directly about their wartime experiences, such as their time as a POW or their medical history during the war. Thus, unlike most other studies, we focus on individual war experiences rather than regional exposure to combat or bombing.
We use this data to compare the life-cycle profiles of male survivors born 1919–21 who were wounded (30 percent of the respondents in our sample) or imprisoned for more than six months (47 percent) to other WWII veterans. We also compare the life-cycle profiles of those who were displaced (21 percent) with those who were not. In support of our empirical strategy, we show that neither family nor own characteristics predict individual exposure, in line with historical studies showing that young soldiers of all backgrounds suffered similarly from battlefield injuries or captivity.
We find that the effect of individual war experiences often becomes apparent only at certain stages of life. For example, battlefield injuries reduced the lifetime employment of veterans by about one year but had no effect on employment in middle age; instead, the effect is entirely explained by early retirement, as war injuries reduced the employment rate at age 60 by 14.7 percentage points (pp). In contrast, former POWs postponed retirement, and their employment rate at age 60 was 8 pp higher than that of non-incarcerated soldiers. The employment penalty for displaced men, on the other hand, is greatest in their late 20s, shortly after displacement, and disappears by age 35. Like former POWs, displaced men experience lower occupational success throughout their careers.
We complement the GHS with microdata from the 1970 census to show that the effect of displacement depends critically on the age of those affected. The loss of human capital was greatest for those born around 1930, who suffered from the turbulence of displacement during the transition from school to vocational training. In contrast, children displaced before entering school acquired more schooling than those who were not displaced. Labor market effects also varied widely by age and gender. For older workers, displacement often led to an immediate exit from the labor force. The total employment loss was greatest for those displaced around age 50, who still had a longer career ahead of them. The loss was particularly severe for women: in some age groups, less than half of the women employed before the war returned to work after displacement.
Finally, we show that these findings are broadly in line with a Ben-Porath model with endogenous retirement decisions (Hazan Reference Hazan2009). By increasing the disutility of work, war injuries accelerate entries into retirement but are less likely to affect employment during the early or mid-career stages. Imprisonment implies a reduction in an individual’s productive work span, reducing the incentives to invest in education (as the benefits accrue over a shorter period) and potentially delaying retirement (as former POWs seek to make up for lost lifetime earnings). Displacement triggers both substitution and income effects, the relative magnitude of which depends on age at the time of displacement.
Given that they explain our findings well, life-cycle models might also help to understand labor market trajectories after other wars. Of course, the exact magnitudes of these effects also depend on the design of the pension system, where in Germany, disability benefits were an important pathway to retirement, and on the availability of compensation for war victims, which in Germany was contingent on severe health impairments caused by the war.
Related Literature
Recent studies on the long-term individual economic impact of WWII show that exposure to warfare negatively affected education, health, and labor market outcomes (Ichino and Winter-Ebmer Reference Ichino and Winter-Ebmer2004; Akbulut-Yuksel Reference Akbulut-Yuksel2014; Kesternich et al. Reference Kesternich, Siflinger, Smith and Winter2014; Akbulut-Yuksel, Tekin, and Turan Reference Akbulut-Yuksel, Tekin and Turan2022). Footnote 1 For identification, the extant literature often exploits between-country variation in combat exposure or regional within-country variation in destruction. Hunger early in life is one key channel through which WWII had adverse long-term effects on survivors’ well-being (e.g., Jürges Reference Jürges2013; Kesternich et al. Reference Kesternich, Siflinger, Smith and Winter2015; Mink et al. Reference Mink, Boutron-Ruault, Charles, Allais and Fagherazzi2020). Moreover, evidence from Germany (Bauer, Braun, and Kvasnicka Reference Bauer, Braun and Kvasnicka2013) and Finland (Sarvimäki, Uusitalo, and Jäntti Reference Sarvimäki, Uusitalo and Jäntti2022) shows that displacement resulted in long-term income loss, except for those who originated from agricultural areas. However, the loss of land or property might encourage investment in education, and the descendants of Polish WWII migrants are better educated today (Becker et al. Reference Becker, Mergele and Woessmann2020). WWII military service increased the educational attainment of veterans (Bound and Turner Reference Bound and Turner2002; Cousley, Siminski, and Ville Reference Cousley, Siminski and Ville2017) but had little effect on earnings (Angrist and Krueger Reference Angrist and Krueger1994) and occupational attainment later in life (Maas and Settersten Reference Maas and Settersten1999).
The core innovation of our study is the life-cycle perspective. We show that the labor market consequences of individual war shocks often become visible only at certain stages of life, making a life-cycle perspective essential. This result is consistent with previous work on the impact of military service, which emphasizes the importance of a long-term perspective (Bedard and Deschênes Reference Bedard and Deschênes2006; Angrist, Chen, and Song Reference Angrist, Chen and Song2011). Footnote 2 A second innovation of our study is that we examine the response to individual shocks, complementing previous work on the effects of war on entire cohorts or regions. Among the shocks are war captivity and injury, two widespread but hardly studied war experiences. To our knowledge, the only evidence on the economic impact of these wartime shocks comes from the American Civil War of 1861–65 (Lee Reference Lee2005; Costa Reference Costa2012; Costa, Yetter, and DeSomer Reference Costa, Yetter and DeSomer2020), and this evidence confirms the importance of these shocks for socioeconomic outcomes later in life. Footnote 3 In addition, we highlight that the consequences of displacement for education and labor market careers interact critically with the age at displacement, adding to a growing literature documenting heterogeneity in the impact of displacement (Bauer, Braun, and Kvasnicka Reference Bauer, Braun and Kvasnicka2013; Bauer, Giesecke, and Janisch Reference Bauer, Giesecke and Janisch2019; Sarvimäki, Uusitalo, and Jäntti Reference Sarvimäki, Uusitalo and Jäntti2022; see Becker and Ferrara Reference Becker and Ferrara2019 and Becker Reference Becker2022 for recent surveys of forced displacement).
Our study also relates to the literature on human capital and labor supply decisions (Ben-Porath Reference Ben-Porath1967; Heckman Reference Heckman1976). Interest has focused on whether standard models can explain important empirical regularities, such as the shape of age-experience profiles in earnings (Mincer Reference Mincer1997), or long-run trends in schooling and labor supply (Hazan Reference Hazan2009; Cervellati and Sunde Reference Cervellati and Sunde2013). In contrast, there exists less evidence on whether such models can explain the response to exogenous shocks. A notable exception is the literature on the effect of diseases on human capital investments and development (Bleakley Reference Bleakley2010; Fortson Reference Fortson2011; Manuelli and Yurdagul Reference Manuelli and Yurdagul2021). In comparison, rather than shifts in life expectancy across time and place, we study the response to realized shocks on the individual level.
DATA AND BACKGROUND
German Life History Study
Our main data source is the GHS, a survey of eight West German birth cohorts born 1919–1971 (Mayer Reference Mayer and Menard2007). We draw on retrospective life-cycle information Footnote 4 from the first two waves (Mayer 1995, 2018a, 2018b). Both waves constructed nationally representative samples of German citizens living in West Germany at the time of the survey (foreigners were excluded). The first wave (GHS-1, conducted in 1981–83) surveyed respondents born in 1929–31, 1939–41, and 1949–51. We instead focus on the second wave (GHS-2, conducted in 1985–88), which surveyed individuals born in 1919–21, who were 18–20 years old when the war started. We observe 1,412 respondents in this wave, 559 of whom are men (the gender imbalance is a legacy of WWII). Although modest, this main sample is sufficiently large to capture the effects of the life-changing shocks we are studying. Moreover, parts of our analysis can also be implemented in the much larger 1970 census, as discussed later.
Importantly for our purpose, the GHS-2 focused on events related to WWII. It recorded occupational absences and gaps in employment due to military service, captivity, and displacement. Respondents were also asked about illness, accidents, or ailments. We classify bullet and shrapnel wounds, frostbite, amputations, and “general war injuries” sustained between 1939–45 as war-related injuries.
The GHS also contains rich demographic and labor market information. Respondents reported their complete education, employment, and family history. For each life domain, respondents were asked about sequences of episodes, including start and end dates and additional information about each spell. For example, in the employment domain, respondents provided the start and end dates of each employment spell in chronological order, as well as information on job title, industry, and hours worked. Once the data were collected for each domain, the information was checked for consistency across life domains.
To examine occupational success, we use the Standard International Occupational Scale (Treiman Reference Treiman1977), in which the values for occupational prestige range from 18 (unskilled workers) to 78 (doctors, professors) and are coded as missing for periods of nonemployment. The GHS recorded time spent in school, vocational training, and further education, and we measure educational attainment by total years of education (see Online Appendix A.1 for details). We also observe education and employment outcomes for the respondents’ parents. In addition, the GHS-2 recorded pension income, distinguishing between different sources, including pensions from own work and war victims’ pensions (we discuss war compensations later). When analyzing pension incomes, we restrict attention to GHS-2 respondents surveyed in 1987/88 and thus at age 66 or older.Footnote 5
The GHS recorded the complete residential history of respondents, which we use to define displacement status. As in official population statistics, we define displaced persons as Germans who lived in the eastern territories of the German Reich, Czechoslovakia, or Eastern Europe on 1 September 1939.Footnote 6 We classify all other individuals as non-displaced, except for Germans living in the future Soviet occupation zone in 1939, whom we exclude from this part of the analysis as they were positively selected in education (Becker, Mergele, and Woessmann Reference Becker, Mergele and Woessmann2020). Overall, 7.9 million displaced persons (so-called expellees) lived in West Germany in 1950 (Statistisches Bundesamt 1955). Most arrived in 1945/46, primarily from the eastern territories of the German Reich, which Germany ceded in 1919 and 1945 (see Online Appendix Figure F5 for an overview of Germany’s territorial losses).
1970 Census
Two limitations of the GHS are its small sample size and the focus on specific birth cohorts, which limits its usefulness in examining how individual war experiences vary across cohorts. For this type of analysis, we, therefore, use a second data set: the West German population and occupation census of 1970. The data comprise a 10 percent random sample of the population, almost 6.2 million individuals (FDZ 2008). The census contains information on an individual’s residence on 1 September 1939 (or the father’s residence for individuals born after that date). As in the GHS, we drop migrants from the Soviet occupation zone and define displaced persons as Germans who lived in Germany’s former eastern territories, Czechoslovakia, or Eastern Europe in 1939. Unfortunately, we cannot identify war wounded or POWs in the census.
The census provides information only on socioeconomic attainment in 1970. Two outcome variables are nevertheless of interest for our analysis: educational attainment and the year of exit from employment. We measure years of education by adding the years spent in vocational training and university to the time required to attain the highest school degree. The census also asked respondents who were not employed in 1970 when they left their last job. For older individuals over the statutory retirement age of 65, we can be reasonably confident that the year indicates the end of their labor market careers.
Exposure to Wartime Shocks
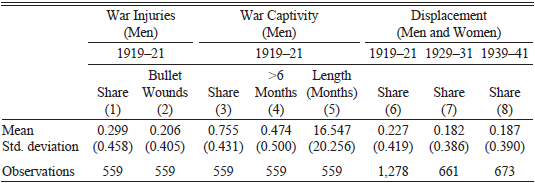
The shocks we consider—war injuries, captivity, and displacement—were common (see Table 1). In the GHS sample of men born in 1919–21, 29.9 percent suffered from war injuries, most commonly from bullet wounds. Our empirical analysis compares injured and non-injured soldiers over their life cycles. Among men born in 1919–21, three-fourths were POWs, but the length of imprisonment varied considerably, with a mean of 16.5 months and a standard deviation of 20.3 months. Our analysis compares the life-cycle profiles of soldiers who were POWs for more than six months to those who were not imprisoned (our results remain similar when including POWs imprisoned for fewer than six months). The treated make up 47.4 percent of respondents. Finally, more than one in five individuals in our GHS sample were displaced (the share is similar in the 1970 census). We compare them to their non-displaced peers (after excluding GDR refugees). We discuss potential concerns related to selection and multiple treatments in the next section.
EXPOSURE TO INDIVIDUAL WAR SHOCKS

Table 1 Long description
The table presents data on war injuries, war captivity, and displacement for men born between 1919 and 1921. It includes three main categories: War Injuries, War Captivity, and Displacement. The War Injuries section shows the share of men with bullet wounds and other wounds, with a mean of 0.299 for bullet wounds and 0.206 for other wounds. The War Captivity section indicates that 0.755 of men were prisoners of war (POWs) for more than six months, with an average imprisonment length of 16.547 months. The Displacement section shows the share of displaced individuals for the years 1919-21, 1929-31, and 1939-41, with respective shares of 0.227, 0.182, and 0.187. The table also includes standard deviations for each category.
Notes: Statistics for battlefield injuries and war captivity are based on men born 1919–21. Statistics for displacement are based on men and women, excluding GDR refugees.
Sources: German Life History Study (Mayer 1995, 2018a, 2018b).
Compensation Programs
Not least because of the large number of people affected, the fate of the war-damaged and the displaced was one of the most pressing social problems in the postwar period. The importance of this problem is reflected in the fact that a newly created ministry, the Federal Ministry for Displaced Persons, Refugees and War-Affected Persons, was charged with solving it. Policymakers developed two critical programs (Wiegand Reference Wiegand1995) to compensate war victims and facilitate their integration into the labor market: the war victims’ provision (Kriegsopferversorgung) and the equalization of burden (Lastenausgleich).
The financially most significant part of the war victims’ provision was the war victims’ pension (Kriegsopferrente). The pension was paid to persons who suffered serious health damage as a result of military or military-like service in connection with the war (e.g., damage due to direct warfare, captivity, or internment abroad). The war victims’ provision also paid for measures suitable for improving the earning capacity of war-disabled persons, such as advanced training and vocational (re)training, and for curative treatments to restore their health. Overall, the war victims’ compensation consumed a significant share of the government budget, especially in the immediate postwar period when it accounted for up to 16 percent of total social expenditure in Germany (see Online Appendix C for details).
The war victims’ pension had initially two main components. First, a basic pension (Grundrente) was paid to all war-disabled persons whose civilian earning capacity was reduced by at least 25 percent. Second, an additional equalization pension (Ausgleichsrente) was paid to severely disabled persons whose earning capacity was reduced by 50 percent, if they were no longer able to work (or only to a limited extent). Unlike basic assistance, the equalization pension was means-tested. The exact amount of the basic and equalization pensions depended on the severity of war-related health damage and was regularly adjusted. Appendix C discusses the evolution of pension levels in detail.
In 1956, about 1.25 million war-damaged individuals received a basic pension, and another 0.25 million received both a basic and an equalization pension (Presse- und Informationsamt der Bundesregierung 1957). Footnote 7 Benefits were gradually expanded, and from 1960, severely disabled persons received additional damage compensation (Schadensausgleich) if their income was below what they would have earned without the war damage. Importantly, the war victims’ pension was not tied to any age thresholds.
The second program, equalization of burdens, partially compensated for the loss of wartime property, thereby distributing the burdens of war more evenly throughout society. Those whose property had been spared by the war were to compensate those who had suffered war damage. Displaced persons could also apply for grants to start businesses and for public assistance in finding housing. However, the equalization of burdens had only limited success in restoring the occupational status of the displaced and the prewar distribution of wealth (Falck, Heblich, and Link Reference Falck, Heblich and Link2012; Wiegand Reference Wiegand1995).
Cohort Effects
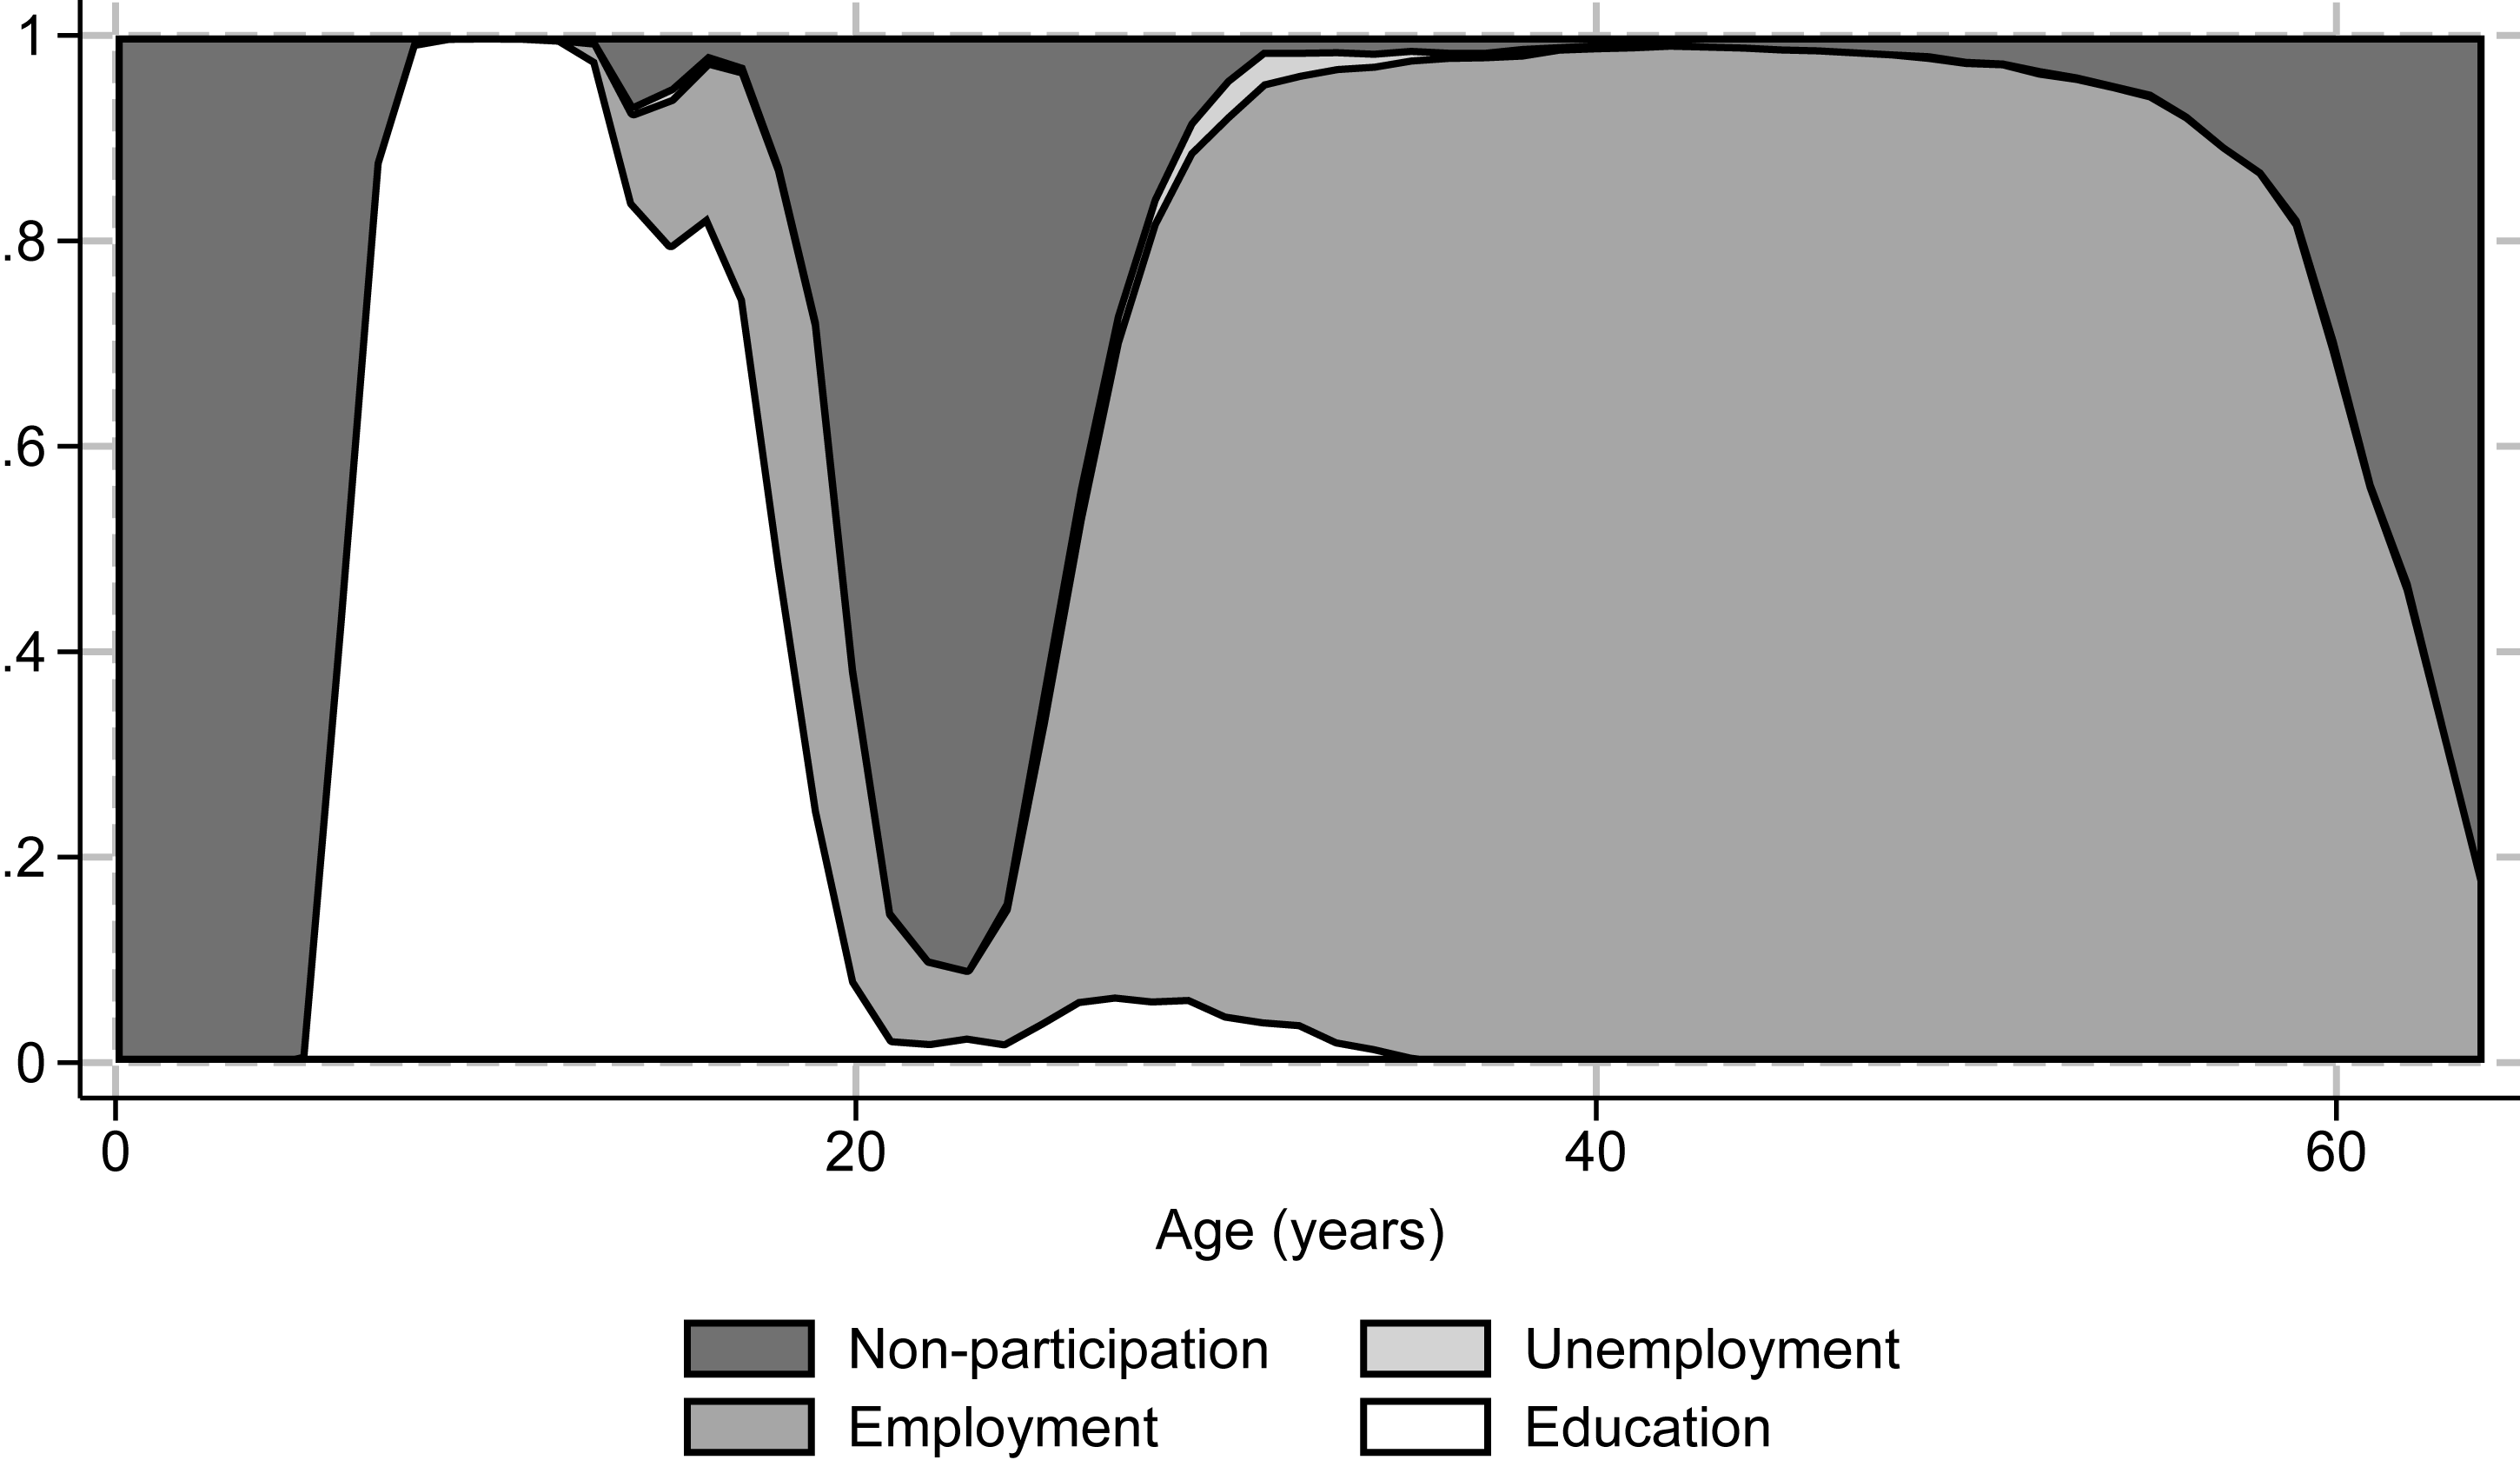
Figure 1 plots the life-cycle profile for males born in 1919–21, distinguishing four states: non-participation, unemployment, employment, and education. The cohort was 18–20 years old when the war started, and all males were conscripted. Footnote 8 War service thus hit the cohort when, without compulsory military service, as was the case during the Weimar Republic, it would have entered the labor market, severely interrupting the transition from education to work (Brückner and Mayer Reference Brückner and Mayer1987). The figure shows that the cohort’s labor force participation rate plummeted abruptly around age 20 and gradually recovered in the late 20s. War captivity reduced the cohort’s labor force participation long after the war ended.
LIFE-CYCLE PROFILE FOR MALE COHORT BORN IN 1919–21
Notes: The figure shows the share of individuals in four mutually exclusive states: non-participation, unemployment, employment, and education (including school, vocational training, and further education).
Sources: German Life History Study (Mayer 1995, 2018a).

Figure 1 Long description
The line graph illustrates the share of individuals in four mutually exclusive states: non-participation, unemployment, employment, and education, over a range of ages from 0 to 60 years. The x-axis represents age in years, while the y-axis represents the share of individuals, ranging from 0 to 1. The graph shows that non-participation is high in early years, decreases significantly around age 20, and then increases again after age 60. Employment peaks between ages 20 and 60, with a notable dip around age 20. Unemployment is relatively low throughout but shows a slight increase around age 20. Education is prominent in early years, decreases around age 20, and remains low thereafter. All values are approximated.
Online Appendix Figure D3 compares the life-cycle profile of the 1919–21 cohort with later-born cohorts covered by the GHS-1, illustrating that their transition from education to work was dramatically different.Footnote 9 Men born in 1919–21 spent, on average, just 156 months in the labor market by age 37, more than 60 months less than males born in 1929–31 or 1939–41. The latter cohorts were either not (1929–31) or only partially (1939–41) conscripted after West Germany rearmed in 1955.Footnote 10 In contrast, women born in 1919–21 had higher participation rates than later-born cohorts (see Online Appendix D). Our analysis abstracts from cohort effects and instead identifies within-cohort differences based on war experience.
Figure 1 also shows that most men born in 1919–21 left employment well before the statutory retirement age of 65. Several early retirement paths existed at the time (see the Appendix for details). Individuals with more than 35 years of contributions could retire at 63, while those who were long-term unemployed or severely disabled could retire at 60. The pension system also provided disability benefits for workers of any age, subject to medical indication and a minimum insurance period of at least five years.
Macroeconomic Conditions
Macroeconomic conditions were favorable for the integration of former soldiers into the labor market. West Germany recovered swiftly from WWII (Eichengreen and Ritschl Reference Eichengreen and Ritschl2009), and real GDP per capita nearly tripled between 1950 and 1970. The mass inflow of displaced persons initially increased unemployment (Braun and Omar Mahmoud Reference Braun and Omar Mahmoud2014) but provided a valuable pool of labor for the booming economy in the late 1950s and 1960s. Unemployment fell steadily, from 10.4 percent in 1950 to 1.3 percent in 1960, and remained very low until the mid-1970s. These favorable conditions likely explain why, despite their late entry into the labor force, men in the 1919–21 cohort were rarely unemployed after age 35. As discussed, policy measures also improved the earning capacity of the war-disabled by covering the costs of vocational training and curative treatments.
LIFE-CYCLE EFFECTS OF INDIVIDUAL WARTIME SHOCKS
This section considers the impact of battlefield injuries, war captivity, and displacement on labor market outcomes of men born 1919–21.Footnote 11 For each shock, we present three sets of results.
First, we report cross-sectional summary measures of labor market success, based on regressions such as

where y i is an outcome of interest for individual i, shock i is one of the three shocks listed in Table 1, and x i is a set of control variables as defined later. In robustness tests, we also include all three shocks jointly to account for the fact that individuals might be exposed to more than one shock. This has little effect on our estimates, as the shocks are hardly correlated with each other.
We restrict the sample to WWII veterans when examining war injuries and imprisonment. In these cases, our control group consists of other soldiers who also served in WWII, but who did not suffer a war injury or become a POW. Thus, we are not examining the effect of WWII service per se, but the effect of specific war experiences conditional on military service. This focus is of particular interest to countries such as Austria and Germany, where public policy has targeted war-disabled veterans rather than veterans in general. As for the effect of war service in general, Maas and Settersten (Reference Maas and Settersten1999) show for German men born between 1887 and 1922 that the duration of military service had a negative effect on men’s occupational careers in the short run, but this effect quickly vanished as the German economy recovered.
Second, we show full life-cycle plots for employment and occupational prestige, based on pooled regressions that interact the shock with age:

where y it is the employment status or occupational prestige of individual i at age t (age in years).
Third, we ask whether individuals’ responses are consistent with the predictions from standard life-cycle theory of human capital and labor supply decisions. For readability, most of this theoretical discussion is relegated to the Online Appendix, with only the main results summarized in the main text.
Identification
A concern for identification is that war shocks may correlate with individual characteristics affecting labor market supply or prospects after the war has ended. To address this concern, we show that battlefield injuries and imprisonment were unrelated to own and family characteristics, in line with historical studies.
Enlistment was near-universal for the 1919–21 cohort (Overmans Reference Overmans1999), with 95 percent of men in our sample fighting in the war. Neither the duration nor the intensity of their exposure to the war varied much with family or own characteristics. While qualified workers in the arms industry were initially spared from military service (Müller Reference Müller2016), the 1919–21 cohort was still too young to fill such positions when WWII began. Indeed, their year of war entry differs little in our sample, as the 1919 and 1920 cohorts formed the backbone of Hitler’s Wehrmacht at the beginning of the war. Highly educated individuals were as likely to be placed in combat roles as their less-educated peers, and social background had little to do with the assignment of individuals to subunits, and thus their risk of injury or imprisonment.Footnote 12
The 1919–21 cohort was also too young to reach the middle and higher officer ranks, who had been less likely to die in past wars than regular soldiers. In our data, only 5 percent have reached lieutenant rank. Even the lower officer ranks of captains and majors tended to be significantly older than the 1919–21 cohort, averaging 33.5 and 26.5 years of age in 1942, respectively (Förster Reference Förster2009). Moreover, unlike in previous wars, there was a high casualty rate among officers in WWII (Müller Reference Müller2016). For example, the proportion of officers among all missing during the deadliest defeat in German military history, the collapse of the Heeresgruppe Mitte on the Eastern Front in 1944, corresponded exactly to their proportion in two combat divisions studied by Hartmann (Reference Hartmann2010).Footnote 13
Instead, the likelihood of injury and duration of imprisonment depended primarily on which part of the front the soldiers were fighting, Footnote 14 over which they had little control. Notably, the soldiers’ region of deployment did not depend on their regions of origin (Overmans Reference Overmans1999). And while the very young and old were more likely to be released early from captivity (Overmans Reference Overmans2000), our analysis conditions on age and focuses on a birth cohort that was already in their mid-20s by the end of the war.
As for the displacement effect, Bauer, Braun, and Kvasnicka (Reference Bauer, Braun and Kvasnicka2013) show that the differences between displaced and non-displaced Germans were small before the war, not least in education. The only major differences were in the proportions employed in agriculture and industry, which can be attributed to the more agrarian structure of the eastern territories. However, the 1919–21 cohort had little labor market experience when the war began, so these structural differences had little impact on their work experience. Importantly, virtually all Germans living east of the postwar German-Polish border were displaced, minimizing problems of selection.
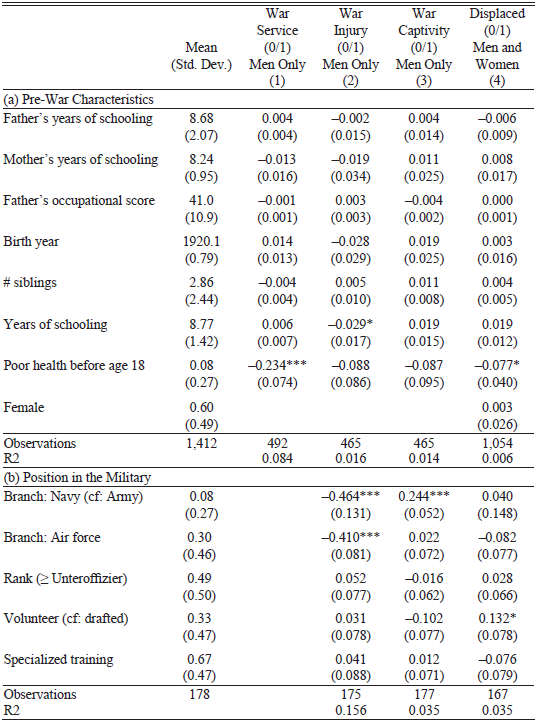
We provide evidence in support of these arguments in Panel (a) of Table 2, regressing indicators for war service and each shock on prewar characteristics of the respondents (birth year, siblings, years of schooling, and an indicator for ill health in childhood) and their parents (years of education and the father’s occupational score). Individuals who were sick in childhood were less likely to serve in the war, but war service is uncorrelated with socio-economic characteristics. This lack of selectivity is in line with the observation that enlistment was nearly universal for the cohorts that we study. It is also consistent with earlier findings in Maas and Settersten (Reference Maas and Settersten1999), who found no evidence of an effect of socio-economic characteristics on the likelihood and length of WWII service in a sample of German men born 1887–1922.
EXOGENEITY OF WAR SERVICE AND WAR SHOCKS
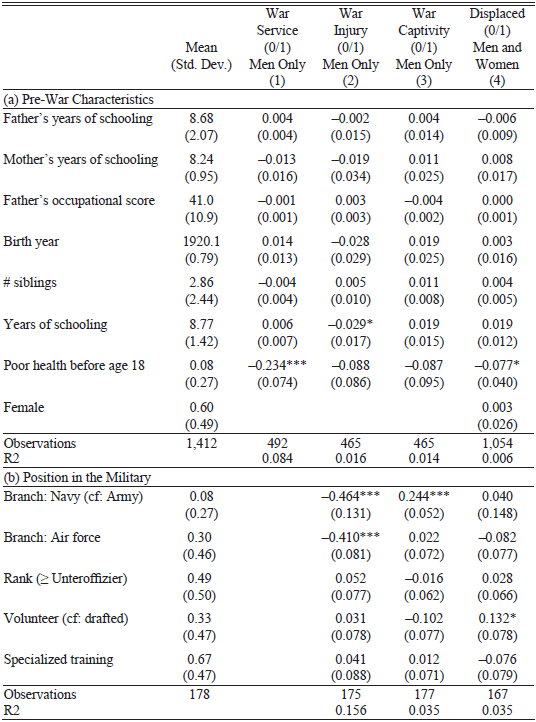
Table 2 Long description
The table presents regression results examining the relationship between war service and various war shocks with prewar characteristics of respondents and their parents. It includes data on father's and mother's years of schooling, father's occupational score, birth year, number of siblings, years of schooling, poor health before age 18, and gender. The table is divided into sections for pre-war characteristics and position in the military, with columns for war service, war injury, war captivity, and displaced men and women. Notable trends include the negative correlation between poor health before age 18 and war service, and the lack of correlation between war service and socio-economic characteristics. The table also includes observations and R-squared values for each regression.
* = Significant at the 10 percent level.
** = Significant at the 5 percent level.
*** = Significant at the 1 percent level.
Notes: The table reports coefficient estimates from the indicated war-related shock on a set of pre-war individual and parental characteristics (Panel (a)) or indicators of their position within the military during the war (Panel (b)) for birth cohorts 1919–21. Estimates for war injuries and captivity are conditional on war service. Robust standard errors in parentheses.
Sources: German Life History Study (Mayer 1995, 2018a).
Conditional on serving, prewar characteristics do not predict war injuries, captivity, or displacement, explaining less than 2 percent of their variation. As an exception, individuals who report periods of poor health before age 18 tend to be less exposed to the war shocks we study. However, few individuals report poor health before age 18 (see Online Appendix Figure F6), and our estimates change little when controlling for pre-war health.Footnote 15 The patterns remain similar when estimating separate bivariate regressions for each characteristic (Online Appendix Table F3). Our baseline analysis, nevertheless, controls for birth year indicators, parental education, number of siblings (which correlate with socio-economic background), and time of war entry. In an extended specification, we additionally control for own years of secondary schooling, poor health before age 18, and the respective other war shocks. The model fit increases as controls are added while our coefficients of interest remain stable, making it unlikely that omitted variables drive our results.
For a subset of our data, we also observe the individuals’ military rank, training, and branch, and whether they volunteered to serve. Rank or specialized military training (beyond basic combat training) are uncorrelated with any of our war shocks (Table 2, Panel (b)). As expected, army soldiers were much more likely to sustain war injuries than those serving in the navy or the air force, and sailors were imprisoned more often than soldiers of the other two branches. However, individual or parental characteristics do not predict military branch or voluntary service, and do therefore not predict war injuries or captivity either (Table 2, Panel (a)). Overall, we find no evidence of significant selection into treatment. Furthermore, the specific life-cycle patterns we document—where treatment effects are concentrated at certain ages—would be difficult to attribute to selection alone.
Multiple Shocks
One other concern is that soldiers can be subject to multiple war-related shocks. If the different shocks are correlated, we risk capturing the consequences of multiple war experiences rather than a clearly defined shock (omitted variable bias). Online Appendix Table D2 shows that this is not a concern in our setting. Displacement is not correlated with either imprisonment or wartime injuries. Imprisonment and wartime injuries show a slight negative correlation, presumably because wartime injuries reduced subsequent combat time and thus the risk of imprisonment. Footnote 16 However, the correlation is small (ρ = −0.11), and we show in additional checks that our estimates change little when adding the other respective shocks as controls.
Nevertheless, the different war shocks might interact with each other. For example, war injuries might have a different effect on displaced soldiers than on non-displaced soldiers. In Online Appendix Section E, we show that even if such interaction effects exist, our approach captures an appropriately weighted average effect. For example, our estimate for war injuries reflects the weighted average of their effects on displaced and non-displaced soldiers, with weights equal to their respective population shares. Online Appendix Section E also presents separate estimates for combinations of war-related shocks. However, because cell sizes are small for some combinations of shocks, our main analysis focuses on the average effect of each shock, as identified by Equations (1) and (2).
Selective Mortality
One might worry that veterans with serious injuries were more likely to die before the 1980s and thus underrepresented in the retrospectively collected GHS. Two observations suggest that such selective mortality is not an issue for our analysis. First, official mortality tables for the postwar period do not show an unusually high risk for males born around 1920 (Statistisches Bundesamt 2006). For example, the 1920 male cohort had a remaining (postwar) life expectancy of 47.0 years at age 26, only about 1.6 years less than the non-serving cohort of 1930. This increase in life expectancy between cohorts is not unusually large (life expectancy at age 26 increased by two years from the 1930 to the 1940 cohort). Second, the share of injured veterans in our data is broadly in line with existing estimates. Müller (Reference Müller2016) states that about 5.2 million German soldiers were injured in the war (out of 18.2 million serving, corresponding to a share of 28.5 percent compared to 29.9 percent in our sample). Even with selective mortality, we would still estimate a lower bound on the true (negative) effect of war injuries on labor market outcomes.Footnote 17
Battlefield Injuries
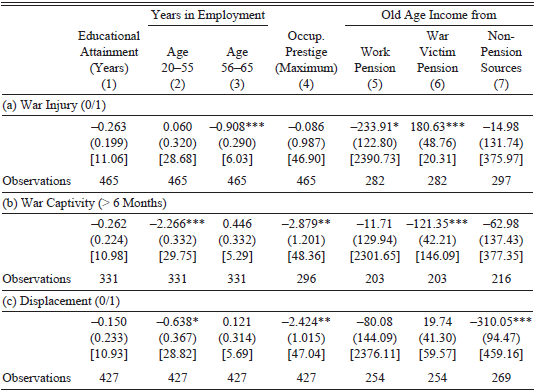
Panel (a) of Table 3 summarizes how battlefield injuries affected the labor market careers of WWII veterans born 1919–21. The estimates are based on Equation (1), estimated separately for each outcome and shock (the estimates change little when we include all shocks jointly). Two main findings emerge. First, injured soldiers were less likely to be employed at older ages than non-injured veterans, although they achieved similar employment rates at earlier ages (see Columns (2) and (3)). War injuries reduced employment by nearly one year between ages 56–65, by accelerating the transition from work to retirement. Second, war injuries reduced monthly work pensions by DM 234, or almost 10 percent compared to the control mean (Column (5)). However, the higher pension payments as war victims almost compensated for this loss (Column (6)). Battlefield injuries have no sizeable effects on educational investments (Column (1)) or on non-pension income in old age (Column (7)).
THE EFFECT OF WAR EXPERIENCES ON LABOR MARKET OUTCOMES, MEN BORN 1919–21
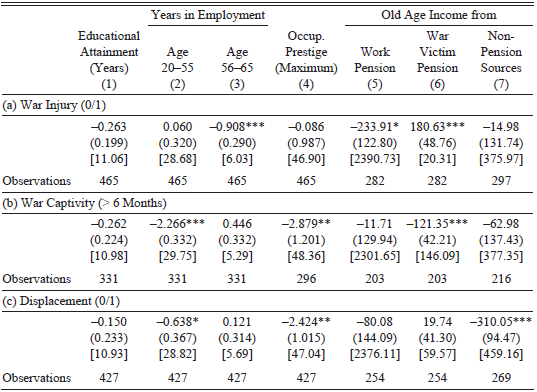
Table 3 Long description
The table presents data on the impact of war injuries on labor market outcomes for men born between 1919 and 1921. It includes columns for educational attainment, years in employment, occupational prestige, and old age income from work pensions, war victim pensions, and non-pension sources. The table has 11 rows and 7 columns, with each row representing different variables such as war injury, war captivity, and displacement. Key findings include reduced employment rates at older ages for injured soldiers, a decrease in monthly work pensions by DM 234, and higher pension payments as war victims. The data shows no significant effects on educational investments or non-pension income in old age.
* = Significant at the 10 percent level.
** = Significant at the 5 percent level.
*** = Significant at the 1 percent level.
Notes: Estimates of the effect of battlefield and other war-related injuries (Panel (a)), war captivity (Panel (b)), and displacement (Panel (c)) on various outcome variables (shown in the table header). Each estimate is from a separate regression. The sample consists of males born 1919–21. Columns (5) to (7) restrict the sample to the second part of GHS-2 conducted in 1987/88 where we observe individuals up to age 65–69 (see Footnote 5). All regressions control for the birth year (indicators), years of schooling of father and mother, number of siblings, and time of entry into the war. Robust standard errors in parentheses, unconditional means for the unaffected control group are in square brackets.
Sources: German Life History Study (Mayer 1995, 2018a).
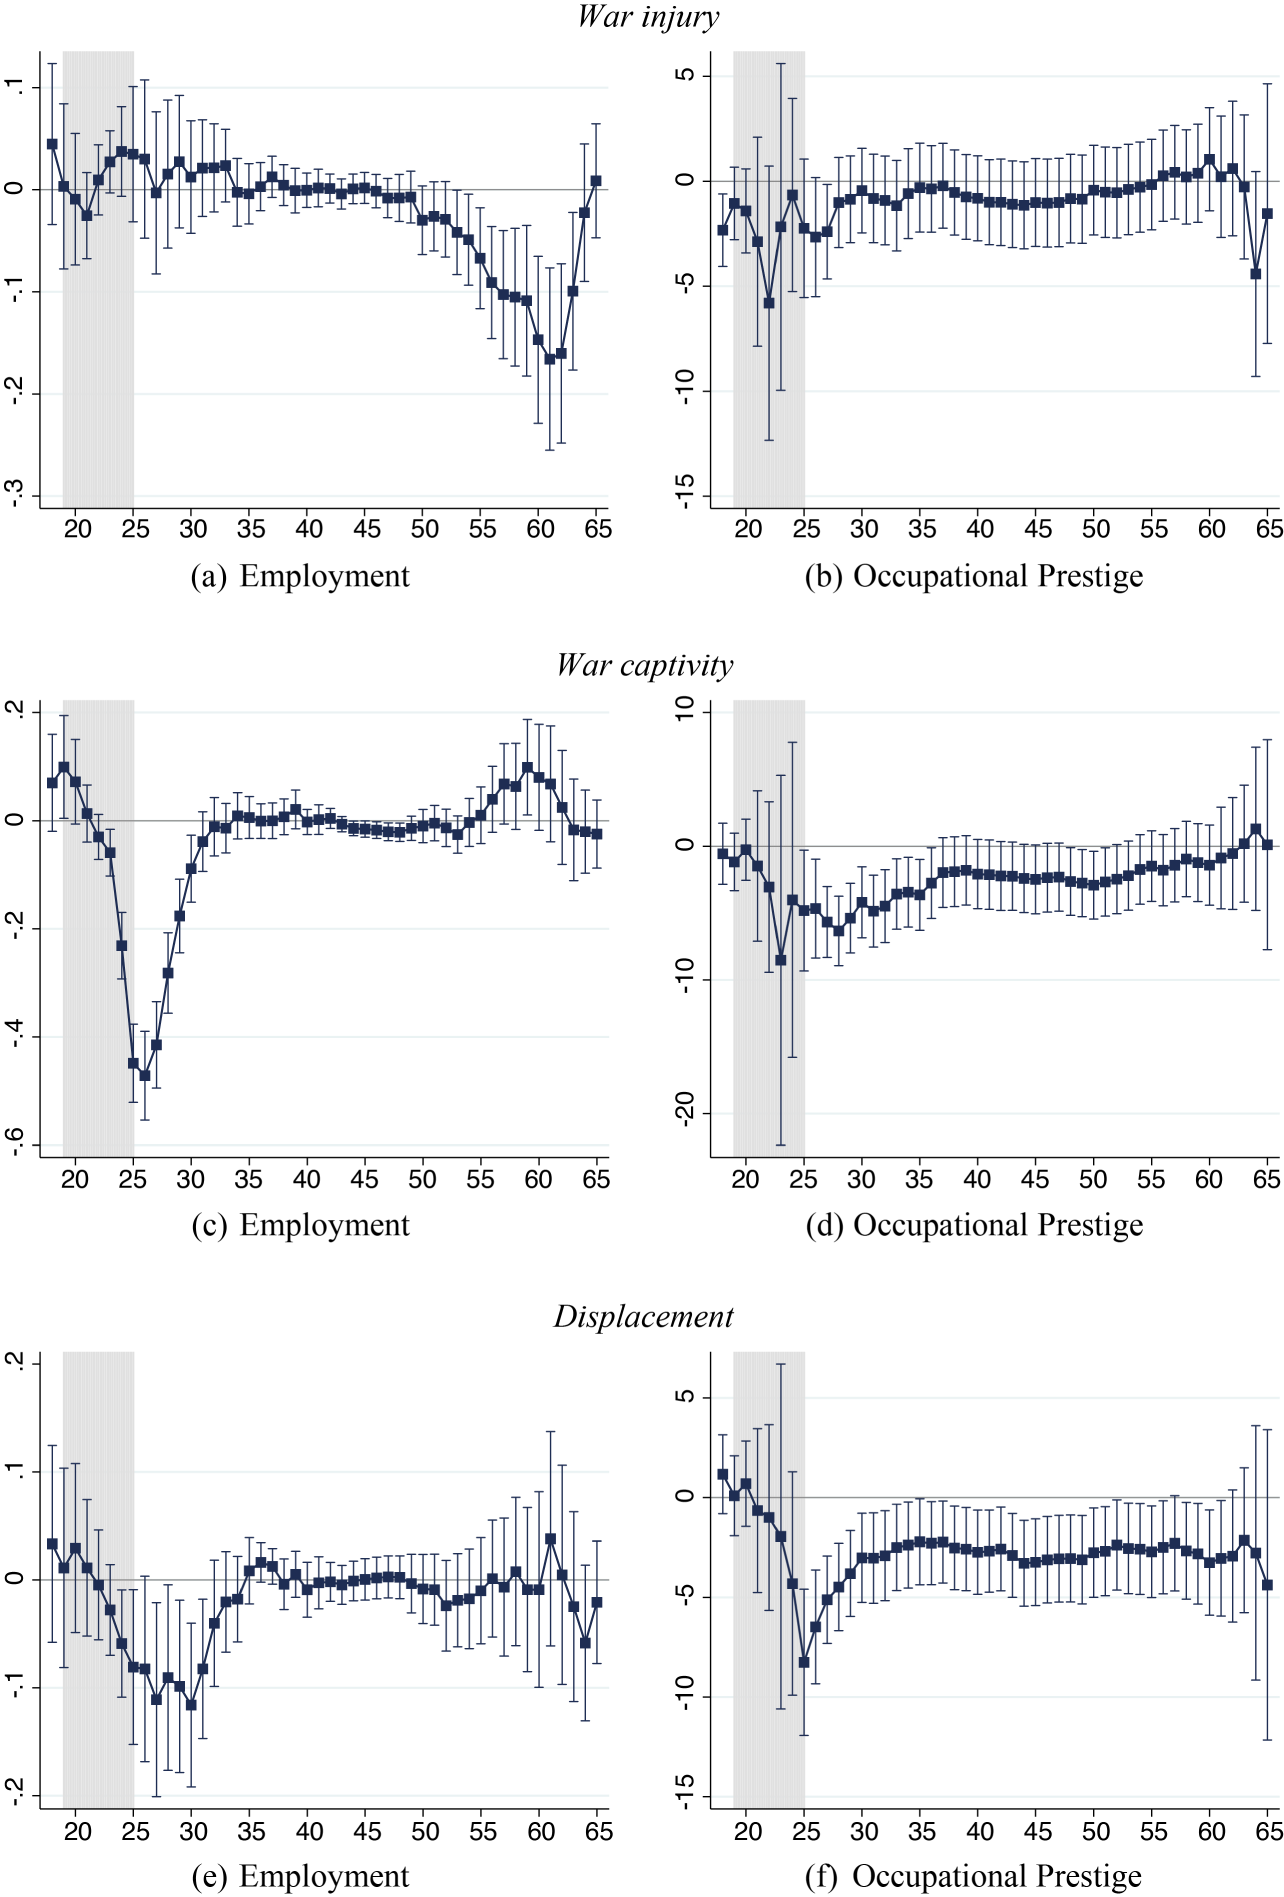
The life-cycle graph in Panel (a) of Figure 2 confirms that the adverse employment effect of war injuries arose only late in life. Employment probabilities of men with and without injuries were surprisingly similar in young and middle ageFootnote 18 but started diverging in the early 50s. The gap then widened steadily until age 61, reaching 17 pp, before shrinking again as injured and non-injured veterans retired. On average, the employment probability of injured veterans was 8.5 pp lower between ages 56 and 65 than that of non-injured peers (relative to a baseline probability of 60.9 percent).Footnote 19 Perhaps surprisingly, we do not find a sustained effect of wartime injuries on occupational success conditional on employment (see Figure 2b).
LIFE-CYCLE EFFECTS OF WAR EXPERIENCES, MEN BORN 1919–21
Notes: Effect of battlefield and other war-related injuries (Panels (a) and (b)), war captivity (Panels (c) and (d)), and displacement (Panels (e) and (f)) on employment (left panels) and occupational prestige (conditional on employment, right panels) over the life cycle. Estimates are from a pooled OLS regression, interacting the regressor of interest and birth year (indicators) with a full set of age indicators. The sample consists of males born 1919–21. Point estimates are marked by a dot. The vertical bands indicate the 95 percent confidence interval of each estimate. The shaded area indicates the duration of WWII.
Sources: German Life History Study (Mayer 1995, 2018a).
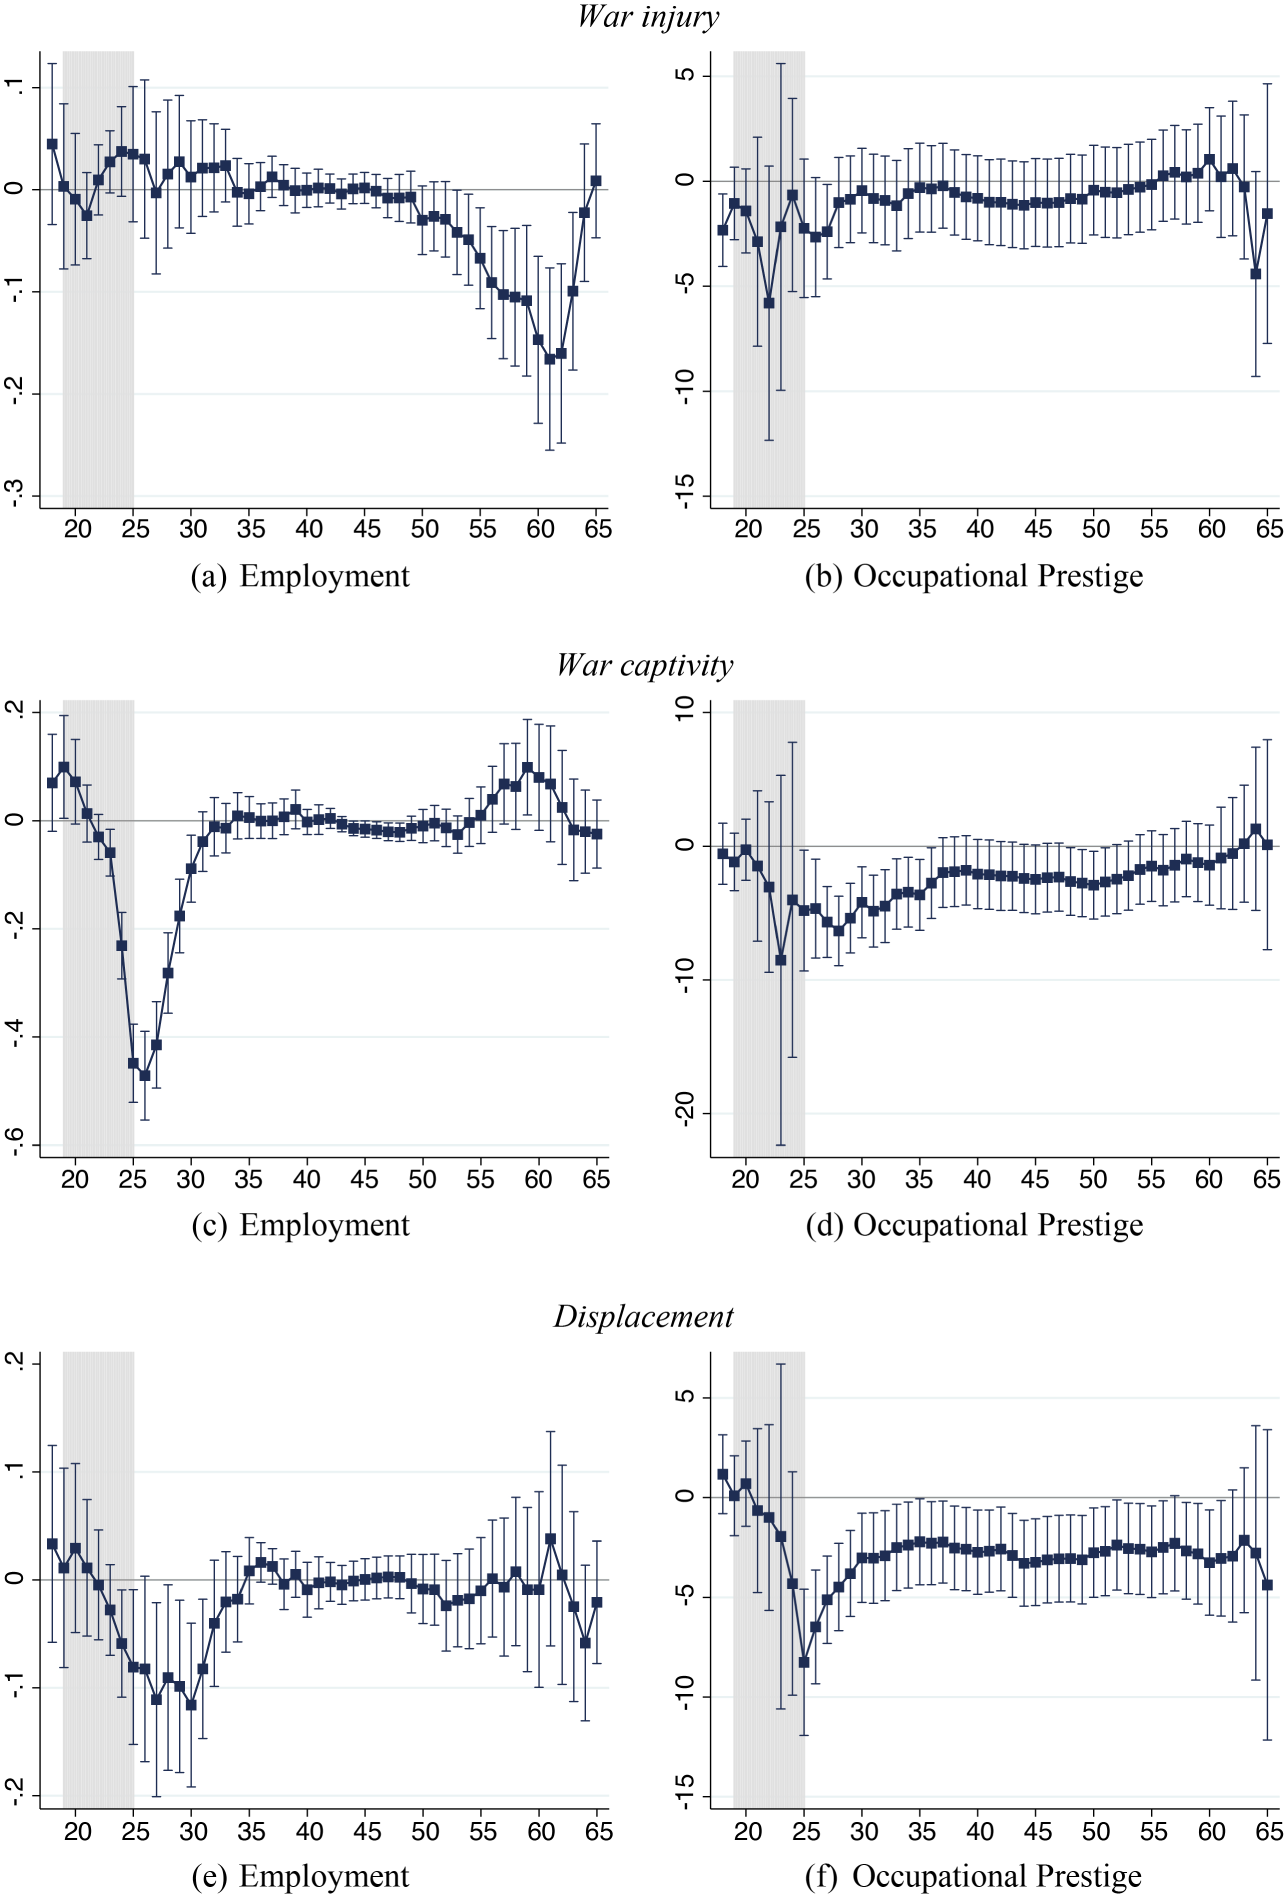
Figure 2 Long description
The image contains six line graphs showing the effects of battlefield and other war-related injuries, war captivity, and displacement on employment and occupational prestige over the life cycle of men born between 1919 and 1921. The graphs are divided into three rows, each representing a different type of war experience: war injury, war captivity, and displacement. Each row contains two graphs: the left graph shows the effect on employment, and the right graph shows the effect on occupational prestige. The x-axis represents age, ranging from 20 to 65 years, while the y-axis represents the impact on employment and occupational prestige. Point estimates are marked by dots, and the vertical bands indicate the 95 percent confidence interval of each estimate. The shaded area indicates the duration of World War 2. The data is sourced from the German Life History Study.
As detailed in Online Appendix G, these life-cycle patterns in injured veterans’ employment are in line with a standard Ben-Porath type of model with endogenous retirement decisions (Hazan Reference Hazan2009). The model describes how individuals decide to invest in human capital based on their expected returns, and how they time their entry into retirement, given its impact on earnings and, thus, consumption. Specifically, the key equilibrium conditions equate the marginal cost of human capital investment with its marginal benefit over the working life, and the disutility of working at retirement age with the marginal utility of continuing to work (in terms of consumption). In this framework, a natural assumption is that war injuries increase the disutility of work, which tends to decrease employment. But since the disutility of work also increases with age, an upward shift in this disutility tends not to affect early or mid-career employment; instead, it accelerates entry into retirement (see Online Appendix G.2 and Figure G8b).Footnote 20 Standard theory, therefore, helps to understand why the labor market consequences of a sudden health shock at a young age manifest themselves only at an older age, decades after the war ended.
Two factors might amplify this decline in employment at older ages. First, by mitigating the implied income loss, compensations and pensions for war victims increase the incentives for early retirement further (Online Appendix G.2).Footnote 21 Second, health might deteriorate more rapidly over age for wounded than non-wounded veterans (e.g., Stewart et al. Reference Stewart, Sosnov, Howard, Orman, Fang, Morrow, Zonies, Bollinger, Tuman, Freedman and Chung2015); Online Appendix Figure F6 shows that this is the case in our sample. The disutility of work may thus not only shift upwards but also become steeper over age.Footnote 22
We also reiterate that disability benefits were available to workers of any age in Germany, subject to medical indication (see the Appendix). Disability benefits were an important route to retirement, and their availability likely influenced the precise magnitude and timing of the impact of war injuries on early retirement. At the same time, our results show that the large reduction in the retirement age in the 1970s and early 1980s cannot be fully understood without taking into account the fact that, at that time, cohorts were retiring who had almost entirely served in WWII.
In sum, our findings underscore the importance of a life-cycle perspective in designing policies to alleviate the economic hardship of injured veterans. War injuries can have surprisingly few consequences on labor market careers in the first decades after the war, but then greatly decrease employment rates when veterans reach older ages. As these findings can be rationalized by standard life-cycle theory, we might expect similar patterns following recent or current violent conflicts and wars.
Prisoners of War
Next, we consider the effect of being taken POW. For comparability with the other war shocks, we consider a binary indicator, comparing those veterans who were imprisoned for more than six months (a fate shared by nearly half of the men in our data) with those soldiers who were not POWs. Since we drop individuals with short durations of captivity of no more than six months, the number of observations in Panel (b) of Table 3 is lower than in previous tables. However, our estimates remain similar if we consider all POWs regardless of their length of captivity.
POWs born in 1919–21 were imprisoned at a time when, in peacetime, they would have completed their education or entered the labor market. Panel (b) of Table 3 shows that, as a result, they received slightly less education (Column (1))Footnote 23 and were employed for about 2.3 fewer years before age 55 (Column (2)). They also had less occupational success than veterans who avoided war captivity (Column (4)), although this effect is less pronounced when considering the duration of rather than a binary indicator for war captivity (see Online Appendix Table F4). Despite being employed fewer years, POWs did not receive much lower work pensions (Column (5)), as Germany’s pension system “replaces” employment gaps caused by war captivity (see the Appendix for an overview of the pension system).Footnote 24
Figure 2c illustrates how war captivity delayed labor market entrance. POWs were significantly less likely to be employed in their 20s, with the gap peaking at nearly 50 pp in their mid-20s. This gap is unsurprising, reflecting the POWs’ forced withdrawal from the labor market due to their imprisonment. But remarkably, POWs managed to close the employment gap in their 30s and were more likely to work in later life: POWs’ probability of employment overtook that of non-POWs at age 55. The gap widens until age 59, before closing again as increasingly more veterans retire. Conditional on employment, POWs experienced lower occupational success than non-POWs at earlier ages, reflecting their delayed career start, but the gap closes gradually over time (Panel (d)).Footnote 25
These effects of imprisonment on educational attainment and retirement decisions are again in line with the predictions from standard life-cycle theory, as we show in Online Appendix G.3. By reducing the potential duration of an individual’s productive working span, imprisonment discourages educational investments. Moreover, by reducing labor earnings, war captivity increases the marginal utility of consumption and, therefore, participation—POWs postpone their retirement entry to compensate for the lost working time during captivity. This is akin to an income effect in static or dynamic models of labor supply (e.g., Imbens, Rubin, and Sacerdote Reference Imbens, Rubin and Sacerdote2001).Footnote 26
The mechanisms we highlight are, therefore, distinct from mechanisms related to the potential health effects of imprisonment, which have received much attention in the related literature (see Myrskylä and Santavirta Reference Myrskylä and Santavirta2023). Indeed, the health trajectories of POWs and non-POWs are not very different in our setting (see Online Appendix Figure F6b). However, the conditions soldiers experienced during captivity may have additional implications for labor market outcomes. The conditions and duration of captivity varied systematically by the location of imprisonment, and this location is recorded in our data for a subset of the GHS-2 sample. We find that time spent in war captivity had a more negative effect on employment for soldiers who were imprisoned in Eastern Europe or the USSR than for those imprisoned elsewhere (see Online Appendix Table F4).Footnote 27
Displacement
More than one in five men in our sample were forcibly displaced from Eastern Europe. As one of the largest population movements in history, the mass arrival of displaced persons in West Germany had important aggregate effects (Braun and Kvasnicka Reference Braun and Kvasnicka2014; Braun and Weber Reference Braun and Weber2021; Ciccone and Nimczik Reference Ciccone and Nimczik2022; Peters Reference Peters2022). However, our interest here is in the (relative) individual economic performance of the displaced, which was of central policy interest in postwar Germany (Bauer, Braun, and Kvasnicka Reference Bauer, Braun and Kvasnicka2013).
We again focus on the 1919–21 birth cohort observed in the GHS. This cohort was in their mid-20s at the time of displacement (we will study the role of age at displacement later). Panel (c) of Table 3 shows that between the ages of 20 and 55, displaced persons were employed for about 0.6 years less than their non-displaced peers (Column (2)), but their employment at older ages was similar (Column (3)). Consistent with its negative impact on employment, displacement reduced the maximum occupational prestige attained over a lifetime by 2.4 points (or 5 percent relative to the mean of the control group).
Displaced persons also had significantly lower incomes in old age than non-displaced persons, even though West German pension law equated periods of employment before displacement from Eastern Europe with periods in West Germany (Bauer, Giesecke, and Janisch Reference Bauer, Giesecke and Janisch2019). This is primarily due to lower non-pension income from rental income, interest, or dividends, which fell by DM 310 per month, or almost 68 percent, relative to the control mean (Column (7)). This result is consistent with previous findings that the displaced never fully caught up in terms of wealth (Bauer, Braun, and Kvasnicka Reference Bauer, Braun and Kvasnicka2013). The decline in non-pension income is especially pronounced among displaced individuals whose fathers had higher levels of education (see Online Appendix Table F5).
Panels (e) and (f) of Figure 2 show that displacement left clear traces in labor market careers. Immediately after the war, displaced persons were up to 10 pp less likely to be employed than non-displaced men (Panel (e)). The gap in employment decreased in the early 30s and disappeared by the mid-30s. However, conditional on employment, the occupational prestige of displaced persons remained significantly lower throughout their labor market careers. Panel (f) illustrates that this gap was greatest around age 25, shortly after displacement. While this penalty declined in the late 20s, it remained largely unchanged thereafter. At age 56–65, displacement still lowered occupational prestige by around 3.4 points (or 7.8 percent relative to the control mean). This aligns with Bauer, Braun, and Kvasnicka (Reference Bauer, Braun and Kvasnicka2013), who show that displaced men born in 1906–25 earned 5.1 percent less in 1971 than otherwise comparable non-displaced men. Our results suggest that such occupational disadvantages persisted until late in the career, even for individuals who were just starting their careers at the time of displacement.
In Online Appendix G.4, we interpret displacement as a decline in the wage rate (e.g., due to a loss of social and job networks) or a loss of wealth (e.g., due to lost property). A wage decline generates opposing income and substitution effects and, therefore, ambiguous implications for the retirement decision. In a simple model with log-linear utility, the income and substitution effects on labor market entrants cancel out exactly. On the other hand, a pure wealth effect would generate income but no substitution effect, and therefore, delay retirement. These implications align with the observation that in the 1919–21 cohort, expellees do not retire (significantly) later. However, as we show next, the effects of displacement depend critically on the age at which a person was displaced, with strong effects on education for younger birth cohorts (whose educational investments were directly interrupted) and large effects on employment for older cohorts (who experience weaker income effects).
Robustness Checks and Additional Evidence
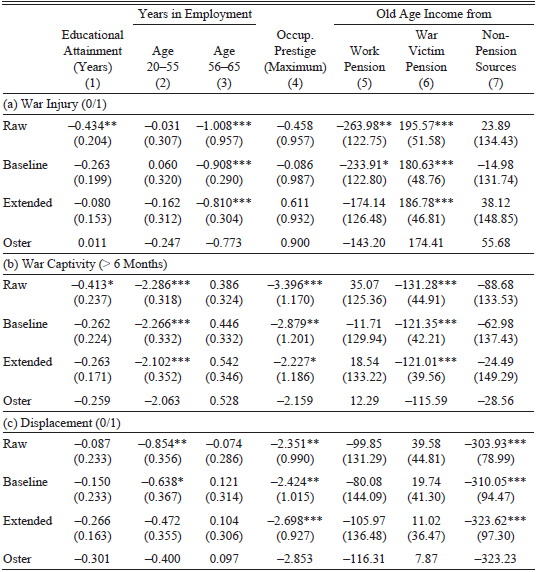
Table 4 shows that our baseline results from Table 3 are robust to alternative control variables and to the joint inclusion of all shocks. We present three sets of regressions for each shock. The “raw” specification controls only for year of birth. The “baseline” specification adds our standard controls: years of schooling of the father and mother, number of siblings, and time of war entry. Finally, the “extended” specification controls for own years of secondary schooling, an indicator for poor health before age 18, and the respective other shocks.
ROBUSTNESS TESTS ON THE EFFECT OF DIFFERENT WAR-RELATED SHOCKS, MEN BORN 1919–21
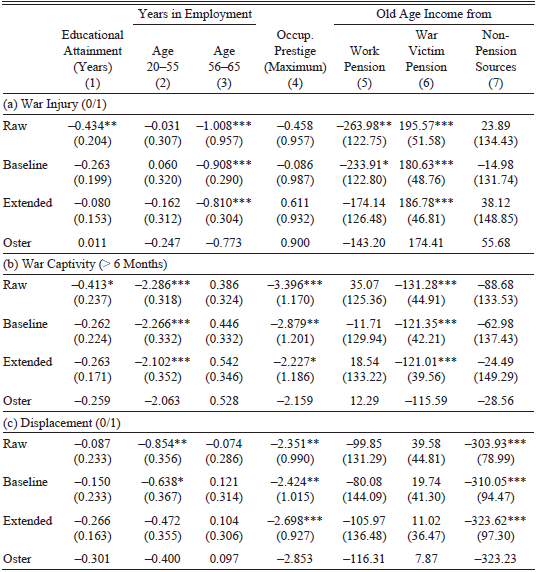
Table 4 Long description
The table presents the results of robustness tests on the effect of different war-related shocks on men born between 1919 and 1921. It includes three sets of regressions for each type of shock: war injury, war captivity, and displacement. The raw specification controls only for the year of birth. The baseline specification adds standard controls such as years of schooling of the father and mother, number of siblings, and time of war entry. The extended specification further controls for own years of secondary schooling, an indicator for poor health before age 18, and the respective other shocks. The table shows coefficients and standard errors for educational attainment, years in employment, occupational prestige, and old age income from various sources. Notable trends include significant negative impacts of war captivity on educational attainment and years in employment, and varying impacts of war injury and displacement on different outcomes.
* = Significant at the 10 percent level.
** = Significant at the 5 percent level.
*** = Significant at the 1 percent level.
Notes: Estimates of the effect of war-related shocks on various outcome variables (shown in the table header). Each estimate is from a separate regression. The sample consists of males born 1919–21. Columns (5) to (7) restrict the sample to the second part of GHS-2 conducted in 1987/88 where we observe individuals up to ages 65–69 (see Footnote 5). The “raw” specification controls only for birth year indicators. The “baseline” specification additionally controls for years of schooling of father and mother, number of siblings, and time of entry into the war. The “extended” specification additionally controls for own years of secondary schooling, an indicator for poor health before age 18, and all other war shocks. The “Oster” specification adjusts for potential selection on unobservables based on Oster (Reference Oster2019). Robust standard errors in parentheses.
Sources: German Life History Study (Mayer 1995, 2018a).
Our coefficients of interest remain stable as controls are added and model fit improves, suggesting that selection is unlikely to drive our results. To formalize this argument, we report bias-corrected estimates based on Oster (Reference Oster2019), which adjust for potential selection on unobservables based on the selection on observables.Footnote 28 These estimates are consistent with our baseline estimates, especially with respect to the effects of war shocks on years of employment, occupational prestige, and pension income. The effects on education vary more with the set of controls. In the next section, we take advantage of the large sample size of the 1970 census to present precise estimates of the displacement effects on education by cohort.
Finally, Online Appendix Table F6 reports additional evidence on the effects of wartime shocks on education, marital status, and number of children over the life cycle. The results are from separate regressions for different age groups (18–25, 26–30, 31–40, 41–55, 56–65), controlling for our standard set of control variables.Footnote 29 Two findings stand out. First, the different war experiences had large short-term but virtually no long-term effects on marital status or the number of children. War-injured veterans were more likely to be married in their late 20s (up 8.8 pp from a baseline of 49.5 percent), presumably because they returned from the battlefield earlier or were more dependent on a partner for help. On the other hand, POWs were significantly less likely to be married in their late 20s (by 23.2 pp). However, for veterans born in 1919–21, neither war injury nor captivity significantly affected marital status after age 30. The war led to an acute shortage of men and thus strengthened men’s bargaining power (see, e.g., Bethmann and Kvasnicka Reference Bethmann and Kvasnicka2013; Kesternich et al. Reference Kesternich, Siflinger, Smith and Steckenleiter2020; Battistin, Becker, and Nunziata Reference Battistin, Becker and Nunziata2022), even if they returned from the war disabled or after long captivity. Second, the table also shows that some POWs sought further education after returning from captivity. Thus, POWs in their 30s were more likely than non-POWs to be in education. However, this was not enough to close the negative educational gap created by their captivity in their early 20s.
THE EFFECT OF DISPLACEMENT ACROSS COHORTS
The previous section examined how individual war experiences shaped labor market careers within a given birth cohort. We now examine how the impact of individual war experiences varies across cohorts. We focus on the impact of displacement, which affected young and old at very different points in the life cycle, on educational attainment and labor market exit. Our analysis relies mainly on the 1970 census, whose large sample size allows us to identify displacement effects by cohort with precision.
Education
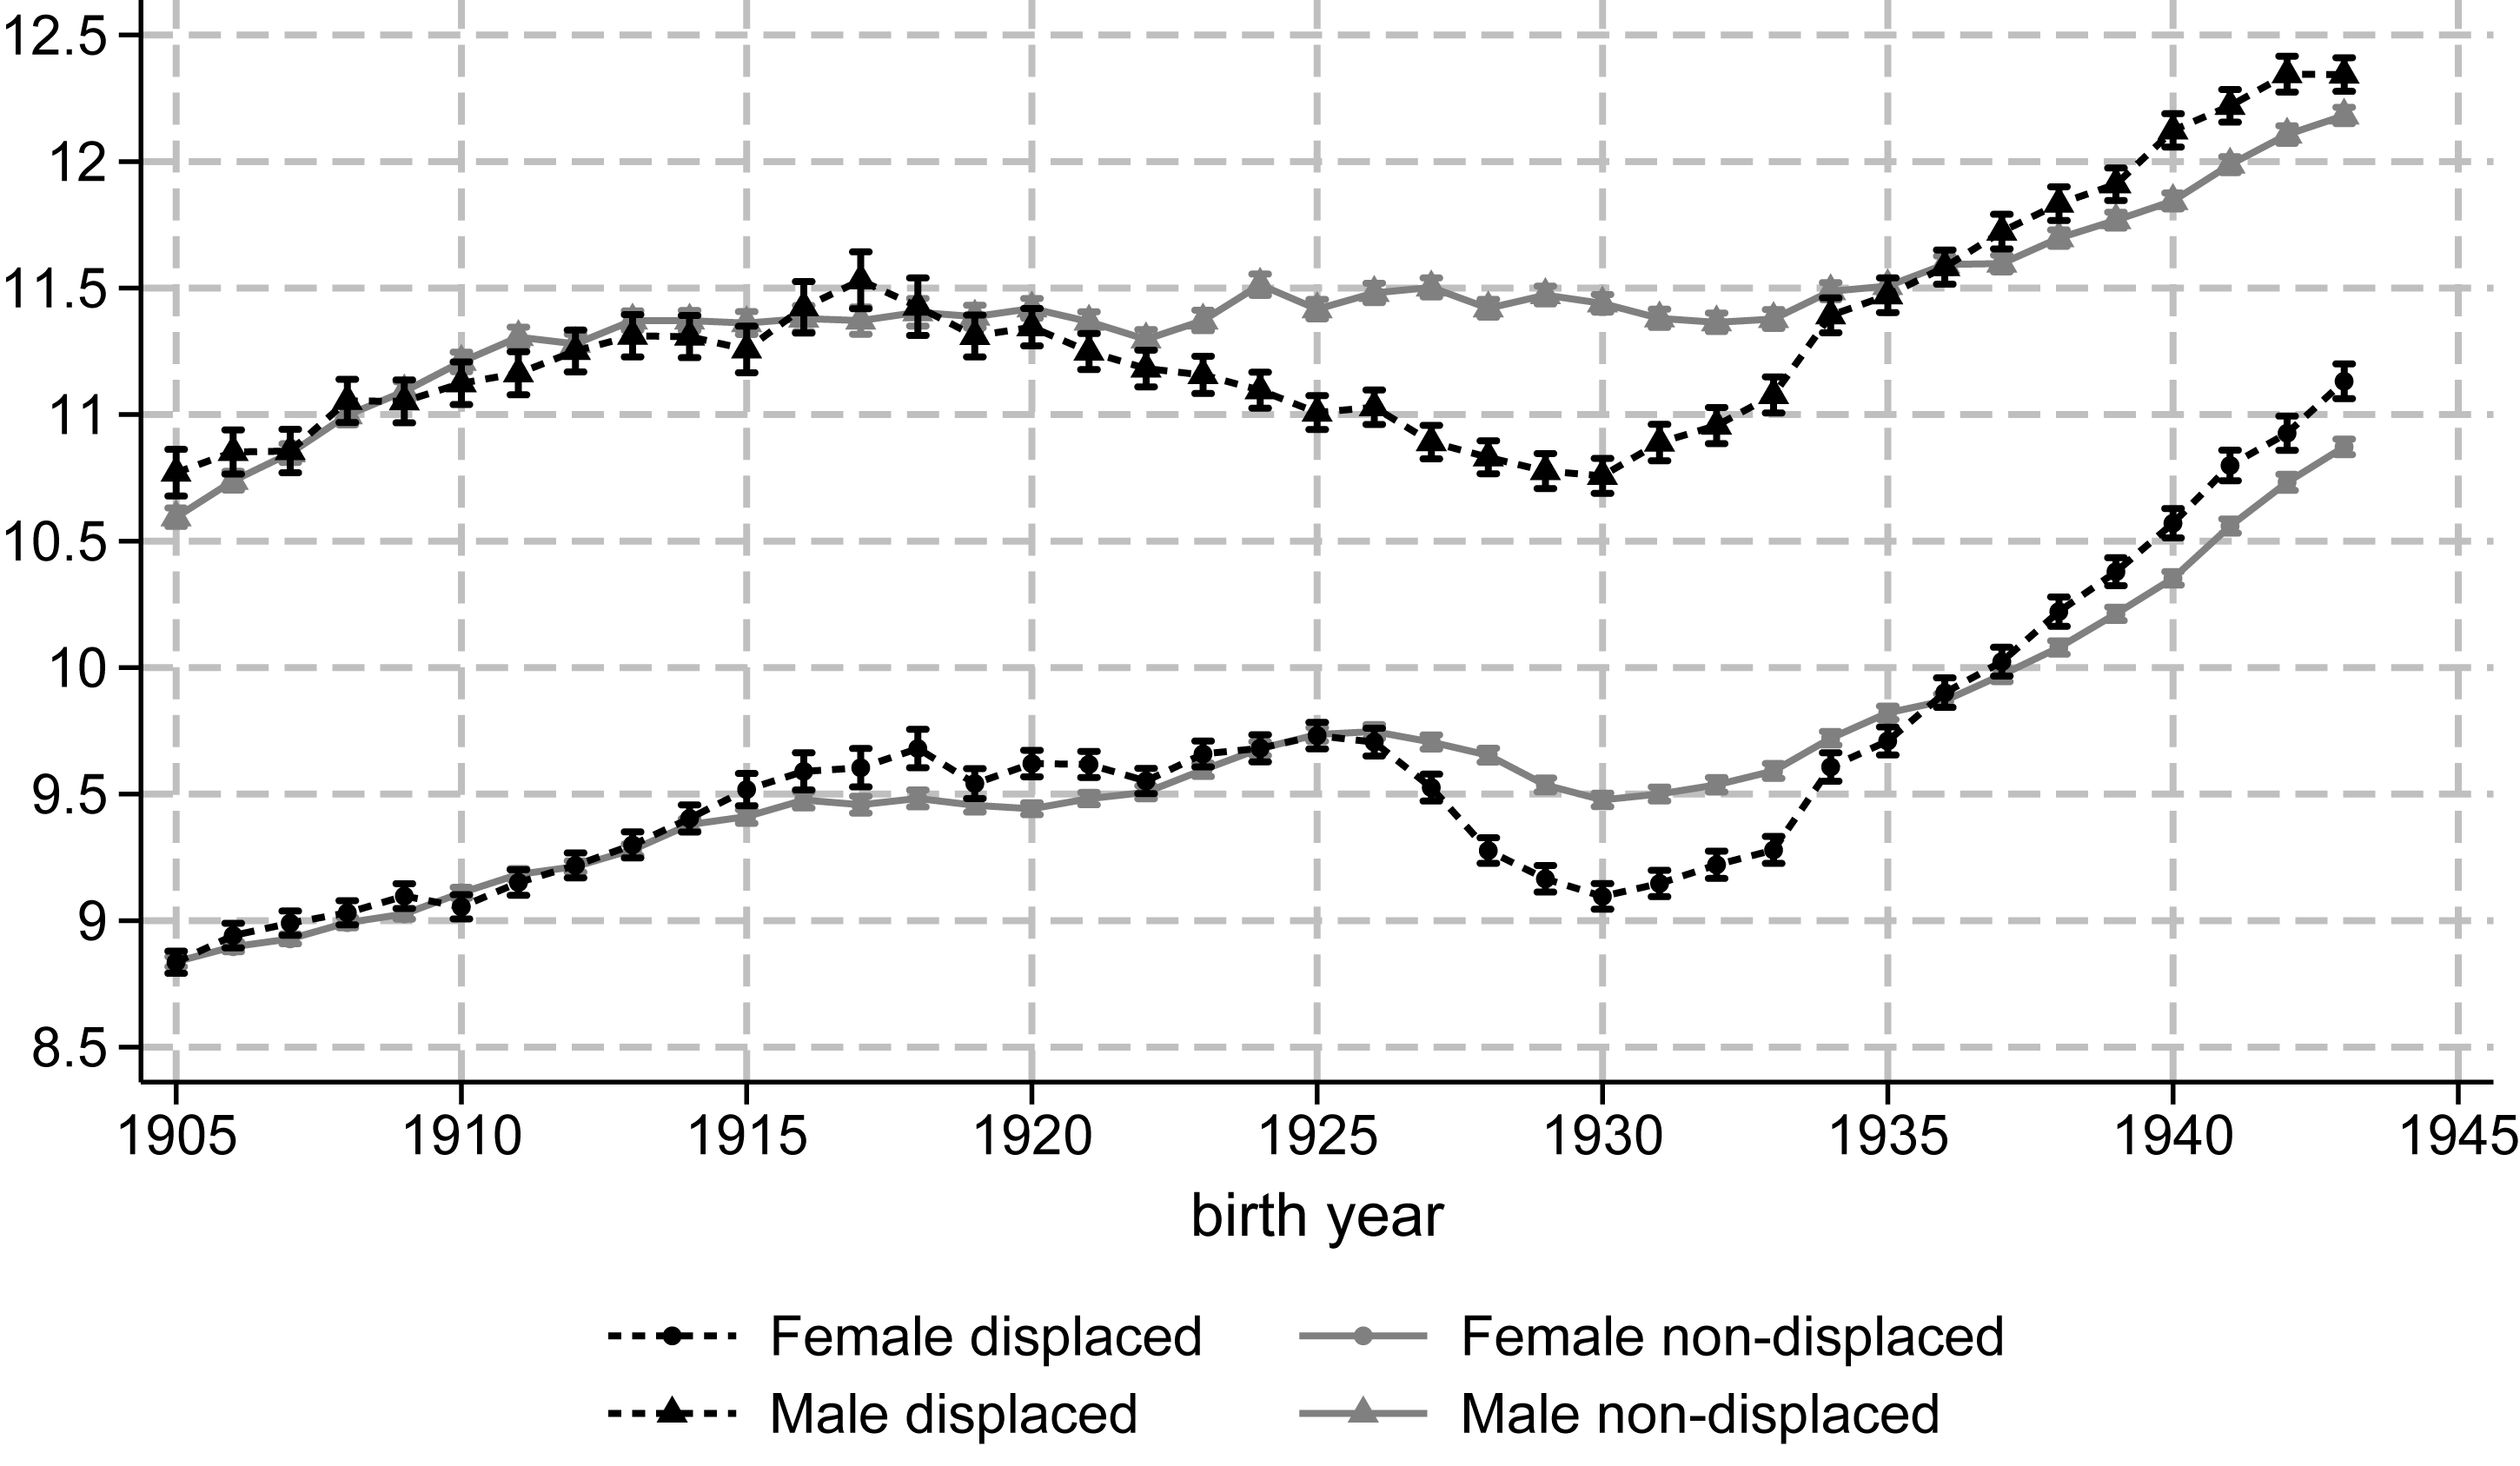
Figure 3 compares, separately for men and women, the average educational attainment of displaced and non-displaced persons for cohorts born 1905–1943. We exclude more recent cohorts as they may not have completed their education by 1970.
THE IMPACT OF DISPLACEMENT ON EDUCATION
Notes: The figure illustrates the impact of displacement on education across cohorts. It shows unconditional means in years of education by cohort and displacement status.
Source: 1970 Census (FDZ 2008).
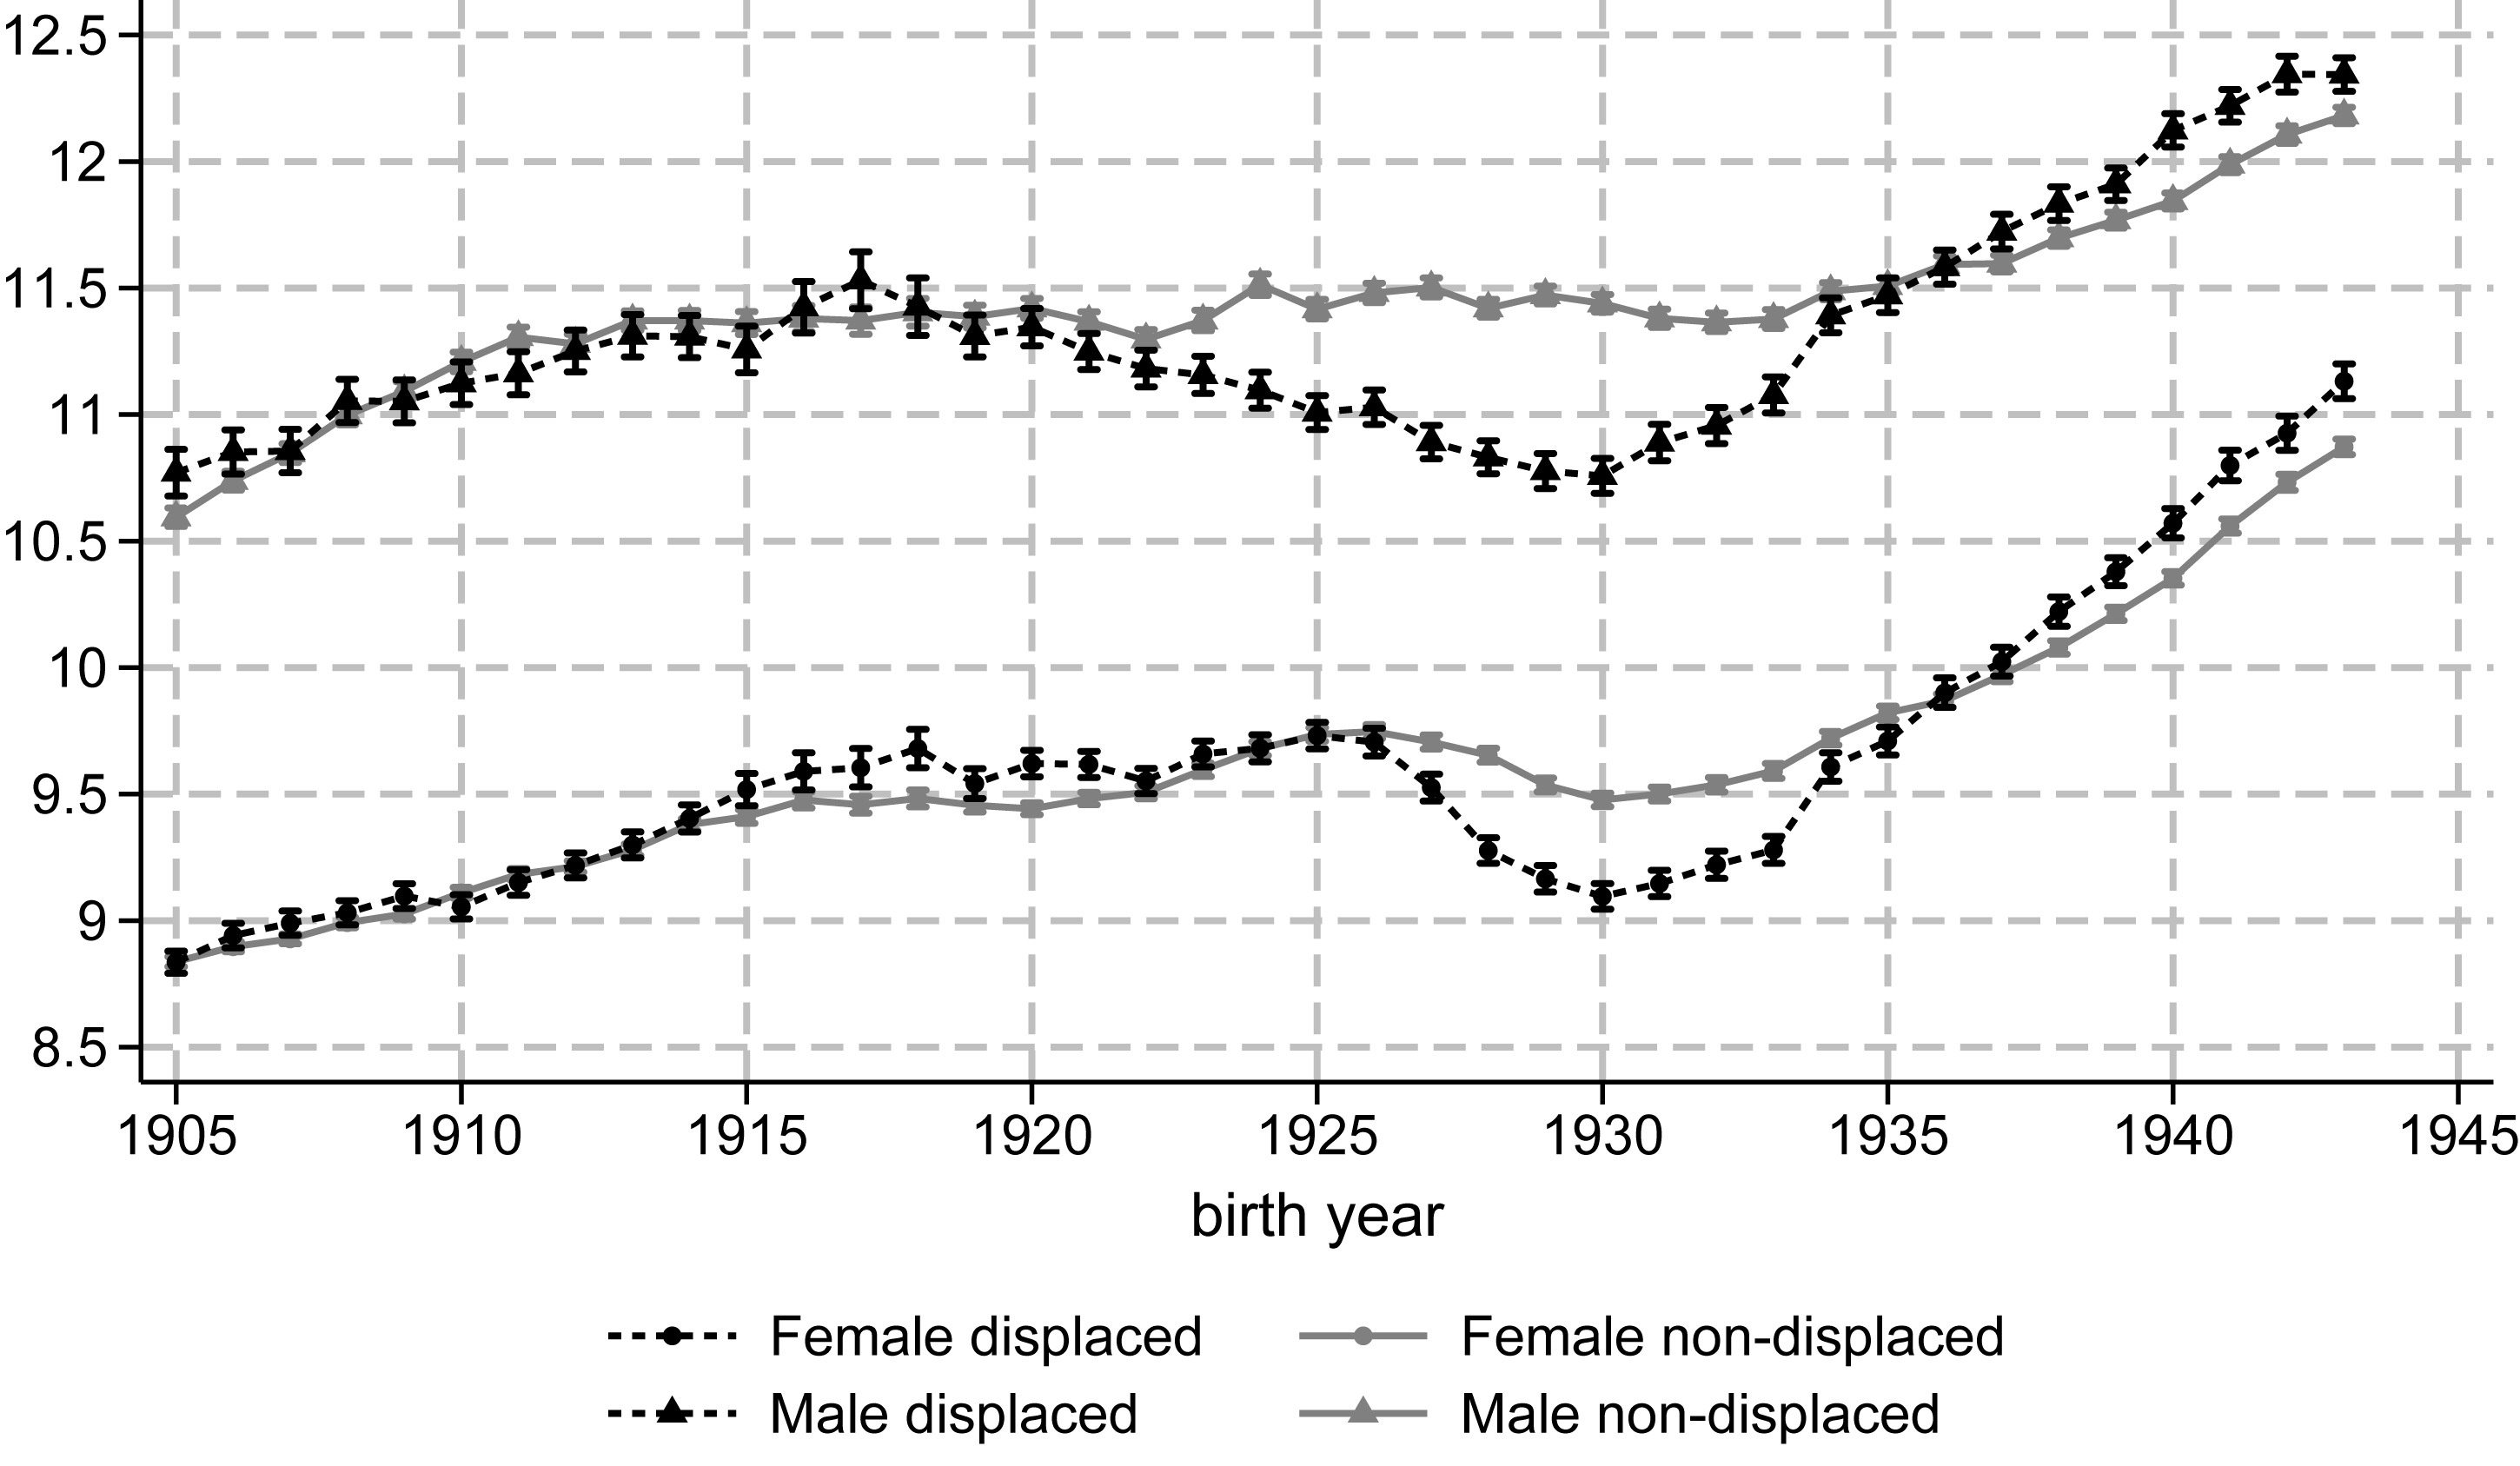
Figure 3 Long description
The line graph presents the impact of displacement on education across cohorts from 1905 to 1945. The x-axis represents birth years ranging from 1905 to 1945, while the y-axis represents years of education ranging from 8.5 to 12.5. The graph includes four data lines: Female displaced, Female non-displaced, Male displaced, and Male non-displaced. Female displaced and Female non-displaced lines show a general increase in education over time, with non-displaced females consistently having higher education levels. Male displaced and Male non-displaced lines also show an increase, with non-displaced males having higher education levels. The data points are marked with error bars indicating variability. All values are approximated.
Among men, we observe nearly identical trends in education for displaced and non-displaced persons born before 1920. Beginning with cohorts born in the early 1920s, the average educational attainment of the displaced declined, while it stagnated for the non-displaced. Displacement, therefore, slightly reduced the education of men who were in their early 20s at the time of expulsion. This educational penalty gradually increased in subsequent cohorts, reaching a maximum of about 0.7 years for men born around 1930. These cohorts suffered from the turmoil of flight and expulsion during the transition from school to vocational training.Footnote 30
The gap between displaced and non-displaced males shrinks for even younger cohorts and in fact turns positive for cohorts who entered school after displacement, in line with earlier results for the cohort born 1944–49 (Bauer, Braun, and Kvasnicka Reference Bauer, Braun and Kvasnicka2013). Such positive effects could result from the loss of land, which led the children of displaced persons to seek work outside of agriculture, thereby increasing the importance of educational investment (Bauer, Braun, and Kvasnicka Reference Bauer, Braun and Kvasnicka2013). Moreover, the experience of losing property might have encouraged displaced people to invest in “portable assets” such as education (Brenner and Kiefer Reference Brenner and Kiefer1981; Becker et al. Reference Becker, Mergele and Woessmann2020).
Similar patterns emerge for women: Displaced women born around 1930 suffered educational losses of about 0.4 years, while women displaced at a young age had higher educational attainment than their non-displaced counterparts. The gap between the displaced and the non-displaced opened later for women than men, around the 1926/27 cohort, perhaps because most women in earlier cohorts had completed their education when the war began (as they had, on average, lower education than men). Moreover, women’s educational careers were less directly interrupted by the war, while military service forced men to postpone further educational investments.
One drawback of the 1970 census data is that we cannot control for parental background. However, we observe similar patterns in the GHS in regressions that condition on parental education (see Appendix Table E7): the effect of displacement on educational attainment was moderately negative (positive) for males (females) born in 1919–21, strongly negative for both sexes in the 1929–31 cohort, and positive (but non-significant) for those born in 1939–41, who started their school careers after displacement. We also verify in the GHS that the educational gap between displaced and non-displaced in the 1929–31 cohort opens only with displacement (see Online Appendix Figure F7).
Beyond the displaced, Figure 3 also illustrates that the secular expansion of education was halted and reversed for cohorts born around 1930. These cohorts suffered from school closures and a lack of apprenticeships in the postwar years (Müller and Pollak Reference Müller, Pollak and Breen2004). Our results thus also testify to the cohort-wide educational costs of WWII, documented in Ichino and Winter-Ebmer (Reference Ichino and Winter-Ebmer2004).
Employment
Displacement had little impact on the retirement behavior of men who experienced WWII as young adults (see previous section), but how did it affect women or older cohorts? We use an individual’s last employment to define an indicator that takes the value of one for years in which an individual has left gainful employment (“employment exit”).
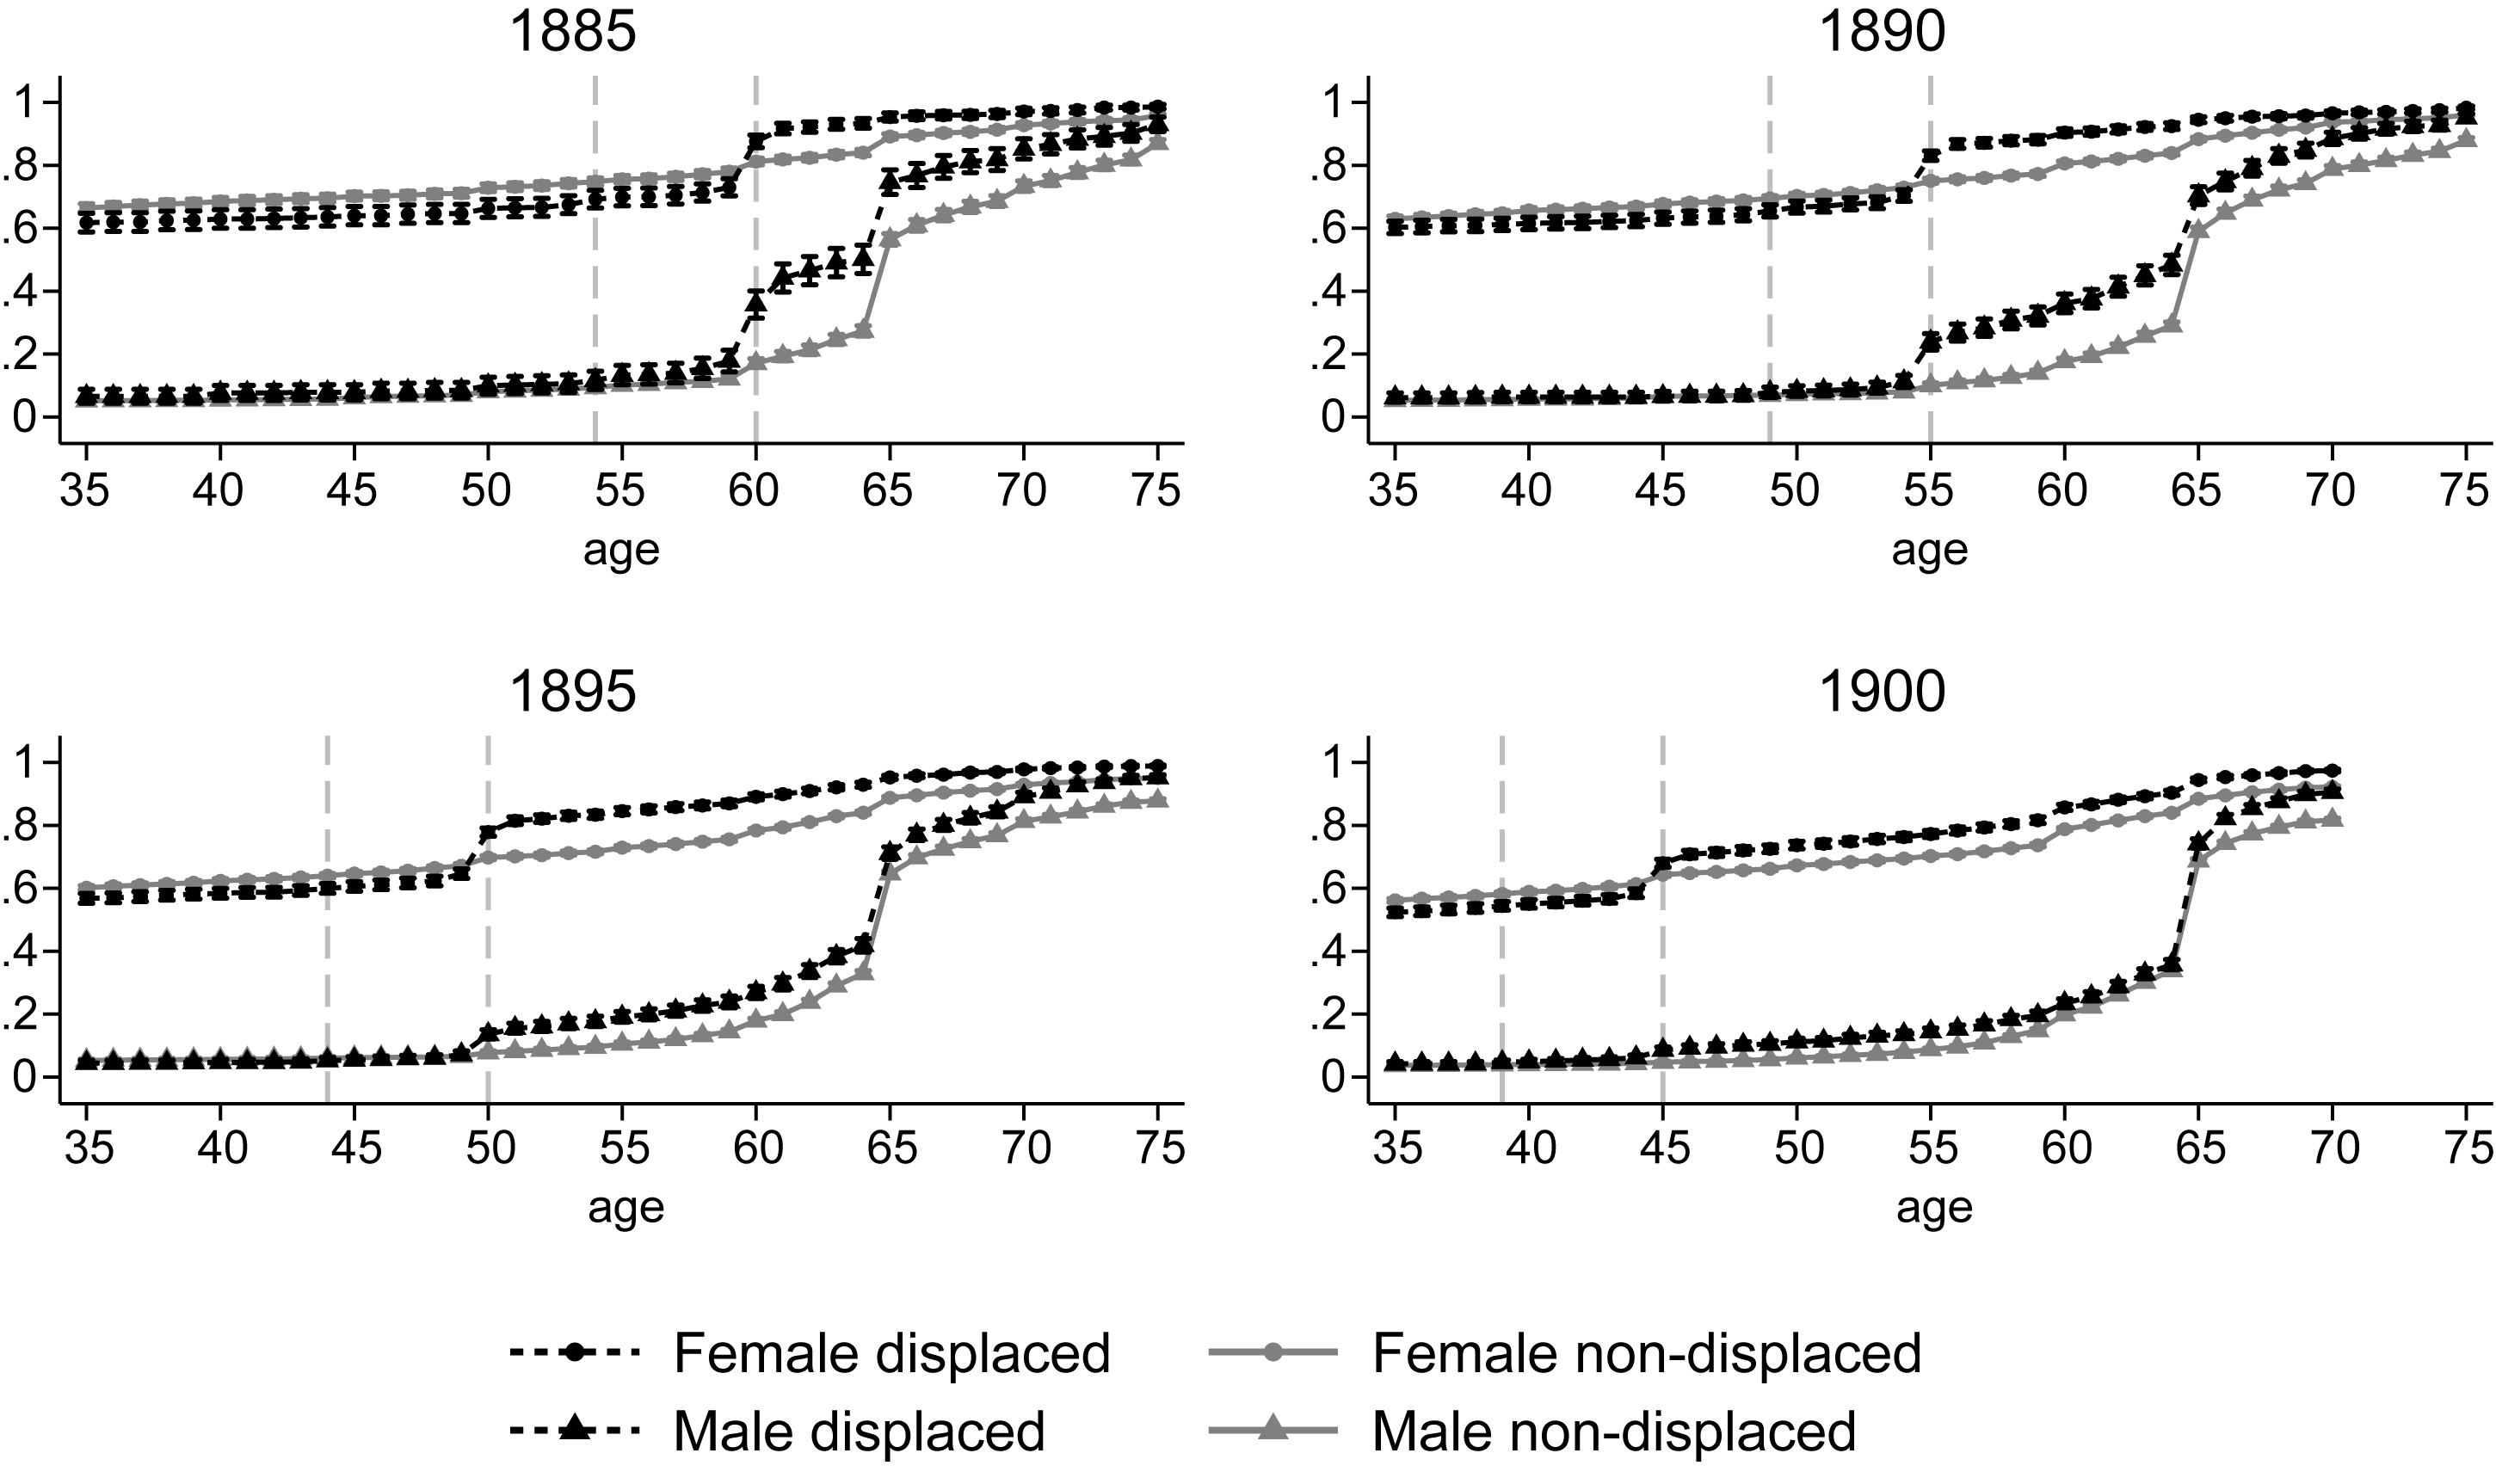
Figure 4 illustrates how the probability of exiting employment evolves over the life cycle, distinguishing between displaced and non-displaced persons. We consider four cohorts born in 1885, 1890, 1895, and 1900. For all four cohorts and both genders, employment exits of displaced persons spiked in 1945 when most displacements occurred (the second gray vertical line in the figures indicates the corresponding ages of 60, 55, 50, and 45). In contrast, there is no spike for the non-displaced, for whom the exit probability evolves smoothly around 1945.Footnote 31 The employment gap between the groups, therefore, widened sharply at displacement. Many expellees never returned to the labor market after losing their jobs during the displacement.
EMPLOYMENT EXIT PROBABILITY OVER THE LIFE CYCLE, BY COHORT
Notes: The figures depict, by cohort, the probability of having exited employment for displaced and non-displaced persons over the life cycle. Gray vertical lines indicate the beginning and end of WWII. Vertical bands indicate 95 percent confidence interval.
Source: 1970 Census (FDZ 2008).

Figure 4 Long description
The image contains four line graphs comparing the employment exit probability over the life cycle by cohort for displaced and non-displaced males and females. Each graph represents data from the years 1885, 1890, 1895, and 1900. The x-axis represents age, ranging from 35 to 75 years, while the y-axis represents the probability of exiting employment, ranging from 0 to 1. The graphs use different line styles and colors to distinguish between female displaced, female non-displaced, male displaced, and male non-displaced individuals. Gray vertical lines indicate the beginning and end of World War 2. Vertical bands indicate 95 percent confidence intervals. The data shows that the probability of exiting employment increases with age for all groups, with displaced individuals generally having a higher probability of exiting employment compared to non-displaced individuals. The trends and patterns vary slightly across the different cohorts.
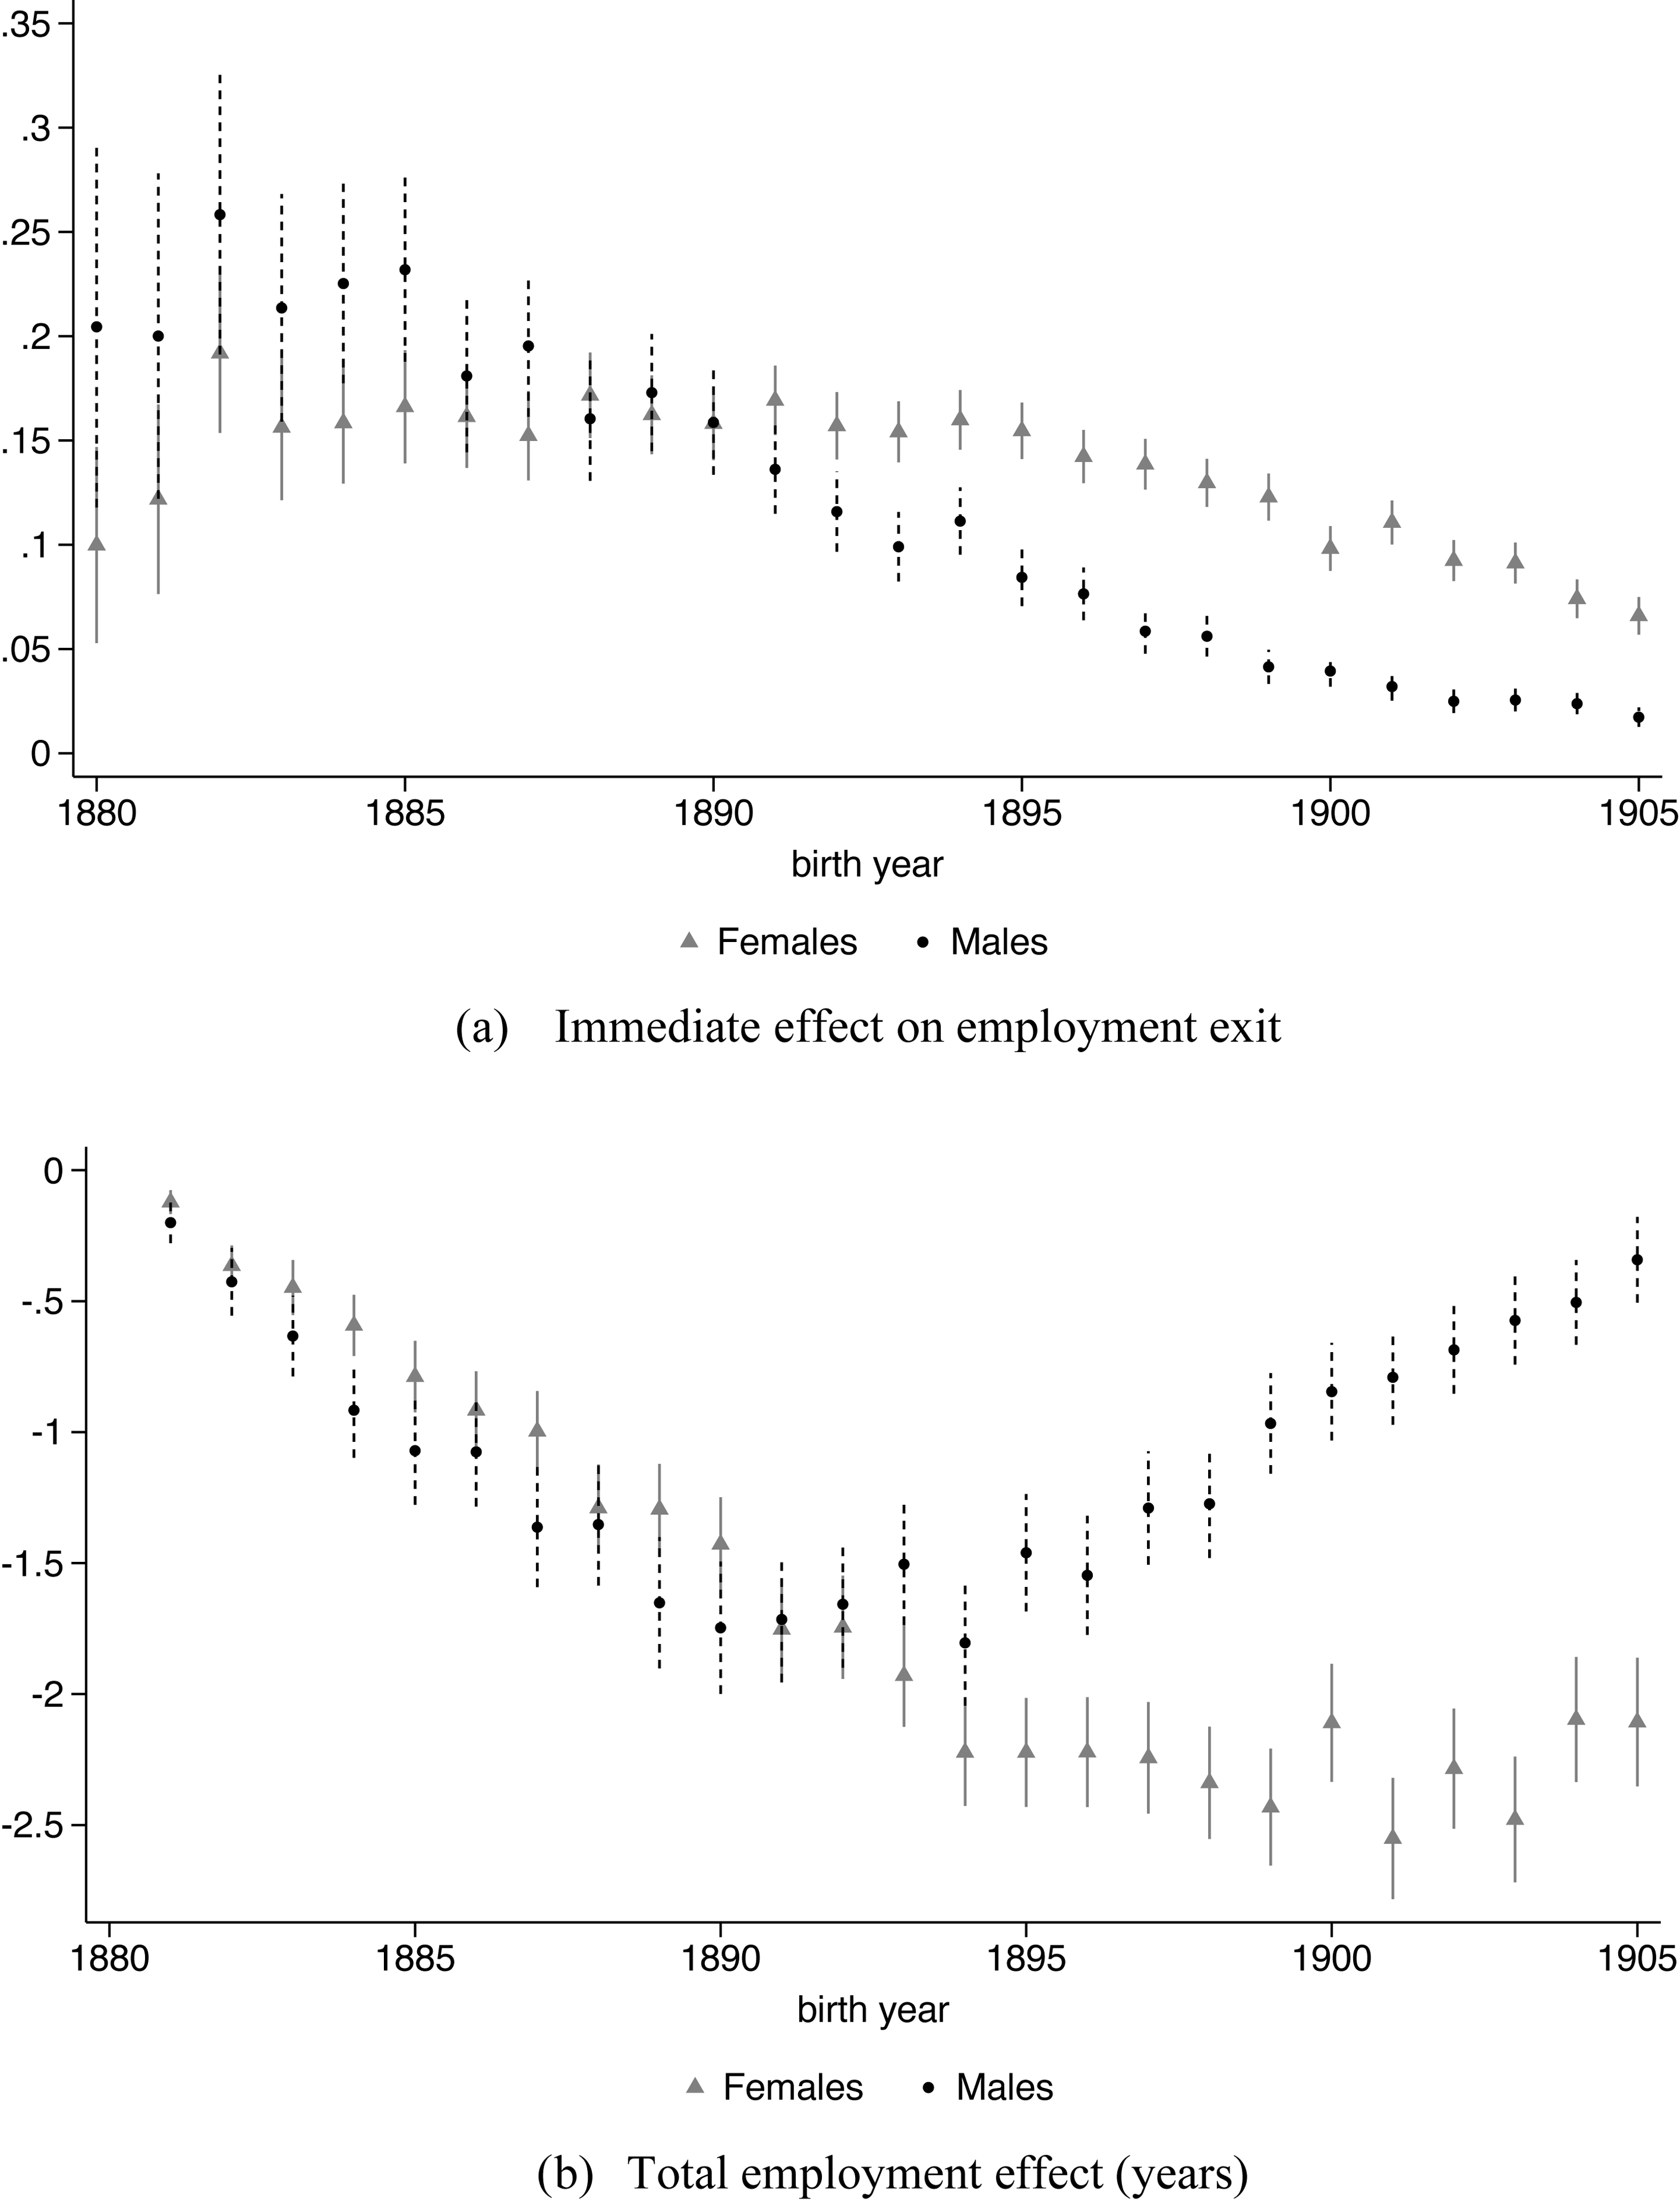
Importantly, this effect of displacement on employment varies greatly by birth cohort and gender. Panel (a) of Figure 5 illustrates this pattern in detail, reporting the immediate employment effect of displacement for each cohort born between 1880 and 1905. Estimates are from simple Difference-in-Differences (DiD) regressions, which measure the difference between displaced and non-displaced individuals in the change in the labor market exit probability between 1938 (pre-) and 1946 (post-treatment period). Specifically, we estimate, separately for each cohort, the following regression equation:
THE IMPACT OF DISPLACEMENT ON EMPLOYMENT, BY COHORT
Notes: The figure illustrates the impact of displacement on employment across cohorts. Panel (a) estimates the immediate effects of displacement on the probability to exit from employment for cohorts born between 1880 and 1905. Effect estimates are from DiD regressions, with 1938 as the pre-treatment and 1946 as the post-treatment period. Panel (b) estimates the overall impact of displacement on years of employment up to age 65. The effect estimates are from DiD regressions, again with 1938 as the pre-treatment period. The post-treatment period extends from 1946 to the year a cohort turns 65. Point estimates are indicated by a dot; vertical bands indicate 95 percent confidence intervals.
Source: 1970 Census (FDZ 2008).

Figure 5 Long description
Two line graphs depict the impact of displacement on employment by birth year for males and females. The first graph shows the immediate effect on employment exit, with the y-axis representing the probability of exiting employment and the x-axis representing birth years from 1880 to 1905. The second graph shows the total employment effect in years, with the y-axis representing years of employment up to age 65 and the x-axis representing birth years from 1880 to 1905. Both graphs use triangles to represent females and circles to represent males, with point estimates indicated by dots and vertical bands indicating 95 percent confidence intervals. The data is sourced from the 1970 Census.

where exit it indicates whether individual i has left the labor market by year t, displaced i is a dummy variable for (to be) displaced persons, and d t is an indicator for the post-displacement year 1946. The parameter of interest is δ.
For men born in 1885, displacement increased the probability of employment exit in 1946 by 23.2 pp (relative to a post-treatment control mean of 19.3 percent). The effect gradually declines for more recent cohorts who were displaced at a younger age, to less than 1.7 pp for men born in 1905. The immediate effects of displacement on employment are more stable with age for women. For older women born in 1885, displacement increased the probability of exiting the labor market by 16.6 pp in 1946. The effect size is substantial, given that only a third had not yet left the labor market by 1938. Thus, half of the women still “at risk” of exiting did so due to displacement. Displacement also had a much greater effect on younger women than on men: Among women born in 1905, 6.9 pp left employment permanently by 1946 as a result of displacement. Presumably, the displacement effect is larger for women than for men because the former were, on average, less attached to the labor market at the time.
While the immediate impact is smaller for younger cohorts, the young have a longer labor market career ahead of them. An earlier employment exit is, therefore, more consequential for them. Figure 5b depicts the total effect of displacement on years of employment up to age 65, the statutory retirement age. We quantify the total employment effect as the cumulative difference in employment from 1946 to the year a cohort turns 65.Footnote 32 For men, the total effect of displacement follows a hump shape: Older cohorts lost little time in employment because they were close to retirement anyway. The employment loss then gradually increases with birth year, peaking at about 1.5 years for men born in 1890–95. Younger male cohorts again lost very little employment time, as only a few exited employment after displacement. For women, on the other hand, the overall employment loss is largest for the relatively young cohorts born in 1895–1905. They lost more than two years of employment due to displacement.
In Online Appendix G, we show that the observed variation in the employment effect is consistent with simple theoretical arguments. A reduction in the wage rate due to displacement generates a negative substitution effect (as work is being less rewarded) and a positive income effect (as life-cycle earnings and consumption decrease). However, this income effect depends on the age at which an individual is being displaced. Individuals close to their expected retirement age experience only a minor income effect, as most of their life-cycle earnings have already been realized—their employment response is dominated by the substitution effect and is therefore negative. In contrast, younger individuals experience a more sizable income effect due to displacement, muting their response in employment.
CONCLUSION
The dramatic return of war and displacement to Europe following Russia’s attack on Ukraine has reignited interest in the labor market consequences of violent conflict. Our study examines the impact of battlefield injuries, war captivity, and displacement in the context of WWII, the most devastating conflict in history. We show that the economic consequences of these shocks often became visible long after the war. For example, the effect of war injuries on the employment of WWII veterans was most pronounced not in the immediate postwar period, but decades later, as these veterans approached retirement. Displacement also had very different effects depending on the age and gender of the displaced. The impact on education was worst for adolescents facing the critical transition from school to vocational training. On the other hand, the loss of employment was particularly severe for women and older male cohorts. Overall, our findings suggest that policies to alleviate the hardships of war should take into account that their consequences depend critically on age-at-exposure and vary greatly over the life cycle.
Our results align with standard life-cycle theory, suggesting relevance beyond WWII. However, the precise magnitudes of the effects are likely to vary with labor market conditions and institutional support. In postwar West Germany, strong economic growth and low unemployment may have facilitated the integration of war-disabled veterans, POWs, and displaced persons, and a supportive pension system may have influenced their retirement decisions. An open question for future research is whether life-cycle patterns similar to those in postwar Germany hold in contexts with less favorable postwar conditions and weaker institutional support.
Appendix: Pension Benefits and World War II
In what follows, we describe the provisions of the pension system as they were relevant to the 1919–21 birth cohort (see Online Appendix B for additional details). Statutory pensions in Germany depend on the labor income earned over the life course. The longer people work and the more they earn, the higher their pensions. Since the pension reform of 1957, the system has been organized as a pay-as-you-go scheme in which current contributions pay for current pension obligations.
Old-Age Pensions
Before 1992, the statutory retirement age for old-age pensions was 65. Thus, regular retirement was open to anyone at age 65 who had contributed to the pension system for at least five years. Those with at least 35 years of contributions could retire at age 63 under the flexible retirement option introduced in 1972. Retirement at age 60 was possible under certain conditions for women, the long-term unemployed, and the disabled (see Online Appendix B for details).
The introduction of flexible retirement in 1972 led to a significant decline in the average entry age for old-age pensions (Börsch-Supan and Schnabel Reference Börsch-Supan and Schnabel1998), especially for men. Their average age of first claiming an old-age pension fell from 65.1 years in 1972 to a low of 62.3 years in 1982 and thus well below the standard retirement age of 65. The distribution of retirement ages peaked at ages 60, 63 and 65 (Börsch-Supan and Schnabel Reference Börsch-Supan and Schnabel1998). These peaks correspond to the earliest ages at which early retirement for health and labor market reasons, flexible retirement for workers with long work histories, and regular retirement for workers with short work histories were possible.
Disability and Survivor Pensions
In addition to old-age pensions, the pension system provides disability benefits for workers of any age, subject to medical indication and a minimum insurance period of at least five years. Disability benefits came in two forms. General disability benefits (Erwerbsunfähigkeitrente) are for those unable to work regularly and made up 80 percent of approved claims in the late 1980s (Riphahn Reference Riphahn1999). Occupational disability benefits (Berufsunfähigkeitrente) are for those with less than half the work capacity of a healthy worker in the same job and are one-third lower than full old-age pensions.
Disability benefits have been an important route to retirement in Germany. Throughout the late 1970s and 1980s, the share of workers retiring on disability benefits was higher than the share retiring on regular old-age pensions (Börsch-Supan and Schnabel Reference Börsch-Supan and Schnabel1998; Riphahn Reference Riphahn1999). Those retiring on disability pensions in the 1980s were, on average, in their mid-50s. Consequently, the average age of all new retirees (including those retiring on old-age pensions) in Germany fell below 59 in the early 1980s.
The pension system also covers the financial loss caused by the death of a spouse. The survivor’s pension (Witwenrente) is intended to replace the support previously provided by the deceased.
Gaps in Employment Biographies
Importantly, the pension system smooths out gaps in the employment biography caused by compulsory state measures such as military service, war captivity, expulsion, and resettlement. These “substitute periods” (Ersatzzeiten) are fully considered when calculating the pension. In addition, “periods of absence” (Ausfallzeiten) are considered in the pension calculation. Periods of absence are times during which employment is interrupted for personal reasons, including unemployment, incapacity to work, pregnancy, and further education.


 Open access

