

An increase in cardiac output and a fall in systemic vascular resistance (SVR) occur following food consumption with changes usually observed within 2 h of eating(Reference Dagenais, Oriol and McGregor1–Reference Waaler, Eriksen and Janbu3). However, Sidery et al. (Reference Sidery, Macdonald and Blackshaw4) reported a sustained increase in superior mesenteric artery (SMA) blood flow over a 3 h period after a high-fat meal (HFM), contrary to SMA blood flow following a high-carbohydrate meal (HCM) which was close to fasting values at 3 h. Since the maximal plasma TAG concentration occurs 3–4 h following a HFM(Reference Sanders, de Grassi and Miller5, Reference Sanders, Oakley and Cooper6), the sustained increase in splanchnic blood flow might be influenced by postprandial lipaemia. The effects on cardiac output and vascular resistance during this period are uncertain.
Postprandial lipaemia has been shown to impair endothelial function(Reference Ong, Dean and Hayward7–Reference Berry, Tucker and Banerji9), possibly via an increase in free radical generation as indicated by a rise in plasma 8-isoprostane-F2α (8-iso-PGF2α) concentration(Reference Berry, Tucker and Banerji9). Increased free radical generation induced by postprandial lipaemia may reduce the bioavailability of NO produced by the vascular endothelium(Reference Tschudi, Mesaros and Luscher10). Thus, it is conceivable that a HFM may have adverse effects on vascular tone by inducing vasoconstriction. Kearney et al. (Reference Kearney, Chowienczyk and Brett11) investigated the effects of intravenous infusion of fat emulsion with heparin, and reported a decrease in forearm vascular resistance and an increase in mean arterial pressure (MAP). Such changes would imply an increase in cardiac output and/or vasoconstriction occurring in vascular beds other than the forearm leading to an increase in SVR(Reference Fugmann, Millgard and Sarabi12). However, the plasma lipid changes following fat infusion are different from the postprandial changes following a HFM, being characterised by large and sustained increases in NEFA concentrations with smaller increases in plasma TAG. To date, no studies have examined cardiovascular haemodynamics during the period of maximal postprandial lipaemia that follows consumption of a HFM.
Exaggerated cardiovascular responses to stressors such as those to dynamic exercise appear to be an independent predictor of future hypertension(Reference Palatini13, Reference Singh, Larson and Manolio14). An exaggerated blood pressure (BP) response to exercise may be a consequence of impaired endothelial function(Reference Stewart, Sung and Silber15) and vasodilation(Reference Palatini13, Reference Wilson, Sung and Pincomb16) and/or increased cardiac output. Brett et al. (Reference Brett, Jiang and Turner17) reported that endothelial function was impaired following an oral methionine load, and that this change was accompanied by an increase in diastolic BP during a cardiovascular exercise test. It was suggested that the increase in diastolic BP was likely to be a consequence of increased SVR caused by impaired endothelial function. It is uncertain whether the adverse effect of postprandial lipaemia, as that of methionine, on endothelial function could lead to an exaggerated cardiovascular reactivity to dynamic exercise.
Consequently, the present study set out to test the hypothesis that postprandial lipaemia has adverse effects on cardiac output and/or SVR at rest and during dynamic exercise. A low-fat, HCM that has been shown previously(Reference Ong, Dean and Hayward7) not to impair endothelial function served as a control.
Materials and methods
Participants and screening procedure
Men and premenopausal women, aged 19–39 years, were recruited from among the staff and students of King's College London, UK. Exclusion criteria were as follows: current smoker; BMI ≤ 18·0 or ≥ 30 kg/m2; BP ≥ 140/90 mmHg; serum cholesterol>7·8 mmol/l; serum TAG>3·0 mmol/l; diabetes mellitus (fasting plasma glucose>7 mmol/l); abnormal haematology or liver function tests; self-reported history of myocardial infarction, angina, venous thrombosis, stroke, cancer, and presence of gastrointestinal disorder; self-reported weekly alcohol intake of >28 (for men) or 21 (for women) standard units of alcohol (1 unit = 10 ml ethanol); systematic use of medication apart from contraceptive pill. The study protocol was reviewed and approved by the Research Ethics Committee of King's College London (REC number: 05/06-130). Participants were given a detailed outline of the study requirements, and all provided written informed consent.
Potential participants completed a health questionnaire, and height and weight were measured using a stadiometer and a digital beam balance, respectively. Percentage body fat was estimated using bioelectrical impedance (model: BC-418 MA; Tanita UK Limited, Middlesex, UK), and waist and hip circumferences were measured to the nearest 0·1 cm using a plastic tape measure. Seated BP was measured using a finger arterial BP monitor, the Finometer™ Model-1 (Finapres Medical Systems BV, Amsterdam ZO, The Netherlands), for 30 s epochs, and a fasting venous blood sample was obtained for the measurement of serum lipids and plasma glucose, full blood counts and liver function tests. In order to ensure that the participants were suitable to undertake the exercise test, VO2max, an index of cardiorespiratory fitness, was estimated using a standardised submaximal exercise test(Reference Astrand and Ryhming18, 19). Participants cycled for 6 min at a pedalling frequency of 50 rpm. The resistance applied was proportional to the fitness level, and the goal was to reach a heart rate (HR) value between 125 and 170 beats/min at the fifth and sixth min. HR was recorded using a Finometer™. Predicted VO2max was estimated from the Astrand–Ryhming nomogram(Reference Astrand and Ryhming18), and it was further multiplied with the appropriate age correction factor to account for the decrease in maximum HR with age(Reference Astrand20). Habitual dietary intake was assessed by a 3 d dietary record with food amounts coded in household measurements; these were recoded in grams (for each food separately) using food portions indicated by the Food Standards Agency(21). Nutrient intakes were estimated using Microdiet (version 2; Downlee Systems Limited, High Peak, Derbyshire, UK), which uses the UK national food composition database(22).
Experimental design
A single-blind, randomised, crossover study design was used to test the effects of a HFM and a low-fat HCM. Participants were allocated to one of the two treatment sequences in a random order, which were at least 1 week apart. On the day before the test meal, participants were asked to avoid alcohol and foods high in fat, avoid caffeine from midday and refrain from vigorous exercise, and they were provided with a standardised low-fat dinner ( ≤ 10 g fat). They were further asked to fast from 22.00 hours the previous night, but were allowed to drink water and were requested to avoid exercise the morning of the study.
Participants attended a metabolic research unit between 08.00 and 11.00 hours, and weight was measured and percentage body fat was estimated as described previously. Following 20 min of seated rest, measurements of BP and HR were recorded, cardiac output was measured in duplicate and a fasting venous blood sample was obtained. Participants consumed the test meal within 10 min. Further seated measurements of BP, HR and cardiac output were made 1, 2 and 3 h postprandially. A further venous blood sample was obtained at 3 h following the meal, followed by a 12 min multistage exercise stress test of moderate intensity on a programmable electrically braked cycle ergometer(Reference Brett, Jiang and Turner17). Workload was increased by 25 W in 3 min intervals, starting at 25 W. Pedalling frequency was kept constant at 60 rpm. During exercise, further measurements of BP, HR and cardiac output were made at 3, 6, 9 and 12 min. Immediately post-exercise, a further venous blood sample was collected, and the participants were allowed to recover seated and further measurements of BP, HR and cardiac output were made at 15, 30 and 45 min post-exercise. An outline of the study protocol is shown in Fig. 1.
Outline of the study protocol. BP, blood pressure; HR, heart rate; CO, cardiac output.

Formulation of the test meals
The meals were similar to those described previously(Reference Ong, Dean and Hayward7), consisting of a muffin and milkshake, and were of the same volume, energy and protein content. The fat in the HFM muffin was supplied by high-oleic sunflower oil (ADM-Pura, Erith, Kent, UK), and that in the HFM milkshake by single cream. The fat in the HCM was supplied solely by high-oleic sunflower oil. The fatty acid composition of the high-oleic sunflower oil was determined by GLC of the methyl esters, which were prepared by the action of 0·1 ml of 0·5 m-NaOCH3 in anhydrous methanol. The nutrient composition of the test meals was calculated from the UK national food composition database(22). Nutrient composition of the test meals is presented in Table 1.
Nutrient composition of test meals
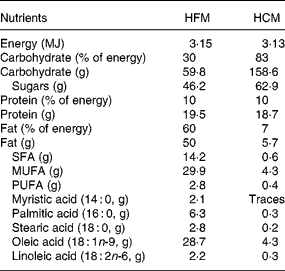
HFM, high-fat meal; HCM, high-carbohydrate meal.
Haemodynamic measurements
All measurements were performed with the subject relaxing in an upright seated position in a quiet and temperature-controlled (23°C) room. Cardiac output was measured non-invasively using an inert gas rebreathing device (InnoCor™, Innovision A/S, Odense, Denmark) based on an IR photoacoustic gas analyser. Systolic and diastolic BP, MAP and HR were measured using the Finometer™ Model-1, which is based on the volume-clamp method of Peňáz(Reference Peňáz23) and the Physiocal criteria of Wesseling et al. (Reference Wesseling, de Wit and van der Hoeven24). Finger arterial pressure waveform in the Finometer™ device is converted to a brachial waveform by filtering(Reference Gizdulich, Imholz and van den Meiracker25) and level correction(Reference Gizdulich, Prentza and Wesseling26). To correct for hydrostatic height of the hand with respect to heart level, a height correction system was used. An arm cuff return-to-flow calibration was conducted to adjust BP values on an individual basis(Reference Bos, van Goudoever and van Montfrans27). The finger cuff was applied on the index finger of the left hand, and the arm cuff was wrapped around the left arm. Values for BP, MAP and HR represent 30 s means for resting and post-exercise measurements and 5–15 s means during exercise, which were all recorded immediately before each cardiac output rebreathing manoeuvre to avoid overestimation due to forced rebreathing. Stroke volume (SV) was calculated from cardiac output divided by HR values. SVR was estimated from MAP divided by cardiac output.
All haemodynamic measurements were done by a single trained investigator (V. G. R.). Replicate measurements done by the investigator before the start of the present study indicated that the within-subject CV was < 10 % for the measurement of cardiac output, which was similar to that reported in the literature(Reference McEniery, Yasmin and Wallace28).
Blood sample collection, handling and analysis
Venous blood samples were collected into evacuated tubes with the minimal compression necessary to display the vein. Blood for analysis of 8-iso-PGF2α was collected into pre-chilled 4·5 ml tubes (cat. no. 369714; Becton Dickinson, Oxford, Oxfordshire, UK) containing 0·5 ml trisodium citrate (0·105 mol/l). Chilled fresh indomethacin was immediately added (final concentration 15 μmol/l), and the sample was kept on ice 30 min before centrifugation at 2400 g for 15 min. Plasma was separated and butylated hydroxytoluene was added (final concentration 20 μmol/l), and the samples were stored at − 80°C until analysis by GC/negative chemical ionisation mass spectrometry as described previously(Reference Hall, Sanders and Sanders29). Blood for plasma TAG and NEFA was collected into 6 ml EDTA-containing tubes (cat. no. 367863; Becton Dickinson), and was then centrifuged at 2400 g for 15 min at 2–4°C, and plasma samples were stored at − 40°C until analysis. These analytes were measured on an automated chemistry analyser (ILAB-650; Instrumentation Laboratory, Warrington, Cheshire, UK) using colorimetric assays (TAG: cat. no. 0018255640, Instrumentation Laboratory; NEFA C: cat. no. 999-75 406, Wako Chemicals GmbH, Neuss, Germany).
Statistical analysis
Sample size calculations were estimated using StatMate (GraphPad software, Inc., El Camino Real, CA, USA), and were based on thirty subjects completing the study; this sample size would give 80 % power to detect a 0·29 l/min change in CO at P < 0·05. Data were analysed using SPSS (version 15.0; SPSS, Inc., Chicago, IL, USA). Data were log-transformed for plasma TAG and 8-iso-PGF2a to render their distribution normal before statistical analysis. Postprandial differences in means or mean changes from fasting (0 h) and/or from pre-exercise (3 h) were analysed using two-way repeated-measures ANOVA, with meal treatment and time as the within-subject factors and sex as a between-subject factor. Postprandial resting, exercise and post-exercise haemodynamics data were analysed in separate ANOVA models. To account for day-to-day variability, resting measurements following the test meals were compared using the changes from fasting values. Exercise data were analysed separately, and for each haemodynamic variable, three ANOVA models were produced: of the absolute values (when fasting values did not significantly differ between test days), of the changes from pre-exercise and of the changes from fasting (0 h). Although from a physiological perspective, it seems correct to compare the exercise data of the changes from pre-exercise and not from fasting, by doing so the meal effect might be omitted. Thus, all the three different ways were implemented for exercise responses. Post-exercise values were compared using the changes from fasting and from pre-exercise values. The area under the curve was also used for comparisons where appropriate, and was calculated by the trapezoidal method using Prism (version 5; GraphPad software, Inc.). Where sex effect and sex interaction effects were non-significant, the sex factor was excluded from the final model. For all repeated-measures ANOVA, df for the univariate tests were corrected using Greenhouse–Geisser estimates of sphericity. Pairwise testing was conducted only if the overall ANOVA was statistically significant (P < 0·05), and was adjusted for multiple comparisons using Bonferroni's correction factor (multiple comparison test). For a significant time effect, Dunnett's multiple comparison test was applied using Prism to test for time changes from fasting for meals separately and indicated where appropriate.
Results
A total of sixty-five participants were screened for the study, thirty-one entered the study and thirty (fifteen men and fifteen women) completed the full study protocol, whose details are presented in Table 2.
(Mean values and standard deviations)

BP, blood pressure; 8-iso-PGF2α, 8-isoprostane-F2α.
Mean value was significantly different from that for the females: * P < 0·05, *** P < 0·001 (independent samples t test).
Postprandial changes in plasma TAG, NEFA and 8-isoprostane-F2α
Plasma TAG (Table 3) increased by 63·8 % 3 h following the HFM, and decreased by 10 % 3 h following the HCM (difference between meals, P < 0·001). In contrast, plasma NEFA (Table 3) remained unchanged 3 h following the HFM, but significantly decreased by 94·1 % 3 h following the HCM (difference between meals, P < 0·001). Fasting NEFA concentrations were higher in females (females: 0·46 (sd 0·09) mmol/l v. males: 0·27 (sd 0·11) mmol/l; P < 0·001), but decreased to values similar to those of males 3 h following the HCM (the decrease was greater in females than in males, P < 0·01, data are not illustrated). Exercise increased NEFA concentrations compared with pre-exercise levels after both meals (P < 0·01).
(Mean values and standard deviations with their 95 % confidence intervals of their changes)

M, males; F, females.
* Bonferroni's multiple comparison test.
† Geometric means.
‡ Repeated-measures ANOVA of the changes at 3 h and immediately post-exercise from fasting (0 h) for meal effect (P < 0·001).
§ Repeated-measures ANOVA of the changes at 3 h and immediately post-exercise from fasting (0 h) for meal × time effect (P < 0·05).
Fasting plasma 8-iso-PGF2α (Table 3) did not differ between meals, but it increased following the HFM and fell following the HCM (differences between meals, P < 0·001). Plasma 8-iso-PGF2α concentrations increased further post-exercise from pre-exercise by 8·7 % (P < 0·05) following the HFM, but not following the HCM. The mean differences between meals in the changes from fasting at 3 h and post-exercise were 16·4 % (95 % CI 6·8, 27·0) and 28·8 % (95 % CI 18·2, 40·4 %), respectively.
Postprandial haemodynamic results
Over all measurements, cardiac output and SV were greater in males than in females (P < 0·025 and 0·01, respectively), and SVR was lower (P < 0·05). Cardiovascular responses to the test meals did not differ between sexes (meal × sex and meal × time × sex effects, NS; data for sexes are not shown).
Resting haemodynamics
Resting cardiac output (Fig. 2) increased over the 3 h period to the same extent following both meals compared with the fasting value by a mean of 0·6 l/min (95 % CI 0·4, 0·8; P < 0·001) from a fasting value of 5·1 l/min (95 % CI 4·7, 5·5). The increase in cardiac output at rest was primarily due to an increase in SV; the mean increase from 73·4 ml (95 % CI 67·2, 79·7) fasting value was 8·4 ml (95 % CI 5·2, 11·5; P < 0·001, Fig. 3(a)). HR (Fig. 3(b)) increased by 2·5 beats/min (95 % CI 0·5, 4·4; P < 0·01) from a 70·1 beats/min (95 % CI 66·7, 73·6) fasting value during the first hour after the meals, while it remained elevated above fasting value for 1 h following the HFM and for 2 h after the HCM before returning to baseline values; the difference between meals for the change at 2 h was 3·2 beats/min (95 % CI 0·8, 5·5; meal × time effect, P < 0·05).
Cardiac output changes after a high-fat meal (●) and a high-carbohydrate meal (○) from fasting (0 h) over a 3 h rest (n 30; fifteen males and fifteen females), during exercise (n 28; fifteen males and thirteen females) and post-exercise (n 30; fifteen males and fifteen females). Values are means with their standard errors represented by vertical bars. At rest, exercise and post-exercise: repeated-measures ANOVA of the mean changes for resting, exercise and post-exercise values. Meal and meal × time effects, NS.

Stroke volume (a) and heart rate (b) changes after a high-fat meal (HFM, ●) and a high-carbohydrate meal (HCM, ○) from fasting (0 h) over a 3 h rest (n 30; fifteen males and fifteen females), during exercise (n 27; fourteen males and thirteen females) and post-exercise (n 30; fifteen males and fifteen females). Values are means with their standard errors represented by vertical bars. At rest: repeated-measures ANOVA of the mean changes for resting values. Meal and meal × time effects, NS (a); meal × time effect, P = 0·037; * HFM v. HCM, P < 0·05; Bonferroni's multiple comparison test (b). During exercise and post-exercise: repeated-measures ANOVA of the mean changes for exercise and post-exercise values. Meal and meal × time effects, NS for both variables.

Systolic BP increased and diastolic BP fell postprandially to the same extent between meals; the mean increase from 116·5 (sd 7·3) mmHg fasting value was 3·7 mmHg (95 % CI 1·9, 5·4; P < 0·001), and the mean decrease from 70·8 (sd 4·1) mmHg fasting value was 1·7 mmHg (95 % CI − 3·0, − 0·5; P = 0·01), respectively. Thus, MAP did not change postprandially from fasting values after any of the test meals. SVR fell following both meals in the resting state by an average of 1·9 Wood units (95 % CI − 2·5, − 1·3; P < 0·001, where 1 Wood unit = 80 dyne.s.cm− s), with no significant meal differences.
Exercise haemodynamics
During exercise, cardiac output (Fig. 2) increased and then fell during recovery with no significant meal differences. The increase in cardiac output during exercise in the females was mainly a consequence of an increase in HR, whereas in the males, there was a smaller increase in HR but a greater contribution from SV compared with the females; the average differences between sexes in exercise SV and HR were 17·7 beats/min (95 % CI 9·8, 25·6; P < 0·001) and 8·0 ml (95 % CI − 0·8, 16·9; P = 0·073), respectively (data shown only for the whole group, Fig. 3). Systolic BP (Fig. 4(a)) increased similarly following both meals from pre-exercise values, whereas the increase in diastolic BP (Fig. 4(b)), which indicates peripheral resistance, was smaller following the HFM than following the HCM, with the difference being 2·1 mmHg (95 % CI 0·1, 4·1; meal effect, P = 0·043). There was a smaller rise in MAP (Fig. 4(c)) during exercise from pre-exercise values following the HFM than following the HCM; the difference was 3·2 mmHg (95 % CI 0·7, 5·7; meal effect, P = 0·013). A comparison of the area under the curve of the changes in exercise SVR (Fig. 4(d)) from pre-exercise values between meals found that the fall following the HFM was significantly greater by 14·5 % than that after the HCM ( − 28·3, − 0·6; P = 0·042). No other statistical significance between meals was noted.
Changes in systolic blood pressure (BP, a), diastolic BP (b), mean arterial pressure (MAP, c) and systemic vascular resistance (SVR, d) during exercise (n 26, fourteen males and twelve females) and post-exercise (n 29; fifteen males and fourteen females) from pre-exercise (3 h) values after a high-fat meal (●) and a high-carbohydrate meal (○). Values are means with their standard errors represented by vertical bars. During exercise: repeated-measures ANOVA of the mean changes from 3 h for exercise values. Meal and meal × time effects, NS (a); meal effect, P = 0·043 and meal × time effect, NS (b); meal effect, P = 0·013 and meal × time effect, NS (c); meal effect, P = 0·052 and meal × time effect, NS. A comparison of the area under the curve (AUC) of the mean changes from 3 h between meals, P = 0·042 (d). Post-exercise: repeated-measures ANOVA of the mean changes from 3 h for post-exercise values. Meal and meal × time effects, NS for all variables.

Post-exercise haemodynamics
Post-exercise, all haemodynamic variables returned towards or close to pre-exercise or fasting values, with no differences in the responses between test meals (Figs. 2–4). Post-exercise, the fall in SV was steeper in the men (P = 0·011), whereas in the women, there was a greater fall in HR (P < 0·001).
Discussion
The present study aimed to investigate whether postprandial lipaemia influences cardiac output at rest and during exercise. In order to control for non-specific meal effects, the test meals had the same energy, protein content and volume. Plasma TAG increased 3 h following the HFM, and plasma NEFA decreased 3 h following the HCM, with females showing higher fasting NEFA levels and a greater fall in NEFA compared with males. The sex differences that we showed for fasting and postprandial NEFA were consistent with previous data on normoglycaemic males and females aged 40–69 years before and after being provided with a 75 g glucose load(Reference McKeigue, Laws and Chen30). Differences in the size and lipolytic rate of subcutaneous and omental fat in the fasting and postprandial states(Reference Tchernof, Belanger and Morisset31, Reference Richelsen, Pedersen and Moller-Pedersen32) and in their amounts and proportions in males and females(Reference Enzi, Gasparo and Biondetti33–Reference Despres, Couillard and Gagnon35) reported in the literature may account for these observed sex differences in the present study. A relationship between oestrogen and insulin sensitivity might also partially explain the postprandial sex differences.
In a previous report using similar test meals, the HFM impaired endothelial function when compared with the low-fat HCM(Reference Ong, Dean and Hayward7). Berry et al. (Reference Berry, Tucker and Banerji9) showed that a HFM similar to the one used in the present study and which impairs endothelial function increased plasma 8-iso-PGF2α concentration, though without making comparisons to a low-fat HCM. In the present study, the effects of the HFM and HCM on plasma 8-iso-PGF2α concentration were opposing, with a rise following the HFM and a fall following the HCM.
Although prolonged or intense acute aerobic exercise is already known for its pro-oxidant effects(Reference Vollaard, Shearman and Cooper36–Reference Sacheck, Milbury and Cannon38), the effects of short bouts of exercise on oxidative stress as indicated by appropriate markers such as 8-iso-PGF2α have not been extensively investigated, and studies to date are inconclusive(Reference Waring, Convery and Mishra39, Reference Wiswedel, Hirsch and Kropf40). In the present study, we demonstrated an 8·7 % exercise-induced increase in plasma 8-iso-PGF2α concentration from pre-exercise following the HFM. It is questionable whether this increase was solely due to exercise as it coincided with the increase in plasma TAG and as exercise following the HCM did not affect 8-iso-PGF2α concentrations. Exercise-induced oxidative stress might serve distinct physiological functions such as in redox regulation of vascular tone, substrate metabolism and muscle contractility, rather than exerting predominantly harmful effects(Reference Vollaard, Shearman and Cooper36).
Previous studies have investigated the haemodynamic responses of a HFM over a shorter period of time(Reference Hoost, Kelbaek and Rasmusen2, Reference Kearney, Cowley and Stubbs41, Reference Sidery, Macdonald and Cowley42). Hoost et al. (Reference Hoost, Kelbaek and Rasmusen2) showed that cardiac output, SV and HR increased (by 35–40, 18–22 and 11–16 %, respectively) from fasting values to the same extent following a HFM and a HCM over 2 h of rest in eight healthy young male adults. The rise in SV was mediated via left ventricle dilation, and was the main determinant of the increase in cardiac output, with no changes reported in MAP following the meals. Consistent with these previous findings are the results of the present study which undertook measurements over a 3 h postprandial period. A possible explanation for the longer lasting increase in HR following the HCM than following the HFM could be a greater sympathetic nerve activity in response to carbohydrate ingestion(Reference Heseltine, Potter and Hartley43).
In the present study, the increase in MAP was lower during exercise following the HFM than following the HCM as a consequence of a lower DBP. As the increase in exercise cardiac output did not differ between meals, a greater decrease in exercise SVR following the HFM accounts for the lower exercise MAP compared with the HCM. This finding implies that the HFM promoted exercise-induced vasodilation, which would refute the hypothesis that postprandial lipaemia impairs vascular tone and exaggerates BP during exercise. Sidery et al. (Reference Sidery, Macdonald and Blackshaw4) observed a sustained increase in resting SMA blood flow following a HFM, with SMA blood flow being still greater than fasting values at 3 h postprandially. In contrast, 3 h after ingestion of a HCM, SMA blood flow returned close to fasting values. Since the increase in SMA blood flow is preserved during exercise(Reference Eriksen and Waaler44), the greater fall in SVR following fat intake reported in the present study could be a result of a greater splanchnic hyperaemia compared with carbohydrate. Conversely, Jakulj et al. (Reference Jakulj, Zernicke and Bacon45) showed enhanced BP and SVR responses to four stressors (cold pressor, arm ischaemia and psychological stressors) following a HFM (42 g fat) than following a HCM (1·3 g fat) at 2 h postprandially in thirty healthy young adults. However, the two meals they used did not match for protein content, which restricts interpretation of the results(Reference Dickson, Maneshi and Imbeault46), while the stressors used were only associated with small changes in central haemodynamics. Recent evidence(Reference Green, Bilsborough and Naylor47) suggests that forearm handgrip exercise should not be used as a substitute for the effects of dynamic exercise on the vasculature. Dynamic exercise is associated with major changes in central haemodynamics, such as increased HR, SV, cardiac output and systolic BP and decreased SVR, as it influences both the metabolism of the active muscle and the haemodynamics of active and inactive tissue vasculature. In contrast, handgrip exercise induces vasodilation of the forearm vasculature possibly due to local metabolism, but it is associated with small changes in central haemodynamics(Reference Green, Bilsborough and Naylor47).
It might be questioned why postprandial lipaemia did not affect resting responses. One explanation lies in potential differences in limb and SMA blood flows between fat and carbohydrate. A previous study showed that SMA blood flow is sustained 3 h following fat intake but not following carbohydrate intake(Reference Sidery, Macdonald and Blackshaw4). Carbohydrate appears to cause an increase in limb blood flow over 3 h due to insulin's action(Reference Hoost, Kelbaek and Rasmusen2, Reference Kearney, Cowley and Stubbs41, Reference Sidery, Macdonald and Cowley42), possibly explaining why resting SVR responses did not differ between fat and carbohydrate compared to exercise responses. During exercise, vasodilation in the exercising skeletal muscle vasculature is independent of insulin; thus, a sustained increase in splanchnic blood flow following fat intake might have caused a greater decrease in exercise SVR compared with carbohydrate intake.
Data from the present study showed that despite the reported increase in oxidative stress following fat intake and fall following carbohydrate intake, the increase in BP during exercise was smaller 3 h after fat intake due to a greater systemic vasodilation. It has been shown previously that the augmented blood flow in contracting skeletal muscle remains unaffected when a single vasodilator such as NO is inhibited, which is possibly the consequence of compensatory responses of other vasodilators(Reference Boushel, Langberg and Gemmer48–Reference Hillig, Krustrup and Fleming50). Hence, a possible reduction in the bioavailability of NO by free radicals(Reference Tschudi, Mesaros and Luscher10) does not appear to exaggerate BP responses to exercise, possibly due to a compensatory increase of other vasodilators.
Limitations
The present study was conducted in healthy non-obese young adults. The lack of control on the phase of the menstrual cycle and hence oestrogen as a moderating factor is a limitation of the present research. Furthermore, three out of fifteen women were using oral contraceptives, but as a crossover design was used, this is unlikely to have influenced the results. With increasing age and obesity, insulin sensitivity decreases, and this may result in different patterns of metabolic and haemodynamic responses. Further research is needed on patients who are at increased risk for CVD.
Conclusion
In healthy participants, postprandial lipaemia induced by a HFM did not affect cardiac output and/or SVR at rest, but it resulted in a lower increase in exercise MAP compared with a low-fat HCM.
Acknowledgements
The present study was supported by the State Scholarships Foundation (I.K.Y.), Greece. V. G. R. contributed to the design of the study, conducted the study (including recruitment, cardiovascular measurements, phlebotomy and laboratory analysis), statistically analysed and interpreted the data, and drafted the manuscript; P. J. C. contributed to the design of the study and the protocol for the haemodynamic measurements; T. A. B. S. conceived the hypothesis and contributed to the design of the study. All authors contributed to the final manuscript, and read and approved the final version of the manuscript. The authors declared that they have no conflict of interest.


