


1. Introduction
1.1. The importance of verbal backchannels in conversational development
Effective communication is a complex, dynamic process requiring sophisticated coordination and shared attention between interlocutors (Bodur et al., Reference Bodur, Nikolaus, Prévot and Fourtassi2023; Goswami et al., Reference Goswami, Manuja and Leekha2020). It underpins human interaction and cognition (Blomsma et al., Reference Blomsma, Vaitonyté, Skantze and Swerts2024) and involves skills such as turn-taking, understanding negotiation, and maintaining coherent exchanges (Clark, Reference Clark1996; Fusaroli et al., Reference Fusaroli, Rączaszek-Leonardi and Tylén2014; Pickering & Garrod, Reference Pickering and Garrod2021). Conversations are collaborative efforts rather than simple information transfers, with both parties actively facilitating successful communication (Clark, Reference Clark1996). Within this collaborative framework, listeners employ conversational strategies such as verbal backchanneling, including responses like “yeah” or “uhhuh” (Bangerter & Clark, Reference Bangerter and Clark2003; Levinson & Torreira, Reference Levinson and Torreira2015). These cues indicate understanding, attention, or agreement without taking the conversational floor (Bodur et al., Reference Bodur, Nikolaus, Fourtassi and Prévot2022; Lawley et al., Reference Lawley, Heeman and Bedrick2023). They are essential for maintaining conversational flow and monitoring common ground (McCarthy, Reference McCarthy2003; Peterson et al., Reference Peterson, Jesso and McCabe1999), allowing listeners to express engagement and comprehension (Liu, Reference Liu2022; Schegloff, Reference Schegloff and Tannen1982).
1.2. Verbal backchannel types and opportunity points
Backchannels can be classified based on form and function into verbal expressions (i.e., short expressions like “uhm,” “yeah,” etc.), non-verbal (non-vocal) expressions (i.e., head movement, laughing, etc.), and non-verbal (display) expressions (i.e., volume and voice tempo, speed movement, etc.; Ike & Mulder, Reference Ike and Mulder2015). For a more nuanced analysis of verbal backchannels, Oreström (Reference Oreström1983) and Tottie (Reference Tottie, Aijmer and Altenberg1991) distinguish between simple verbal backchannels (monosyllabic or disyllabic utterances like “yeah” or “mmm”), double verbal backchannels (repetitions like “yeah yeah”), and complex verbal backchannels (multi-word phrases such as “yeah, I know”) (see Figure 1).
Illustration of the classification of verbal backchannels into three distinct categories: simple, double, and complex verbal backchannels.

Backchannel opportunity points (BOPs) are key moments in conversations where listeners can provide feedback (Gratch et al., Reference Gratch, Okhmatovskaia, Lamothe, Marsella, Morales, Van Der Werf and Morency2006), also known as jump-in points (Morency et al., Reference Morency, de Kok, Gratch, Prendinger, Lester and Ishizuka2008) or response opportunities (de Kok, Reference de Kok2013). Not all backchannel opportunity points result in backchannels (Kawahara et al., Reference Kawahara, Yamaguchi, Inoue, Takanashi and Ward2016; Poppe et al., Reference Poppe, Truong, Heylen, Vilhjálmsson, Kopp, Marsella and Thórisson2011), suggesting variability in how individuals respond to these opportunities.
Recent experimental work has significantly advanced our understanding of feedback timing and perception in conversation. Boudin et al. (Reference Boudin, Rauzy, Bertrand, Ochs and Blache2024b) demonstrated that feedback remains acceptable within a wider temporal window than previously assumed – up to 1.5 seconds before and 2 seconds after optimal timing – although perceived engagement decreases after a one-second delay. Their research on conversational dynamics and listener attention further reveals how distracted listening affects feedback production and narrative quality (Boudin et al., Reference Boudin, Rauzy, Bertrand, Ochs and Blache2024a). Additionally, Pellet-Rostaing et al. (Reference Pellet-Rostaing, Bertrand, Boudin, Rauzy and Blache2023) have developed multimodal approaches to model engagement in conversation, highlighting the importance of both verbal and non-verbal feedback in maintaining interactive flow. These studies provide valuable frameworks for investigating the optimal timing and quality of backchannel responses, particularly relevant when examining populations with potential processing limitations such as late-talking children.
1.3. Verbal backchannel development in typical and atypical developing children
An important step in children’s socio-cognitive development is learning how to engage as active listeners in conversations, with backchannel signalling serving as a crucial listener feedback mechanism (Bodur et al., Reference Bodur, Nikolaus, Fourtassi and Prévot2022; Reference Bodur, Nikolaus, Prévot and Fourtassi2023). The development of verbal backchannel behaviour evolves with age, with studies showing different patterns of emergence. Miyata and Nisisawa (Reference Miyata and Nisisawa2007) found that utterance-internal backchannels emerged later than utterance-final ones in a boy aged 1.5–3.1 years. Hess and Johnston (Reference Hess and Johnston1988) observed increased backchannel responses in children aged 7.5–11.9 years, showing gradual refinement. More recent research by Bodur et al. (Reference Bodur, Nikolaus, Fourtassi and Prévot2022) in semi-structured conversations found that children produced backchannels at rates similar to adults, challenging previous assumptions about developmental trajectories. Furthermore, Tolins et al. (Reference Tolins, Namiranian, Akhtar and Fox Tree2017) demonstrated that 4-year-old TD children leverage addressee backchannels and conversational grounding to support vicarious word learning, highlighting their pragmatic sensitivity to collaborative dialogue structures. Effective backchanneling is essential for healthy conversational skills, and deficits can hinder learning, relationship-building, and peer collaboration (Hale & Tager-Flusberg, Reference Hale and Tager-Flusberg2005; Levinson, Reference Levinson2016). Children with difficulties in backchanneling may experience miscommunication, problems with turn-taking, and poorly timed responses that disrupt conversation or signal unwanted floor-taking (Lawley et al., Reference Lawley, Heeman and Bedrick2023). These findings suggest that backchannels play a critical role in early pragmatic development, facilitating both conversational engagement and language acquisition in TD children.
While the developmental trajectory described above characterises typically developing children, a substantial proportion of toddlers exhibit delayed expressive language emergence, raising questions about their long-term conversational competence. Late talkers are toddlers who, by 24 months, produce fewer than 50 words or fail to combine two words and often score below the 10th percentile in expressive vocabulary assessments (Ellis Weismer et al., Reference Ellis Weismer, Venker, Evans and Moyle2013; Moyle et al., Reference Moyle, Ellis Weismer, Evans and Lindstrom2007; Rescorla, Reference Rescorla2002, Reference Rescorla2009), comprising about 10–19% of children at this age (Neumann et al., Reference Neumann, Kauschke, Fox-Boyer, Lüke, Sallat and Kiese-Himm2024; Zubrick et al., Reference Zubrick, Taylor, Rice and Slegers2007). Importantly, late talker status reflects the lower end of the normal range for expressive language skills rather than a clinical diagnosis, and is often defined using tools like the MacArthur-Bates CDI (Fenson et al., Reference Fenson, Dale, Reznick, Bates, Thal, Pethick, Tomasello, Mervis and Stiles1994).
This population shows significant heterogeneity in developmental outcomes: approximately one-third resolve naturally by age three, one-third develop into developmental language disorder (DLD) with persistent comprehension or expression difficulties, and one-third exhibit subclinical deficits (Desmarais et al., Reference Desmarais, Sylvestre, Meyer, Bairati and Rouleau2008; Kühn & Suchodoletz, Reference Kühn and Suchodoletz2009; Reilly et al., Reference Reilly, Wake, Ukoumunne, Bavin, Prior, Cini, Conway, Eadie and Bretherton2010; Rescorla, Reference Rescorla1989; Rudolph & Leonard, Reference Rudolph and Leonard2016). According to the CATALISE consortium (Bishop et al., Reference Bishop, Snowling, Thompson and Greenhalgh2017), DLD is defined as persistent language difficulties that significantly affect everyday functioning and are not better explained by biomedical conditions such as hearing loss, intellectual disability, or neurological damage. Thus, although some children with a history of late talking later receive a DLD diagnosis, the majority in outcome studies – including the present sample – exhibit language profiles that have largely normalised on standardised measures by school age yet continue to reveal subtle pragmatic and processing vulnerabilities in more detailed or naturalistic assessments (Paul, Reference Paul, Bishop and Leonard2014; Rescorla, Reference Rescorla2009; Rescorla et al., Reference Rescorla, Dahlsgaard and Roberts2000). Risk factors for persistent difficulties include failure to combine words by 24 months (increasing DLD risk 2.5-fold), male gender, family history, and lower socioeconomic status (Chilosi et al., Reference Chilosi, Pfanner, Pecini, Salvadorini, Casalini, Brizzolara and Cipriani2019; Zambrana et al., Reference Zambrana, Pons, Eadie and Ystrom2014).
Even in cases often described as “resolved,” subtle vulnerabilities persist across development. Children with a history of late talking often demonstrate reduced vocabulary diversity, syntactic complexity, narrative skills, and pragmatic flexibility into school age and adolescence (Paul, Reference Paul, Bishop and Leonard2014; Rescorla, Reference Rescorla2009; Rescorla et al., Reference Rescorla, Dahlsgaard and Roberts2000, Reference Rescorla, Ratner, Jusczyk and Jusczyk2005). For instance, children with a history of late talking at age five often score about one standard deviation below typically developing peers on grammar and narrative tasks, with effects extending to reading comprehension and verbal memory by age 11 (Chen et al., Reference Chen, Chen and Zhou2019; Lyytinen et al., Reference Lyytinen, Eklund and Lyytinen2005). This pattern – wherein standardised test scores may normalise while detailed analyses reveal ongoing difficulties, especially in complex contexts – indicates a lingering, if subclinical, language vulnerability rather than full normalisation. Such findings highlight the importance of examining not only structural language abilities but also pragmatic competence in naturalistic interactions.
Language acquisition involves a complex interplay between structural language development and pragmatic competence – the ability to use language appropriately in social contexts (Airenti, Reference Airenti and Cummings2017; Matthews, Reference Matthews2014). For late-talking children, challenges in pragmatic development may compound their linguistic difficulties, potentially affecting their ability to engage in the collaborative process of conversation through appropriate feedback mechanisms (Bishop & Leonard, Reference Bishop and Leonard2014; Rescorla & Goossens, Reference Rescorla and Goossens1992). Relatedly, Capone Singleton and Saks (Reference Capone Singleton and Saks2024) demonstrated that preschoolers’ word learning depth improves when supported by shape-related gestures, highlighting the role of multimodal cues in enriching lexical and semantic representations, which may be particularly relevant for children with delayed language development. Recent evidence also suggests that late talkers can acquire structured word-learning strategies such as the shape bias, yet struggle to apply them spontaneously to novel labels, indicating limitations in the generalisation of linguistic strategies (Zuniga-Montanez & Krott, Reference Zuniga-Montanez and Krott2025).
Beyond core language deficits, late-talking children often face significant conversational difficulties, including reliance on non-verbal responses (e.g., nods, gestures), elliptical expressions, self-repetitions, and imitations to maintain dialogue (Bishop et al., Reference Bishop, Chan, Adams, Hartley and Weir2000; Flynn & Masur, Reference Flynn and Masur2007; Paul & Shiffer, Reference Paul and Shiffer1991; Rescorla & Fechnay, Reference Rescorla and Fechnay1996; Rescorla et al., Reference Rescorla, Bascome, Lampard and Feeny2001; Schaeffer, Reference Schaeffer, Levy and Schaeffer2003). They exhibit challenges in topic initiation, maintenance, turn-timing, and contingency, leading to mismatches in communicative intent and “parallel conversations” (Conti-Ramsden, Reference Conti-Ramsden1990; Paavola, Reference Paavola2006). This pattern aligns with Rice (Reference Rice, Kaiser and Gray1993)’s “negative social spiral” theory, where limited conversational skills restrict social opportunities, further impairing development. These pragmatic issues may persist even as structural skills improve, highlighting the Interactionist perspective’s emphasis on the interdependence of domains (Hoff, Reference Hoff2006; Tomasello, Reference Tomasello2003).
To better understand the conversational challenges faced by children with late-talking histories, researchers have turned to studies of children with DLD, who often exhibit more pronounced and persistent pragmatic difficulties. Research suggests that children with DLD often show concurrent delays in pragmatic abilities, including conversational turn-taking, topic maintenance, and response contingency (Bishop & Leonard, Reference Bishop and Leonard2014; Bonifacio et al., Reference Bonifacio, Girolametto, Bulligan, Callegari, Vignola and Zocconi2007). Similarly, Lloyd-Esenkaya et al. (Reference Lloyd-Esenkaya, Russell and Clair2020) reviewed peer interaction skills in children with DLD aged 4–11 years, identifying difficulties in turn-taking and discourse maintenance, which are closely related to backchannel behaviour. These pragmatic challenges may persist even as structural language skills improve, highlighting the complex relationship between different domains of language development that is central to the Interactionist perspective (Hoff, Reference Hoff2006). van Balkom et al. (Reference van Balkom, Verhoeven and van Weerdenburg2010) found that 2 to 3-year-old children with DLD used more backchannels than typically developing peers. However, it is also important to note that the study suggests that this high incidence of backchannels might be linked to the overall linguistic difficulties faced by children with DLD, leading them to rely more on non-verbal and simplified conversational strategies. We propose that this pattern shifts significantly as children age and conversational demands increase. By school age, late talkers may face greater cognitive processing demands during conversation, potentially resulting in reduced backchannel production compared to typically developing peers. As conversations become more complex, requiring integration of multiple linguistic and pragmatic skills, late talkers may need to allocate more cognitive resources to basic language comprehension and production, leaving fewer resources available for monitoring and responding to backchannel opportunities. This pattern aligns with findings by Macroy-Higgins and Montemarano (Reference Macroy-Higgins and Montemarano2016), who demonstrated that late talkers allocate less attention to referents during word-learning tasks, which in turn impairs their lexical acquisition. This developmental shift would reflect the increasing strain on processing resources as language expectations grow more sophisticated with age, and could manifest as both reduced frequency and diversity in backchannel behaviours, particularly during more demanding segments of conversation. This pattern would highlight the ongoing challenges late talkers face in balancing the multiple demands of conversational participation despite apparent improvements in standardised language measures.
The conversational difficulties observed in children with late-talking histories may be rooted in fundamental limitations in language processing capacity. Research demonstrates that language processing ability deficits may be a key reason for the long-term language disorders in children with a history of late talking. These children experience significant difficulties in discriminating, learning, and remembering word pronunciations (Becker & Deen, Reference Becker and Deen2020; Klee et al., Reference Klee, Pearce and Carson2000). Compared to typically developing children, their lexical representations in the brain are less accurate, often requiring more phonological information to recognise words (Alt & Plante, Reference Alt and Plante2006; Mainela-Arnold et al., Reference Mainela-Arnold, Evans and Coady2008). In terms of memory capacity, children with late-talking histories and those with DLD exhibit markedly smaller phonological memory capacity, typically requiring at least twice as much practice to achieve learning outcomes comparable to those of typically developing children (Becker & Deen, Reference Becker and Deen2020; Ellis Weismer & Hesketh, Reference Ellis Weismer and Hesketh1998). Additionally, these children perform poorly on tasks involving the repetition of unfamiliar words (Coady & Evans, Reference Coady and Evans2008), and when encountering unfamiliar words phonologically similar to known words, they struggle to utilise existing lexical knowledge to aid in memory and repetition (Coady et al., Reference Coady, Evans and Kluender2010; Wing et al., Reference Wing, Kohnert, Pham, Cordero, Ebert, Pui Fong and Blaiser2007). These processing constraints may directly impact real-time conversational abilities, including the capacity to produce timely and appropriate backchannels while simultaneously tracking discourse content.
Previous research has demonstrated that conversation dynamics evolve significantly over the course of an interaction. Examining conversational behaviours such as backchannels across different temporal phases provides valuable insights into how these behaviours develop and adapt throughout the exchange (Oertel et al., Reference Oertel, Wlodarczak, Edlund, Wagner and Gustafson2012; Tolins & Fox Tree, Reference Tolins and Fox Tree2014). The initial phase of conversation typically involves establishing rapport and common ground, while the middle phase often features deeper topic engagement, and the final phase frequently includes topic resolution and preparation for conversation closure (Clark, Reference Clark1996; Schegloff & Sacks, Reference Schegloff and Sacks1973). For late talkers, who may struggle with processing demands, these temporal stages may reveal distinctive patterns in backchannel production and reception. Therefore, this study divides each dialogue into three equal temporal segments (one-third, two-thirds, and three-thirds) to examine how backchannel behaviour might vary across these conversational stages.
1.4. Interactionist theory and its implications for conversational development
Interactionist accounts of language development underscore the fundamentally social nature of children’s communicative growth, positioning linguistic competence as emerging through sustained participation in structured interaction rather than as an isolated cognitive achievement (Bruner, Reference Bruner1985; Tomasello, Reference Tomasello2003). Within this framework, language learning is conceived as a bidirectional enterprise in which children and adults jointly construct the conditions for communicative advancement. Adult scaffolding plays a central role in this process: caregivers are thought to fine-tune the complexity, timing, and contingency of their input to align with children’s developing capacities, thereby facilitating the gradual internalisation of linguistic and pragmatic conventions (Wood et al., Reference Wood, Bruner and Ross1976).
A key implication of this perspective is that the development of structural and pragmatic skills is deeply interdependent. Vocabulary and syntactic growth are intertwined with children’s emerging ability to coordinate attention, interpret interlocutors’ intentions, and contribute appropriately to the ongoing discourse (Clark, Reference Clark2016; Hoff, Reference Hoff2006). Backchannel responses – brief acknowledgements that signal continued engagement – represent a particularly informative interactional behaviour in this respect. Their successful use requires real-time integration of linguistic processing, monitoring of turn-taking cues, and sensitivity to the prosodic or semantic affordances that invite listener feedback (Clark & Brennan, Reference Clark, Brennan, Resnick, Levine and Teasley1991; Garvey, Reference Garvey1984).
From an interactionist standpoint, children who experience early delays in language development may encounter challenges in acquiring these coordinated skills, given the increased processing demands they face and the potentially reduced opportunities for richly scaffolded interaction. Moreover, conversational behaviour is not static: interactionist models emphasise that the distribution of processing effort varies across different phases of a conversation as topics are introduced, elaborated, and eventually closed (Snow, Reference Snow2013). This dynamic view provides a theoretically grounded rationale for examining not only the quantity of children’s backchannel responses, but also their form, diversity, and sensitivity to opportunity points across distinct stages of interaction.
1.5. The present study
Previous research on late-talking children has primarily concentrated on broader language skills like vocabulary and grammar (Bruinsma et al., Reference Bruinsma, Wijnen and Gerrits2023; Liu et al., Reference Liu, Ning, Villiers, Lee, Rolfhus, Hutchings, Jiang and Zhang2023; Lu et al., Reference Lu, Che, Yang and Tsao2024), with less emphasis on nuanced aspects of conversational engagement, such as backchannel responses. This emphasises the need for a dedicated investigation into the long-term conversational skills of children with a history of late talking, particularly regarding their pragmatic abilities in naturalistic interactions. Whilst some studies with typically developing adults have identified individual differences in backchannel production – such as varied choices of backchannel forms based on personal tendencies and social backgrounds (Kawahara et al., Reference Kawahara, Yamaguchi, Inoue, Takanashi and Ward2016), or differences in timing preferences and frequency of responses across conversational contexts (Poppe et al., Reference Poppe, Truong, Heylen, Vilhjálmsson, Kopp, Marsella and Thórisson2011) – few have quantified these responses relative to opportunity points. Such quantification is rarely explored in research on children with a history of late talking, yet it is critical for understanding their conversational engagement.
This study examines whether differences in verbal backchannel behaviour persist in 5-year-old English-speaking children with a history of late talking (LT childrenFootnote 1) during child–adult interactions. They still score lower on structural language measures, raising concerns about whether subtle skills like backchannel use reflect ongoing processing challenges. The study addresses three key research questions:
-
1. How do LT children aged 5 years differ from typically developing peers in verbal backchannel quantity (normalised as backchannels per minute of adult speech) and distribution across conversation stages?
-
2. What variations exist in backchannel types (simple, double, complex) and diversity between LT children aged 5 years and typically developing peers across conversation stages?
-
3. How do LT children aged 5 years respond to backchannel opportunity points compared to typically developing peers regarding overlapped backchannels and missed opportunities?
Guided by interactionist theory, we advance the following hypotheses:
For the first research question regarding verbal backchannel quantity and temporal distribution, it is hypothesised that 5-year-old LT children will produce significantly fewer verbal backchannels per minute of adult speech compared to their TD peers, with the group difference being more pronounced in the two-thirds and three-thirds conversational stages. This prediction is grounded in Interactionist Theory’s emphasis on cumulative cognitive load during topic development and closure phases (Clark, Reference Clark1996; Tomasello, Reference Tomasello2003), where LT children may have fewer resources for active engagement due to persistent processing challenges (Leonard, Reference Leonard2017). Consistent with van Balkom et al. (Reference van Balkom, Verhoeven and van Weerdenburg2010), who observed developmental shifts in backchannel use among language-impaired children, LT children are expected to show relative preservation of backchannel production in the early (one-third) stage (where conversational demands are lower) but marked deficits in later stages where cognitive load peaks.
For the second research question focusing on backchannel types and diversity, it is hypothesised that LT children will demonstrate less diversity in verbal backchannel types (simple, double, and complex) and lower diversity compared to TD children, particularly in the final conversational stage, reflecting a reliance on simpler, less flexible forms. This hypothesis is supported by the Interactionist Theory’s emphasis on social scaffolding (Wood et al., Reference Wood, Bruner and Ross1976), as TD children’s frequent engagement in reciprocal interactions (Bangerter & Clark, Reference Bangerter and Clark2003) fosters adaptive pragmatic flexibility to calibrate feedback to conversational contexts (Tolins et al., Reference Tolins, Namiranian, Akhtar and Fox Tree2017). In contrast, LT children may have experienced limited scaffolding opportunities for pragmatic variation in early interactions (Girolametto et al., Reference Girolametto, Bonifacio, Visini, Weitzman, Zocconi and Pearce2002; Hoff, Reference Hoff2006), leading to a restricted repertoire. Empirical support comes from studies showing reduced pragmatic flexibility in children with DLD (Bishop et al., Reference Bishop, Snowling, Thompson and Greenhalgh2017; Lloyd-Esenkaya et al., Reference Lloyd-Esenkaya, Russell and Clair2020), which corresponds to the findings of TD children’s greater variability, especially towards conversation closure.
For the third research question concerning responses to backchannel opportunity points, it is hypothesised that LT children will respond to fewer genuine backchannel opportunity points than TD peers, characterised by fewer overlapped backchannels and more missed opportunities, with the most prominent deficits observed in the middle conversational stage. This prediction is rooted in the Interactionist framework’s focus on joint attention and turn-coordination skills (Clark & Brennan, Reference Clark, Brennan, Resnick, Levine and Teasley1991; Tomasello, Reference Tomasello2003), which are critical for detecting and acting on subtle conversational cues (Boudin et al., Reference Boudin, Rauzy, Bertrand, Ochs and Blache2024b). LT children’s reduced phonological memory capacity (Coady & Evans, Reference Coady and Evans2008) and slower speech processing (Montgomery, Reference Montgomery2000) are expected to hinder their ability to respond within the socially acceptable temporal window for backchannels, particularly during the middle stage, where topic engagement demands sustained attention and inferencing. Prior research on children with DLD (Bishop & Leonard, Reference Bishop and Leonard2014) has documented persistent turn-taking difficulties, further supporting the expectation that LT children will struggle to capitalise on backchannel opportunities despite intact perception of conversational cues.
2. Method
2.1. Spontaneous corpus collection
The study used conversational data from the Clinical English Ellis Weismer Corpus (Ellis Weismer et al., Reference Ellis Weismer, Venker, Evans and Moyle2013; Heilmann et al., Reference Heilmann, Weismer, Evans and Hollar2005; Moyle et al., Reference Moyle, Ellis Weismer, Evans and Lindstrom2007), stored in the CHILDES database. The data originate from a longitudinal study conducted between 1983 and 1991, and digitised for CHILDES in 1994. Despite the early collection date, the corpus remained highly relevant for studying backchannel behaviour in child–adult interactions: it includes detailed participant demographics (age and gender), audio in 16-bit WAV format at 44.1 kHz suitable for modern acoustic analysis, and naturalistic child–adult interactions with high ecological validity.
The full corpus comprises 56 late talkers and 56 typically developing (TD) children, collected annually at ages 2;6, 3;6, 4;6, and 5;6.Footnote 2 Late talkers were identified as scoring below the 10th percentile on the MacArthur-Bates CDI at 24 months, while TD children scored at or above the 20th percentile (excluding 10–20th percentile; Moyle et al., Reference Moyle, Ellis Weismer, Evans and Lindstrom2007). Groups were matched on age, non-verbal cognition, and socioeconomic status (SES). All participants were from monolingual English families and screened as normal in other developmental areas via Denver II (Frankenburg et al., Reference Frankenburg, Dodds and Archer1992), hearing (Biologic OAE screener, 2000–5000 Hz, at least one ear normal), and oral-motor skills (Robbins & Klee, Reference Robbins and Klee1987). Racial background was predominantly white (93%), with African American (2%), Asian (1%), and mixed (4%). Annual hearing screenings were conducted (otoacoustic emissions at 2;6 and 3;6; pure-tone audiometry at 4;6 and 5;6). The initial sample comprised 112 toddlers (56 LT + 56 TD) with matched baseline characteristics; due to the longitudinal nature of data collection spanning ages 2–5;6, common attrition in developmental research (e.g., family relocation, schedule conflicts) led to a final retained sample of 73 children (36 LT + 37 TD) at 5;6, with the original group-matching preserved.
This study selected naturalistic child–adult conversations from 36 LT and 37 TD children at 5;6 years, totalling 73 recordings (one per child) lasting 14 hours 28 minutes (mean 11.90 minutes per session). The adult investigator followed preset interaction principles to avoid dominating or intervening. Audio was recorded with separate microphones (stereo: left channel child, right adult) and converted to mono WAV via Praat (Boersma & Weenink, Reference Boersma and Weenink2024) for analysis.
The selection of 5;6-year-old samples with advanced conversational skills and ability to engage in complex interactions was deliberate for three reasons: (1) This age aligns with Piaget’s preoperational stage end (2–7 years), where children have preliminary conversational abilities but limited cognitive resources, ideal for capturing “form recovery but functional weakness” in LT children; (2) Topics (e.g., “a day at school”) were age-appropriate and naturalistic, eliciting authentic language; (3) Only the 5;6 data provided 73 natural child–adult conversations; earlier ages included structured interviews unsuitable for natural backchannel analysis. This criterion did not bias towards “strong” LT, as the corpus represents typical LT heterogeneity (e.g., 92.5% achieved form recovery on standardised tests but showed pragmatic gaps). LT language forms largely recovered to typical ranges, but group differences persisted, particularly in expressive skills. Recovery was defined as ≥ 25th percentile (standard score ≥ 85) on TOLD-3:P (Test of Language Development-Third Edition: Primary) subtests/composites (Newcomer & Hammill, Reference Newcomer and Hammill1997), emphasising standardised thresholds rather than perfect TD matching. Despite a mean speaking quotient of 103 (normal range), LT showed variability, with 7.5% persistent delays. Pragmatic weaknesses manifested in natural conversations as reduced flexibility, for example, reliance on repetitions over topic extensions, lower initiative (10–15% less speaking proportion), and higher pragmatic errors (e.g., ignoring listener cues).
For detailed demographics and language assessments, see Table 1 (based on Ellis Weismer et al., Reference Ellis Weismer, Venker, Evans and Moyle2013; Moyle et al., Reference Moyle, Ellis Weismer, Evans and Lindstrom2007). LT boys comprised 68% (girls 32%), consistent with LT gender ratios (3:1–19:1 boys:girls). SES was matched via the mother’s education years (within 2 years; Chapman et al., Reference Chapman, Schwartz and Kay-Raining Bird1991). Non-verbal cognition was matched via BSID (Bayley Scales of Infant Development; Bayley, Reference Bayley1993) and Leiter-R (Leiter International Performance Scale-Revised; Roid & Miller, Reference Roid and Miller1996).
Demographic and language assessment characteristics of children with a history of late talking (LT) and typically developing (TD) peers at 5;6 years

a Socioeconomic status matched via mother’s education.
b MLU = Mean length of utterance.
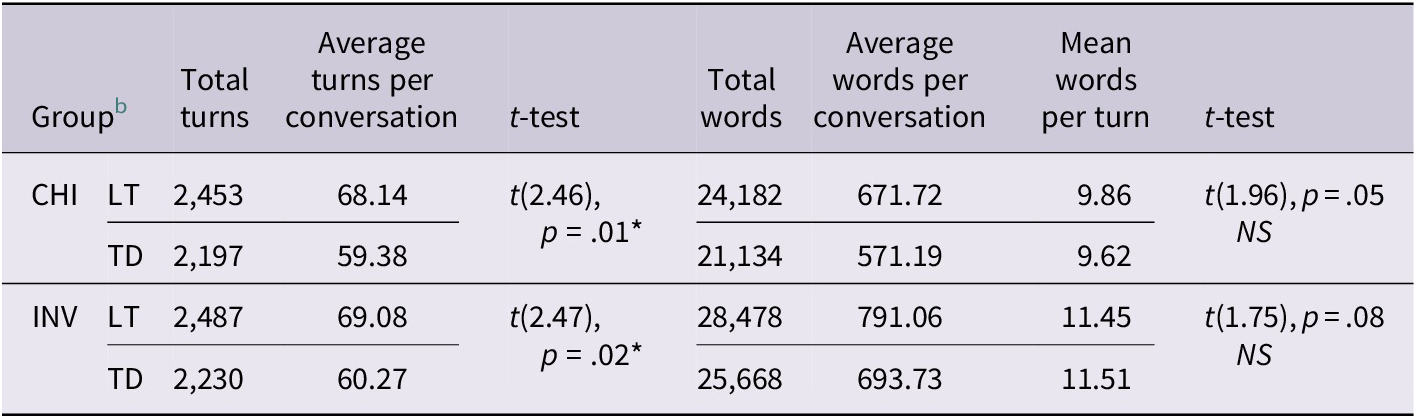
To address potential differences in conversational dynamics between groups, we conducted analyses of turn-taking patterns and word counts for both children and adult investigators across all recorded conversations (Table 2). Statistical analyses showed that LT children and adult investigators produced significantly more turns per conversation when compared to the typically developing group (p < .05 for both comparisons). However, mean words per turn remained consistent across groups for both children (LT: 9.86; TD: 9.62) and adults (LT: 11.45; TD: 11.51). These findings suggest backchannel opportunities were not artificially inflated by altered speech patterns when interacting with LT children, but rather reflect more frequent exchanges within comparable conversational contexts.
Turn counts and word counts for children and adult investigators in late-talking (LT) and typically developing (TD) groups a

a The significant threshold is represented by the number of symbols (“***” p < .001, “**” p < .01, “*” p < .05, “NS” p > = .05).
b CHI = children; INV = adult investigator.
2.2. Verbal backchannel identification
Verbal backchannels were identified through a multi-step process adapted from previous studies (Lawley et al., Reference Lawley, Heeman and Bedrick2023; Wehrle, Reference Wehrle2023). A predefined list of common verbal backchannel expressions (e.g., “mmhmm,” “yes,” “ok,” “uhhuh,” “right,” “yeah,” “yep”) was first created based on Lawley’s transcription team for typical conversational expressions. To ensure accurate identification, additional criteria were applied following Wehrle (Reference Wehrle2023) and the ACKNOWLEDGEMENT move in Carletta et al. (Reference Carletta, Isard, Isard, Kowtko, Doherty-Sneddon and Anderson1997): (1) Responses to polar or tag questions (e.g., “Yes” to “Do you understand?”) were excluded as they served a different function; (2) Turn-initial backchannels before substantial utterances (e.g., “Okay. I think we should…”) were omitted. Only utterances not part of larger inter-pausal units (defined as pause-free units of speech from a single speaker separated from one another by at least 50 ms for English, following common practice in conversation analysis; see Levitan & Hirschberg, Reference Levitan and Hirschberg2011) and not explicitly cued were classified as strict verbal backchannels.
The audio recordings were processed in Praat (Boersma & Weenink, Reference Boersma and Weenink2024) and manually segmented into distinct intervals for verbal backchannels produced by the children. All durations of identified verbal backchannel tokens were extracted using a Praat script.Footnote 3 Three independent annotators, trained on a subset of the data, labelled the backchannels, with inter-rater reliability assessed using Cohen’s kappa (0.75 and 0.82), and Fleiss’ kappa used for overall agreement (0.78). A total of 636 backchannels were annotated: 232 from LT children and 404 from TD peers, covering 12 distinct forms (i.e., “okay,” “yep,” “yes,” “yeah,” “uhhuh,” “mmhmm,” “yeah yeah,” “uhhuh uhhuh,” “oh yeah,” “mmhmm yeah,” “yeah I know,” “yeah oh yeah”).
2.3. Backchannel opportunity point judgment
We identified backchannel opportunity points using a modified parasocial consensus sampling approach (Heldner et al., Reference Heldner, Hjalmarsson and Edlund2013; Huang et al., Reference Huang, Morency and Gratch2010), following the methodological framework established by Blomsma et al. (Reference Blomsma, Vaitonyté, Skantze and Swerts2024). This method involves multiple third-party observers (n = 10) detecting suitable moments for backchanneling during conversation, with the number of judges selected based on established reliability standards in conversational analysis research (de Kok, Reference de Kok2013). The process had two steps: multiple judges identified potential backchannel points, and we aggregated their responses to determine the genuine opportunities.
In the identification step, we recruited 10 adult English-speaking judges to identify backchannel opportunity points by listening to all 73 audio recordings. Judges, who were unaware of group affiliation and presented with audio in random order, identified backchannel points by vocalising (e.g., “yes,” “uhhuh”) based on verbal cues, and their responses were recorded separately. The 10 adult judges listened to both the adult and child audio simultaneously from the complete conversation recordings. This approach was selected to allow judges to identify backchannel opportunity points within the natural flow of conversation, providing a more ecologically valid assessment of when backchanneling would be appropriate in authentic dialogues.Footnote 4 We processed their recordings using Audacity (Audacity Team, 2021), applying a noise gate filter and 20 dB amplification to remove background noise and ensure audibility. Then, we used a Praat scriptFootnote 5 to automatically detect backchannel opportunity point boundaries, which were then manually adjusted using spectrogram analysis and saved as TextGrid files. We also extracted the duration, start, and end times (in seconds) of each opportunity point using the same script.3
In the aggregation step, we combined data from all 10 judges for each recording to determine the percentage of judges who identified each moment as a potential backchannel opportunity point. This aggregation allowed us to calculate the percentage of judges identifying it as a backchannel opportunity point for each data point in the stimulus. For further analysis, we selected only those moments deemed genuine backchannel opportunity points by a minimum percentage of judges, with the threshold set based on the expected number of backchannels per recording. We calculated the expected number of backchannels for each recording based on the duration, following Poppe et al. (Reference Poppe, Truong, Heylen, Vilhjálmsson, Kopp, Marsella and Thórisson2011), who suggested 6–12 backchannels per minute. For instance, recording No. 12036, lasting 10.71 minutes, was anticipated to contain between 64 and 128 backchannels.
To determine the appropriate judge consensus level, we first calculated the number of genuine backchannel opportunity points for various consensus levels (e.g., 10%, 20%, 30%, 40%, etc.). We then selected the final level based on whether the number of identified points fell within the expected range for the recording’s duration.Footnote 6 For example, recording No. 12036 had 86 backchannel opportunity points at a 40% consensus level, which matched the expected range of 64–128, so we used 40% as the criterion for genuine backchannels (see Figure 2). For more details on the consensus level considered for each conversation, including whether it fell within the expected range and the distribution across LT and TD groups, please refer to Supplementary Material 1 (Table S1).
The illustration of conversation stimulus No. 12306, showing the number of judges who identified a backchannel opportunity point (BOP) at each time point. Points are marked on the timeline according to the number of judges who indicated the presence of a BOP. If four or more judges (i.e., 40% or more) identified a backchannel opportunity point at a specific time point, that point is classified as a genuine BOP.

2.4. Statistical analysis
Measure of verbal backchannels. To address the first research question on differences in verbal backchannel quantity and temporal distribution, we analysed children’s verbal backchannel usage using a normalised approach to account for variations in adult speaking time across conversations. To ensure a fair comparison between groups, we normalised backchannel frequency per minute of adult speech (hereafter referred to as “backchannels per minute of adult speech”)Footnote 7 – this metric was chosen because adult speech constitutes the primary context for children to provide backchannel feedback, and normalisation to adult speaking time eliminates confounding effects of variable adult speech durations across interactions.
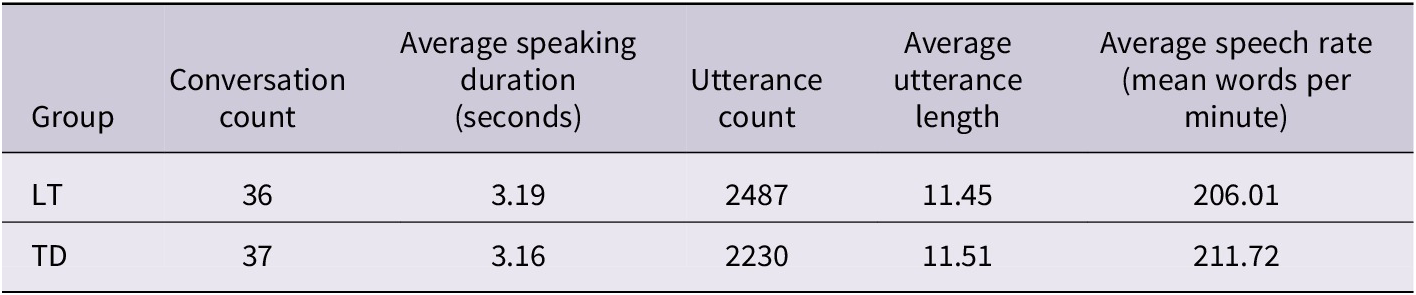
To confirm that adult speaking patterns did not inherently influence children’s backchannel behaviour, we further analysed adult utterance length (measured by word count) and speech rate (words per minute) for adult investigators interacting with both LT and TD groups. Generalised linear models (GLM) were used to compare these adult speech characteristics between groups. Additionally, a linear mixed-effects model (LMM) was applied to examine differences in children’s overall speech rate (words per minute) between the LT and TD groups, with group as a fixed effect and conversation (filename of each recording) as a random intercept.
Verbal backchannel tokens were first identified and segmented manually. We then used the same Praat script3 to extract their durations and counts across conversations. For each recording, we measured the total duration of adult speech, allowing us to compute the normalised backchannel rate (i.e., backchannels per minute of adult speech) for each child. We also calculated the average duration of backchannels per conversation by dividing the cumulative duration of all backchannels by their total count.
To examine group differences in the average backchannel duration, we employed a linear model, as the dataset contained a single averaged value per participant with no hierarchical structure. Similarly, to compare the overall normalised backchannel rate between the LT and TD groups, we used a generalised linear model. The model included group as a fixed effect, with normalised rate (i.e., backchannels per minute of adult speech) as the outcome variable.
By contrast, for our analysis of the temporal distribution of backchannels across different stages of the conversation, we divided each dialogue into three equal temporal segments (i.e., one-third, two-thirds, and three-thirds). This structure introduced repeated measures within each conversation. To accommodate this dependency, we adopted linear mixed-effects models, incorporating a random intercept for conversation to account for variability at the dialogue level. Separate models were fitted for the LT and TD groups with the conversation stage as a fixed effect, followed by a combined model assessing the fixed effects of stage, group, and their interaction. The dependent variable in all LMMs was the normalised backchannel rate (i.e., backchannels per minute of adult speech).
Statistical analyses were conducted in R (R Core Team, 2024) using the “lme4” and “lmerTest” packages (Kuznetsova et al., Reference Kuznetsova, Brockhoff and Christensen2017). We used F-tests for assessing main effects and t-tests with 95% confidence intervals for pairwise contrasts. For post hoc comparisons, we applied the “emmeans” package with adjusted confidence intervals.
Measure of verbal backchannel type diversity. To address the second research question on variations in backchannel types (simple, double, and complex) and diversity across conversation stages, we quantified and compared the frequency of each verbal backchannel type between groups using the Mann–Whitney U test, reporting percentage contributions, effect sizes, and 95% confidence intervals. We then assessed verbal backchannel diversity using Shannon entropy (Shannon, Reference Shannon1948), which quantified diversity within a system. Entropy (H) was calculated as $ {H}_{(X)}= $ $ -\sum \limits_{i=1}^n{p}_i $ $ \log \hskip0.35em {p}_i $
, where
$ \log \hskip0.35em {p}_i $
, where $ {P}_i $
was the probability of the ith verbal backchannel type. Higher entropy values indicated greater diversity in verbal backchannel repertoire. We then applied a linear mixed-effects model to compare entropy between the LT and TD groups. In this model, entropy was the dependent variable, while group, stage, and their interaction were treated as fixed effects. To account for variability across individual conversations, we included the filename of each recording as a random intercept. A permutation test further examined variations in backchannel type diversity across different entropy intervals.
$ {P}_i $
was the probability of the ith verbal backchannel type. Higher entropy values indicated greater diversity in verbal backchannel repertoire. We then applied a linear mixed-effects model to compare entropy between the LT and TD groups. In this model, entropy was the dependent variable, while group, stage, and their interaction were treated as fixed effects. To account for variability across individual conversations, we included the filename of each recording as a random intercept. A permutation test further examined variations in backchannel type diversity across different entropy intervals.
Measure of genuine backchannel opportunity points. To address the third research question on responses to backchannel opportunity points regarding overlapped backchannels and missed opportunities, we identified backchannels per consensus level and determined genuine backchannel opportunity points based on consensus levels for each audio recording in both child groups. We calculated the average duration and standard deviation of genuine backchannel opportunity points from the initial to the final time point where consensus was maintained. To compare the children’s actual backchannel responses with the genuine backchannel opportunity points, we employed linear mixed-effects models with duration, count, and rate as dependent variables. These models included group, type (backchannel or opportunity point), and stage as fixed effects, while conversation (i.e., the filename of each recording) was treated as a random intercept to account for variability across conversations. Additionally, we analysed the overlap and omission of children’s backchannels in relation to the judges’ identified genuine backchannel opportunity points across different stages of the conversation. Two separate linear mixed-effects models were used for these analyses: one examining the count of overlapping backchannels and the other assessing the count of missed opportunity points, both incorporating group and stage as fixed effects, with conversation as a random intercept.
3. Results
3.1. Adult speech patterns and children’s speech rate
To ensure that differences in children’s backchannel behaviour were not influenced by adult speaking patterns, we examined adult utterance length and speech rate (Table 3). Generalised linear models confirmed that adult speech characteristics were comparable across groups, with no significant differences in utterance length (β = −0.19, SE = 0.74, t = −0.25, p = .79) or speech rate (β = 4.99, SE = 4.18, t = 1.19, p = .23), indicating that any observed differences in children’s backchanneling behaviour were not attributable to variations in adult speech patterns. Moreover, the linear mixed-effect model showed that the overall speech rate per minute of children exhibited significant differences, with LT children speaking slower than TD children (LT: 155; TD: 165; F(1,70) = 5.67, p = .01).
Adults’ average utterance length and speech rate in late-talking (LT) and typically developing (TD) groups across all conversations

3.2. Distribution of verbal backchannels
Analysis of normalised backchannel rates (i.e., backchannels per minute of adult speech) revealed significant differences between child groups (Figure 3a). TD children produced more verbal backchannels per minute of adult speech, with a median rate of 2.79, whereas LT children showed a median rate of 1.74. This difference was statistically significant (β = 1.78, SE = 0.40, t = 4.45, p < .001), with TD children demonstrating approximately twice the rate of backchanneling responses during adult speech segments. Based on the TD group’s interquartile range, 14 of the 36 LT children (38.9%) produced normalised backchannel rates that fell within this typical TD range.
Verbal backchannel counts (per minute) and durations in children’s conversations for both late-talking (LT) and typically developing (TD) groups per conversation. Panel (a) displays verbal backchannel counts per minute, while panel (b) shows verbal backchannel durations (in seconds). Red dots reflect per-conversation medians, rather than group-level aggregated means. Green and orange dots indicate individual values for each conversation within the respective groups. Although the LT group originally comprised 37 participants, one audio recording yielded no backchannels, resulting in a sample size of 36 for the LT group, as shown in Figure 3a.

A similar pattern was observed for backchannel duration (Figure 3b). LT children produced verbal backchannels with a median duration of 0.47 seconds, while TD children produced backchannels with a median duration of 0.45 seconds. No evidence of a statistically significant difference was found between the two groups (β = −0.01, SE = 0.03, t = −0.37, p = .72). This pattern indicates that despite LT children having a slower overall speech rate (F(1,70) = 5.67, p = .01), there is no evidence that their backchannel durations differ from those of TD children. Consistent with this, the data do not support a difference in individual backchannel durations between LT and TD children in the present study.
Analysis of verbal backchannels across conversation stages revealed distinct patterns between the two groups of children (Table 4; Figure 4). LT children produced significantly fewer backchannels per minute of adult speech in the two-thirds stage (n = 9.85) compared to the one-third (n = 22.24; β = 0.40, SE = 0.11, t = 3.69, p = .001) and three-thirds stages (n = 21.09; β = 0.30, SE = 0.11, t = 2.86, p = .01). In contrast, TD children demonstrated more stable verbal backchannel production per minute of adult speech across stages, with no significant differences (F(2, 64) = 1.13, p = .32).
Count and duration distribution of children’s verbal backchannels in late-talking (LT) and typically developing (TD) groups across conversational stages in all conversations

Distribution of children’s verbal backchannel counts (per minute) across conversational stages (one-third, two-thirds, and three-thirds) in each conversation for late-talking (LT) and typically developing (TD) groups.

Between-group comparisons revealed a significant interaction between group and stage (F(2,121) = 4.98, p = .008). Post hoc analyses showed LT group produced significantly fewer backchannel per minute of adult speech than TD group during the two-thirds (β = −0.86, SE = 0.18, t = −4.72, p < .001) and three-thirds stages (β = −0.46, SE = 0.17, t = −2.78, p = .006), but not the one-third stage (p = .69). In the analysis of average stage durations, no evidence of a statistically significant difference was found between the LT and TD groups (F(1,182) = 0.03, p = .85). Further examination of stage-specific distributions showed that 16 of 29 LT children (55.2%) fell within the TD interquartile range during the one-third stage, 5 of 22 (22.7%) during the two-thirds stage, and 16 of 32 (50.0%) during the three-thirds stage, indicating substantial variability across stages in the extent to which LT children exhibited TD-typical backchannel rates.
3.3. Type of verbal backchannels
Analysis of verbal backchannel types revealed a clear preference for simple verbal backchannels in both groups (LT: n = 230; TD: n = 398), significantly outnumbering double (LT: n = 1; TD: n = 3) and complex (LT: n = 1; TD: n = 3) verbal backchannels (Table 5). “Yeah,” “mmhmm,” and “yep” were the most common simple verbal backchannels in both groups. Mann–Whitney U tests revealed significant differences in backchannel usage across conversation stages (see Figure 5). In the one-third stage, LT children used “yeah” more than TD children (p = .002, δ = 0.41, 95% CI [0.12, 0.64]), while TD children used “yep” more frequently (p = .02, δ = −0.68, 95% CI [−0.91, −0.11]). The two-thirds stage showed that TD children used “yeah” (p = .001, δ = −0.44, 95% CI [−0.66, −0.16]) and “mmhmm” (p = .02, δ = −0.39, 95% CI [−0.65, −0.04]) more frequently. In the three-thirds stage, the only significant difference was in “mmhmm” usage, with LT children showing a higher proportion (p = .04, δ = 0.35, 95% CI [0.02, 0.64]).
Distribution of verbal backchannel (BC) counts and percentages (%) across conversational stages (one-third, two-thirds, and three-thirds) for late-talking (LT) and typically developing (TD) groups

Percentage of simple verbal backchannels across conversational stages (one-third, two-thirds, and three-thirds) for both late-talking (LT) and typically developing (TD) children groups.

Analysis of verbal backchannel diversity using entropy measures showed that TD children had significantly higher entropy than LT children in the three-thirds stage (LT: M (H) = 18.6; TD: M (H) = 26.0; β = −0.21, SE = 0.09, t = −2.07, p = .04, 95% CI [−0.40, −0.01]). The density plot (see Figure 6) reveals that the TD group showed greater variability in verbal backchannel types. Notably, the LT group’s density plot peak shifted leftward compared to the TD group, indicating lower entropy and reduced variability in verbal backchannels. Permutation tests confirmed significantly higher entropy for the TD group within the range 1.33 ≤ H ≤ 1.86 (p < .05). Further examination of stage-specific distributions showed that 17 of 29 LT children (58.6%) fell within the TD interquartile range during the one-third stage, 16 of 22 (72.7%) during the two-thirds stage, and 17 of 32 (53.1%) during the three-thirds stage.
Density plot of Shannon entropy (H) of verbal backchannel types for late-talking (LT) and typically developing (TD) children. The y-axis represents the density, showing the relative frequency of entropy values. Higher density means more frequent values. Peaks indicate common entropy values, while spread reflects variability. Overlap suggests similar entropy between groups. The red area highlights significant differences (p < .05) identified by a permutation test conducted at 0.01 intervals.

3.4. Overlapped backchannels and missed backchannel opportunity points
Regarding duration (Figure 7a), both groups exhibited shorter backchannels (LT: M = 0.47 second, SD = 0.16 second; TD: M = 0.46 second, SD = 0.18 second) compared to backchannel opportunity points (LT: M = 0.61 second, SD = 0.27 second; TD: M = 0.67 second, SD = 0.39 second; F(1,18323) = 147.24, p < .001), with no stage differences (F(2,18319) = 0.34, p = .71). Interestingly, judges identified longer backchannel opportunity points for TD children (β = −0.05, SE = 0.02, z = −2.46, p = .01, 95% CI [−0.09, −0.01]), but no evidence of a statistically significant difference in actual verbal backchannel durations was found between groups (β = 0.03, SE = 0.03, z = 0.96, p = .33, 95% CI [−0.03, −0.11]).
Comparison of the mean duration, count, and rate of children’s verbal backchannels (BC) and judges’ genuine backchannel opportunity points (BOP) per conversation between late-talking (LT) and typically developing (TD) groups. Panel (a) displays the mean duration (in seconds) of BC and BOP per conversation; panel (b) shows the mean count of BC and BOP per conversation; panel (c) presents the mean rate (per minute) of BC and BOP per conversation.

In terms of frequency (Figure 7b), both groups produced fewer backchannels per conversation (LT: M = 6.44, SD = 4.11; TD: M = 11.22, SD = 7.08) than identified backchannel opportunity points (LT: M = 27.14, SD = 8.30; TD: M = 21.57, SD = 8.01) (F(1,3591) = 2477, p < .001, pη 2 = 0.41). The interaction effect showed a more pronounced difference in backchannel opportunity points between groups (β = 1.96, SE = 0.49, z = 3.93, p < .001, 95% CI [0.98, 2.92]) than in verbal backchannel counts (β = −1.21, SE = 0.49, z = −2.42, p = .01, 95% CI [−2.17, −0.23]).
Analysis of rates per minute (Figure 7c) showed lower verbal backchannel rates (LT: M = 0.23, SD = 0.14; TD: M = 0.33, SD = 0.22) compared to backchannel opportunity point rates (LT: M = 0.79, SD = 0.41; TD: M = 0.63, SD = 0.36) for both groups (F(1,3591) = 2447, p < .001, pη 2 = 0.41). Notably, judges identified higher backchannel opportunity point rates for the LT group (β = 0.15, SE = 0.03, z = 3.83, p < .001, 95% CI [0.07, 0.23]), but the LT group had significantly lower actual verbal backchannel rates compared to TD children (β = −0.11, SE = 0.03, z = −2.63, p = .008, 95% CI [−0.18, −0.02]).
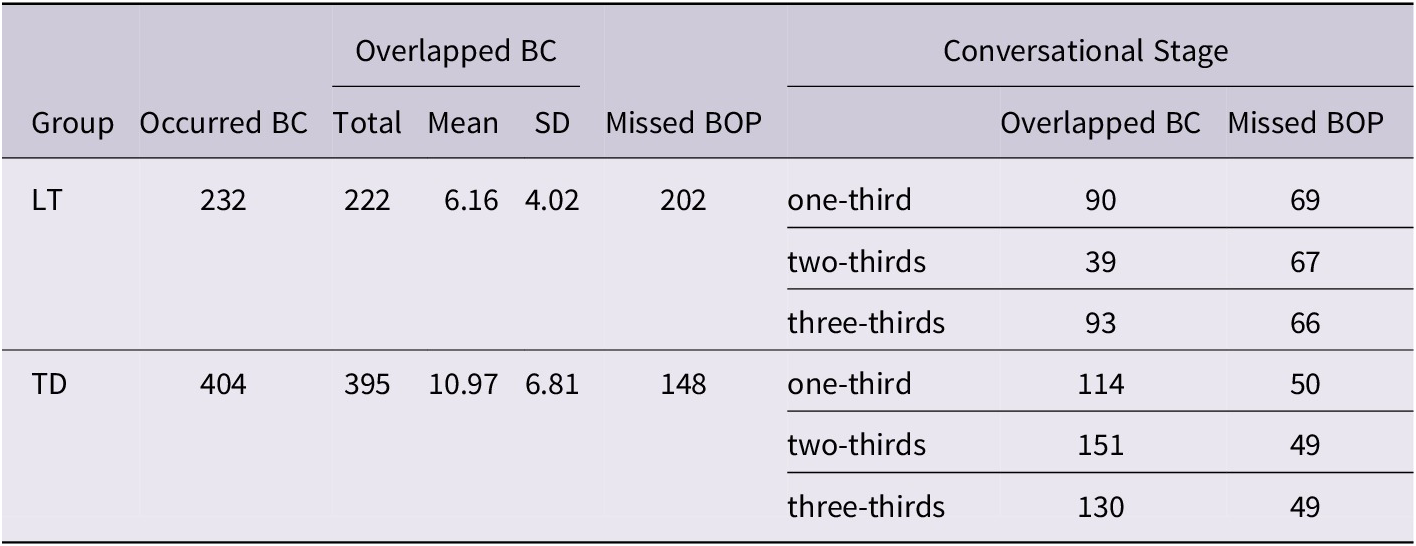
Analysis of overlapped and missed backchannel opportunity points revealed significant differences between LT and TD children groups (Table 6; Figure 8). The LT group produced fewer overlapped backchannels than the TD group (F(1,73) = 9.69, p = .002, pη 2 = 0.12), as shown by a wider violin plot and lower median (LT: median = 6; TD: median = 8) in Figure 8a. Further examination of individual distributions indicated that 15 of 36 LT children (41.7%) fell within the TD interquartile range. A significant interaction effect indicated that the LT group had notably fewer overlapped backchannels only in the two-thirds stage (β = −2.78, SE = 0.59, t = −4.66, p < .001, 95% CI [−3.97, −1.61]), with no significant differences in other stages.
Distribution of the count of occurred and overlapped backchannels (BC) and missed backchannel opportunity points (BOP) across conversational stages (one-third, two-thirds, and three-thirds) in all conversations for late-talking (LT) and typically developing (TD) children groups

Comparison of the count of overlapped backchannels (BC) and missed backchannel opportunity points (BOP) per conversation between late-talking (LT) and typically developing (TD) children groups. Panel (a) displays the count of overlapped BC per conversation, while panel (b) shows the count of missed BOP per conversation.

The LT group missed significantly more backchannel opportunity points than the TD group (F(1,70) = 10.08, p = .002, pη 2 = 0.13), with no stage differences (F(2,140) = 0.29, p = .74, pη 2 < 0.001). Figure 8b illustrates a higher concentration and median for the LT group (LT: median = 5.7; TD: median = 4.1), and a larger interquartile range (LT: IQR = 2.85; TD: IQR = 2.55), indicating greater variability in missed opportunities. Further examination of individual distributions showed that 14 of 36 LT children (38.9%) fell within the TD interquartile range.
4. Discussion
4.1. Quantitative differences in verbal backchannel production
The finding that TD children produced significantly more backchannels per minute of adult speech (109.93 vs. 53.20 for LT children) supports our first hypothesis, which predicted fewer backchannels in LT children, particularly in the middle and final conversational stages, due to cumulative cognitive load (Clark, Reference Clark1996; Tomasello, Reference Tomasello2003). This pattern underscores a marked pragmatic disparity, aligning with the theory’s emphasis on how LT children’s persistent processing challenges (Leonard, Reference Leonard2017; Montgomery, Reference Montgomery2000) limit resources for active engagement. From an interactionist standpoint (Tomasello, Reference Tomasello2003), the frequency of backchannel use observed in TD children underscores their deeper embeddedness in reciprocal communication, likely shaped by a higher volume of daily conversational exchanges – estimated at 300–500 interactional episodes (Bangerter & Clark, Reference Bangerter and Clark2003) – and facilitated by adult scaffolding strategies such as simplified input, clarification requests, and prosodic highlighting.
In contrast, the lower backchannel frequency observed in LT children suggests difficulties in allocating cognitive resources across simultaneous processing streams – comprehension, attention to pragmatic cues, and response formulation. The limited expressive vocabulary in early childhood may compromise their capacity to perceive and respond to subtle interactional signals, prompting adults to reduce the complexity or frequency of interactions (Rescorla & Goossens, Reference Rescorla and Goossens1992). This dynamic potentially initiates a self-reinforcing cycle, emblematic of the “Matthew Effect” in language development (Stanovich, Reference Stanovich2009), where early delays limit exposure to complex discourse structures, further inhibiting pragmatic growth.
Moreover, LT children’s reduced backchannel use during the later stages of conversation may reflect increasing cognitive load as interlocutors transition into Clark (Reference Clark1996)’s “topic-development phase,” which demands sustained attention, inferencing, and coherence maintenance. According to Vygotsky and Cole (Reference Vygotsky and Cole1978)’s concept of the zone of proximal development, such demands may exceed LT children’s developmental readiness, particularly if scaffolding strategies do not adequately adjust to their needs (Snow, Reference Snow2013).
These findings diverge from van Balkom et al. (Reference van Balkom, Verhoeven and van Weerdenburg2010), who observed that younger children with DLD produced more backchannels than TD peers – possibly as a compensatory mechanism to maintain interaction with minimal linguistic effort. The discrepancy may reflect developmental shifts: while young children with DLD use simple backchannels as a low-effort strategy, LT children aged 5 years face increased demands on semantic integration and turn-taking coordination, resulting in decreased output. This shift is supported by Macroy-Higgins and Montemarano (Reference Macroy-Higgins and Montemarano2016), who noted that LT children allocate less attention to referents during word-learning tasks, suggesting a broader difficulty in managing multiple cognitive demands. Our findings thus indicate that the cognitive load of conversation increases with age, exacerbating pragmatic deficits in LT children. This contrast highlights evolving challenges from initiating interactions (van Balkom et al., Reference van Balkom, Verhoeven and van Weerdenburg2010) to coordinating complex tasks like semantic integration and turn management in our sample, reflecting the underdevelopment of joint attention (Tomasello, Reference Tomasello2003). Limited early social experiences may impair this mechanism, stunting interactive competence and learning opportunities, leading to developmental stagnation.
Individual variability within LT children – where 38.9% overall and up to 55.2% in early stages fall within TD norms – suggests that pragmatic deficits are not universal. This heterogeneity may reflect differential scaffolding histories: LT children with richer early interactional exposure (Girolametto et al., Reference Girolametto, Bonifacio, Visini, Weitzman, Zocconi and Pearce2002) likely develop compensatory monitoring strategies, preserving backchanneling in low-demand phases. Clinically, this finding supports profiling LT children by conversational stage performance to prioritise intervention for those with persistent mid-conversation drops, aligning with Interactionist predictions of resource-dependent engagement (Tomasello, Reference Tomasello2003).
4.2. Qualitative differences in verbal backchannel types and diversity
Beyond frequency, our findings reveal clear qualitative differences in the composition of backchannels between the two groups. Both LT and TD children predominantly used simple backchannels (e.g., “yeah”), but TD children demonstrated greater diversity, particularly in the final conversational stage, as evidenced by higher Shannon entropy values. This variability, supporting the second hypothesis, suggests that TD children possess a more adaptable pragmatic repertoire, capable of calibrating feedback to the conversational context. Prior research (Tolins et al., Reference Tolins, Namiranian, Akhtar and Fox Tree2017) demonstrates that even preschool-aged TD children strategically deploy backchannels to support collaborative dialogue and facilitate vicarious learning. The increased diversity in our TD cohort likely reflects a developmental trajectory where early interactional scaffolding fosters nuanced pragmatic competence.
In contrast, LT children’s reliance on a restricted set of backchannels may signal constraints in pragmatic flexibility. This finding converges with those of Lloyd-Esenkaya et al. (Reference Lloyd-Esenkaya, Russell and Clair2020), who reported that children with DLD show persistent difficulties in discourse-level competencies such as turn-taking and responsiveness. Similarly, Bishop and Leonard (Reference Bishop and Leonard2014) identified deficits in response contingency and conversational adaptability in DLD populations – both relevant to the reduced backchannel diversity observed in our LT sample. Bonifacio et al. (Reference Bonifacio, Girolametto, Bulligan, Callegari, Vignola and Zocconi2007) further observed that Italian-speaking children with DLD exhibited limited assertive and responsive conversational behaviours, pointing to a common pragmatic vulnerability across languages and atypical developmental profiles.
From a theoretical perspective, these patterns may reflect a deficit in “shared intentionality” (Tomasello, Reference Tomasello2003), the capacity to coordinate mental states and goals with conversational partners. TD children appear to develop what has been termed “panoramic dialogue monitoring,” enabling them to tailor their responses to unfolding discourse needs. LT children, by contrast, may rely on non-specific and redundant response tokens due to constraints in processing capacity and limited prior exposure. Moreover, interactional environments that favour confirmation-based scaffolding over elaborative prompts (Girolametto et al., Reference Girolametto, Bonifacio, Visini, Weitzman, Zocconi and Pearce2002) may further reinforce narrow usage patterns, reducing opportunities for pragmatic elaboration and social learning.
The high overlap with TD entropy in LT children (up to 72.7% in two-thirds of the stages) indicates that diversity deficits are context-sensitive rather than fixed. This may stem from preserved lexical flexibility in structured exchanges, consistent with late talkers’ ability to generalise trained strategies under reduced cognitive load (Zuniga-Montanez & Krott, Reference Zuniga-Montanez and Krott2025). Clinically, targeting diversity in demanding phases via scripted variation training could leverage this latent capacity.
4.3. Differences in backchannel opportunity points
Consistent with our third hypothesis, LT children responded to fewer backchannel opportunity points, with fewer overlapped backchannels and more missed opportunities, particularly in the middle conversational stage. These timing discrepancies suggest challenges in perceiving and acting upon subtle cues for contingent feedback, a core indicator of pragmatic competence (Snow, Reference Snow2013). Within the Interactionist framework (Tomasello, Reference Tomasello2003), the synchronisation of backchannel responses hinges on the development of joint attention mechanisms and real-time turn coordination, often scaffolded through imitation and feedback (Boudin et al., Reference Boudin, Rauzy, Bertrand, Ochs and Blache2024a). TD children’s timely responses likely reflect internalised turn-taking routines and sensitivity to prosodic and contextual cues. LT children, by contrast, may perceive these cues but lack the processing efficiency to respond within the acceptable temporal window – what Bruner (Reference Bruner1985) termed a “pragmatic paradox.” Recent work by Boudin et al. (Reference Boudin, Rauzy, Bertrand, Ochs and Blache2024b) identifies a 1.5-second response window as critical for socially acceptable feedback, suggesting that even minor delays can undermine conversational flow.
The results also contrast with van Balkom et al. (Reference van Balkom, Verhoeven and van Weerdenburg2010), where younger children with DLD were reported to produce more backchannels. This discrepancy may stem from adult adaptations in early interactions – such as increased pausing – that artificially inflate backchannel opportunity point frequency. In more complex school-aged dialogues, such adjustments may be less prevalent or effective, thereby exposing children’s underlying limitations in turn-timing coordination. Consistent with this interpretation, Bishop and Leonard (Reference Bishop and Leonard2014) and Lloyd-Esenkaya et al. (Reference Lloyd-Esenkaya, Russell and Clair2020) report persistent turn-taking difficulties in children with DLD aged 4–11, reinforcing the notion that joint attention and response synchrony remain fragile well beyond early development in LT children.
These findings also reveal a critical mismatch between perception and production within the zone of proximal development (Vygotsky & Cole, Reference Vygotsky and Cole1978; Wood et al., Reference Wood, Bruner and Ross1976). While LT children may be aware of interactional contingencies, their ability to enact timely responses is compromised by planning delays or lexical retrieval difficulties, ultimately diminishing the efficacy of adult scaffolding. These insights have practical implications for intervention, suggesting that strategies targeting joint attention and response latency – such as turn-taking games or interactive modelling – may be particularly beneficial (Girolametto et al., Reference Girolametto, Bonifacio, Visini, Weitzman, Zocconi and Pearce2002).
Notably, approximately 40% of LT children show TD-like overlap and miss rates, suggesting intact cue detection but variable execution under processing constraints (Montgomery, Reference Montgomery2000). Clinically, timing-based interventions (e.g., prosodic cue training) may suffice for this subgroup, reserving intensive support for consistent non-responders.
4.4. Limitations and future research
While this study provides valuable insights into the verbal backchannel behaviour of LT and TD children, several limitations should be acknowledged. First, a key limitation is the age of the data (collected 1983–1991). Participants were screened to exclude general developmental delays (e.g., via Denver II), but socio-pragmatic assessments were not standard then. Social (pragmatic) communication disorder (SCD) was introduced in Diagnostic and Statistical Manual of Mental Disorders (5th edition: DSM-5; American Psychiatric Association, 2013) in 2013, and International Classification of Diseases (11th revision: ICD-11; World Health Organization 2022) later incorporated pragmatic language impairments under developmental language disorder subcategories rather than as an independent code; meanwhile, autism spectrum disorder (ASD) criteria have evolved substantially. Thus, the LT sample – defined solely by expressive vocabulary delays and matched on cognition but not explicitly on socio-cognitive status – may include children who would now be classified as having SCD-like pragmatic difficulties, DLD with pragmatic impairment, or ASD, given overlaps in conversational deficits (e.g., turn-taking issues, reduced engagement). This reflects historical diagnostic gaps, where pragmatic disorders were under-recognised. Findings should be contextualised accordingly; future studies using contemporary cohorts could clarify these distinctions. Second, the cross-sectional design restricts our ability to trace developmental trajectories. Longitudinal studies would enable researchers to examine how early backchannel behaviour predicts long-term language outcomes and to identify sensitive periods for targeted intervention. Third, our focus on child–examiner interactions limits the scope. Future studies should explore various contexts (e.g., peer interactions, family conversations) and task settings (e.g., storytelling, problem-solving). Additionally, building on the observed individual differences in LT children (e.g., 38.9–72.7% overlapping with TD norms across measures), future research could employ cluster analyses to delineate subgroups, informing clinically tailored interventions and enhancing prognostic accuracy. Investigating multimodal communication, such as gestures and facial expressions, could offer a more comprehensive understanding, particularly for late talkers who may rely more on non-verbal cues.
5. Conclusion
This study examined verbal backchannel behaviour in 5-year-old children with a history of late talking, contrasting their performance with that of typically developing peers. Across three dimensions – quantity, diversity, and timing – LT children exhibited consistent deficits, particularly during the cognitively demanding stages of interaction. We found that while LT children are perceptive to interactional cues, they exhibit significantly reduced frequency and diversity in response tokens compared to their TD peers. These differences appear to stem not solely from expressive limitations but from broader difficulties in processing, scaffolding alignment, and social-pragmatic coordination. This study contributes to a more nuanced understanding of how late language emergence continues to impact conversational competence at school age. The findings advocate for dynamic, context-sensitive interventions that enhance joint attention, timing precision, and pragmatic flexibility – thereby facilitating more successful communication in naturalistic environments.
Supplementary materials
The supplementary material for this article can be found at http://doi.org/10.1017/S0305000926100634.
Data availability statement
The corpus data that support the findings of this study are openly available in the CHILDES Clinical English Ellis Weismer Corpus at http://doi.org/10.21415/T5FP4H. The data analyses that support the findings of this study are available from the corresponding author, H. Ding, upon reasonable request.
Acknowledgements
We extend our sincere gratitude to the anonymous peer reviewers for their valuable and constructive comments.
Funding statement
This work was supported by the major program of the National Social Science Foundation of China under Grant [number 18ZDA293]; the Supervisor Academic Guidance Program of Shanghai International Studies University under Grant [number 2023DSYL001]; and the Postgraduate Research & Innovation Program of the Institute of Language Sciences, Shanghai International Studies University.
Competing interests
The authors declare none.
Ethics approval statement
The collection and transcription of language samples were approved under NIDCD Grant 1R01 DC03731, titled “Linguistic processing in specific language delay” (S. Ellis-Weismer, PI). This study was conducted in accordance with the Declaration of Helsinki. The human research ethics approval was granted by the Ethics Committee of the Institute of Language Sciences at Shanghai International Studies University (Approval No. 20230308005). All adult participants provided written informed consent.
Disclosure of the use of AI tools
No AI tools were used in the writing, editing, or analysis stages of this manuscript.


 Open access