

1. Introduction
Modelling the behaviour of snow microstructure is essential for avalanche-risk forecasting, mainly as a means to provide a parameterization of grain-scale physics into existing or future models at the field scale (Reference JordanJordan, 1991; Reference Brun, David, Sudul and BrunotBrun and others, 1992; Bartlet and Lehning, 2002). Existing models simulate the evolution of snow layers using an experimental parameterization ofmetamorphism. It is presently obtained from a characterization of snow in the field using grain silhouettes of isolated grains (Reference Lesaffre, Pougatch and MartinLesaffre and others, 1998) or two-dimensional (2-D) thin-section analysis (Reference GoodGood, 1987; Reference Edens and BrownEdens and Brown, 1991; Reference Brown, Edens and SatoBrown and others, 1994). Recent three-dimensional (3-D) imaging techniques (Reference Coléou, Lesaffre, Brzoska, Ludwig and BollerColéou and others, 2001) are not yet implemented as a practical means of snow microstructure characterization. Substantial help could be found in the extensive research in the domain of materials and porous media (Reference Bernache-AssolantBernache-Assolant, 1993; Reference GermanGerman, 1996; Reference BullardBullard, 1997a). However, the various features of snow metamorphism (Reference ColbeckColbeck, 1997) remain a particularity that needs to be addressed by the snow and ice community.
Isothermal metamorphism is probably the simplest situation, mainly governed by the distribution of mean curvature along the grain/pore interface, like many sintering processes. Near 0˚C, one can expect a reduced influence of possible surface or bulk diffusion at grain boundaries (Reference ColbeckColbeck, 1999, 2001; Reference Adams, Miller and BrownAdams and others, 2001), owing to the large saturation vapour pressure of water at these temperatures. We recently proposed a simple evaporation scheme and performed preliminary tests using the first results of an experiment of controlled isothermal metamorphism at –2°C (Reference Flin, Brzoska, Lesaffre, Coléou and R. A.Flin and others, 2003).
These tests do not presently allow any conclusions regarding the validity of the evaporation–condensation approach vs the more common (but much less tractable) diffusive scheme.
The characterization of microstructures is once again necessary in order to go farther in metamorphism modelling. Here we present some new developments of 3-D snow-image analysis and discuss their relevance to some typical behaviour observed in a real metamorphism experiment. After a short presentation of the experimental procedure, the numerical methods used in our work are described. The porosity, specific surface area, anisotropy and curvature distribution are then presented as a function of time and briefly discussed as possible guidelines for further modelling.
2. Experiment of Isothermal Metamorphism
A 3 month long experiment of isothermal metamorphism at –2°C was run at Col de Porte, Chartreuse mountain, French Alps, to provide microtomographic 3-D data for the validation of metamorphism models.
2.1. Sampling
A 0.5 m × 1m slab of recent snow was first collected in the field (on16 January 2002) 15 hours after a snowfall (exterior temperature –1°C, slab thickness 12 cm). To prevent sublimation and temperature gradient effects, the slab was stored in a closed Styrodur® (extruded rigid polystyrene foam) box inside the cold room maintained at –2±0.2°C. Till the end of the experiment, all manipulations were done in the cold room at this temperature. A 3 cm wide core was sampled at increasing time intervals, ranging from 24 hours at the beginning to 1 week at the end of the experiment. The collected slab was constituted of three layers whose thicknesses were measured at each sampling. All samples were taken in the middle layer of the slab, always >10 cm away from already sampled regions.
2.2. X-ray absorption microtomography
Once sampled, each core was impregnated with 1-chloronaphthalene and machined into the shape of a 9 × 9 mm cylinder for microtomographic acquisition. Three-dimensional images of snow samples were obtained at the ID19 beamline of the European Synchrotron Radiation Facility (ESRF) at Grenoble, France, by X-ray absorption microtomography (Reference Coléou, Lesaffre, Brzoska, Ludwig and BollerColéou and others, 2001) using a specially designed refrigerated cell (Reference BrzoskaBrzoska and others, 1999b). All the images were obtained at 18–20 keV, with a voxel (volume element) size of 4.91 μm. The grey-level images obtained, reconstructed at the ESRF, were contoured using a semi-automatic procedure. More information about core preparation and image processing can be found in Reference Flin, Brzoska, Lesaffre, Coléou and R. A.Flin and others (2003). The 3-D images obtained were 600 voxels wide, which is a considerable quantity of volumetric data. To allow reasonable processing times for our normal and curvature algorithms, the resolution of the 3-D images was reduced by a factor of 2 in the three axes. Thus, in all the 3-D snow images presented in this paper, one voxel corresponds to 9.82 μm.
3. Geometrical Analysis
Presented here are the numerical algorithms we used to obtain the geometrical information describing our snow 3-D numerical images: porosity, specific surface area, anisotropy and curvature distribution.
3.1. Porosity
The porosity P is the ratio of the pore volume by the total volume of the considered sample. The evolution of this parameter during the metamorphism is directly related to the packing of the snow. It can be obtained simply by counting the voxels belonging to the pore phase in a chosen region of interestD. Let ND be the number of voxels p in D; we have:
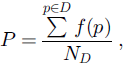
where f(p) = 1 for p belonging to the pore, 0 otherwise.
3.2. Specific surface area
The specific surface area (SSA) of a snow sample is defined by the total surface area of the air/ice interface per mass unity of the considered sample. The SSA is a useful parameter for describing the metamorphism of a snow layer, as it indicates the potential of this snow to undergo physical evolution. This parameter can be computed by estimating the surface area SD included in a region of interest D. Stereological methods can be used to obtain such a surface estimation, and give good results for section planes that contain a large number of grains (Reference SerraSerra, 1982; Reference ChermantChermant, 1992). In Reference BrzoskaBrzoska and others (2001), an original method was proposed and compared to other non-stereological methods. Here the algorithm we used for the SD determination is briefly reviewed.
The unit outward normal vectors ![]() are adaptively calculated on each surface voxel p 2 D by an original algorithm (Reference Flin, Brzoska, Lesaffre, Coléou and LamboleyFlin and others, 2001; Reference Coeurjolly, Flin, Teytaud and TougneCoeurjolly and others, 2003).
are adaptively calculated on each surface voxel p 2 D by an original algorithm (Reference Flin, Brzoska, Lesaffre, Coléou and LamboleyFlin and others, 2001; Reference Coeurjolly, Flin, Teytaud and TougneCoeurjolly and others, 2003).
For each surface voxel p, a weight g(p) is computed as follows:
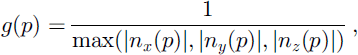
where nx(p), ny(p) and nz(p) are the projections of ![]() along the three coordinate directions of the voxel grid.
along the three coordinate directions of the voxel grid.
SD is obtained, in voxel units, by summing all the contributions g(p) in D.
Then, the SSA in physical units can be calculated as follows:
where ρ is the ice density and l0 the size of one voxel.
3.3. Anisotropy
By “anisotropy”, we mean the anisotropy of the normal vector field describing the ice surface. An estimation of the anisotropy in snow samples is of great importance for understanding processes during metamorphism and packing. We propose here a tridimensional anisotropy estimator inspired by the work of Reference SerraSerra (1982) but using the knowledge of the normal vector in each surface voxel. Let us define αx(p), αy(p) and αz(p) the three coordinate angles of ![]()
The unit outward normal vector ![]() is first calculated on each surface voxel p 2 D, as in section 3.2.
is first calculated on each surface voxel p 2 D, as in section 3.2.
The angles αx(p), αy(p) and αz(p) are then computed.
The angular distributions on D, AD(αx), AD(αy) and AD(αz) are evaluated by counting the number of voxels corresponding to each class of angle.
On each histogram obtained, this number is expressed in percentage of the total surface voxels belonging to D and plotted in polar coordinates.
Note that the distributions are only defined between 0 and π rad. As this algorithm consists in interpreting volumetric data by angles with one direction of the space, the distributions obtained are not straightforward.
For example, let us consider the distributions of a sphere. As this object is fundamentally isotropic, the distributions are invariant by rotation and we have:
with α the angle between ![]() and a chosen direction of the space. The number of points corresponding to a class of angle α is equal to the length of the parallel line defined by α. This value amounts to 2πR sin α, R being the radius of the sphere (Fig. 1). The surface area of a sphere being 4πR2, we have:
and a chosen direction of the space. The number of points corresponding to a class of angle α is equal to the length of the parallel line defined by α. This value amounts to 2πR sin α, R being the radius of the sphere (Fig. 1). The surface area of a sphere being 4πR2, we have:
For a sphere of radius R;AD(α) = (100 sin α)/2R%. This distribution has a maximal value for π/2 (equatorial line).

with AD(α) expressed in percentage of the total surface voxels belonging to D.
Note that AD(α) will have a maximal value at π/2 (equatorial line) and minima at 0 and π rad (poles).
For more complex objects, one can detect anisotropies by comparing the distributions obtained in the three directions of the space and the distribution of its equivalent sphere (see section 4.3).
3.4. Mean curvature distribution
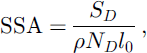
The 3-D mean curvature C of a surface corresponds to the quantity δA/(2δV ), where δA is the incremental change in the element’s area when it is normally displaced by local addition of material of volume δV. As can be seen from Kelvin’s equation (Reference AdamsonAdamson, 1990), the mean curvature is directly involved in vapour exchanges, and the determination of this quantity at each point of the surface is essential for monitoring the snow metamorphism.
Several methods were proposed for computing mean curvatures (see, e.g., Reference Bullard, Garboczi, Carter and FullerBullard and others, 1995; Reference Rieger, Timmermans and vanVlietRieger and others, 2002). In a preceding paper (Reference Brzoska, Lesaffre, Coléou, Xu and PieritzBrzoska and others, 1999a), we presented such an algorithm, in which C(p), the curvature on each voxel p, was computed as follows:
where the values 1/r1(p) and 1/r2(p) of the 2-D curvature were obtained on two orthogonal planes that contain ![]() by fitting the discrete curves by parabolas. This method gives fairly good results but presents some drawbacks:
by fitting the discrete curves by parabolas. This method gives fairly good results but presents some drawbacks:
The determination, in each voxel p, of two orthogonal planes containing ![]() requires systematic rotations of a small discrete neighbourhood around p. This leads to some discretization effects and intensive computation time.
requires systematic rotations of a small discrete neighbourhood around p. This leads to some discretization effects and intensive computation time.
The use of a large fixed neighbourhood (about 20 voxels wide) for 2-D curve fitting implies that small objects cannot be processed properly.
In this paper, we propose an adaptive algorithm that avoids the above disadvantages. This method involves the following steps:
The background distance map of the ice phase M (ice) is first generated. In other words, we label all voxels in the object with the distance to the closest background voxel. Many algorithms exist to compute such a map: some of them use chamfer metrics to approximate the Euclidean metric (Reference BorgeforsBorgefors, 1986; Reference VerwerVerwer, 1991); other methods compute the exact Euclidean distance transform (Reference HirataHirata, 1996; Reference Meijster, Roerdink and HesselinkMeijster and others, 2000). We chose a second-neighbour chamfer distance d5-7-9-11-12-15 due to its simplicity and its good accuracy (Reference VerwerVerwer, 1991).
The background distance map of the pore phase M(pore) is then constructed. Note that the same nearest background points used for the determination of M(ice) should be used for M(pore).
A distance map on the whole image M(image) is obtained by combining the two background distance maps as follows: M(image) = M(ice) -M(pore).
We compute the gradient map of M(image) using a classical Prewitt first-neighbour mask derivative filter (Reference PrewittPrewitt, 1970).
In each surface voxel p, the divergence of the unit-normal vector ![]() is estimated by averaging the first-neighbour divergences of the background distance gradient in an appropriate surface neighbourhood around p. Note that this neighbourhood is obtained by applying the same angular and symmetry criteria as for the determination of normals (Reference Flin, Brzoska, Lesaffre, Coléou and LamboleyFlin and others, 2001; Reference Coeurjolly, Flin, Teytaud and TougneCoeurjolly and others, 2003) and can be directly deduced from this computation.
is estimated by averaging the first-neighbour divergences of the background distance gradient in an appropriate surface neighbourhood around p. Note that this neighbourhood is obtained by applying the same angular and symmetry criteria as for the determination of normals (Reference Flin, Brzoska, Lesaffre, Coléou and LamboleyFlin and others, 2001; Reference Coeurjolly, Flin, Teytaud and TougneCoeurjolly and others, 2003) and can be directly deduced from this computation.
C(p) is then given by the following relation (Reference SethianSethian, 1996; Reference BullardBullard, 1997b):
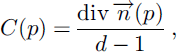
where d is the dimensionality of the considered Rd (d = 3 in this paper).
The curvature distribution HD(C) on D is evaluated by counting the number of voxels corresponding to each class of curvature. On each histogram obtained, this number is expressed in percentage of the total surface voxels belonging to D.
4. Results and Discussion
Here are presented the evolution of porosity, specific surface area, anisotropy and curvature distribution during the experiment of isothermal dry-snow metamorphism. All computations were applied on 250 voxel (~2.5mm) wide images. Except for the SSA where a logarithmic scale was used, all times were counted from the first sampling.
4.1. Porosity evolution
The porosity was computed for ten tomographic images and is plotted vs time in Figure 2a. To estimate the soundness of the results obtained, the inverse of density was computed from the porosity value. This quantity was compared to the thickness variation of the snow layers measured during the experiment (see Fig. 2b). The inverse of density and the thickness data are expressed as a percentage of the initial values (obtained 15 hours after the snowfall). Note that the thickness estimation of individual layers is inaccurate because of the difficulty of distinguishing the limit between two layers. The uncertainty is particularly significant for the middle layer, for which the errors come from the estimation of both the upper and lower borders. For these reasons, the slight differences of the packing rate that can be observed between the three layers are not significant. The total layer-thickness measurement is much more accurate, as it does not involve any difficult estimation of the border position. Despite evident noise due to measurement errors and small-volume analysis, these five curves are in fairly good agreement and seem to follow the classical dry-snow packing laws. This allows us to conclude that:
Porosity and snow-layer evolution with time. Porosity evolution (a) and comparisons between thickness of snow layers and inverse of density evolutions (b). There is fairly good agreement between snow-layer measurement and numerical estimation at microstructural scale.
There is no significant discrepancy between the evolution of the three snow-layer thicknesses.
The precision on porosity obtained by small-volume numerical analysis seems to be equivalent to that obtained by a packing measurement.
4.2. Specific surface area evolution
The SSA evolution with time t is plotted in Figure 3. By fitting this evolution with a logarithmic function, we obtain the following time dependency with a correlation coefficient of 0.986:
SSA plotted in logarithmic scale. Time is counted from the begining of the snowfall. The SSA evolution follows a logarithmic law as mentioned in Reference Cabanes, Legagneux and DominéCabanes and others (2003) and Reference Legagneux, Lauzier, Dominé, Kuhs, Heindrichs and TechmerLegagneux and others (2003) (see Equation (8)).
This law is in fairly good agreement with the results based on CH4 adsorption at liquid nitrogen temperature (Reference Cabanes, Legagneux and DominéCabanes and others, 2003; Reference Legagneux, Lauzier, Dominé, Kuhs, Heindrichs and TechmerLegagneux and others, 2003).
4.3. Anisotropy
The angular distributions AD(αx), AD(αy) and AD(αz) were estimated on each tomographic image. The early stages of the metamorphism show a strong angular variability of the distributions: this can be explained by the numerous large plates contained in the images and the relatively small region studied. After the first 66 hours of the experiment, the variability of the distributions is decreasing and one can observe a slight but persistent anisotropy along the vertical direction (z axis). This phenomenon is illustrated in Figure 4, in which the distributions were averaged on the eight last stages of the experiment (66–2011hours).
Anisotropy visualization on polar diagram: a slight but persistent packing is visible along the vertical direction (z axis) for times >66 hours.
In this graph, the distribution of the equivalent sphere was plotted to help in comparing distributions along the different axes. For obtaining the equivalent sphere distribution, Equation (5) was applied with R = 1/Cmean, Cmean being the mean curvature estimated from the eight considered images.
For a coordinate angle of about π/2, AD(αz) is significantly smaller than the distribution of the equivalent sphere (and significantly smaller than AD(αx) and AD(αy)). This indicates that fewer normals are orthogonal to the z axis than are orthogonal to the other axes. This observation is consistent with the values of the distributions near 0 and π and indicates a slight but persistent anisotropy along the z axis.
This slight packing along the vertical direction suggests gravity effects during metamorphism. They should be taken into account to find out and simulate the mechanisms implied in isothermal metamorphism of snow.
4.4. Curvature evolution
Curvature computations were applied on ten microtomographic images. For each processed image, the mean curvature distribution HD(C) was estimated and is plotted in Figure 5d. In this graph one can see:
Curvature evolution during isothermal metamorphism of a dry snow sample. Grains are clearly growing and rounding during the metamorphism. (a–c) First stage (a), intermediate stage (b) and last stage (c) of the isothermal experiment. Image edges are 256 voxels (~2.5 mm) wide. (d) The evolution of curvature distribution HD(C) during the metamorphism.
a strong sharpening of the distribution, which denotes the rounding and smoothing of shapes
a decrease of the average mean curvature, which denotes the increase of the average grain-size
no significant evolution for negative curvatures
a wide and asymmetrical peak at the beginning of the metamorphism. This distribution is typical of fresh snow due to the presence of large planes (zero curvature) and acute shapes (high curvature) (see Fig. 5a)
an acute and symmetrical distribution at the end of the experiment, typical of rounded grains (see Fig. 5c).
5. Conclusion
Geometrical analysis tools have been presented and applied to an experiment monitoring the isothermal metamorphism of natural snow in three dimensions. The evolutions of porosity, SSA, anisotropy and curvature distributions have been obtained and discussed, showing a correct description of the well-known behaviour of an aging snow layer. A short-term application would be a quantitative calibration of the present empirical laws of grain coarsening and packing used in snow-cover models. Additionally, this documented dataset of the isothermal metamorphism constitutes a valuable tool for guiding basic and applied research in snow physics.
Presently, only a small part of the raw data from this experiment is actually exploited. To avoid the many theoretical problems due to sampling below the representative elementary volume, the presently developed techniques will have to be applied to the full-resolution dataset, especially for studies related to packing, heat transfer and micromechanics. Finally, these measurements provide quantitative data for the validation of metamorphism models and offer interesting prospects for improving models and understanding the physical phenomena that occur in snow microstructure.
Acknowledgements
We thank X. Thibault and the team of line ID19 at the ESRF for the valuable experimental support.

