


Introduction
Sediments and speleothems deposited within caves have the potential to record key periods of cave formational history that define different stages of speleogenesis (Klimchouk et al., Reference Jaqueto, Trindade, Hartmann, Novello, Cruz, Karmann, Strauss and Feinberg2000), often capturing the oldest stages of Pliocene–Quaternary landscape evolution (White, Reference Watanabe and Nakai1988; Anthony and Granger, Reference Anthony, Granger, Harmon and Wicks2006; Rixhon, Reference Porat, Duller, Roberts and Wintle2023). Such cave formation histories can give valuable insight into how fluviokarst landscapes evolve (e.g., White, Reference Watanabe and Nakai1988; Anthony and Granger, Reference Anthony, Granger, Harmon and Wicks2006; Audra and Palmer, Reference Audra, Palmer, Shroder and Frumkin2013) and can elucidate competing or complementary geomorphic factors such as the potential climate controls on base-level changes and sediment production (Wegmann and Pazzaglia, Reference Thompson and Oldfield2009; Marshall et al., Reference Ludwig and Paces2021) or the variable bedrock erosion resistance on the rates of passage incision and broader geomorphic exhumation (Keen-Zebert et al., Reference Hudson and Turner2017).
Studies using a variety of geochronometry techniques have been used to constrain the age of cave sediments or speleothems (Schmidt, Reference Rodrigues, Keen-Zebert, Shepherd, Hudson, Bitting, Johnson and Langstone1982; White, Reference Watanabe and Nakai1988; Granger and Muzikar, Reference Granger, Kirchner and Finkel2001; Richards and Dorale, Reference Paces, Palmer, Palmer, Long and Emmons2003; Fairchild et al., Reference Dorale, Lawrence, Ito and Gonzalez2006; Woodhead et al., Reference Webb, Fabel, Finlayson, Ellaway, Shu and Spiertz2006; Arnold et al., Reference Arnold, Demuro, Pares, Perez-Gonzalez, Arsuaga, Bermudez de Castro and Carbonell2015; Spötl and Boch, Reference Rovey, Balco, Forir and Kean2019; Wendt et al., Reference Van Arsdale, Cox, Lumsden and Kwan2021; Rixhon, Reference Porat, Duller, Roberts and Wintle2023). However, those studies often employ a specific dating method that limits the resulting information to a single aspect of speleogenesis. The application of multiple geochronologic techniques provides a more comprehensive understanding of the age range of speleogenic events by utilizing a wider variety of materials and providing independent corroboration of the results obtained by different dating systems (e.g., Stock et al., Reference Sasowsky, White and Schmidt2005). This study applies four dating methods: cosmogenic nuclides (26Al/10Be), U-series (230Th-234U-238U) disequilibrium, thermally transferred optically stimulated luminescence (TT-OSL), and paleomagnetism, to sediment and speleothem deposits preserved in Fitton Cave in northern Arkansas of the south-central United States. Formed in a small tributary in the western headwaters of the Buffalo River drainage, the Fitton Cave record documents more than 2 million years of speleogenic history. These results have implications for, and add to, a growing number of studies that document the pace and controls of geomorphic development of the Ozark Plateau region of the southern North American midcontinent (Beeson et al., [Reference Beeson, McCoy and Keen-Zebert2017]; Keen-Zebert et al., [Reference Keen-Zebert, Hudson, Shepherd and Thaler2017]; Kim et al., [Reference Kim, Weber, Seong, Reminga-DeYoung and Yu2023]; Rodrigues et al., [Reference Rodrigues, Keen-Zebert, Shepherd, Hudson, Bitting, Johnson and Langstone2023]) and reflect the importance of the Early to middle Pleistocene glacial cycles (Balco and Rovey, [Reference Balco and Rovey2010]; Rovey and Balco, [Reference Rovey, Balco, Ehler, GIbbard and Hughes2011]) on cave sediment aggradation and hydrogeologic processes.
Geologic Setting
The study area lies in the watershed of the Buffalo River in the southern part of the Ozark Plateau physiographic province (Fenneman, 1928) in northern Arkansas, near the junction of the Springfield Plateau and Boston Mountains physiographic subprovinces (Fig. 1). Fitton Cave lies within the western headwaters of Buffalo National River, a river-corridor park managed by the National Park Service. The cave system (Fig. 1) lies in the Cecil Creek sub-catchment about 1.5 km north of the Buffalo River, with the sub-catchment comprising less than 2% of the full river watershed area of 3477 km2. The cave contains nearly 13 km of mapped passages that span an elevation range of about 90 m (Fig. 2). The Cecil Creek sub-catchment exposes gently dipping Ordovician, Mississippian, and Pennsylvanian sedimentary strata (Hudson et al., Reference Harmand, Adamson, Rixhon, Jaillet, Losson, Devos, Hez, Calvet and Audra2011; Hudson and Turner, Reference Guérin, Mercier, Nathan, Adamiec and Lefrais2014). The cave passages are hosted within the Mississippian Boone Formation (Hudson et al., Reference Harmand, Adamson, Rixhon, Jaillet, Losson, Devos, Hez, Calvet and Audra2011), whose lithology consists of limestone with variable chert content. Multiple passage levels are recognized within the Fitton Cave and are arranged in several stacked, gently sloping passages interrupted by a few steeply inclined passages (Fig. 2). The highest subhorizontal passages are the Crystal Passage and the slightly lower Upper East Passage that merge westward with the Fitton Entrance Passage (Fig. 2A). Those passages likely represent former hydrographic base levels that formed within a few meters of past water table elevations (e.g., Palmer, Reference Paces, Hudson and Hudson1987; Audra and Palmer, Reference Audra, Palmer, Shroder and Frumkin2013). An active cave stream is present in the southeast part of 21 Jumps Passage. The stream merges with the Lower East Passage, where it descends to its lowest elevation at its southeast end, eventually discharging about 30 m lower at the Fitton Spring outlet, whose hydrologic connection to the cave stream has been confirmed from dye tracer studies.
Geologic map of study area showing the projection of mapped underground Fitton Cave passages in Boone Formation to the surface as well as speleothem and sediment sampling sites (adapted from Hudson and Turner [Reference Hudson and Turner2014] and Paces et al. [Reference Paces, Hudson, Hudson, Turner, Bitting, Sugano, Kuniansky and Spangler2017]). Cross section for endpoints A–A′ is shown on Figure 9. Inset shows the Ozark Plateau province in southern Missouri and northern Arkansas, consisting of the St. Francois Mountains (SFM), Salem Plateau (SaP), Springfield Plateau (SpP), and Boston Mountains (BM), and the location of Buffalo National River (blue solid line labeled BNR) and Fitton Cave (red star labeled FC). Blue dashed line is southern limit of Laurentide glaciation from Rovey and Balco (Reference Rovey, Balco, Ehler, GIbbard and Hughes2011). Black stars show geochronology sites from Upland Complex terraces of ancestral Mississippi River studied by Odom et al. (Reference Odom, Hofmann, Van Arsdale and Granger2020). State abbreviations are Arkansas (AR), Illinois (IL), Kansas (KS), Oklahoma (OK), Missouri (MO), Mississippi (MS), Tennessee (TN).

Three-dimensional digital elevation model of Cecil Creek catchment that includes a representation of Fitton Cave passages, color-coded by elevation range. Both inclined view (A) and subhorizontal view (B) are shown with 2× vertical exaggeration. (A) Inclined view, looking downward toward the north-northwest, with sampling localities highlighted as FE, Fitton entrance; MS, Missile Silo; TR, T-Room, OP, Organ Pipe; LS, Labyrinth South, DDPP, Double Drop Pit Passage. (B) Subhorizontal view looking toward north-northeast highlighting multiple levels of gently inclined passages that comprise the cave system.

Cave-sediment deposits up to several meters thick are preserved within parts of the subhorizontal passages and consist of basal cobble- to gravel-conglomerate beds overlain by finer sand, silt, and clay beds (Fig. 3). Cobbles and pebbles are mostly rounded sandstone clasts with lithologies like those from Mississippian and Pennsylvanian bedrock formations exposed in steep-sided tributaries upstream of the cave (Fig. 1), although subangular chert clasts derived from the Boone Formation are also present. The coarse conglomerate deposits within the cave were most likely deposited from subsurface streamflow within epiphreatic zones (Bosch and White, Reference Bosch, White, Sasowsky, Lylroie and Bosch2007; Audra and Palmer, Reference Audra, Palmer, Shroder and Frumkin2013) within a few meters of hydrologic base levels. In contrast, the finer-grained sediment overlying the conglomerates may have been deposited during periods of temporary higher paleohydrologic base levels that inundated previously unsaturated passages, during intermittent floods, or in water that was ponded behind a roof collapse (Bosch and White, Reference Bosch, White, Sasowsky, Lylroie and Bosch2007; Farrant and Smart, Reference Fairchild, Smith, Baker, Fuller, Spötl, Mattey, McDermott and E.I.M.F2011).
Representative photographs of Fitton Cave sediment deposits. Labeled sample numbers are keyed to Tables 1–4. (A) Lower gravel deposit draped by flowstone overlain by finer sediment at the Fitton Entrance locality’; (B) lower gravels with interbedded sands constituting the upper sequence at the main passage of the Missile Silo locality; (C) basal conglomerate of lower sequence in a side passage of the Missile Silo locality; (D) conglomerate exposed at the base of the T-Room section; (E) sediments exposed in the upper part of T-Room section; (F) layered sediments and flowstone exposed at the South Labyrinth locality; and (G) 10-cm-thick layer of flowstone capping clay and coarser sediments at the upper part of the Double Drop Pit Passage section.

A variety of speleothems are also present in the cave passages (Fig. 4). The cave sediments are commonly capped by layers of calcite flowstone or gypsum evaporative crusts. Less commonly, such flowstone layers are intercalated within sediment intervals. Because flowstones are derived from gravity-controlled vadose flow, their presence indicates cessation of active sedimentation and stabilization of the underlying deposits, at least for time periods long enough for flowstone to accumulate. In some areas, sediment removed by subsequent episodes of incision has left older flowstone layers exposed or attached to the ceiling without support from below. Other common forms of speleothems were deposited under vadose flow conditions and include stalactites, stalagmites, cave bacon, and helictites. Although uncommon, speleothems in an annex passage near the Double Drop Pit Passage locality suggest either precipitation of travertine under phreatic conditions or postdepositional corrosion of earlier-formed vadose deposits by calcite-undersaturated water (Fig. 4G, described in more detail later).
Photographs of representative Fitton Cave speleothem deposits sampled for U-series disequilibrium dating (Paces et al., Reference Paces, Hudson and Hudson2023). Labeled sample numbers are keyed to Table 2. (A) Fragments of coarse travertine flowstone (sample BNR-FC1-A and BNR-FC1-B) from the Fitton Entrance locality (Figure 3A); (B) polished slab of a broken stalagmite (sample BNR-FC11) from the Missile Silo locality showing internal growth layering and subsample locations; (C) polished slab of a broken stalagmite (sample BNR-FC12) from Organ Pipe locality showing subsample locations; (D) photograph of abundant vadose speleothems formed along dripping fractures at Needle’s Eye near the Organ Pipe locality (humans in upper left for scale); (E) polished slab of 10-cm-thick travertine flowstone layer (sample BNR-FC8) capping sediments at the main Double Drop Pit Passage (DDPP) locality (Figure 3G); (F) polished slab of banded flowstone (sample BNR-FC7) from the DDPP annex passage showing subsample locations; (G) photograph showing relations between different speleothem and sediment deposits from DDPP annex passage, including banded travertine coating BNR-FC6 used for dating; and (H) photograph of flowstone deposits filling fissure in bedrock (including sample BNR-FC7) that originally formed on top of sediments that have since been removed by incision.

Methods
Samples of cave sediments, flowstones capping or intercalated with sediment, and vadose zone speleothems were collected from several localities within Fitton Cave for geochronologic and geochemical study. The preserved sediment sections evaluated in this study were found in the higher-elevation parts of the Crystal, Upper East, and Fitton Entrance Passages that are thought to represent earlier-formed phreatic passages. The most complete sediment exposures (Fig. 5) are preserved at three locations (Missile Silo, T-Room, Double Drop Pit Passages) where postdepositional incision to intersecting lower passages has exposed the sediment sections to their bedrock floors. Brief descriptions of the sediment and speleothem sampling localities are given in the “Results and Locality Summaries” section, progressing from the western entrance eastward. Because the cave is a protected natural asset within Buffalo National River, only broken stalagmites or stalactites pieces were collected for U-series dating. Although these broken pieces could not be linked to their original growth sites, it is assumed that they originated in the passage rooms near their collection sites.
Stratigraphic sections for (A) Missile Silo, (B) T-Room, (C) Double Drop Pit Passage localities aligned on elevation, as estimated from cave survey data. Height of samples that provide age constraints within the stratigraphic sections indicated by leaders.

Brief summaries for the four analytical methods employed in this study are provided here. Additional details are given in the Supplementary Material.
Cosmogenic nuclide burial dating
Seven gravel samples were collected in the cave for cosmogenic burial dating. Each sample comprised >50 sub-equally sized clasts of quartz-rich sandstone to reflect the catchment average cosmogenic nuclide concentrations at the time of burial. Amalgamated samples were chosen because the deep burial does not require isochrons constructed from individual clasts and because the average concentration is useful for determining paleo-erosion rates at the time of burial. Gravel-sized clasts were chosen because they best represent active streams and are unlikely to be easily remobilized within the cave. Clasts were crushed and homogenized, then purified by selective dissolution in hot, agitated 1% HF/HNO3 and gravimetric separation in lithium heteropolytungstate. Between 30 and 40 g of the purified quartz were dissolved in 5:1 HF/HNO3 and spiked with ∼0.25 mg of 9Be carrier solution prepared in-house from phenacite (Be2SiO4). After collection of an aliquot for determining Al concentrations, fluorides were evaporated with the addition of 1 ml of H2SO4 as a keeper solution. Amphoteric Al and Be were separated by precipitation of interfering elements at pH 14. The two elements were then separated and purified by ion exchange in 0.4 M oxalic acid, followed by precipitation as hydroxides with NH4OH. Beryllium was coprecipitated with trace EDTA to remove any remaining contaminants. Aluminum was dried as the chloride salt and calcined by flame to Al2O3, while beryllium was dried as the nitrate and calcined by flame to BeO. The oxides were mixed with niobium powder and loaded into stainless steel cathodes for analysis by accelerator mass spectrometry at Purdue Rare Isotope Measurement Laboratory, against standards prepared by Nishiizumi ([Reference Nishiizumi2004]; Nishiizumi et al., [Reference Nishiizumi, Imamura, Caffee, Southon, Finkel and McAninch2007]). Stable aluminum concentrations were measured by Inductively Coupled Plasma Optical Emmssion Spectroscopy.
A simple burial dating method was used to determine sediment depositional ages, assuming that the cave sediments had sufficient overburden to effectively shield them from continued cosmogenic nuclide production after burial (Granger and Muzikar, Reference Granger, Kirchner and Finkel2001). Because postburial production would make the interpreted ages appear too young, simple burial ages calculated this way are considered minimum burial ages. However, all sample locations are overlain by at least 50 m of bedrock, which precludes significant production in these subterranean sediments. We assume that the samples were derived from a steadily eroding landscape, so that the cosmogenic nuclide concentrations can be modeled using Eq. 1 as a close approximation,
 \begin{equation}N_i = \left[ \frac{P_i}{\frac{1}{\tau_i} + \frac{\rho D}{\Lambda}} \right] e^{-\left(\frac{t}{\tau_i}\right)}\end{equation}
where t represents the time since burial, the subscript i represents either 26Al or 10Be, N represents concentration of the cosmogenic nuclide in the quartz, P represents the production rate at the surface in the quartz source area, τ represents the radioactive mean life, ρ represents rock density, D represents the denudation rate at the landscape surface in the source area, and Λ represents the penetration length of secondary cosmic rays. In Eq. 1, we make the simplifying assumption that all cosmogenic nuclide production is by nucleon spallation with a penetration length Λ = 160 g/cm2, ignoring minor production by muons. Simultaneous solution of Eq. 1 for 10Be and 26Al yields the simple burial age as well as the paleo-denudation rate at the time of sediment deposition. We use P26/P10 = 6.8, P10 = 5.6 per g/yr taken as the average production rate over the past 2 million years calculated using LSD nucleon scaling of Lifton et al. (2014), τ26 = 1.02 ± 0.03 Ma (Nishiizumi, Reference Maxbauer, Feinburg and Fox2004), τ10 = 2.005 ± 0.017 Ma (Chmeleff et al., Reference Cheng, Edwards, Shen, Polyak, Asmerom, Woodhead and Hellstrom2010; Korschinek et al., Reference Keen-Zebert, Hudson, Shepherd and Thaler2010), and ρ = 2.6 g/cm3 for calculating denudation rates.
The concentrations of cosmogenic nuclides (26Al and 10Be) and simple burial ages are reported in Table 1.
Cosmogenic nuclide results.

a DDPP, – Double Drop Pit Passage.
a Corrected b Corrected for a 26Al/27Al blank of (0.6 ± 0.9) ×x 10−15, 0.2–-1.5% of the total measured 26Al/27Al for the samples.
b Corrected c Corrected for a 10Be/9Be blank of (6.6 ± 1.4) ×x 10−15, 3–-7% of the total measured 10Be/9Be for the samples.
U-series disequilibrium
U-Th disequilibrium dating was performed on samples of calcite flowstone or gypsum crust that cap or were intercalated with clastic sediments, as well as broken stalagmites and travertine vein material. Preliminary results were described in Paces et al. (Reference Odom, Hofmann, Van Arsdale and Granger2017). A more recent and complete compilation of data as well as field and laboratory sampling information are available electronically (Paces et al., Reference Odom and Granger2023). In addition to U and Th isotopic data used to determine 230Th-U disequilibrium dates, the same samples were analyzed for radiogenic Sr isotopes (87Sr/86Sr), along with stable isotopes of oxygen and carbon on a subset of calcite layers from several of the same stalagmite samples. Analytical methods as well as results for quality control standards are described in detail elsewhere (Paces et al., Reference Ogg, Gradstein, Ogg, Schmitz and Ogg2020, Reference Odom and Granger2023) and summarized here.
Subsamples of carbonate speleothems were obtained from polished cross sections, most commonly by excavating narrow trenches along microstratigraphically bound layering using a 1-mm-diameter rotary dental bur. Between 0.016 and 0.131 g (median = 0.034 g) of the resulting powdered material were digested using high-purity nitric acid after addition of known amounts of a mixed 229Th-233U-236U tracer solution. Subsamples commonly contained little or no silicate detritus: however, when present, any traces of silicate residue were dissolved with hydrofluoric acid and combined with the initial nitric digestion to avoid laboratory U/Th fractionation. Purified salts of U, Th, and Sr were obtained from a single digestion using ion-chromatographic separation.
All U-Th and Sr isotope measurements were made on a Thermo Finnigan™ Triton thermal-ionization mass spectrometer at U.S. Geological Survey laboratories in Denver, Colorado. Both U and Th measurements (236U/235U, 234U/235U, 232Th/229Th, and 230Th/229Th) were made in peak-jumping mode using a single discrete dynode secondary electron multiplier behind a retarding potential quadrupole energy filter, converted to atomic 236U/238U and 234U/238U assuming an atomic 238U/235U of 137.88 (Steiger and Jäger, Reference Rovey, Balco, Ehler, GIbbard and Hughes1977), and reported as activity ratios (calculated using decay constants from Steiger and Jäger [Reference Rovey, Balco, Ehler, GIbbard and Hughes1977] and Cheng et al. [Reference Chapot, Roberts, Duller and Lai2013]). Unspiked Sr measurements (84Sr, 86Sr, 87Sr, and 88Sr) were run in dynamic triple-peak-jumping mode using static Faraday cup measurements in each jump. Primary standards (NIST 4321B and NIST 987) were used to normalize measurements for instrument bias, and secondary standards were used to evaluate total chemical and data-reduction procedures. All analytical uncertainties are given at the 95% confidence level (2σ).
Uranium-series dates were calculated after measured activity ratios were corrected for non-authigenic 230Th/238U and 234U/238U components using the measured [232Th/238U] (square brackets denote activity ratios) to mathematically subtract the appropriate amount of an assumed detrital endmember and obtain the composition of the “pure” authigenic endmember (Ludwig and Paces, Reference Li and Li2002). Dating results for an in-house Pleistocene coral standard processed in an identical manner as unknowns resulted in ages that were within analytical uncertainty of the 119.6 ± 1.9 ka average value reported by Watanabe and Nakai (Reference Stock, Granger, Sasowsky, Anderson and Finkel2006).
A summary of 230Th/U ages and initial 234U/238U activity ratios along with model 234U/238U ages for Fitton Cave speleothem samples are reported in Table 2. The full suite of concentrations and U- and Th-isotopic compositions for the same materials along with quality control assessments are available elsewhere (Paces et al., Reference Odom and Granger2023).
Calculated 230Th/U ages and initial 234U/238U activity ratios, model 234U/238U ages with the initial [234U/238U] values used to calculate model ages, and error-weighted mean U-series ages for speleothem samples from Fitton Cave, Buffalo National River Park Unit, northern Arkansas.a Full data set is available at https://doi.org/10.5066/P9785SCJ.

a Full dataset is available at https://doi.org/10.5066/P9785SCJ. XS_230Th, excess 230Th unsupported by 234U present in the sample; nc, not calculated.
b Site ID: FE = Fitton Entrance; OP = Organ Pipe; TR = T-Room; LS = Labyrinth, south; DDP-a = Double Drop Pit Passage, annex; DDPP-m = Double Drop Pit Passage, main; MS-a = Missile Silo, annex; MS-m = Missile Silo, main; ENE = east of Needle’s Eye.
XS_230Th = Excess 230Th unsupported by 234U present in the sample; nc = not calculated
Thermally transferred optically stimulated luminescence
Four samples were collected from freshly excavated surfaces of sand under dim red-light conditions and transferred into opaque black bags for transport. Preparation and analysis of OSL samples was carried out at the Desert Research Institute Luminescence Laboratory in Reno, Nevada, using standard procedures for coarse-grained quartz separation described in Rodrigues et al. (Reference Richards and Dorale2023).
The gamma dose rate contribution to each sample site was assessed using bulk sediment that was collected from an ∼30 cm annulus around each sample site. These materials were analyzed for concentrations of U, Th, and K using inductively coupled plasma mass spectrometry and inductively coupled plasma atomic emission spectrometry analyses by ALS Geochemistry. Small subsamples (∼30 g) of each specimen used for TT-OSL dating samples were also analyzed for U, Th, and K using the same methods as described earlier to assess beta dose rate homogeneity. Dose rate calculations applied dose rate conversion factors from Liritzis et al. ([Reference Liritzis, Stamoulis, Papachristodoulou and Ioannides2013]), estimated moisture content over the burial period (5 ± 3%), and a cosmic dose rate contribution following Prescott and Hutton ([Reference Prescott and Hutton1994]). All annual dose rates incorporate an internal alpha and beta contribution of 10.5 μGy/yr (Rink and Odom, [Reference Rink and Odom1991]). Additional details concerning dose rate calculations are listed in the footnotes of Table 3.
A compilation of equivalent doses, dose rates, and calculated ages for four Fitton Cave samples.a Equivalent doses were determined using a TT-OSL protocol on multigrain aliquots and incorporate a 79.7 ± 11.3 Gy residual dose subtraction based on the results of modern sample BUFF052. Refer to Methods section for details.

a Equivalent doses were determined using a thermally transferred optically stimulated luminescence (TT-OSL) protocol on multigrain aliquots and incorporate a 79.7 ± 11.3 Gy residual dose subtraction based on the results of modern sample BUFF052. Refer to “Methods” for details.
b Equivalent doses were calculated using the average dose model (Guérin et al., 2017) and incorporate a σm of 0.12.
c U and Th samples were fused with lithium borate and measured with ICP-MS. K2O was measured on bulk sample with inductively coupled plasma atomic emission spectrometry ICP-AES and converted to % K. U, Th, and K values reported here were measured from a small subsample of the dating sample.
d Beta dose rates are calculated using the grain- size attenuation factors of Guérin et al. ([Reference Guérin, Mercier, Nathan, Adamiec and Lefrais2012]) and etch attenuation factors of Brennan ([Reference Brennan2003]).
e Gamma dose rates were determined based on U, Th, and K contents from an average bulk sample collected from a 30 cm radius around the sample site.
f Cosmic dose rates were calculated according to Prescott and Hutton ([Reference Prescott and Hutton1994]) and consider the thickness of overburden at each site and an average overburden density of 2.5 ± 0.2 g/cm3.
g Dose rates were calculated using the conversion factors of Liritzis et al. (Reference Liritzis, Stamoulis, Papachristodoulou and Ioannides2013) and are shown rounded to one decimal place; ages were calculated using values prior tobefore rounding. Dose rates were calculated assuming a water content (expressed as % dry mass) of 5 ± 3%. Total dose rates include an internal dose rate of 0.002 ± 0.001 Gy/ka, which was calculated based on assumed internal U and Th concentrations in the quartz of 0.0665 ± 0.0214 ppm and 0.1135 ± 0.0424 ppm, respectively (Rink and Odom, Reference Rink and Odom1991).
*h BUFF054 had a TT-OSL signal that was fully saturated. The reported De is an average of the 2*D 0[Reference Guérin2017] values (i.e., the saturation limit) for 10 aliquots. The reported age should be interpreted as a minimum age for this sample.
Previous luminescence dating work in the Buffalo River watershed has shown that the upper limit for conventional OSL dating is ∼230 Gy (∼125 ka for dose rates typically found in Buffalo River terrace deposits) (Rodrigues et al., Reference Richards and Dorale2023). Rodrigues et al. (Reference Richards and Dorale2023) tested and successfully applied a TT-OSL protocol following the methodology of Porat et al. (Reference Paces, Hudson, Hudson, Turner, Bitting, Sugano, Kuniansky and Spangler2009) to define the age of medial-age terrace deposits (∼250 ka) along the river. The same protocol was adapted for the Fitton Cave sediments and is described in more detail in the Supplemental Information file.
Owing to the relatively slow bleaching rate of the TT-OSL signal in nature (e.g., Neudorf et al., Reference Marshall, Roering, Rempel, Shafer and Bartlein2019; Rodrigues et al., Reference Richards and Dorale2023), all final equivalent dose (De) values also consider a residual dose (i.e., an inherited age). A modern analog sample was collected from sediment along the active cave stream of the 21 Jumps Passage and yielded a TT-OSL De of 79.7 ± 11.3 Gy (n = 8; min. = 56.2 Gy, max. = 92.3 Gy), which was subtracted from all TT-OSL De values before final age calculation. This approach to correcting the De assumes that the bleaching conditions of the modern cave stream sand closely represent those experienced by the Fitton Cave sediment dated in this study. The results of the TT-OSL analyses are summarized in Table 3. De distributions are presented as kernel density estimate plots and radial plots in Supplementary Figure S2-1.
Relative to the main OSL trap, the thermal lifetime of the TT-OSL source trap is known to vary significantly between regions, with reported lifetimes ranging from as low as 0.16 Ma in Luochuan, China (Chapot et al., [Reference Chapot, Roberts, Duller and Lai2016]) to as high as 861 Ma in the U.S. midcontinent (Brown and Forman, [Reference Brown and Forman2012]). To define the kinetic parameters of the TT-OSL trap and evaluate the practical upper dating limit of the TT-OSL signal from Fitton Cave sediments, we carried out isothermal decay experiments following the protocol described in Li and Li ([Reference Li and Li2006]). A 7 mm aliquot of sample BUFF056 was first bleached using blue LEDs for 4000 s at 160°C and then sensitized by heating to 500°C for 200 s. Subsequent TT-OSL measurements were made after isothermal holding temperatures (260°C, 280°C, and 300°C), with durations ranging from 10 to 2560 s (refer to Supplementary Table 2-2 for details). The background-subtracted TT-OSL intensities were plotted as a function of isothermal holding duration for each temperature and fit with an exponential curve to define three isothermal decay constants, λ, and were used to generate an Arrhenius plot of ln(1/λ) on the y-axis and 1/kbT on the x-axis, where k b is the Boltzmann constant (in eV/K) and T is the holding temperature (in K). The linear fitting parameters of this relationship were used to define the thermal activation energy, E (eV), and frequency factor, s (s −1) of the TT-OSL source trap (Supplementary Fig. S2-2). Trap thermal lifetime (τ, in s) was estimated using the empirically derived kinetic parameters E and s and the following equation (Aitken, [Reference Aitken1985]):
 \begin{equation}\tau = {s^{ - 1}} \cdot {\text{ }}\frac{E}{{{e^{{k_b}T}}}}\end{equation}
The results of the isothermal decay experiments are summarized in Supplementary Figure S2-2 and suggest that the thermal lifetime of the TT-OSL source trap is 107.7 yr at 10°C. As a result, the TT-OSL signal is considered thermally stable for ∼5 Ma at 10°C (one-tenth of the thermal lifetime; Aitken, Reference Aitken1998) for dating purposes. Thus, for Fitton Cave sediments, the practical upper dating limit of the TT-OSL signal is defined by saturation of the source trap (avg. 2*D 0 = 1322 Gy [N = 62]) rather than its thermal stability.
Paleomagnetism
Samples for paleomagnetic analysis were collected at eight sites from five localities and processed at the U.S. Geological Survey Rock and Environmental Magnetism Laboratory, Denver, Colorado. Details of the paleomagnetic sampling, laboratory analysis, and magnetic polarity interpretations are included in the Supplementary Material. Whereas remanent magnetization (RM) does not provide numerical ages for the cave sediments, it can help constrain the ages of sediments, as those that retain a reversed-polarity magnetic component are most likely older than the 0.77 Ma Brunhes-Matuyama polarity boundary (e.g., Ogg, Reference Nishiizumi, Imamura, Caffee, Southon, Finkel and McAninch2020). Early investigations of the magnetostratigraphy in cave sediments (e.g., Schmidt, Reference Rodrigues, Keen-Zebert, Shepherd, Hudson, Bitting, Johnson and Langstone1982; Sasowsky et al., Reference Rixhon, Braucher, Bourles, Peeters, Demoulin, Leanni and Team1995) mostly targeted fine-grained sediment horizons and interpreted them as retaining detrital remanent magnetization (DRM) acquired at or shortly after deposition. However, many cave sediments from areas with temperate and tropical climates are shades of red and orange (Fig. 3) that indicate significant content of hematite and goethite as well as ferrihydrite that converts to hematite over timescales of 105 to 106 yr (Maxbauer et al., Reference Marshall, Roering, Bartlein, Gavin, Granger, Rempel, Praskievicz and Hales2016). This suggests that such sediments may also acquire a component of secondary chemical remanent magnetization (CRM) carried by high-coercivity phases.
For the Fitton Cave samples, environmental magnetism parameters (Thompson and Oldfield, Reference Spötl, Boch, White, Culver and Pipan1986) suggest the importance of both low-coercivity minerals of probable pedogenic source (e.g., Jaqueto et al., Reference Hudson, Paces, Turner, Kuniansky and Spangler2016) as well as high-coercivity minerals derived from ferrihydrite maturation on the controlling magnetic mineralogy. A significant contribution from low-coercivity supraparamagnetic grains, typically magnetite or maghemite, is indicated by values of frequency dependence of magnetic susceptibility that mostly range from 8% to 10% (Supplementary Fig. S3-1B). However, values of the S parameter (Supplementary Fig. S3-1) ranging from 0.5 to mostly 0.75–0.82 also indicate important contributions from high-coercivity phases, likely hematite or goethite. The presence of those minerals is consistent with the common orange to red color of many of the Fitton Cave sediments (Fig. 3) as well as a high-coercivity component of the RM that was commonly evident during alternating-field (AF) demagnetization.
The RM carried by Fitton Cave samples responded in different manners to AF demagnetization. Most samples lost more than 50% of their magnetization after AF demagnetization to peak inductions of 15 mT. Given the indication from frequency dependence of magnetic susceptibility of a considerable fraction of supraparamagnetic grains in the samples (Supplementary Fig. S3-1B), this low-coercivity component is interpreted to be a viscous RM of modern age that does not indicate magnetic polarity at the time of sediment deposition. For RM that remained after AF peak inductions greater than 15 mT, samples responded in two manners. In some, there was continued removal of magnetization to peak inductions of 100 mT, decreasing the remaining component to less than 10% of the original natural RM in components of moderate coercivity that could record DRM. In the second behavior, little further magnetization was removed at higher demagnetization levels, indicating only a high-coercivity component remained that was likely carried by hematite or goethite that might carry a secondary CRM. However, if this potential secondary RM was of reversed polarity, it still requires that the sediment is older than the Brunhes-Matuyama transition. Because of the complicating factors in these interpretations, a qualitative quality factor (from highest A to lowest C) is included to indicate the interpreter’s (Hudson) confidence in the magnetic polarity assignments (Table 4).
Paleomagnetic data from Fitton Cave sediments.a

a Abbreviations: Notes: ss = sand; slt = silt; cl = clay; N/N0 = number of samples accepted/processed; Dec = declination; Inc = inclination; α95, cone of 95 percent cone of confidence; k = precision parameter; Method –PCA, principal component analysis; GCA = great circle analysis; Polarity R = reverse;, N = normal; Quality A = best;, B = intermediate; C = worst.
Results and locality summaries
Results for the four different geochronologic techniques are listed in Tables 1–4. The local passage morphologies and stratigraphic contexts for the studied sediment and speleothem deposits from six sample localities are discussed in the following subsections. Sample elevations above mean sea level (amsl) are estimated relative to reference stations surveyed by the Cave Research Foundation for sediment samples and in-place flowstone samples for comparisons within and among the different localities. Unconsolidated sand and sandstone cobbles that were collected along the active cave stream within the 21 Jumps Passage (about 299 m amsl) yielded young cosmogenic and TT-OSL dates, validating the assumptions of these methods.
Fitton Entrance
The westernmost sample locality (FE; Fig. 1) is located along the Fitton Entrance Passage (about 324 m amsl). The 3-m-high passage expands upward with a trapezoidal profile to a mostly flat, slightly scalloped ceiling that follows the bedrock bedding planes. The passage wall contains a 2-m-thick exposure of cave sediment (Fig. 3A) without an exposed bedrock base. Clastic sediments consist of a lower package of coarse-grained sand and gravel overlain by more finely layered sand and silt (Fig. 3A). Paleomagnetic analysis of a sample (15FC-1) from the upper, finer-grained sediments yielded a reversed magnetic polarity. A 5-cm-thick flowstone layer of coarse crystalline calcite appears to emanate from a small void in the wall ∼50 cm below the passage ceiling forming a drape over the lower gravels (Fig. 3A). The relation between the flowstone and the stratigraphically higher sandstone is less clear. Eight subsamples from the flowstone layer (BNR-FC1; Fig. 4A) yield 230Th/U dates ranging from 296 ± 9 ka to 760 +270/−170 ka (error-weighted mean of 408 ± 50 ka for n = 5) and model 234U/238U ages of 416 +87/−94 ka to 519 +81/−97 ka (error-weight mean model age of 456 ± 31 ka for n = 8). Paleomagnetic analysis of samples from a site (15FC-1) in finer-grained sediments that appear to overlie the intercalated flowstone yielded a reversed magnetic polarity. A thin calcite flowstone crust capping the sediment sequence (BNR-FC2) yielded 230Th/U dates ranging from 12.5 ± 0.4 ka to 38.4 ± 0.5 ka with an error-weighted mean of 37.2 ±2.1 ka (for n = 3).
The coarse-grained sediments at the base of the exposure must be older than both the overlying fine sediments and the draping flowstone layer. The >0.77 Ma age implied by the reversed polarity from the overlying finer-grained sediment interval provides an upper limit for the age of the underlying gravels. The U-series dates from the thick flowstone imply that the accumulation of coarse clastic sediment had stabilized and partially eroded by ∼400–460 ka, allowing vadose seepage to cover exposed gravels. The thin layer of flowstone capping the entire depositional sequence is considerably younger than the sediments, indicating vadose infiltration in the late Pleistocene. We conclude that sediment accumulated before the Brunhes/Matuyama boundary and that vadose flow occurred during several periods after that.
Missile Silo
Named for a large (30- to 50-cm-diameter) vadose zone speleothem column that spans the height of the main 10-m-wide, 3-m-high rectangular passage room, the Missile Silo locality (MS; Fig. 1) is located along the western part of the Upper East Passage. The vertical passage walls at the locality have shallow horizontal notches that transition to a mostly horizontal ceiling, with both notches and the ceiling following bedrock bedding. Within this large room, a small side passage descends to the north, exposing two different cave-sediment intervals that are separated by a 2-m-thick limestone bedrock ledge (Fig. 5A).
Upper sediment sequence
Sandstone cobbles (Fig. 3B) from the lowest part (about 315 m amsl) of the 3.8-m-thick upper sedimentary section yielded a cosmogenic age of 1.31 ± 0.19 Ma (UMS CO). A TT-OSL age from an upper sand horizon yielded an age estimate of 0.96 ± 0.11 Ma (BUFF058), whereas a paleomagnetic site (15MS-2) from a higher silt bed yielded a low-quality reversed-polarity determination. A poorly preserved flowstone draping the uppermost sediments from the northwest corner of the room (BNR-FC9 at about 320 m amsl) contained excess 230Th, implying postdepositional U loss. Present-day [234U/238U] values for both subsamples were less than 1.0 (0.9527 and 0.9846), complicating the selection of an initial [234U/238U] value to estimate model 234U/238U ages. Therefore, reliable U-series dates for the capping carbonate could not be estimated.
Sixteen subsamples from a large (42 cm) broken stalagmite (BNC-FC11; Fig. 4B) collected from the floor of the main Missile Silo room yielded 230Th/U dates ranging from 165.9 ± 2.1 ka to 242.6 ± 4.3 ka. Ages are generally consistent with internal microstratigraphic growth layering and indicate average linear growth rates of 2.8 mm/ka, but a much higher rate of 28.4 mm/ka during the most recent episodes of growth (BNR-FC11-u1 to BNR-FC11-u4; see data and microstratigraphic relations in Paces et al. [Reference Odom and Granger2023]). Stalagmite formation postdates passage formation and sediment deposition and provides a middle Pleistocene record for at least part of the vadose speleothem formation within the passage.
Lower sediment sequence
The lower sediment interval at the Missile Silo locality exposes a 1-m-thick basal cobble conglomerate (about 313 m amsl) locally overlain by red clay. The basal conglomerate (Fig. 3C) yielded a cosmogenic age of 0.72 ± 0.16 Ma (LMS CO). A statistically identical TT-OSL age of 0.73 ± 0.08 Ma (BUF056) was obtained from a sand bed within the conglomerate interval. A red clay interval (15MS-1) that overlies the basal gravel yielded an RM component with moderately inclined positive inclination, suggesting dominant normal polarity, but with a south-directed declination that might indicate the presence of a reversed-polarity component that was unresolved by demagnetization. Finely laminated flowstone is present, capping the lower sediment interval as well as filling matrix in the underlying gravels (BNR-FC9, see Paces et al., Reference Odom and Granger2023 for photos). Specimens exhibit varying amounts of secondary porosity interpreted at least in part as corrosion caused by inundation by postdepositional undersaturated water. Subsamples from four separate specimens had 230Th/U dates ranging from 347+120/−68 ka to 171 ± 20 ka with an error-weighted mean of 218 ± 22 ka.
The results from the Missile Silo locality indicate that the western end of the East Passage was filled by cobbles representing a hydrologic base level at 1.3 Ma with further aggradation of finer sediments continuing within the Matuyama reversed chron (at ages older than 0.77 Ma). A subsequent incision phase cut the small lower passage that was later filled with sediment at about 0.72 Ma. Vadose zone precipitation of speleothems continued intermittently at the locality after ∼240 ka.
T-Room
An incision near the intersection of the Upper East Passage with the lower, younger 21 Jumps Passage at the T-Room locality exposes a nearly 6-m-thick section of cave sediments (Figs. 3D and E, and 5B) within the Upper East Passage where it is about 15 m wide. The passage ceiling here is flat and extends about 2 m above the highest preserved sediment; the scalloped passage walls have horizontal ledges that parallel bedrock bedding. A basal cobble conglomerate (Fig. 3D) is overlain by a middle sand and silt interval and then overlain by an upper conglomerate layer (Fig. 3E) at the top of the sequence about 5 m above limestone bedrock. The sediments are capped by a 1- to 5-cm-thick crust of massive gypsum.
The lower coarse cobble deposit (about 310 m amsl) yielded a cosmogenic nuclide age of 2.15 ± 0.20 Ma age (LTR CO). A yellow sand bed about 1 m higher yielded a 1.24 ± 0.13 Ma TT-OSL date (BUFF021). A higher yellow sand bed yielded a reversed magnetic polarity (BNR-FC4B). An even higher sand bed yielded a normal magnetic polarity (site BNR-FC4A; Table 4), whereas the overlying conglomerate yielded a cosmogenic date of 1.07 ± 0.19 Ma age (UTR CO). Two subsamples of a nonlaminated, gypsum-rich crust capping the sediment (BNR-FC4) at 315.5 m amsl yielded much younger 230Th/U dates of 94.3 ± 1.9 ka and 23.9 ± 0.4 ka.
Age constraints for the T-Room deposits indicate that sediment aggradation began as early as 2.15 ± 0.20 Ma. The TT-OSL age of 1.24 ± 0.13 Ma for the sand in the lower part of the sequence agrees with its older than 0.77 Ma reversed magnetic polarity. The normal polarity of the higher sand bed may have captured Jaramillo subchron (between 1.07 Ma and 0.99 Ma; Fig. 6), because it is overlain by the second gravel whose deposition is dated by cosmogenic nuclides at 1.07 ± 0.19 Ma. The sediment sequence was capped by deposition of the much younger gypsum crust at less than 100 ka.
Comparison of dating results from Fitton Cave from six localities arranged from west (left) to east (right). Vertical bars extending from symbols represent 1-sigma errors for cosmogenic nuclide and TT-OSL dates and 2-sigma errors for U-Series dates are shown where the error limits exceed the symbol size. Paleomagnetic sites are vertically arranged to fit constraints from geomagnetic polarity timescale (Ogg, Reference Ogg, Gradstein, Ogg, Schmitz and Ogg2020), with arrows indicating age ranges relative to constraints from stratigraphic order within locality sediment sections. Depositional age range for Qtm river terraces along Buffalo River from Rodrigues et al. (Reference Rodrigues, Keen-Zebert, Shepherd, Hudson, Bitting, Johnson and Langstone2023). Ages for Central Missouri tills are from Balco and Rovey (Reference Balco and Rovey2010) and Rovey and Balco (Reference Rovey, Balco, Ehler, GIbbard and Hughes2011).

Organ Pipe
Located at about 320 m amsl along the Upper East Passage where it constricts from 12 m wide at the Organ Pipe (Figs. 1 and 2) locality to less than 1 m wide at the adjacent Needle’s Eye, the passage lacks exposure of cave sediment but is an area of enhanced vadose flow and speleothem deposition (Fig. 4D). Three broken stalagmite columns were collected for U-series dating from just east of a large vadose speleothem formation called the Organ Pipe (BNR-FC3A, BNR-FC3B, and BNR-FC3C) and a fourth (BNR-FC12) was from just east of the passage constriction called the Needles Eye. The microstratigraphy of calcite layering within the columns indicates the progression of upward growth within each of the columns (Paces et al., Reference Odom and Granger2023; Fig. 4C). Multiple U-series dates obtained from each piece generally conform to the internal stratigraphic age progression within analytical errors. The ranges of vadose speleothem growth for the two columns with intact growth tips are from 246 ± 4 ka to 280 ± 7 ka for BNR-FC3A (excluding BNR-FC3A-u1) and 239 ±6 ka to 255 ± 6 ka for BNR-FC3C (excluding BNR-FC3C-87.5). Ages are only slightly older for BNR-FC3B that is missing its youngest growth tip (269 ± 6 ka to 345 ±14 ka), but are much older for stalagmite BNR-FC12, ranging from 393 ± 24 ka to 448+48/−33 ka (8 subsamples yield an error-weighted mean 234U/238U model age of 410 ± 18 ka) (Paces et al., Reference Odom and Granger2023).
The U-series dates of 448 to 239 ka range for speleothems near Organ Pipe and Needles Eye demonstrate that cave incision in this portion of the Upper East Passage was well established by 410 ka and that this part of the cave remained above base level, allowing vadose zone speleothem construction throughout much of the remainder of the middle Pleistocene.
Labyrinth South
The Labyrinth South locality is at the termination of a short, narrow passage only a few meters wide that branches southeast and rises from the Labyrinth segment of the Crystal Passage (Figs. 1 and 2) to where it is plugged by cave sediments (Fig. 3F). A 1.8 m vertical wall at the back of the passage (about 340 m amsl) exposes fine-grained cave sediment consisting of clay, cemented sand, and thin carbonate flowstone layers interbedded within the sediments. A bed of dark-red clay midway through the sequence yielded a reversed magnetic polarity (BNR-FC5). The two different ∼1-cm-thick specimens of flowstone were not collected in place, so their stratigraphic relation with other sediments is unclear. Because of their substantial detrital Th corrections, subsamples yielded poorly constrained U-series dates as old as 410 ± 190 ka for BNR-FC5A and 146 ± 17 ka for BNR-FC5B (Table 2; photos and full data in Paces et al. [Reference Odom and Granger2023]). Both specimens show evidence of secondary corrosion of outer surfaces; however, internal layers remain solid and well preserved.
The sediment-filled passage of the Labyrinth South passage at elevations as high as 340 m amsl probably formed before 0.77 Ma based on the reversed polarity of the infilling sediment. Interbedded flowstone layers show evidence that the passageway sustained vadose flow during episodes when clastic sediment surfaces remained stabilized. Stratigraphic relations between the dated flowstone layers and the reverse-polarity mud layer are not known, but the flowstones most likely originated near the top of the section.
Double Drop Pit Passage
The Double Drop Pit Passage (DDPP) locality (Fig. 1) is a side passage that descends northward from the Crystal Passage, where it exposes a nearly 9-m-thick sequence of cave sediment capped by a travertine flowstone (Figs. 3G and 5C). The main Crystal Passage above the sediment filling is about 8 m wide and 4 m high with a rectangular to elliptical profile shape and flat ceiling controlled by bedrock bedding (Fig. 3G). For the preserved sediment section, a basal layer of gravels that overlies bedrock (at about 318 m amsl) yielded a cosmogenic date of 2.19 ± 0.19 Ma (LDDPP CO). Sand from beds collected near the same basal horizon as the cosmogenic lower sample had saturated TT-OSL signals and can only provide a minimum age of 0.74 ± 0.06 Ma (BUFF054) based on the empirically derived average saturation dose of the sample. A second thin gravel layer higher in the sequence (about 323 m amsl; Fig. 5C) yielded a cosmogenic date of 1.37 ± 0.20 Ma (UDDPP CO). A brown clay bed 0.9 m from the top of the sediment interval yielded a well-defined reversed magnetic polarity (DDPP-2). Six subsamples collected across the capping 10-cm-thick travertine flowstone (at about 325 m amsl) yielded 230Th/U dates at the upper limit of the method ranging from 742 +300/−170 ka to 452 +130/−68 ka (sample BNR-FC8 in Table 2). All subsamples have statistically indistinguishable ages precluding evaluation of age-microstratigraphic relations within the layer. Five subsamples (excluding BNR-FC8-4) yield an error-weighted mean age of 610 ± 79 ka (Supplementary Fig. S1-1).
A small annex passage descending on the south side of the main Crystal Passage room adjacent to the DDPP sediment section (Fig. 4H) exposes several generations of speleothems that are interpreted to record events after the main sediment aggradation cycle, reopening what may have been a sediment-clogged passage. An older generation of calcite forms finely laminated coatings on walls and filling fissures in bedrock limestone with older dripstones (cave bacon) localized on part of the passage ceiling (Fig. 4H). These older speleothems show evidence of postdepositional dissolution, presumably by subsequent submersion in undersaturated water. Blocky red clay that fills a pocket at the back of the room represents a likely flood deposit. Following deposition, most clay was removed, leaving an open space that was partially filled with water as a second generation of “popcorn”-like calcite crust formed below a phreatic water line about 20 cm lower than the ceiling.
Six subsamples distributed across a 2- to 3-cm-thick coating of laminated calcite (sample BNR-FC6; photos in Paces et al. [Reference Odom and Granger2023]) that grew away from a formerly present sediment substrate gave U-series dates that ranged from 756+270/−170 ka to 455+49/−35 ka (Table 2). Five of those subsamples collected from the bulk of the coating have statistically indistinguishable dates and yield an error-weighted mean 234U/238U model age of 666 ± 49 ka. Two loose pieces of banded travertine that originally filled a 10-cm-wide fissure within the same alcove wall (BNR-FC7A and BNR-FC7B) also were collected for U-series dating. Geopetal structures that are perpendicular rather than parallel to the vertical fissure walls were interpreted as evidence that the filling formed as flowstone in a vadose setting rather than as phreatic coatings below the water table. Four subsamples from BNR-FC7A gave 230Th/U dates ranging from 706 +290/−170 ka to 554+240/−110 ka and model 234U/238U ages of 679 ± 72 to 619 ±76 ka (Table 2), yielding an error-weighted mean model age of 651 ± 35 ka. In contrast, two subsamples from the second piece (BNR-FC7B) gave much younger dates of 137 ± 14 ka and 108 ± 7 ka. The red clay filling the floor of the alcove yielded a normal magnetic polarity (DDPP-1).
The sequence of deposits and their respective dating results exposed at DDPP and in the adjacent annex passage indicate that the Crystal Passage was filled by aggrading sediment beginning at 2.2 Ma, with a second phase of gravel deposition during a slightly higher base level at 1.2 Ma. Fine-grained sediment continued to aggrade above the second gravel before 0.77 Ma (reversed magnetic polarity near its top), after which sedimentation ceased, allowing capping of the sequence at 326 m amsl by flowstone with dates as old as 776 ka. Textural relations of speleothems in the adjacent annex passage suggest an oscillating but falling water table during the subsequent unclogging of the Crystal Passage. Older phreatic calcite coating preserved on walls and in fissure-fills as low as 319 m amsl were subsequently corroded by undersaturated waters, and a second phreatic line was established at about 317 m amsl. Consistently old U-series ages, averaging between about 650 and 670 ka, were obtained for both calcite generations (Fig. 4G), and the normal magnetic polarity of the clay, a likely flood deposit, also favors an age less than 0.77 Ma.
Discussion
The characterization of sediment and speleothem deposits in Fitton Cave as well as the geochronologic constraints provided from multiple analytical techniques provide new information on karst development and the potential broader links to past climate controls on geomorphic development in the southern Ozark Plateau region.
Multiple geochronologic techniques were required to capture the full age range of the Fitton Cave evolution. Cosmogenic dating of coarse basal siliciclastic sediments in Fitton Cave passages was critical for determining that formation of cave passages was initiated shortly before 2 Ma. Stratigraphically overlying as well as incised lower deposits dated by the same 26Al/10Be burial dating method also demonstrate younger episodes of coarse sediment deposition. Sand in the cave sediments proved to be too old for standard OSL dating. However, application of the TT-OSL technique was successful in yielding dates as old as 1.2 Ma. The determination of reversed magnetic polarity in intercalated fine sediments is also consistent with sediment ages greater than the last magnetic reversal at 0.77 Ma, whereas normal polarity determinations mostly suggested capture of magnetization in the Brunhes magnetic chron (<0.77 Ma), or a non-unique correlation to the Jaramillo magnetic subchron (1.07 to 0.99 Ma), as indicated by the stratigraphic relations exposed in the T-Room section (Fig. 5). Carbonate flowstone capping sediment sequences requires a period of fluvial stabilization of the substrate so that products of infiltration and vadose-flow processes can be preserved, thus providing a minimum age of alluvial accumulation. The U-series dating of younger speleothems provides constraints on the younger history of mostly vadose flow processes postdating active cave passage incision at that given level (Paces et al., Reference Odom, Hofmann, Van Arsdale and Granger2017).
Stages of Fitton Cave speleogenic evolution
Based on the geochronology results, three main stages are recorded in the evolution of Fitton Cave.
Stage 1: Pre-2.2 Ma—initial cave passage development
The earliest stage of cave development represents the period of initial dissolution of the highest Crystal and Upper East Passages, presumably near a hydrologic base level at the vadose–phreatic transition. The subhorizontal nature of these mapped passages (Fig. 2), as well as the lack of morphological features such as ceiling dissolution pendants (e.g., Farrant and Smart, [Reference Farrant and Smart2011]), argues against paragenetic passage growth above sediment in deep phreatic loops (e.g., Ford and Ewers, [Reference Ford and Ewers1978]; Calvet et al., [Reference Calvet, Gunnell, Delmas, Braucher, Jaillet, Häusellmann, Delunel, Sorriaux, Valla and Audra2024]). Formation of at least some of the rooms of Fitton Cave must predate deposition of 2.2 Ma coarse-grained sediments as implied by those dates for gravels above bedrock surfaces at both the T-Room and DDPP localities. Early passage dissolution may have only shortly predated the introduction of the coarse sediment by base-level streams, but this cannot be proven, and average elevations of Crystal Passage are slightly higher than those of the Upper East Passage (Fig. 2), suggesting its potentially earlier passage development.
Cave systems are common throughout karst regions of the Ozark Plateau, but geochronologic data documenting Early Pleistocene development of other epigenic cave passages are few. Published U-series isotopic dating of speleothems from Ozark caves have mostly documented late Pleistocene deposits (e.g., Dorale et al., [Reference Dorale, Lawrence, Ito and Gonzalez1998]; Denniston et al., Reference Denniston, Gonzalez, Semken, Asmerom, Baker, Recelli-Snyder, Reagan and Bettis1999, [Reference Denniston, González, Asmerom, Reagan and Recelli-Snyder2000]), but such speleothem records may significantly underestimate the time of initial passage formation, as demonstrated in this study and elsewhere (e.g., Stock et al., Reference Stock, Granger, Sasowsky, Anderson and Finkel2005). Cosmogenic dating and paleomagnetism were used to document cave sediments as old as 0.98 Ma in a small cave in the Springfield Plateau subprovince about 120 km north of the Buffalo River (Rovey et al., Reference Rovey, Balco, Forir and Kean2017). While documented Early Pleistocene cave records are uncommon in the Ozarks, the Fitton Cave record is consistent with the speleogenic history of large cave networks documented east of the Mississippi River (Schmidt, Reference Schmidt1982; Granger et al., Reference Granger, Pabel and Palmer2001; Anthony and Granger, Reference Anthony, Granger, Harmon and Wicks2006). The preservation of epigenetic passages older than 2 Ma in the Buffalo River drainage of the southern Ozarks may have been enhanced by the presence of overlying erosion-resistant Upper Mississippian and Lower Pennsylvanian clastic strata that hold up the northern extent of the Boston Mountains physiographic subprovince. Specifically for the Buffalo River area, a caprock formed by an internal sandstone member of the Lower Pennsylvanian Bloyd Formation has been demonstrated to control the rate of geomorphic evolution in the western part of the watershed (Thaler and Covington, Reference Thaler and Covington2016). This setting is similar to that of the Mammoth Cave system during its erosional emergence from the cover of overlying clastic strata in the Chester uplands (Miotke and Palmer, Reference Miotke and Palmer1972; Granger et al., Reference Granger, Pabel and Palmer2001) or for cave systems of the Cumberland River basin that emerged from beneath Cumberland Plateau strata (Anthony and Granger, Reference Anthony, Granger, Harmon and Wicks2006) during post-Pliocene erosion.
Stage 2: 2.2 Ma to less than 1.2 Ma—aggradation of sediments
The sediment intervals preserved within the Upper East and Crystal Passages preserve at least two aggradation cycles (Fig. 5). The influx of rounded coarse gravel and cobbles at 2.2 Ma preserved at the T-Room and DDPP localities includes sandstone lithologies that match those in local bedrock formations from the Cecil Creek catchment. These cobble deposits are overlain by 2–3 m of finer sand and silt that may have aggraded during subsequent flood events.
A second cycle of aggradation is recorded by gravel deposits preserved at several localities. Cosmogenic nuclide dates of 1.31 ± 0.19 Ma (Missile Silo), 1.07 ± 0.17 Ma (T-Room), and 1.37 ± 0.20 Ma (DDPP) for these horizons can be considered synchronous within statistical error, yielding an average age of 1.25 ± 0.15 Ma. An alternate interpretation is that the gravel conglomerate that caps the T-Room sequence (Fig. 3D) is a separate third pulse of coarse sediment input, as suggested by its younger 1.07 ± 0.19 Ma date and its stratigraphic position above a normal-polarity clay (Fig. 5) that could correlate to the 1.07–0.99 Ma Jaramillo subchron (Fig. 6). The 1.37–1.07 Ma age range (Table 1) also corresponds to a spike in cosmogenic paleo-denudation rates and is consistent with a greater abundance of sediment supply (Fig. 7). Deposition of finer sand, silt, and clay layers continued mostly within the Matuyama magnetic chron (older than 0.77 Ma) based on the reversed-polarity of upper fine-grained deposits at the FE, MS, SL, and DDPP localities as well as the 0.96 ± 0.11 Ma TT-OSL date from the upper Missile Silo locality (Fig. 6).
Paleo-denudation rate versus age for cosmogenic nuclide results. Blue band approximates background paleo-denudation rate (excluding 1.37–1.2 Ma spike), whereas dashed black line shows post–0.85 Ma valley incision rate. UMS, upper Missile Silo; LMS, lower Missile Silo; UTR, upper T-Room; LTR, lower T-Room; UDDPP, upper Double Drop Pit Passage; LDDPP, lower Double Drop Pit Passage; 21 Jumps, 21 Jumps Passage; Zunka, catchment averaged denudation rate from modern Buffalo River sediments (Zunka, Reference Zunka2018).

The aggradation of coarse cave sediment at 2.2 Ma and 1.25 Ma and continued finer-grained sedimentation extending to less than 1 Ma suggest a period of base-level stability, at least for the Cecil Creek catchment of the Buffalo River drainage. Base-level stability during the Early Pleistocene contrasts with the coeval records of regional valley incision in the Ohio River drainage east of the Mississippi (Granger et al., Reference Granger, Pabel and Palmer2001; Anthony and Granger, Reference Anthony, Granger, Harmon and Wicks2006), where rapid incision that has been documented at 1.5 Ma has been attributed to major drainage reorganization in response to the advancing Laurentide glacial ice margin (Granger et al., Reference Granger, Pabel and Palmer2001).
Stage 3: Incision with minor pulsed aggradation
The start of a renewed incisional phase of cave evolution is constrained to between about 1 Ma and 0.75 Ma from the available geochronologic data. The highest directly dated horizon before incision in Fitton Cave is the sand bed near the top of the Upper Missile Silo section that yielded a TT-OSL date of 0.96 ± 0.11 Ma, but aggradation continued to younger ages, as this bed is overlain by reversed-polarity clay (Fig. 5A). Subsequently, about 7 m of erosion was required to excavate the sediment from the Upper Missile Silo interval and additional bedrock before the coarse cobbles of the Lower Missile Silo sequence were deposited at 0.72 ± 0.16 Ma. At the DDPP section, clay near the top of the sediment section is reversed polarity, indicating an age greater than 0.77 Ma. The oldest ages of 700–600 ka for flowstones capping the DDPP sedimentary sequence provide a minimum age for cave sediment aggradation at this level. Based on these constraints, we use a midpoint age of 0.85 ± 0.1 Ma for the start of incision throughout the cave.
The span of U-series dates obtained from flowstones capping the sediments and vadose zone speleothem are the best-available record of the youngest phase of passage incision. Somewhat younger ages for flowstone at Fitton Entrance (460 ka) and stalagmites east of Needle’s Eye (410 ka) record stable conditions by this time throughout the Crystal and Upper East Passages of Fitton Cave. Other speleothems recording a wide range of younger ages (Paces et al., Reference Paces, Hudson, Hudson, Turner, Bitting, Sugano, Kuniansky and Spangler2017, Reference Paces, Hudson and Hudson2023) indicate those levels of the cave remained abandoned and that subsequent incision only affected lower levels.
Comparison of cave-sediment aggradation cycles with surface deposits
The potential correlation between cave-sediment intervals and surface terrace deposits preserved along adjacent rivers that control base level has been the subject of several studies (e.g., Miotke and Palmer, Reference Miotke and Palmer1972; Granger et al., Reference Granger, Pabel and Palmer2001; Anthony and Granger, Reference Anthony, Granger, Harmon and Wicks2006; Calvet et al., Reference Calvet, Gunnell, Braucher, Hez, Bourles, Guillous, Delmas and Team2015; Harmand et al., Reference Harmand, Adamson, Rixhon, Jaillet, Losson, Devos, Hez, Calvet and Audra2017; Rixhon et al., Reference Rixhon, Braucher, Bourles, Peeters, Demoulin, Leanni and Team2020). The sediment aggradation cycles preserved within the Fitton Cave sediments prompt questions about how they may compare with the records from alluvial surficial deposits, both locally within the Buffalo River watershed and more regionally.
Comparisons with river strath terraces
The development of subhorizontal cave passages has been compared with the development of river terraces elsewhere (e.g., Webb et al., Reference Webb, Fabel, Finlayson, Ellaway, Shu and Spiertz1992; Harmand et al., Reference Harmand, Adamson, Rixhon, Jaillet, Losson, Devos, Hez, Calvet and Audra2017). The coarse sediment aggradation cycles documented in Fitton Cave may have age-correlative surficial deposits in the Buffalo River valley, specifically within a group of the older river terrace deposits (Fig. 8). A series of strath terrace deposits that have been mapped along the Buffalo River are broadly grouped from lowest to highest as Qty, Qtm, and Qto (e.g., Hudson and Turner, Reference Hudson and Turner2014; Keen-Zebert et al., Reference Keen-Zebert, Hudson, Shepherd and Thaler2017). The youngest group of Qty sand deposits directly overlying gravel- and cobble-mantled straths that are 2 to 5 m above the river channel have OSL ages ranging from 5.5 ± 0.5 ka to 14.6 ±1.2 ka (Rodrigues et al., Reference Rodrigues, Keen-Zebert, Shepherd, Hudson, Bitting, Johnson and Langstone2023). Within the middle reach of the Buffalo River (Fig. 8B), sand horizons from three Qtm terraces collected directly above coarse cobble strath deposits that are 7 m to 13 m above the river yielded TT-OSL ages ranging from 207.6 ± 28.7 ka to 242.9 ± 24.5 ka (Rodrigues et al., Reference Rodrigues, Keen-Zebert, Shepherd, Hudson, Bitting, Johnson and Langstone2023). These Qtm straths are older than Qty but still distinctly younger than any of the coarse sediment horizons dated from Fitton Cave. Strath heights for the broad group of older Qto terrace deposits range from 20 to 75 m above the Buffalo River (Keen-Zebert et al., Reference Keen-Zebert, Hudson, Shepherd and Thaler2017; Fig. 8). A lower subset of Qto terraces mapped as Qto1 in the west-central reach (Fig. 8A) of the Buffalo River (Hudson and Turner, Reference Hudson and Turner2014) have strath heights from that range from 20 m to 40 m above the river, overlapping projections of the Fitton Cave sediment heights (Fig. 8B) above the local Cecil Creek base level (described later). Thus, a similar Early Pleistocene age range (i.e., 2.2 Ma to >0.7 Ma) can be reasonably inferred for the Qto1 terraces. Using a similar assumption, higher Qto2 terraces (Fig. 8A) whose straths range from 45 m to 75 m above the river might be predicted to extend into the Pliocene (>2.5 Ma). As yet, neither subset of Qto terraces along the Buffalo River has been quantitatively dated. The ages predicted here suggest that cosmogenic nuclide and TT-OSL applications could be appropriate methods. However, sampling is challenging due to the limited preservation, subsequent erosion, and disturbed nature of these older terraces on the landscape. Regionally, the Upland Complex, a thick gravel terrace deposit formed along the Mississippi River (Cox et al., Reference Cox, Lumsden and Van Arsdale2014; Van Arsdale et al., Reference Van Arsdale, Cox, Lumsden and Kwan2023), has been dated to the Pliocene (Odom et al., Reference Odom, Hofmann, Van Arsdale and Granger2020). The bedrock strath at the base of the Upland Complex is about 70 m above the base of the Holocene deposits in the Mississippi Valley (Van Arsdale et al., Reference Van Arsdale, Cox, Lumsden and Kwan2023), suggesting that post-Pliocene incision of the Mississippi River due to eustatic sea-level lowering may have triggered incision upstream on the Buffalo River and Cecil Creek, similar to the pattern seen elsewhere in the Mississippi River Basin on the Green River at Mammoth Cave (Granger et al., Reference Granger, Pabel and Palmer2001), on the Cumberland River (Anthony and Granger, Reference Anthony and Granger2007), and on the lower Tennessee River (Odom and Granger, Reference Odom and Granger2022).
Comparison of terrace strath heights above Buffalo River to cave sediment heights above Cecil Creel base level. (A) Map of river terrace deposits at different elevations along the west-central part of Buffalo River valley (from Hudson and Turner, Reference Hudson and Turner2014). Rkm gives downstream length along river, in kilometers. (B) Elevations (above mean sea level) of medial (Qtm) and older (Qto) strath terraces along Buffalo River (modified from Keen-Zebert et al., Reference Keen-Zebert, Hudson, Shepherd and Thaler2017) compared with height of Fitton Cave sediment intervals above local Cecil Creek base level as projected along west-central part of Buffalo River (gray band).

Comparisons with Laurentide glacial tills
The influence of Pleistocene climate is suggested for the pulses of coarse sediment washed into Fitton Cave at 2.20, 1.25, and 0.72 Ma, given that they are similar in age or slightly younger than the oldest Laurentide glacial tills (Fig. 6) preserved at their southern extent in central Missouri (Rovey and Balco, Reference Rovey, Balco, Ehler, GIbbard and Hughes2011; Fig. 1). Average cosmogenic nuclide burial ages (Balco and Rovey, Reference Balco and Rovey2010; Rovey and Balco, Reference Rovey, Balco, Ehler, GIbbard and Hughes2011) reported for the three oldest tills are 2.4 ± 0.14 Ma for the Atlanta formation, 1.3 ± 0.09 Ma for the Moberly formation, and 0.80 ± 0.06 Ma for the Fulton member of the McCredie Formation (Fig. 6). The similarity between dates obtained from till and the cave sediments also extends to magnetic polarity, as the Atlanta and Moberly formations carry reversed-polarity RM like the older Fitton Cave sediments, whereas the Fulton member of the McCredie Formation carries normal polarity magnetization, as is permissive for clay overlying the youngest 0.72 Ma conglomerate at the lower Missile Silo locality (Fig. 6).
Multiple factors related to climate may have influenced sediment aggradation in Fitton Cave (and perhaps the Buffalo River strath terraces as well). These factors include increased sediment production, vegetation changes, and variable hydrologic conditions (Granger et al., Reference Granger, Pabel and Palmer2001; Marshall et al., Reference Marshall, Roering, Bartlein, Gavin, Granger, Rempel, Praskievicz and Hales2015, Reference Marshall, Roering, Gavin and Granger2017, Reference Marshall, Roering, Rempel, Shafer and Bartlein2021). Modeling for the last glacial maximum period (∼21 ka) predicts that periglacial climate conditions extended far south into the midcontinent region, encompassing all the Ozark Plateau region (Marshall et al., Reference Marshall, Roering, Rempel, Shafer and Bartlein2021).
A conceptual model for the Early Pleistocene climate control on coarse sediment input into Fitton Cave could include increased sediment production via periglacial frost cracking of erosion-resistant Upper Mississippian and Lower Pennsylvanian sandstone ledges upstream from the cave (Fig. 1) as well as potential storage of water as ice during the glacial maxima. Transport of the coarse sediments to the valley floors and into the cave could be facilitated by water releases during subsequent warmer, and potentially wetter, interglacial periods. Similar episodes of valley filling and cave sediment accumulation have been observed in other cave systems throughout the unglaciated southeastern United States, including at Mammoth Cave and on tributaries of the Cumberland River near 0.8 Ma (Anthony and Granger, Reference Anthony and Granger2007). Those authors suggested that extensive regional river aggradation was associated with Laurentide glaciation. Rapid changes in denudation rate associated with frost-cracking processes may not be fully captured in the paleo-denudation rate calculations (Fig. 7), which assume steady-state (Eq. 1). Because soil depths are thin, changes in the calculated erosion rates would lag changes in the actual erosion rates by roughly the time taken to remove ∼60 cm from the landscape, about 15,000–40,000 yr (e.g., Marshall et al., Reference Marshall, Roering, Gavin and Granger2017). The paleo-denudation rates therefore represent a damped average rather than an instantaneous value.
The observation that caves even in relatively small tributaries such as Cecil Creek recorded aggradation during those periods indicates that increases in sediment supply, for example through processes such as frost-cracking, were a more likely cause than a rise in base level that propagated upstream. The latter is not supported by distribution of terrace ages that suggests strath development occurred along the entire length of the Buffalo River rather than progressively from east to west (Rodrigues et al., Reference Rodrigues, Keen-Zebert, Shepherd, Hudson, Bitting, Johnson and Langstone2023).
Incision rates
The rate of post–0.85 Ma passage incision within Fitton Cave can be compared with other long-term estimates of valley incision from surficial deposits in the Buffalo River watershed and elsewhere within the Ozark Plateau region. Numerous cave studies have concluded that large subhorizontal cave passages at common levels initially form near the water table (Palmer, Reference Palmer1987; Ford and Williams, Reference Ford and Williams1989), with base-level cave streams responsible for transporting coarse sediments into the cave (Granger et al., Reference Granger, Kirchner and Finkel1997, Reference Granger, Pabel and Palmer2001). Upper cave passages are abandoned as subsequent valley incision lowers the water table and new passages form at lower elevations (Audra and Palmer, Reference Audra, Palmer, Shroder and Frumkin2013). A base-level origin for the Crystal and Upper East Passages of Fitton Cave is supported by the similar elevations of the bedrock straths and the two or three aggraded coarse sediment pulses deposited at the Upper Missile Silo, T-Room, and Double Drop Pit localities, differing less than 10 m over a horizontal distance of about 900 m (Figs. 5 and 8). Based on these relationships, we assume that former base levels in Fitton Cave reached at least 318.3 ± 4.6 m amsl (Fig. 5, the average elevation of the upper gravel horizons at three locations).
A second consideration in calculating the incision rates is the elevation of modern base level in the Cecil Creek subcatchment. Dye tracer tests from multiple sinks within the Cecil Creek drainage (Aley and Aley, Reference Aley and Aley1999) emerge at either the Fitton Spring or Van Dyke Spring (Fig. 1) at elevations of 277 m amsl and 281 m amsl, respectively. Groundwater discharging at those springs reflects the local water table elevation within the Boone Formation that comprises the Springfield aquifer (Adamanski et al., Reference Adamski, Petersen, Freiwald and Davis1995). If the resulting gradient of 0.009 between those springs is projected along a cross section through the cave system (Fig. 9), the modern water table elevation beneath a spatially averaged point for the MS, TR, and DDPP localities is estimated at 294.5 m amsl. This elevation is slightly beneath the surface elevation of 296 m for the adjacent Cecil Creek channel that is a losing-stream segment during hydrologic baseflow conditions at this locality. Using an average elevation of 294.5 m amsl for the modern water table and 318.3 m for the pre-incision Fitton Cave sediment levels, a total incision of 23.3 m during the last 0.85 Ma yields an incision rate for the Cecil Creek subcatchment of 27 m/Ma. A slightly lower incision rate (22 m/Ma) applies if the 299 m amsl elevation of the active cave stream within the 21 Jumps Passage adjacent to the T-Room section is used as the modern water table. However, we do not favor this latter option, because the stream in this segment of the cave exhibits substantial flow and is likely perched on chert-rich intervals within the Boone Formation, a feature that is locally observed within the streambed. Also, the southerly trend of the 21 Jumps Passage as it descends from the surface entrance from the Bartlett Cove Branch of Cecil Creek (Fig. 2) is more like that of a dip-controlled vadose segment of cave passages as described by Palmer (Reference Palmer1987).
Cross section along profile A–A′ shown on Figure 1 (with 2× vertical exaggeration) comparing average height of 1.25 Ma cave gravel horizons to the projection of modern water table (dashed black line), indicating about 23 m of incision. The gradient of modern Cecil Creek (dotted blue line) is shown for comparison.

The 27 m/Ma incision rate for the Cecil Creek subcatchment can be compared with other incision rates that have been determined from surface deposits in the Buffalo River valley or elsewhere in the Ozarks Plateau region. Along the Buffalo River, vertical incision rates derived from the ∼225-ka-old Qtm strath terraces dated farther downstream from Cecil Creek by TT-OSL (Fig. 8B) range from 20 m/Ma in the Boone Formation–hosted straths to 40 m/Ma where the channel has incised the Ordovician Everton Formation (Rodrigues et al., Reference Rodrigues, Keen-Zebert, Shepherd, Hudson, Bitting, Johnson and Langstone2023). A maximum limit for vertical incision rates of 740 m/Ma derived from vadose tufa deposits stranded on a high bluff adjacent to the Buffalo River (Hudson et al., Reference Hudson, Paces, Turner, Kuniansky and Spangler2017) is more than an order of magnitude higher, reflecting the fact that those deposits formed from perched seepage. Likewise, studies of modern in-channel calcite dissolution rates (Covington et al., Reference Covington, Gulley and Gabrovšek2015; Covington and Vaughn, Reference Covington and Vaughn2019) imply incision rates of 300–500 m/Ma (Rodrigues et al., Reference Rodrigues, Keen-Zebert, Shepherd, Hudson, Bitting, Johnson and Langstone2023) that appear to exceed long-term rates based on Pleistocene deposits. Elsewhere in the Ozarks, valley incision rates are estimated at 14–20 m/Ma for cave deposits within similar Mississippian limestone bedrock developed adjacent to the James River 120 km north of Fitton Cave (Rovey et al., Reference Rovey, Balco, Forir and Kean2017). In the St. Francois Mountains of southeastern Missouri (Fig. 1), higher average valley incision rates of 67.0 ± 16.5 m/Ma were determined using cosmogenic dating of ∼100 ka bedrock straths cut into Precambrian igneous rock (Kim et al., Reference Kim, Weber, Seong, Reminga-DeYoung and Yu2023).
These site-specific cross-sectional valley incision rates compare to slower cosmogenic catchment-wide denudation rates that have been reported for the Buffalo River of 16–18 m/Ma (Zunka, Reference Zunka2018) and 8 m/Ma more broadly for the Ozark Plateau region (Beeson et al., Reference Beeson, McCoy and Keen-Zebert2017) and locally as low as 1 m/Ma (Rovey et al., Reference Rovey, Balco, Forir and Kean2017). Paleo-denudation rates of 16–17 m/Ma determined from the 2.2 Ma and 0.7 Ma gravels within Fitton Cave (Fig. 7) are like the catchment-averaged denudation rates for the modern Buffalo River (Zunka, Reference Zunka2018). In contrast, paleo-denudation rates determined from the 1.37–1.07 Ma Fitton Cave gravels are higher (39–21 m/Ma) and might reflect elevated periglacial erosion of the broader landscape. If the 17 m/Ma rate is taken as a base level for long-term catchment-averaged denudation, the 27 m/Ma valley-incision rate (Fig. 7) determined for the Cecil Creek catchment implies a modest growth of relief since the middle Pleistocene in the western part of the Buffalo River valley.
Conclusions
The application of multiple geochronometers is key to characterizing a comprehensive history of speleogenesis for Fitton Cave and its relation to the controls and pace of landscape evolution in the southern Ozark Plateau region. Cosmogenic nuclide dates document an Early Pleistocene age for the oldest sediments washed into the cave, followed by subsequent periods of aggradation that were supported by results of TT-OSL and paleomagnetism techniques on related clastic sediments. The U-series disequilibrium dating on flowstones capping sedimentary sequences and forming other vadose speleothems documented the transition from aggradation to incision in the cave as well as a protracted history of vadose zone infiltration and speleothem growth in upper-level passages since the middle Pleistocene.
Upper-level cave passages in Fitton Cave formed by dissolution before their infilling by sediment at 2.2 Ma, making them the oldest epigenic caves that have been documented in the Ozark Plateau region thus far. The presence of overlying erosion-resistant sandstones in Upper Mississippian and Lower Pennsylvanian strata at the northern extent of the Boston Mountains physiographic subprovince (e.g., Thaler and Covington, Reference Thaler and Covington2016) may have helped protect these older cave passages from erosion. This setting is comparable to that of the Cumberland Plateau east of the Mississippi River where cave passages as old as 5 Ma have been preserved (Anthony and Granger, Reference Anthony, Granger, Harmon and Wicks2006).
Coarse sediment horizons preserved in upper-level passages of Fitton Cave have cosmogenic nuclide ages of 2.2 Ma, 1.25 Ma, and 0.72 Ma that are similar to or slightly follow the ages of the southernmost, oldest glacial till deposits from the Laurentide Ice Sheet (Balco and Rovey, Reference Balco and Rovey2010) that are preserved 300 km to the north in central Missouri. The similarity of ages suggests a climate influence on the input of coarse sediment in the cave, perhaps through elevated periglacial sediment supply. Based on their height above modern base level, the Early Pleistocene coarse cave sediments most likely correlate to a set of older, as yet undated, Qto1 strath terraces that have been mapped along the nearby Buffalo River (Hudson and Turner, Reference Hudson and Turner2014; Keen-Zebert et al., Reference Keen-Zebert, Hudson, Shepherd and Thaler2017).
A period of incision and cave passage lowering began at about 0.85 Ma and proceeded at a long-term rate of about 27 m/Ma within the Cecil Creek subcatchment. This rate is only slightly higher than what has been estimated from ca. 225-ka-old river terrace straths farther downstream along the Buffalo River (Rodrigues et al., Reference Rodrigues, Keen-Zebert, Shepherd, Hudson, Bitting, Johnson and Langstone2023), but greater than modern catchment-averaged rates of landscape denudation (e.g., Beeson et al., Reference Beeson, McCoy and Keen-Zebert2017; Zunka, Reference Zunka2018; Kim et al., Reference Kim, Weber, Seong, Reminga-DeYoung and Yu2023) for the Ozark Plateau region.
This study highlights the potential of geochronology records from cave sediments and speleothems, in even small catchments, to better understand regional landscape evolution.
Supplementary material
The supplementary material for this article can be found at https://doi.org/10.1017/qua.2025.14.
Acknowledgments
We gratefully acknowledge scientific access to Fitton Cave granted by the National Park Service. We conducted our field investigations over a period from 2014 to 2017 while Fitton Cave was closed to the public due to concern for spread of White Nose Syndrome (WNS) in the resident bat population. Our work protocol included precautions to isolate and clean clothing and equipment before and after cave entry to minimize potential for spread of WNS. We thank C. Bitting for accompanying the field group in several of the five cave trips and for sharing cave photos. We thank the Cave Research Foundation for sharing their cave survey locations. We benefited from discussions with D. Mott, S. Shepherd, M. Covington, C. Ruleman, and A. Hudson about the hydrogeologic settings of the Buffalo River area and about general geomorphic processes. Laboratory analyses were aided by efforts from several individuals, including L. Sugano and J. J. Munoz. Presentation of this material benefitted from helpful technical reviews by G. Rixhon, D. Doctor, C. Ruleman, and an anonymous journal reviewer.
Funding Statement
Funding for this study was provided by the U.S. Geological Survey National Cooperative Geologic Mapping Program for MRH, JBP, and KJT and by National Science Foundation grant EAR 1360572 awarded to AK-Z. Any use of trade, firm, or product names is for descriptive purposes only and does not imply endorsement by the U.S. Government.
Competing Interest
The coauthors have no competing personal or financial interests with the work presented in this study.


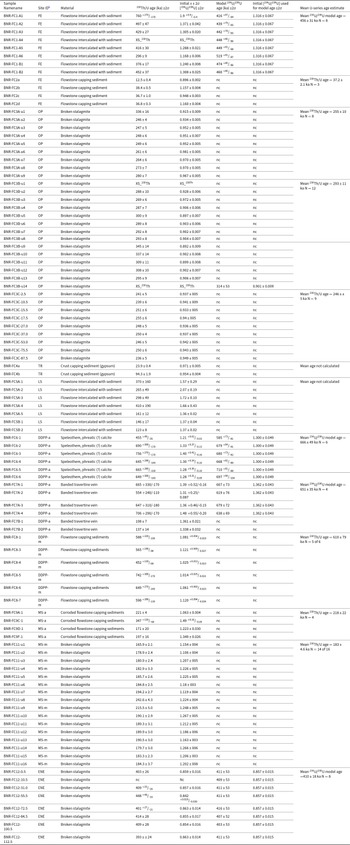


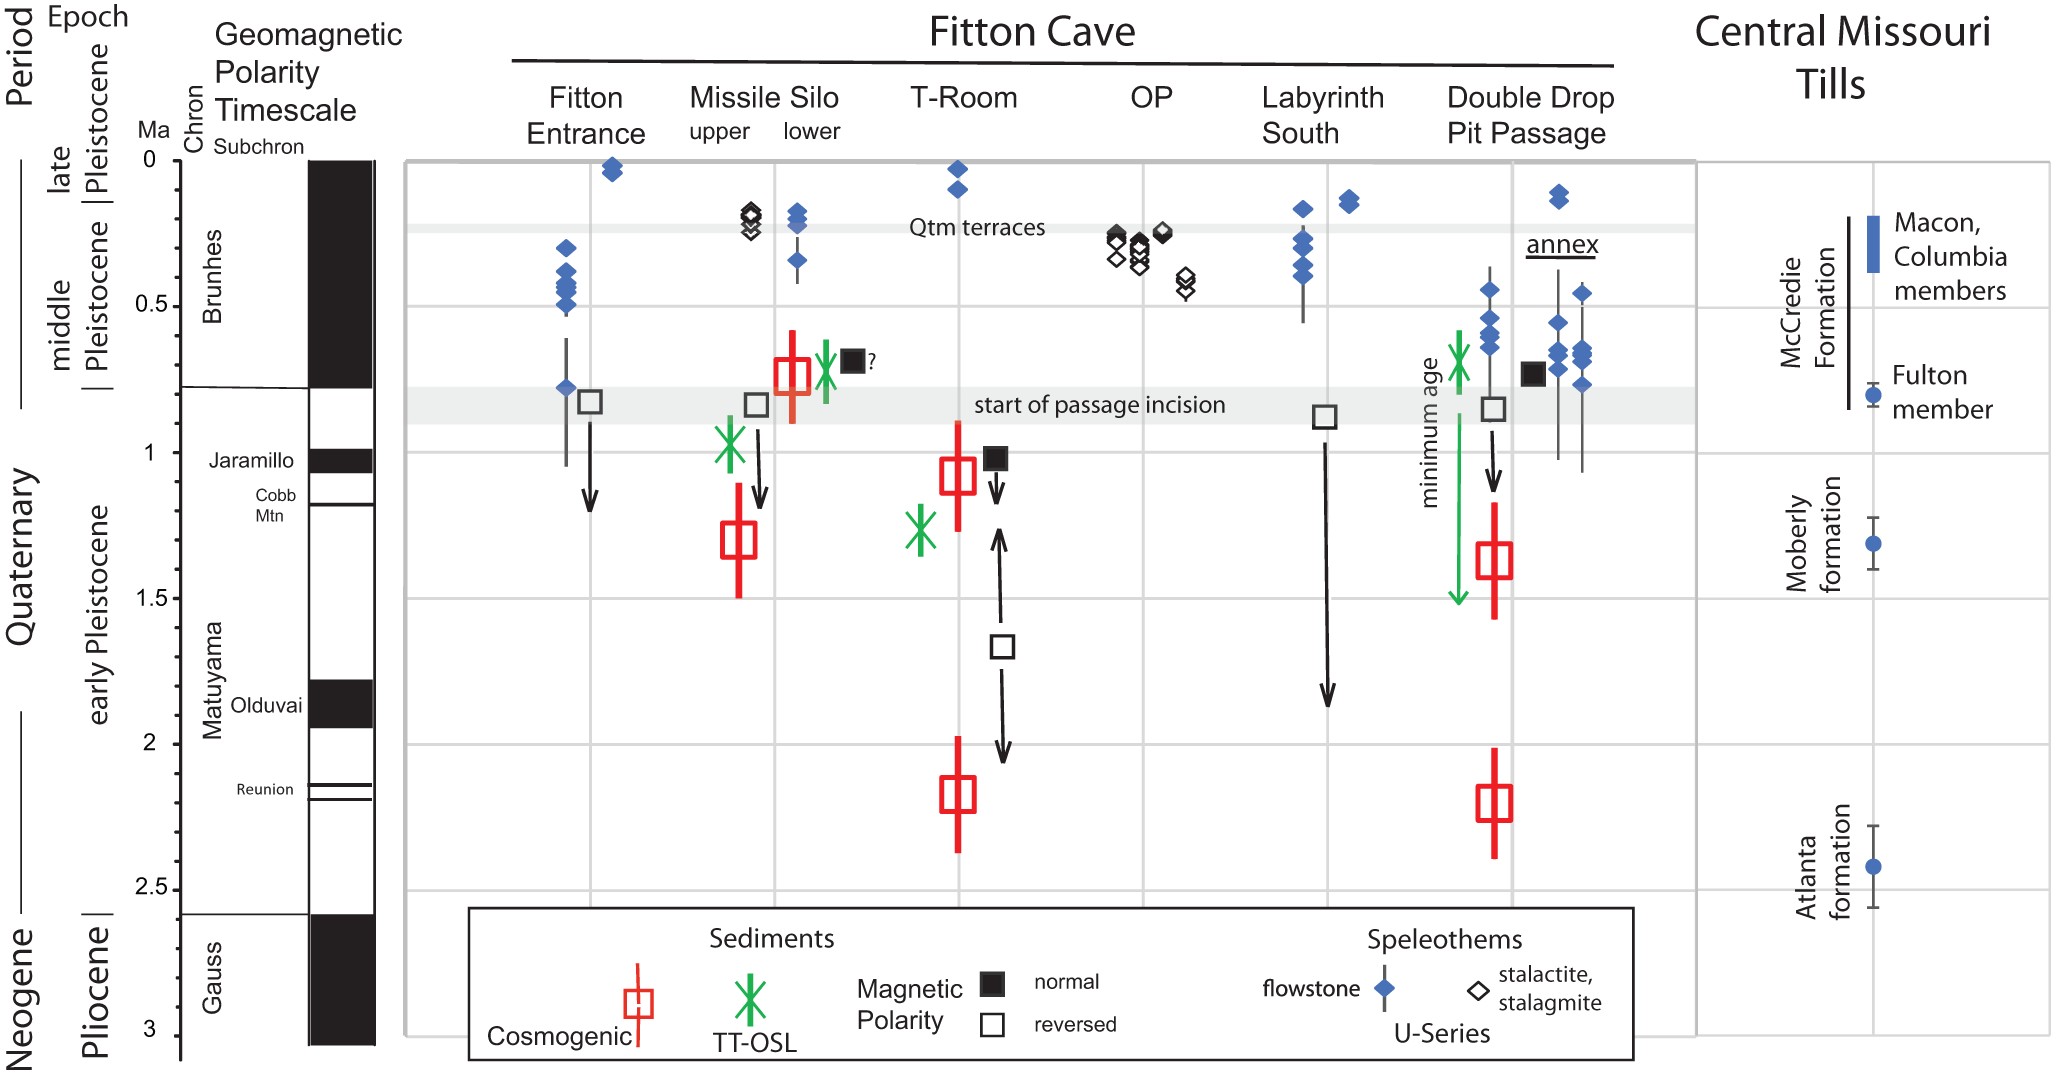
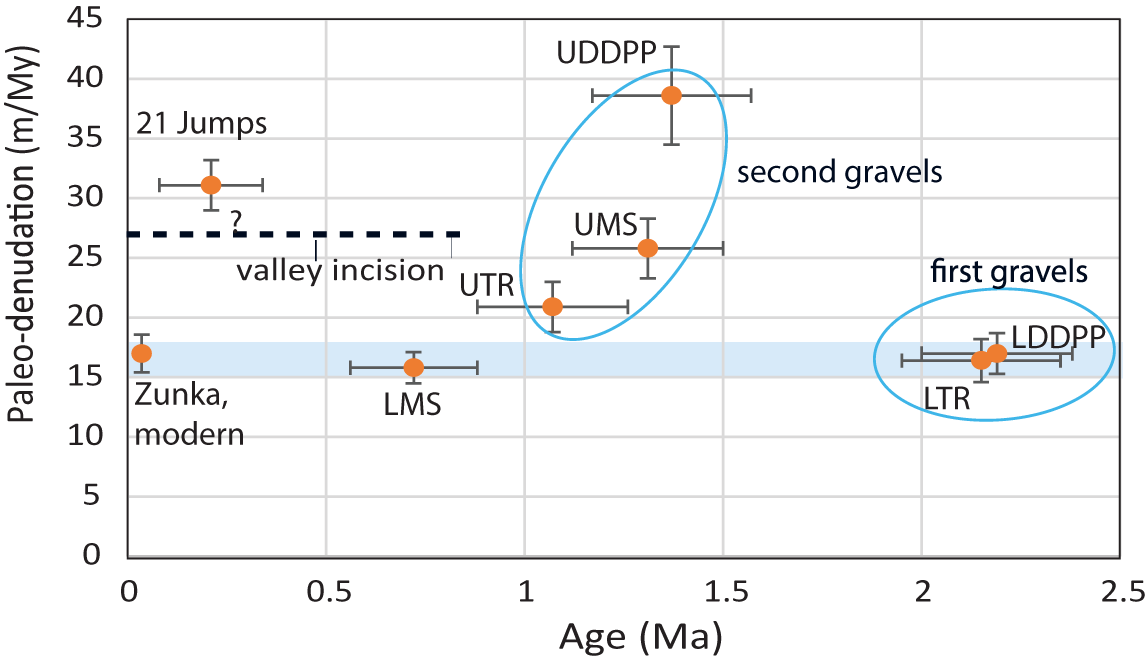

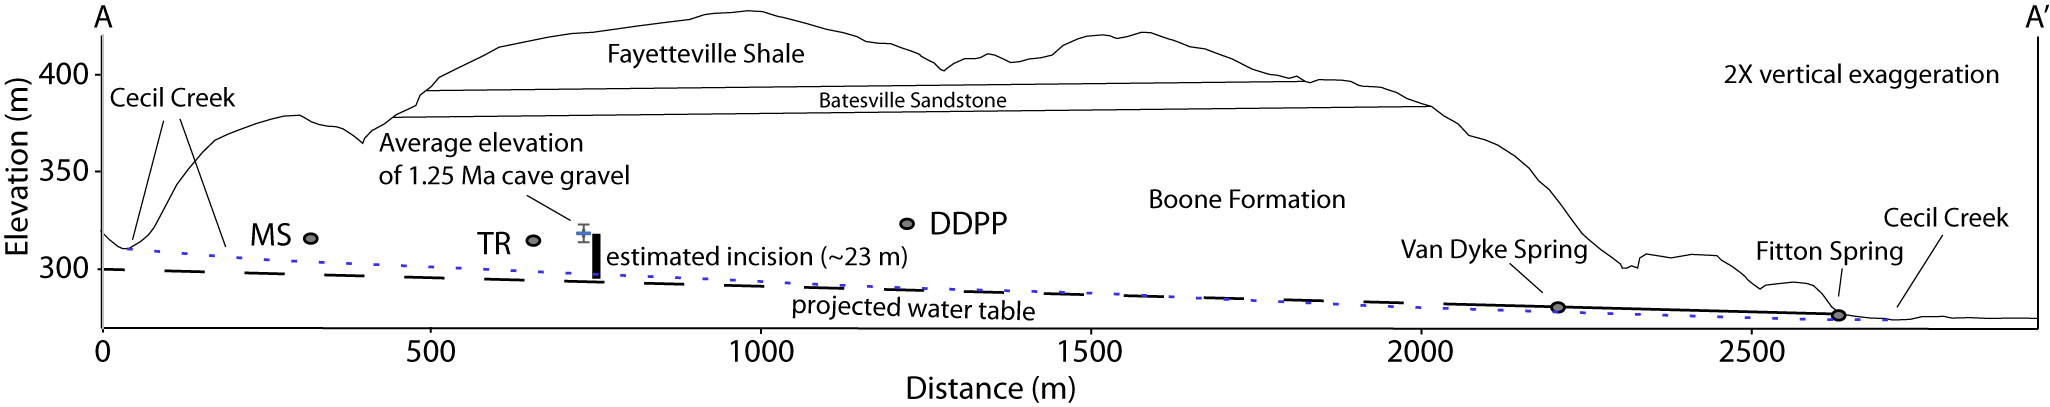


 Open access