

There is broad consensus that the labor movement in the United States is weak compared to movements in many other countries. Among 34 Organisation for Economic Co-operation and Development (OECD) countries, the United States has the third lowest collective bargaining rate (11.9 percent) and the sixth lowest trade union density (10.8 percent).Footnote 1 The weakness of the American labor movement is one of the most important features distinguishing the United States from other countries. Indeed, the search for causal explanations for the weakness of American labor unions began in the late 1800s, and more than a century later, the question remains one of the most contested and salient in the social sciences. Prominent explanations include: the relative prosperity of the American worker (e.g., Sombart Reference Sombart1976 [1906]; Brown and Browne Reference Brown and Browne1968), the racial and ethnic heterogeneity of the United States (e.g., Archer Reference Archer1997; Halpern Reference Halpern1994; Marshall Reference Marshall1967; Northrup Reference Northrup1943), the success of employers in combating workers (e.g., Friedman Reference Friedman1998; Griffin, Wallace, and Rubin Reference Griffin, Wallace and Rubin1986; Haydu Reference Haydu1988; Voss Reference Voss1993; Willoughby Reference Willoughby1905), and the nature of political institutions in the United States (e.g., Currie and Ferrie Reference Currie and Ferrie2000; Oestreicher Reference Oestreicher1988; Perlman Reference Perlman1928; Schattschneider Reference Schattschneider1942). Despite this expansive literature, there are few theoretical or empirical treatments of the factors that contribute to and hinder the formation of unions and the decision of workers to strike.Footnote 2
In this article, I propose and test a theory of union formation and strike activity that has received little attention in the extant literature. I frame the labor movement as a battle between workers and employers. Working through the logic of collective action, I suggest that both the number of workers in an establishment and the number of employers in a market explain variation in union strength and strike activity in the United States during the late-nineteenth and early-twentieth centuries. While my central hypothesis is inspired by Mancur Olson’s (Reference Olson1965) classic work on collective action, my model is a variant of Joan Esteban and Debraj Ray’s (Reference Esteban and Ray2001) model. In the model, workers wish to form a union, which, if successful, will provide them with both public and private benefits. Employers, on the other hand, wish to prevent their workers from unionizing. The model allows for a monetary fixed cost of collective action, typical of fees and dues paid by workers or employers to obtain a union charter or join an employers’ association. Under these assumptions, the model predicts that intermediate-sized worker and employer groups will be more likely to take collective action. However, if the benefit of collective action is purely private (rather than having both public and private characteristics), then small groups will be more likely to take collective action. If the benefit is purely public then large groups will be more likely to take collective action.
To test this model, I construct a dataset containing two independent outcomes that result from the battle between labor and capital. The first outcome is whether workers had successfully chartered a local branch of a national union in a county-by-industry cell by 1882, 1892, and 1902.Footnote 3 Specifically, I collect local branch locations for ten large, national labor unions: the Amalgamated Association of Iron and Steel Workers (AA), the Cigar Maker’s International Union (CMIU), the Granite Cutters’ National Union of the United States (Granite Cutters), the International Association of Machinists (IAM), the Iron Molders’ Union of North America (IMU), the International Typographical Union (ITU), the National Union of United Brewery Workmen (Brewery Workmen), the United Brotherhood of Leather Workers on Horse Goods (Leather Workers), the United Garment Workers of America (UGWA), and the United Mine Workers (UMW). These ten unions accounted for more than one-third of all national labor union membership in the late nineteenth century.Footnote 4 The second outcome is whether a strike occurred in a county-by-industry cell during the period 1881–1894. The data on strikes were taken from Janet Currie and Joseph Ferrie’s (Reference Currie and Ferrie2000) study, which were supplemented by Suresh Naidu and Noam Yuchtman (Reference Naidu and Yuchtman2016).
I combine these two measures of collective action with newly digitized county-by-industry level data on the number of workers and the number of establishments, taken from the 1880 Census of Manufacturing and the 1880 Census of Population. These data allow me to measure the size of both worker and employer groups by calculating the average number of workers per establishment and the number of establishments in a county-by-industry cell. I combine these data with other county-by-industry level variables that have been hypothesized to affect the strength of the labor movement: average wages, ethnic fractionalization, percentage black, strikes waves, the success of strikes, and percentage urban.
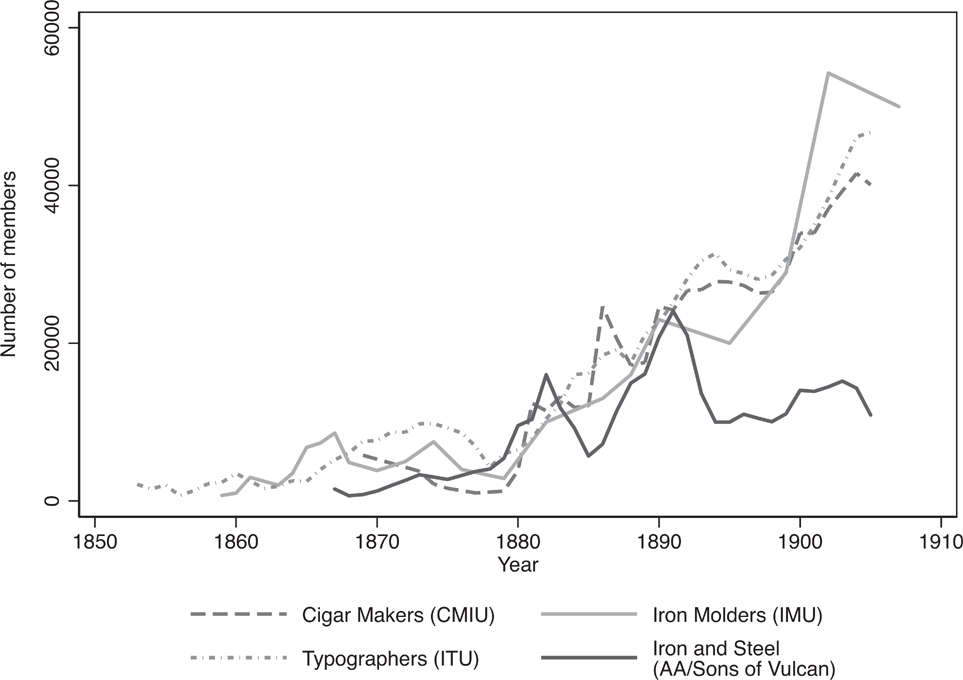
The identification of the relationship between group size and collective action relies on three components. First, the county-by-industry level observations allow me to difference out fixed, unobserved county- and industry-level characteristics that might affect unionization and strikes. Second, I measure all independent variables of interest in 1880, prior to the dramatic acceleration in the American labor movement that is shown in Figure 1. This allows me to eliminate a major source of endogeneity: establishment sizes might reflect employers’ efforts to prevent unionization.Footnote 5 Finally, my dataset contains a rich set of control variables that have been hypothesized to effect unionization and strike activity. The three components of the identification strategy eliminate most sources of endogeneity and suggest that the estimated relationships between group size and collective action are likely reflective of the costs and benefits discussed in the model.
Labor Union Membership
I find broad quantitative support for the theoretically predicted hump-shaped relationship between workers per establishment and collective action. Workers in county-by-industry cells with approximately 50 workers per establishment were more likely to have chartered a local union branch and more likely to have gone on strike than workers in cells with smaller or larger establishments. I also find that there was a decreasing relationship between the number of employers and the probability that they prevented unionization and strikes. There are several potential explanations for this relationship including that employers might face a free-rider problem.
To assess the magnitude of these relationships, I assign all county-by-industry cells the number of workers per establishment that maximizes the probability of a union forming or a strike occurring. I find that the number of cells with a local union would have increased from 43 to 61 percent (a 42 percent increase) and the number of cells with a strike would have increased from 3.8 to 5 percent (a 32 percent increase). Performing the same exercise with employer group size (number of establishments), I find that the number of cells with a local union would have increased from 43 to 62 percent (a 44 percent increase) and the number of cells with a strike would have increased from 3.8 to 19 percent. I demonstrate that these effects are larger than those implied by other theories of union formation, such as racial and ethnic heterogeneity, the prosperity of workers, and the number and success of strikes. In this sense, worker and employer group size explains more variation in labor strength within the United States than many previously considered explanations.
This study contributes to the literature in several ways. First, it furthers our understanding of the factors that contributed to and hindered the emergence of the American labor movement. This is of particular interest since, as previously mentioned, the United States is often viewed as exceptional due to its lack of a robust labor movement. While the focus of this article is on the origins of the American labor movement, the results of my analysis suggest that the relative weakness of unions in the United States might partially be rooted in differences in industrial structure between the United States and Europe at the onset of the labor movement.
The second contribution of this article is to study the relationship between group size and collective action outside a laboratory setting. Gerald Friedman (Reference Friedman1998) finds that union strikes were more successful in large American cities than in small American cities and finds the opposite relationship in France during the late nineteenth century.Footnote 6 Friedman also finds that union membership “declines steadily with establishment size” in the United States and notes that “unions were scarce in the giant factories of the second industrial revolution” (Friedman Reference Friedman1998, p. 272). In a more recent study, Tobias Karlsson and Maria Stanfors (Reference Karlsson and Stanfors2017) find that the likelihood of being a union member decreases with workplace size in Sweden during the late nineteenth century. I build upon these works by explicitly theorizing about and testing the relationship between worker and employer group size and collective action in county-by-industry cells. By incorporating employers into the analysis, I take seriously Friedman’s idea that “Employer resistance can vary as much as any other factor affecting unionization” (Friedman Reference Friedman1998, p. 302).
Finally, this article studies how labor unions developed in the era of at-will employment. Price Fishback (Reference Fishback1998) argues that turn of the century labor markets were largely unregulated and, therefore, provide an ideal setting to test economic theories.Footnote 7 By focusing my attention at the onset of the American labor movement the relationship between group size and collective action should be unaffected by changes to the costs and benefits of organization that accompanied the passage of the Wagner Act (1935) and the Taft-Hartley Act (1947).
Collective Action and Labor Union Formation
During the late nineteenth and early twentieth centuries, both workers and employers engaged in collective action. Workers formed labor unions and employers responded with associations of their own. These labor unions and employer associations bargained over labor market rents, the eight-hour work day, workplace conditions, and actively opposed the other group’s interests. Indeed, employer associations such as the National Association of Manufacturers, the National Metal Trades Association, and the Stove Founders’ National Defense Association, were so successful in their fight against labor unions that they are often pointed to as a reason for the weak American labor movement. In her book on American exceptionalism, Kim Voss (Reference Voss1993) argues that “the Knights [of Labor] failed because their rapid growth and early successes resulted in the mobilization of employers’ associations” (Voss Reference Voss1993, p. 226). In the same vein, Larry Griffin, Michael Wallace, and Beth Rubin (Reference Griffin, Wallace and Rubin1986) conclude that “much of the variation in unionization during this period [1902–1928] – and the relatively low level of organization during the entire pre-New Deal era – can be partially attributed to efforts of capitalists to defeat labor organization” (Griffin, Wallace, and Rubin Reference Griffin, Wallace and Rubin1986, p. 148).
If either workers or employers were to achieve benefits from collective action they had to first exert effort, pay fees and dues, and potentially endanger the relationship they had with each other. To explore the trade-off between the benefits and costs of collective action in late nineteenth century labor markets, I develop a model and examine the implications of this model as it relates to group size. The model is based on one presented in Esteban and Ray (Reference Esteban and Ray2001), however, I modify it by allowing for a monetary fixed cost of collective action. The formal model is located in Online Appendix A.
Suppose that there are two groups in a labor market: workers and employers. Workers wish to form a labor union, while employers wish to prevent their workers from unionizing. Only one of these outcomes will occur. If workers are successful and form a union, each worker receives a bundle of goods which could include fewer hours worked, improved workplace conditions (e.g., Shiells Reference Shiells1990), a higher wage, and social benefits from being a member of the organization. On the other hand, if employers are successful and prevent unionization they receive a bundle of goods which could include higher profits, an open shop, or the defeat of pro-labor legislation.
In accord with this description, I assume that the benefit to a worker or employer of achieving their preferred outcome has characteristics that are both public and private. If the benefit is public, then it is unaffected by the number of members in the group. If the benefit is private, then the entire benefit is (evenly) distributed among all group members. For example, assume that workers form a union and achieve improved workplace safety and capture some labor market rents in the form of a higher wage. The benefit provided to the worker by the union has characteristics that are both public and private. Workplace safety is a public benefit because all members of the union receive this regardless of the number of members. A higher wage is a private benefit because labor market rents are finite and, therefore, they must be divided among union members (see Naidu and Yuchtman Reference Naidu and Yuchtman2016 for evidence of rents in late nineteenth century labor markets). Similarly, if employers prevent their workers from unionizing they might receive a benefit that is both public (e.g., an open shop in the industry) and private (e.g., increased profits). Again, an increase in profits is a private benefit because labor market rents are finite.
The benefits of engaging in collective action do not come without a cost. If successful, workers or employers must pay a monetary fixed cost to form the union or the employer’s association. Fixed costs associated with forming a union include the price a national union charges workers to charter a local branch, rent for a meeting location, and other union fees and dues used for the day-to-day management of the union. Fixed costs associated with forming an employers’ association include fees paid to manage the association and to aid members affected by strikes. These fees would be used to hire strike breakers and provide legal teams that could pressure public officials to intervene on behalf of the struck firms. For example, the National Metal Trades Association would “assist the member involved to procure men to replace those striking” and undertake “such legal steps as are necessary for the protection of his [the employers’] rights” (Willoughby Reference Willoughby1905, pp. 129–30). The National Metal Trades Association even established employment bureaus to hire nonunion replacement workers (see Bonnett Reference Bonnett1922 for case studies of the operations and handling of labor conflict by employer associations).
I assume that the fixed cost of taking collective action can be evenly divided among group members and, if the preferred outcome is achieved, the aggregate cost to the group of taking collective action will be lower than the aggregate benefit the group receives. Finally, workers and employers must exert effort to achieve their preferred outcome. All non-monetary costs of taking collective action, including the cost of conflict with the other group, are part of the effort cost. Employers and workers choose their effort to maximize their net benefit (benefit minus the monetary cost of taking collective action minus the effort cost of taking collective action).
Under this framework, one can show that the relationship between group size and collective action will be hump-shaped (inverse-U). When there are few potential members of a group, the fixed cost of forming the group will be high and, therefore, the group will be unlikely to form. As the potential membership in a group increases, the fixed cost per member will decrease, making collective action more likely. As the potential membership in a group continues to grow, the benefit per member will be reduced because the benefit exhibits some private (rival) characteristics. This, in turn, will reduce the likelihood of forming the group.
Finally, it is important to keep in mind that the benefit to workers of unionizing might exhibit a different amount of rivalry than the benefit to employers of preventing unionization. This might result in a different relationship between the probability of taking collective action and group size for workers and employers. For instance, if the benefit of taking collective action is purely private then Olson’s (Reference Olson1965) free-riding result, where small groups are more likely to succeed, is obtained. If, on the other hand, the benefit is purely public, then large groups will be more likely to take collective action.
Historical Background
Labor historians have, of course, written much about early labor union formation in the United States (see Foner (Reference Foner1984) and Karabel (Reference Karabel1979) for reviews of this literature). Often these studies draw conclusions by comparing the United States to Western Europe. As mentioned earlier, some of the most prominent explanations for union formation (or the lack of union formation) include: the relative prosperity of the American worker, the racial and ethnic heterogeneity of the United States, the nature of political institutions in the United States, and the number and success of strikes.
The idea that worker prosperity affects labor union formation was most prominently advocated by Werner Sombart who famously concluded, “All Socialist utopias came to nothing on roast beef and apple pie” (Sombart Reference Sombart1976 [1906], p. 106). To back up his point that a higher standard of living translated into fewer grievances and, therefore, less reason to organize, Sombart collected data on wages and cost of living. He concluded that around the turn of the twentieth century “the American worker receives a money-wage which is twice or three times that received by his German counterpart, but the procurement of the same quantity of the necessary means of sustenance is not really any more expensive than in Germany” (Sombart Reference Sombart1976 [1906], p. 93). Ernest Brown and Margaret Browne (Reference Brown and Browne1968) have confirmed these numbers. Robin Archer (Reference Archer2007) questions this literature and writes, “the standard of living in other countries was not the only, or even the most important, comparative reference point against which Americans judged their economic circumstances” (Archer Reference Archer2007, p. 47). Perhaps a more relevant internal reference point for workers is the standard of living of other workers in the same industry. If this line of thinking is correct, workers in locations that provide a low standard of living should be more likely to take collective action than workers in locations that provide a higher standard of living within the same industry.
Another explanation for union formation in the United States emphasizes racial and ethnic heterogeneity.Footnote 8 Most of these studies point to the barriers, both formal and informal, that were enacted by many labor unions to exclude blacks, Chinese, and other ethnic groups. In his history of African-American workers, Ray Marshall writes about early twentieth century labor unions and states that, “The general pattern seems to have been for local unions to exclude Negroes wherever they could” (Marshall Reference Marshall1967, p. 43). Booker T. Washington goes even farther and states that, “several attempts have been made by the members of labor unions…to secure the discharge of Negroes employed in their trades” (Washington Reference Washington1913, p. 757). Late nineteenth and early twentieth century mining companies even attempted to prevent unionization by staffing “their mines with ‘judicious mixtures’ of native whites, recent immigrants, and Negroes” (Northrup Reference Northrup1943, p. 318). Race was still a major issue facing labor unions well into the twentieth century. In 1930, there were 26 national unions that barred entry to black members; in 1943, there were still 14 national unions that barred entry to blacks (Marshall Reference Marshall1967). The literature is, therefore, fairly consistent in its conclusion that racial and ethnic heterogeneity impeded collective action among workers in the United States.Footnote 9
The argument that America’s winner-take-all electoral system, the federal system of government, and the entrenched two-party system hindered the labor movement in the United States has been widely made.Footnote 10 Richard Oestreicher (Reference Oestreicher1988) argues that there was class-consciousness among American workers from the 1870s until the 1930s, but they were not able to mobilize this class-consciousness due to the political power structure of America. Friedman (Reference Friedman2000) argues that American exceptionalism was really Southern exceptionalism and he finds that much of the weakness in the Southern labor movement was the result of political variables, especially wide election margins. Through the disenfranchisement of African-Americans, Democratic candidates were able to win elections by such wide margins in the South that they did not depend on industrial workers for their votes. These Democratic officials would almost always support employers over workers in disputes. Electoral margins of victory were significantly smaller in the Northeast and Midwest, which made politicians solicit the vote of workers and even resulted in legislation favorable to labor.
Finally, it has long been observed that union growth occurs in spurts and strikes occur in waves. In his examination of union membership in 13 countries, Friedman (Reference Friedman2008) finds that “67 percent of growth comes in only five years and over 90 percent in only ten years.” The logic of union growth spurts and strike waves is that of contagion. Workers might be more willing to organize a union or go on strike if they see that other workers are successful at organizing. Similarly, employers might be more likely to shut down a union or fight a strike if other employers are successful. Indeed, in their analysis of the determinants of strike success in Canada from 1920–1939, Michael Huberman and Denise Young (Reference Huberman and Young2002, p. 339) find that “Where other workers were successful, the probability of an individual win increased.”
This brief review of the labor history literature is far from comprehensive as there are many explanations for union formation. However, the explanations described here are some of the most prominent and are the ones that I directly address in the empirical analysis.
Empirical Strategy and Data
To test the predictions of the model, I collect county-by-industry level measures of worker and employer group size and collective action. I then adopt the following empirical specification: $Pr {[collective\,action = 1]_{ict}} = \alpha + f{\rm{ [}}workers\,per\,establishment{]_{ic}} + f{\rm{ [}}number\,of\,establishments{]_{ic}} + \beta '{[controls]_{ic}} + {\beta _i} + {\beta _c} + {\beta _t} + {\varepsilon _{ict}}$
In equation (1) i indexes industry, c indexes county, and t indexes year. Pr[collective action = 1]ict represents the probability that workers or employers in industry i in county c had taken collective action by year t. f [workers per establishment]ic is a non-linear function of the average number of workers per establishment in industry i in county c in 1880. f [number of establishment]ic is a non-linear function of the number of establishments in industry i in county c in 1880. These measures capture the size of worker and employer groups. [controls]ic is a vector of control variables that have been hypothesized to affect the labor movement: average wages (prosperity of workers), ethnic fractionalization, percentage black, the number of strikes, the success of strikes, and percentage urban. Finally, βi, βc, and βt are industry, county, and year fixed effects that control for fixed, unobserved industry, county, and year characteristics that affect the likelihood of collective action. More details on the construction of these variables follows.
Dependent Variables
I use two dependent variables to measure collective action during the late nineteenth and early twentieth centuries. Ideally, I would know which establishments had workers that were union members, and I would know which establishments were members of employer associations. However, establishment-level data on collective action is only available for a few unions and employers. As such, my first measure of collective action, which is more widely available, is an indicator for whether the workers in a county-by-industry cell had chartered a local branch of a national labor union by 1882, 1892, and 1902. I will refer to this variable as “unionization.”
To generate the unionization variable, I collected data on the location of local branches for ten of the largest national labor unions. The locations of these unions were recorded from union periodicals, which were issued on a monthly, bi-monthly, or weekly basis. Union periodicals communicated information about the national union to local members. As such, these periodicals often contained information on union finances, the state of the occupation represented by the union, names of new members, names of deceased members, and letters from union leaders. Importantly, the periodicals also provided a list of the name of each city that had chartered a local branch of the national union. Because the independent variables of interest are observed at the county-by-industry level, I geo-reference the city of each local union branch to obtain its latitude and longitude. These were then mapped to an 1880 map of the United States to obtain the county that each was located in.
In 1882, I only have branch locations for the Cigar Maker’s International Union. In 1892, I have branch locations for the CMIU and five additional labor unions: The Amalgamated Association of Iron and Steel Workers, the Iron Molders’ Union of North America, the International Typographical Union, the National Union of United Brewery Workmen, and the United Garment Workers of America. In 1902, I have branch locations for the six previously mentioned labor unions along with four additional labor unions: The Granite Cutters’ National Union of the United States, the International Association of Machinists, the United Brotherhood of Leather Workers on Horse Goods, and the United Mine Workers. More details on the exact periodicals, dates, and the data collection process are provided in Online Appendix C.
The second dependent variable is an indicator for whether the workers in a county-by-industry cell went on strike anytime during the period 1881–1894. I refer to this variable as “strikes.” The strikes variable comes from reports issued by the Commissioner of Labor that were digitized and provided by Currie and Ferrie (Reference Currie and Ferrie2000) and Naidu and Yuchtman (Reference Naidu and Yuchtman2016).Footnote 11 These data provide information on the city where the strike took place, the industry in which the strike took place, whether the strike was successful, and much more. Strikes are categorized as taking place in one of 15 different industries. I, again, geo-reference the city of each strike to obtain the county it was located in.
Independent Variables: Number of Establishments and Workers Per Establishment
The independent variables of interest measure the size of the groups that are taking collective action. I measure group size for workers using the average number of workers per establishment in a county-by-industry cell and I measure group size for employers using the number of establishments in a cell.
The number of establishments are taken from Table V of the Report on the Manufactures of the United States at the Tenth Census (Walker and Seaton Reference Walker and Seaton1883).Footnote 12 This table reports all industries except the mining industry. Data on the number of establishments in the mining industry come from Tables 27 (anthracite coal) and 29 (bituminous coal) of the Report on the Mining Industries of the United States (Walker and Seaton Reference Walker and Seaton1886).Footnote 13 The industry classification scheme used in the Report on the Manufactures was then assigned to the industry classification scheme used by the two dependent variables. Assignments can be found in Tables 1 and 2 of Online Appendix C.
Summary Statistics

Notes : This table displays summary statistics for two datatsets: (1) when unions are the dependent variable (all columns except the last) and (2) when strikes are the dependent variable (last column). For the unions dataset, the variables of interest are broken down by industry. Standard deviations are reported in parentheses.
Sources: The data on county-by-industry cells that chartered unions come from union periodicals. The data on cells that experienced at least one strike during the period 1881–1894 come from reports issued by the Commissioner of Labor that were digitized by Currie and Ferrie (Reference Currie and Ferrie2000) and Naidu and Yuchtman (Reference Naidu and Yuchtman2016). Other variables come from the 1880 Census of Manufacturing and the 1880 Census of Population. More details are provided in the “Data” section of the text and Online Appendix C.
Unionization, Worker Group Size, and Employer Group Size

* = Significant at the 5 percent level.
** = Significant at the 1 percent level.
*** = Significant at the .05 percent level.
† : The estimated relationship between average workers per establishment and unionization is shown in Figure 3.
‡ : The estimated relationship between the number of establishments and unionization is shown in Figure 4.
Notes: The table reports OLS and semiparametric estimates from equation (1) in the text. The unit of observation is a county-by-industry cell. Standard errors, reported in parentheses, are clustered at the county level. The semiparametric estimation is performed using Robinson’s (Reference Robinson1988) double residual estimator with local second-degree polynomial smoothing based on an Epanechnikov kernel function. County-by-industry controls include: average profit to revenue ratio and its square, average profit to cost ratio and its square, average capital per establishment and its square, and the total number of workers in county-by-industry cell.
Sources: The dependent variable comes from union periodicals and the independent variables come from a variety of sources. See the text and Online Appendix C for more details.
The average number of workers per establishment in a county-by-industry cell is defined as the number of workers divided by the number of establishments. When unionization is the dependent variable, I measure the number of workers from the 1880 complete count United States Census (Ruggles et al. Reference Ruggles, Genadek and Goeken2015).Footnote 14 Online Appendix C Table 1 links workers’ occupations in the 1880 census to the industry classification scheme used in the establishments data (from the Report on the Manufactures). For example, I consider anyone who reports his or her occupation as a “cigar maker” or a “tobacco factory operative” in the 1880 census to be a worker in a “Tobacco, cigars and cigarettes” establishment. When strikes are the dependent variable, I use the number of workers reported in the Report on the Manufactures since the industry categories in this report are more comparable to those used in the strikes data.
Because unionization is measured in 1882, 1892, and 1902 and the number of establishments and workers are measured in 1880, it is worth investigating whether workers per establishment in 1880 is a good predictor of workers per establishment in 1900. Friedman (Reference Friedman1998, p. 233) notes “There was little change in the average size of establishments over all industries in this period [1880–1900]. According to the Census of Manufactures, the average American manufacturing establishment employed 10.8 workers in 1880 and only 10.4 in 1900.” While the size of the average manufacturing establishment did not change much, there might have been more dramatic changes within county-by-industry cells. To test if this is the case, I use establishment-level data from Jeremy Atack, Fred Bateman, and Thomas Weiss (Reference Atack, Bateman and Weiss2004). While these data are not available in 1900, I was able to calculate the average number of workers per establishment in a county-by-industry cell in 1860 and 1880. The correlation between the average number of workers per establishment in county-by-industry cells in these two years is 0.71. This high correlation mitigates concerns that the average number of workers per establishment in 1880 is not reflective of the reality in 1900.
Control Variables
From the Report on the Manufactures, I construct the following variables at the county-by-industry level: average wage per worker, the profit to cost ratio (and its square), the profit to revenue ratio (and its square), and the average amount of capital owned by establishments (and its square). The average wage per worker controls for the prosperity of workers, while the profit ratios and capital per establishment control for the amount of resources employers could mobilize against labor.
From the 1880 complete count census, I construct the following variables at the county-by-industry level: percentage of workers that are black, ethnic fractionalization of workers, and the percentage of workers living in an urban designated area. Ethnic fractionalization is defined as the probability that two randomly selected workers in a county-by-industry cell are from a different ethnic group, where the ethnic groups are: native-born whites, native-born blacks, American Indians, native-born Chinese, native-born Japanese, and separate immigrant groups for each country of birth.Footnote 15 The percentage of workers that are black and ethnic fractionalization measure the extent to which racial and ethnic heterogeneity affected collective action. The percentage of workers living in an urban designated area controls for the fact that urban areas were the center of union organization in the late nineteenth and early twentieth centuries.
Finally, I control for the fact that during the late nineteenth and early twentieth centuries union growth occurred in spurts and strikes occurred in waves. For a given county-by-industry cell, I compute the number of strikes and the percentage of strikes that were successful in all other industries in that county in the years prior to my observation of union presence. This method, which is similar to the one used by Huberman and Young (Reference Huberman and Young2002), eliminates the endogeneity between the number and success of strikes in a county-by-industry cell and the probability that a union is organized in that cell.
Estimation Strategy and Summary Statistics
I estimate equation (1) using two different techniques. First, I use ordinary least squares (OLS) and approximate the non-linear functions with a quadratic. Second, I use Peter Robinson’s (Reference Robinson1988) semiparametric estimator. Robinson’s estimator imposes a linear relationship on all of the control variables, but it allows one of the independent variables of interest to take any functional form. As a result, the semiparametric estimator imposes fewer restrictions than OLS on the shape of the relationship between group size and collective action. Standard errors are clustered at the county-level.Footnote 16
The identification of the relationship between group size and collective action in equation (1) relies on three components. First, the nature of the data allows me to difference out fixed, unobserved county-, industry-, and year-specific characteristics that might affect collective action. This eliminates concerns that industries or counties with specific characteristics drive the results.
Second, all of the independent variables of interest are measured in 1880 before the dramatic growth in the labor movement that is shown in Figure 1. There were few unions in the United States prior to 1880, and the membership in the unions that did exist was low. At the start of the decade, local trade societies had an estimated membership of 170,000 workers. By 1890, there were an estimated 822,000 workers in unions (Friedman Reference Friedman1999). In 1886 and 1887 alone, 19 new national unions, each composed of numerous local branches, were formed (Commons et al. Reference Commons, Saposs and Sumner1926, p. 396). By measuring establishment size in 1880 and by measuring collective action later, I am able to eliminate a chief source of endogeneity: establishment sizes might reflect employers’ efforts to prevent unionization. Under this set-up, biased estimates would only occur if employers were able to anticipate the collective action of workers years in advance and, as a result, altered their establishment size by 1880.
The third component of my identification strategy relies on the rich set of control variables. These allow me to control for multiple channels that have been hypothesized to effect unionization and strikes. The three components of my identification strategy eliminate most sources of endogeneity and imply that the estimated relationships between group size and collective action are likely reflective of the costs and benefits of taking collective action.
Before conducting my analysis, I make a few sample restrictions. Both the number of establishments and the average number of workers per establishment exhibit long-right tails as shown in Online Appendix B Figures 5 and 6. Since these variables have little data in their upper-ranges, the estimation of the relationship between group size and collective action becomes noisy. Accordingly, I remove the top 2.5 percent of observations for both variables. The dashed black lines on the figures show where I trim the data (the lines correspond to 130 workers and 65 establishments; when strikes are the dependent variable I trim at 117.5 workers and 102 establishments). This leaves me with a total of 4,316 unique county-by-industry cells representing 796 counties when the dependent variable is unionization. When the dependent variable is strikes, I am left with 5,873 unique county-by-industry cells representing 1,561 counties.
Figure 2 Panel A identifies the 796 counties in my sample and provides a graphical depiction of the within county variation in the average number of workers per establishment in these counties. Counties in light gray contain one industry in which workers could be represented by one of the ten unions in my sample. Counties in the medium shade of gray contain two or more industries in which workers could be represented by one of the unions in my sample. Finally, counties in black have at least two industries and have large within county variation in the number of average workers per establishment. Specifically, these counties have one industry that is in the top 75th percentile and another industry that is in the bottom 25th percentile of workers per establishment within that industry. Figure 2 Panel B is set-up analogously to Panel A, but shows within county variation in the number of establishments. See Online Appendix B for maps of control variables that are analogous to Figure 2.
Counties in Sample
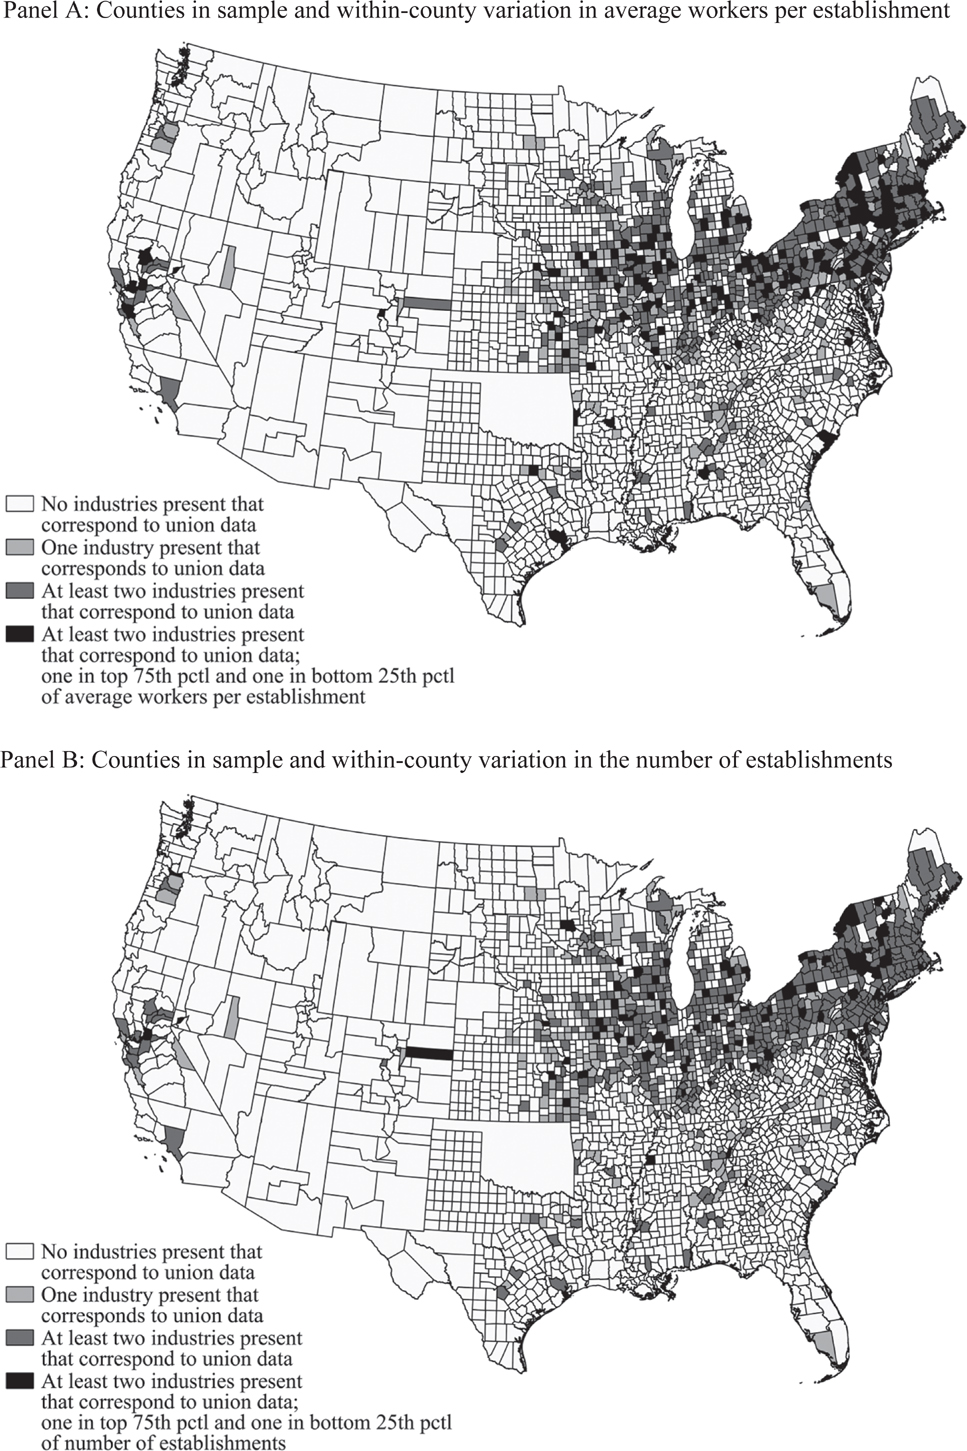
Table 1 displays the sample means of independent variables of interest, broken down by industries for which I have unionization data. The iron and steel industry had the largest number of average workers per establishment (43 workers), whereas the brewing industry had the smallest (4 workers). Printing had the highest average number of establishments (18 establishments), whereas iron and steel had the lowest (5 establishments). Mining and iron and steel were the most racially diverse and had some of the lowest wages per worker. The most ethnically diverse industries were granite cutting and textiles. Granite cutters experienced the highest number of strikes occurring in other industries within their county. Finally, the industry with the highest profit to cost ratio was mining. The last column of Table 1 reports summary statistics when the dependent variable is strikes. Note that strikes are rare events compared to the chartering of a local union. Local unions were chartered in 43 percent of county-by-industry cells, whereas strikes took place in only 4 percent of county-by-industry cells.
Results
Unionization, Worker Group Size, and Employer Group Size
Table 2 presents the estimates of equation (1) when the dependent variable is unionization. In columns (1)–(4) I approximate the functions between group size and unionization using a quadratic in the average number of workers per establishment and the number of establishments. In column (5), I estimate the function between worker group size and unionization semiparametrically, using Robinson’s (Reference Robinson1988) double residual estimator. Finally, in column (6) I estimate the function between employer group size and unionization semiparametrically.
Column (1) tests the main hypothesis that both worker and employer group size matters for unionization. Both the linear and quadratic terms in average workers per establishment are in the expected direction and statistically significant. As shown near the bottom of the table, the average workers per establishment that maximizes the probability of unionization is about 59. The linear and quadratic terms in the number of establishments are also significant and indicate that the probability of unionization is maximized around 34 establishments. Finally, the percentage of workers living in an urban designated area is positive and significant.
Column (2) adds a control for the average wage of workers, which is not statistically significant.Footnote 17 Column (3) adds racial and ethnic heterogeneity controls. The percentage of workers that are black has a negative and significant association with the probability of workers forming a union, with a 1 percentage point increase in black workers decreasing the likelihood of unionization by 0.38 percentage points. The ethnic fractionalization of workers has a positive association with unionization, but it is not statistically significant. Even after adding the racial and ethnic heterogeneity controls, the group size variables remain highly significant. Finally, column (4) includes all other county-level controls, including the number of strikes in other industries and the percentage of these strikes that were successful. The greater the number of strikes in other industries the more likely a union is to form (p-value = 0.25). However, the probability of forming a union actually decreases with the percent of strikes that are successful. A potential explanation for this result is that workers’ success in other industries might make employers more inclined to cooperate with workers even without a union.
The specification in column (4) is the preferred OLS specification since it absorbs all fixed, unobserved county-, industry-, and year-specific characteristics that might be associated with unionization and includes the full set of control variables. The estimated average establishment size that maximizes the probability of unionization varies from 53 workers in column (4) to 59 workers in column (3). Note that modeling group sizes with a quadratic provides a better fit for the data than a linear specification.Footnote 18
To assess the magnitude of the coefficients I assign all county-by-industry cells the number of workers per establishment at the maximum probability of unionization (53 workers), holding all other variables constant. Doing this increases predicted unionization in the cells from 43 to 61 percent (a 42 percent increase). Performing the same exercise for the number of establishments, I find that predicted unionization increases from 43 to 62 percent (a 44 percent increase). These group size effects are much larger than the effects from other variables. For instance, wages have a positive effect on unionization in column (4). Therefore, if I assign all cells the average wage of the highest paying industry, which is $528 a year for printers (see Table 1), unionization increases by less than 1 percentage point (from 42.7 to 42.9 percent). Similarly, assigning all cells 0 percent black workers increases unionization by less than 1 percentage point (from 42.7 to 43.3 percent). A similar exercise can be performed by setting fractionalization equal to 1 and the number of strikes equal to 27.1 (the highest number in Table 1). In both cases unionization never increases above 50 percent. To summarize, the size of worker and employer groups dwarves the effects from other variables.
Online Appendix B Table 1 reports the corresponding estimates for columns (1)–(4) when a logistic regression model is used, as opposed to the linear probability model. The significant, hump-shaped relationships are still present when using the logistic model. Online Appendix B Table 3 reports the corresponding estimates for columns (1)–(4) when union membership is the dependent variable. Union membership data are only available for three unions, all in the year 1892.
Robustness Checks of Relationship Between Worker Group Size and Unionization

* = Significant at the 5 percent level.
** = Significant at the 1 percent level.
*** = Significant at the .05 percent level.
Notes: The table reports OLS and 2SLS from equation (1) in the text. The unit of observation is a county-by-industry cell. Standard errors, reported in parentheses, are clustered at the county level. The instrument for average workers per establishment (and its square) is the average establishment size in industry i in all counties except county c (and its square). All columns control for county fixed effects, industry fixed effects, year fixed effects, percent urban, the number of establishments and its square, the number of strikes, the percent of strikes that were successful, average wage per worker and its square, percent black, ethnic fractionalization, average profit to revenue ratio and its square, average profit to cost ratio and its square, average capital per establishment and its square, and the total number of workers in county-by-industry cell.
Sources: The dependent variable comes from union periodicals and the independent variables come from a variety of sources. See the text and Online Appendix C for more details.
I now turn to the semiparametric estimation. Column (5) of Table 2 shows the estimated coefficients on the control variables when the relationship between average workers per establishment and unionization is estimated semiparametrically. Figure 3 graphs the estimated relationship. The hump-shape is prominent, with the probability of unionizing increasing steeply from 0 to about 25 workers per establishment. The relationship flattens out and remains fairly constant from 25 workers to 70 workers. The probability of unionizing then decreases when average establishment size exceeds 70 workers.
Relationship Between Workers Per Establishment and Unionization

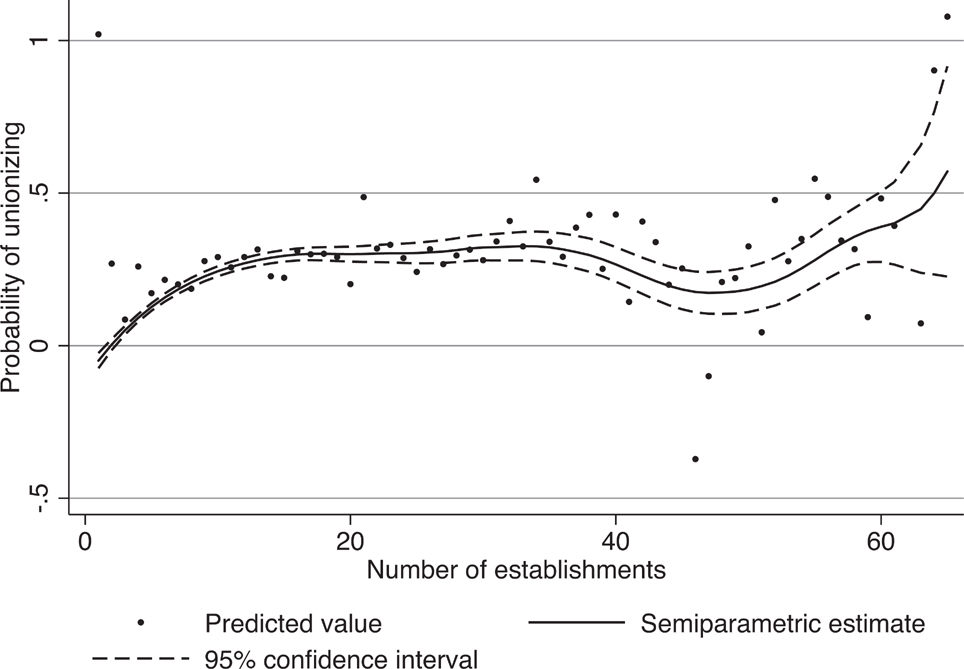
Column (6) of Table 2 shows the estimated coefficients on the control variables when the relationship between the number of establishments and unionization is estimated semiparametrically. Figure 4 graphs the estimated semiparametric relationship. The probability of unionizing increases from 0 to 15 establishments. It then flattens out, but continues to increase slightly. Around 35 establishments the relationship decreases a bit, before increasing again. Therefore, the relationship between the number of establishments and unionization is increasing over almost the entire range.
Relationship Between the Number of Establishments and Unionization
This relationship could exist for a number of reasons. First, if the ideas in the model are taken seriously, then perhaps the benefit to employers of preventing unionization is primarily private (e.g., an increase in profits). This private benefit would create a free-rider problem for employers and result in a decreasing relationship between the number of employers and the probability that they are successful in preventing unionization. Indeed, Friedman (Reference Friedman1998) notes that single firm corporations were more effective at fighting labor than multi-firm employer associations. He writes that “Giant corporations were able to drive unions out of many American industries, including steel, petroleum refining, and meatpacking. These enterprises avoid the employers’ version of the ‘free rider’ problem because anti-union activities could be executed at the command of a single authority who also received the benefits of employer action” (Friedman Reference Friedman1998, pp. 163–64). Dorothee Schneider (Reference Schneider1994) notes that consolidations into large corporations in the brewing industry led to employers successfully fighting labor and Richard Edwards (Reference Edwards1979) finds that large, consolidated corporations such as McCormick, Carnegie, Pullman, General Electric, U.S. Steel, and International Harvester were “more broadly organized than the workers, and the workers lost” (Edwards Reference Edwards1979, p. 50). A second reason for the increasing relationship could simply be that more establishments mean more locations where a union could form.
Finally, while the focus of this article is the origins of the labor movement in the United States, the results described earlier imply that differences in worker and employer group sizes across countries might partially explain differences in the strength of labor movements. I collected establishment size data that shows that the average establishment size might have been smaller in the United States than in some Western European countries. Specifically, average establishment size in the United States around the turn of the twentieth century was approximately 13 workers, while it was 15 workers in Denmark, 24 workers in Norway, and 28 workers in Sweden.Footnote 19
Robustness Checks
Table 3 presents several robustness checks of the main empirical results. All robustness checks are variations of the OLS specification presented in column (4) of Table 2. For brevity, I only report the coefficients for the average number of workers per establishment and its square. The coefficients for the number of establishments and its square are similar to those displayed in Table 2 and are available upon request.
Robustness check (1) adds state-by-industry level controls for the average value added per worker and the average wage inequality in establishments, estimated from the Atack and Bateman (Reference Atack and Bateman2004) samples.Footnote 20 High value added per worker and high wage inequality might entice workers to unionize. Since the Atack and Bateman (Reference Atack and Bateman2004) data are samples, I was not able to estimate these two variables for all state-by-industry cells, which explains the smaller sample size in column (1) of Table 3. However, the relationship between average workers per establishment and unionization remains intact when including these control variables. The average number of workers per establishment at the maximum probability of unionization is around 50.
Robustness check (2) replicates robustness check (1), but uses two-stage least squares (2SLS) and instruments for average workers per establishment (and its square). The instrument for average workers per establishment in a county-by-industry cell is the average number of workers per establishment in all other cells within that industry. The logic behind this instrument is that the average establishment size in all other cells should only affect the probability of unionization in the cell under consideration through its ability to predict average establishment size. When using this instrument, the hump-shaped relationship remains significant and the average number of workers per establishment at the maximum probability of unionization barely changes. The first-stage F-statistic on the linear term is 31, and it is 27 on the quadratic term. Furthermore, the Cragg-Donald statistic is 93, indicating that the instruments are strong predictors of the average number of workers per establishment and its square.
Robustness check (3) estimates the relationship between average establishment size and unionization using only data from the year 1892. Similarly, robustness check (4) estimates the relationship using only data from the year 1902. In both cases the hump-shaped relationship is present. Finally, robustness checks (5)–(14) separately estimate the relationship for each of the 10 industries in my sample. All of the industries display some sort of hump-shaped relationship, with the linear and quadratic terms being statistically significant in five of the industries (the quadratic term for machine products in robustness check (11) has a p-value of 0.11).
Strikes and Establishment Size
Table 4 presents estimates of equation (1) when the dependent variable is strikes. It is organized analogously to Table 2. Year fixed effects are not included in these specifications because the strikes variable takes a value of one if a county-by-industry cell experienced a strike any time during the period 1881–1894 (in other words, the variable does not have a time dimension). Furthermore, since few counties ever experienced a strike, I use state fixed effects instead of county fixed effects in Table 4.Footnote 20 The number and success of strikes in other county-by-industry cells is not included because of endogeneity concerns. To understand this, consider the example where the dependent variable takes a value of one because a strike occurred in a county-by-industry cell in 1882. If this strike initiated a wave of strikes in other industries it would be inappropriate to use the number and success of these other strikes as an explanatory variable.
Strikes, Worker Group Size, and Employer Group Size

* = Significant at the 5 percent level.
** = Significant at the 1 percent level.
*** = Significant at the .05 percent level.
† : The estimated relationship between average workers per establishment and strikes is shown in Figure 5.
‡ : The estimated relationship between the number of establishments and strikes is shown in Figure 6.
Notes: The table reports OLS and semiparametric estimates from equation (1) in the text. See notes to Table 2. Standard errors for the semiparametric estimates are clustered at the state level.
Sources: The dependent variable comes from Currie and Ferrie (Reference Currie and Ferrie2000) and Naidu and Yuchtman (Reference Naidu and Yuchtman2016) and the independent variables come from a variety of sources. See the text and Online Appendix C for more details.
Columns (1)–(4) display the significant hump-shaped relationships between group size and strikes. The estimated establishment size at the maximum probability of striking varies from 37 in column (4) to 58 in columns (1) and (2). The number of establishments that maximize the probability of striking is quite large in all specifications and ranges from 159 in column (4) to 188 in column (1). Online Appendix B Table 2 reports the corresponding estimates of Table 5 when a logistic regression model is used. The significant, hump-shaped relationship is still present when using this model.
Unionization and Average Establishment Size by Fixed Costs

* = Significant at the 5 percent level.
** = Significant at the 1 percent level.
*** = Significant at the .05 percent level.
† : The estimated relationship between average workers per establishment and unionization for low fixed cost unions is shown in Figure 7.
‡ : The estimated relationship between average workers per establishment and unionization for high fixed cost unions is shown in Figure 7.
Notes: The table reports OLS and semiparametric estimates from equation (1) in the text. See notes to Table 2. Low fixed cost unions are the CMIU, IMU, ITU, and UGWA, which each had a chartering fee of $5. High fixed cost unions are the AA ($25), Brewery Workers ($10), Leather Workers ($12), and UMW ($15).
Sources: The dependent variable comes from union periodicals and the independent variables come from a variety of sources. See the text and Online Appendix C for more details.
Semiparametric estimates are reported in columns (5) and (6) of Table 4, and Figures 5 and 6 display the relationships of main interest. In Figure 5, the hump-shaped relationship between average workers per establishments and strikes is, again, noticeable with the probability of striking increasing steeply from 0 to 30 workers per establishments. The relationship then decreases with some undulation. In Figure 6, the relationship between the number of establishments and strikes actually appears to be increasing linearly until around 70 establishments. The relationship then decreases a bit, before increasing again. Therefore, the relationship between the number of establishments and strikes is increasing over almost the entire range of establishments. Again, this relationship could exist because of the free-rider problem or because more establishments mean more locations where a strike could occur.
Relationship Between Workers Per Establishment and Strikes

Relationship Between the Number of Establishments and Strikes

Finally, I use the coefficients in column (4) of Table 4 to assess the magnitude of the effects. If all county-by-industry cells are assigned the number of workers per establishment at the maximum probability of striking (37 workers) predicted strikes increase from 3.8 to 5 percent (a 32 percent increase). Performing the same exercise for the number of establishments and assigning all cells the maximum number in my sample (102) I find that predicted strikes would have increased from 3.8 to 19 percent. Again, it can be shown that these group size effects are much larger than the effects associated with other variables.
Chartering Fee Results
According to the model, the fixed costs of forming a union play a key role in whether workers decide to take collective action. It is an immediate implication of the model that the number of workers per establishment that maximizes the probability of union formation will increase as fixed costs increases. In this section, I exploit variation in the fixed costs of chartering a union to test whether this was the case.
In the late nineteenth and early twentieth centuries, unions were federated organizations consisting of local branches, with some autonomy, and a national headquarters. To form a local branch of a national union, a group of workers had to submit a monetary “chartering” fee to the national headquarters. After receiving this fee, the headquarters provided the workers with a charter for the branch and the workers received all the benefits of being a member of a nation-wide union. Using the Reports of the Industrial Commission on Labor Organizations (1901), I obtained information on the chartering fees in 1901 for eight of the ten unions that I study. I break these unions into two groups, low chartering fees and high chartering fees, and estimate equation (1) separately for each group. Low fixed cost unions are the CMIU, IMU, ITU, and UGWA, each having a chartering fee of $5. High fixed cost unions are the AA ($25), Brewery Workers ($10), Leather Workers ($12), and UMW ($15).
While these chartering fees are small by today’s standards, they appear substantial when inflated by wages. For example, a $5 chartering fee in 1900 is about $700 in today’s wages and a chartering fee of $25 would be about $3,500 (the wage index comes from Officer and Williamson Reference Officer and Williamson2017). Even a $5 chartering fee could have been substantial in per capita terms. For example, the national headquarters of the CMIU charged $5 for a charter. In my data, the median size of a cigar-making establishment was six workers. If all workers split the chartering fee evenly then each worker would pay $0.83, or approximately $113 in today’s wages. It is also important to keep in mind that the chartering fee was just one of many fees that union members paid.
The results from estimating equation (1) for low and high fixed cost unions are displayed in Table 5. I do not include the number of establishments in these regressions since the fixed costs of forming a union should only affect the relationship between worker group size and collective action. Columns (1) and (3) repeat the specification from column (4) of Table 2 for the high and low fixed cost industries. Both the linear and quadratic terms for average workers per establishment are not statistically significant, likely due to the reduction in sample size. Most importantly, the number of workers per establishment at the maximum probability of forming a union is 40 for the low fixed cost unions, while it is 49 for the high fixed cost unions (these maximums are not statistically different from each other). Columns (2) and (4) of Table 5 report the semiparametric estimates, and Figure 7 displays the relationship of main interest. Again, the number of workers per establishment at the maximum probability of forming a union is 38 for the low fixed cost unions, while it is 44 for the high fixed cost unions. Both the low fixed cost and the high fixed cost unions display a notable hump-shaped relationship, despite the OLS coefficients not being significant. The most important thing to note in Figure 7 is that fewer workers are needed to overcome the costs in the low fixed cost unions. The results in Table 5 and Figure 7 are in alignment with the prediction of the model that more workers are needed to take collective action when fixed costs increase.
Relationship Between Workers Per Establishment and Unionization by Fixed Costs

Conclusion
The nineteenth century labor movement is often imagined as a large, nationwide movement in which workers gained class-consciousness and employers fought against the formation of unions. In reality, of course, the labor movement was made up of individual workers who decided how much of their own effort to commit to improving workers’ prospects in their communities. Employers, likewise, decided how many resources should be mobilized to prevent their workers from unionizing and striking. In this article, I argue that when making these decisions, workers and employers weighed the costs and benefits of their effort. Theory suggests that there is a hump-shaped relationship between the probability of collective action and group size as long as there is a fixed cost to taking collective action and the benefit has characteristics of both public and private goods.
I explore whether this hump-shaped relationship existed in the United States by compiling a new county-by-industry level dataset containing information on local union locations, strike locations, and accurate measures of group size for the largest industries in the late nineteenth and early twentieth centuries. The empirical analysis confirms the intuition of the theoretical predictions; there was, indeed, a hump-shaped relationship between the average number of workers in an establishment and the likelihood that they formed a union or went on strike. This result holds across two independent measures of collective action (unionization and strikes), two different estimation techniques (quadratic and semiparametric), and is robust to many potential confounding influences. I also find some evidence that the relationship between the number of establishments and the probability of workers unionizing was increasing. I present a number of explanations for this finding including that employers face a free-rider problem and, therefore, a smaller number of employers may have an easier time mobilizing.
The findings of this article imply that variation in the size of worker and employer groups helped to shape the labor movement in the United States. Workers were more likely to form a union and more likely to strike in locations and industries with approximately 50 workers, which is in the middle of the range of average establishment sizes. Similarly, unions were more likely to form and strikes were more likely to occur in locations and industries with a large number of employers. The conclusion of this article is that much of the variation in labor strength within the United States can be explained by the size of worker and employer groups. Accordingly, differences in group sizes across countries might partially explain the exceptional weakness of the American labor movement.
Finally, this article does not rule out alternative theories of collective action in the United States. In fact, my empirical analysis finds some support for these alternative hypotheses, such as racial heterogeneity making it difficult for workers to organize. Rather, this article is designed to call attention to a theory that has received little consideration, and even fewer empirical tests, in the literature on the origins of the American labor movement.


