

Introduction
Mammal populations in Africa are declining significantly as highlighted by the Living Planet Index, which reports a catastrophic 76% decline in vertebrate wildlife populations from 1970 to 2020 (WWF, 2024). Wildlife declines in Africa are also ubiquitous within protected areas, but more pronounced in West African protected areas (85% decline) compared to those in East Africa (52% decline; Western et al., Reference Western, Russell and Cuthil2009; Craigie et al., Reference Craigie, Baillie, Balmford, Carbone, Collen, Green and Hutton2010). Notably, in some cases declines are similar or even greater inside protected areas compared to unprotected areas (Western et al., Reference Western, Russell and Cuthil2009). Some studies have pointed to socio-political drivers, as measured for example by the Human Development Index score, as factors explaining differences in conservation effectiveness.
Many protected areas facing financial constraints turn to wildlife tourism to meet conservation goals whilst addressing economic and social challenges. Tourism can generate revenue, garner public support for conservation and create local employment, sometimes diverting communities away from poaching and other harmful activities. Nevertheless, it can also cause habitat degradation and fragmentation as a result of tourism infrastructure and disturbance to wildlife. As such, tourism can be both a critical tool for protected area sustainability and a potential threat to conservation goals (An et al., Reference An, Dinh, Thoai, Kien, Dung and Phan2022; Quintal et al., Reference Quintal, Cheng, Sung and Hooshmand2023).
The effects of tourism on wildlife vary across species and ecosystems. Some species avoid areas of high human disturbance whilst others seek them out (Caldwell & Klip, Reference Caldwell and Klip2022). Anthropogenic noise can alter bird species richness (Potvin et al., Reference Potvin, Gilby, Anderson and Watson2023), and tourist trails may homogenize mammal communities (Lei et al., Reference Lei, Zheng, Cui, Zhao, Newman and Zhou2023). Concentrated human activity can also prompt temporal avoidance by wildlife, especially during breeding or drought seasons (Lindsey et al., Reference Lindsey, Roulet and Romañach2007; Ouboter et al., Reference Ouboter, Kadosoe and Ouboter2021). Despite these effects, research on the impact of tourism in African protected areas is scarce and often narrowly focused on single taxa or isolated biological facets (Liu et al., Reference Liu, Yue, Liu, Wen and Tong2022; Torsney & Buckley, Reference Torsney and Buckley2023). This gap is particularly concerning given the significant projected growth of wildlife tourism in Africa. The African safari tourism market is expected to reach USD 34,564 million by 2033, growing at a compound annual growth rate of 5.8% from 2025 to 2032. The World Tourism Organization reported a 48% rise in international tourist arrivals to Africa in 2023, with projections suggesting that these numbers could double from 62 million in 2022 to 134 million by 2030 (Deviputra, Reference Deviputra2025). This growth underscores the need for rigorous monitoring and integration of tourism effects into management plans (Ouboter et al., Reference Ouboter, Kadosoe and Ouboter2021).
Ghana’s largest, most diverse and premier protected area, Mole National Park, is central to wildlife conservation and ecotourism in the country. Ghana’s management plan aims to expand tourism into less-visited areas (Wildlife Division, 2023), necessitating deeper insights into how this may affect wildlife.
To provide these insights, we assessed the impact of wildlife tourism on medium- to large-sized mammals in Mole National Park by examining species richness and abundance, activity patterns (daily rhythms), and the presence and abundance of juveniles along a gradient of tourism activity. We hypothesized a negative correlation between tourism and species richness/abundance and expected that most species shift their activity to avoid peak human presence, particularly in high-tourism areas. We also predicted fewer juveniles in high-tourism areas. To guide future development, we discuss the implications of expanding tourism, especially into currently low-tourism areas, and propose recommendations for low-impact tourism in the Park and similar protected areas in Africa.
Study area
This study was carried out in Mole National Park (Fig. 1), Ghana’s largest protected area at c. 4,577 km2 (Wildlife Division, 2023). The Park lies in the savannah region (Peprah et al., Reference Peprah, Aabeyir, Boasu, Peprah, Aabeyir and Boasu2023; Salifu, Reference Salifu2023) and experiences a dry tropical climate, with annual rainfall of 1,200 mm in the south and 1,000 mm in the north; over 90% falls from April to October, peaking in July and September. The dry season extends from November to March, with mean temperatures of c. 28 °C (range 26–31 °C) and a day–night variation of c. 13 °C (Majeed, Reference Majeed2016; Wildlife Division, 2023).
Mole National Park, Ghana, West Africa, showing camera-trap locations in low-, medium- and high-tourism zones.

The Park’s landscape is dominated by Guinea savannah woodland, with gallery forests along waterways (Adu-Poku et al., Reference Adu-Poku, Obeng, Mensah, Kwaku, Acheampong, Duah-Gyamfi and Adu-Bredu2023). This vegetation type constitutes Ghana’s most extensive zone, covering 148,000 km² (Dowsett-Lamaire & Dowsett, Reference Dowsett-Lamaire and Dowsett2008). The Park harbours c. 93 mammal species (Wildlife Division, 2023). Beyond its ecological value, it functions as a tourism hub and a centre of traditional practices and cultural heritage (Acquah et al., Reference Acquah, Dearden and Rollins2016; Majeed, Reference Majeed2016). Thirty-three farming communities live within 5 km of its borders (Obour et al., Reference Obour, Asare, Ankomah and Larson2016; Arowosafe, Reference Arowosafe2022), across five districts (Lawer et al., Reference Lawer, Kuuder and Nasiru2013). As of 2023, the Park was Ghana’s leading ecotourism destination, with management projecting 20,000 annual visits by 2024 (Wildlife Division, 2023).
Methods
Data collection
We collected data during February 2020–August 2021. We deployed 23 camera traps across three tourism zones in the Park. We defined tourism zones (high, medium and low) qualitatively based on long-term, established patterns of tourist visits and infrastructure, and persistent human activity. The high-tourism zones included c.10 km around Park headquarters and recreational facilities where consistent human presence occurred daily from management activities, patrols and research in addition to tourism. The medium-tourism zones had lower monthly human presence overall and were c. 20 km away from the headquarters and tourism facilities. Low-tourism zones were over 25 km away from the Park’s headquarters and tourism facilities; they received almost no tourists visits, and Park management activities were limited to occasional extended patrols.
Our survey period coincided with the Covid-19 pandemic, which saw a reduction in tourist visits to the Park. However, our study design, which defined tourism zones based on long-term, established patterns of anthropogenic use and infrastructure such as staff housing, recreational facilities, management activity and research traffic, provided a valuable opportunity to assess the persistent impacts of human activity. These non-tourist human activities largely continued during the study period. We collected data predominantly during the rainy seasons, when natural resources were abundant, mammal breeding peaked and c. 60% of the Park’s tourism occurred. In each tourism zone, we installed at least one camera in each of the distinct sub-habitats including riverine forests, woodlands, grasslands and bovals, capturing a broad range of mammals in the Park. Cameras were set to operate continuously, capturing a single photograph when triggered by a passing animal (with a minimum delay of 30 s between consecutive triggers) and registering date and time for each capture.
Image processing and analysis
We processed all camera-trap images using Camelot software (Hendry & Mann, Reference Hendry and Mann2018), with species identification guided by McIlwaine (Reference McIlwaine1998) and Kingdon (Reference Kingdon2015). Where possible, we classified individuals by sex and age based on body size, morphology and behaviour. We identified juveniles by their relatively smaller size, immature proportions or distinct coat patterns. When these attributes were unclear, we classified individuals as adults of unknown sex. To avoid recounting the same individuals, we considered a capture as independent if it occurred at least 30 minutes after the previous one of the same species or showed clear demographic differences (group size, sex or age). This method, developed specifically for this study, addressed the limitations of using time alone, particularly for species such as olive baboons Papio anubis and common warthogs Phacochoerus africanus that can linger at a camera trap for extended periods. We implemented this approach using a custom R function that integrated both temporal thresholds and demographic identifiers to evaluate sighting independence.
We employed quantitative and descriptive analyses to examine associations between tourism and (1) species richness and relative abundance indices (RAI), including differences in richness and relative abundance indices amongst trap stations and tourism zones, (2) species daily activity patterns, (3) juvenile presence and relative abundance indices, and (4) differences between carnivore and ungulate relative abundance indices. We used non-parametric tests when data violated the assumptions for appropriate parametric tests. We performed all analyses and generated graphics in R 4.3.0 (R Core Team, 2023), with packages including overlap, activity, dunn.test, lsr and stats.
Species richness and relative abundance
To evaluate the adequacy of our survey effort, we generated accumulation curves for each tourism zone based on trap-days. We estimated total species richness in the Park (Chao1_total), species richness in each tourism zone (Chao1_zone) and per-camera species richness (Chao1_camera) using the Chao 1 estimator to account for undetected species (Chao et al., Reference Chao, Gotelli, Hsieh, Sander, Ma, Colwell and Ellison2014). We then calculated the RAI as the number of independent detections per 100 trap-days for each species at each camera (RAI_camera), for each guild (e.g. carnivores and ungulates) within each zone (RAI_guild) and for all species combined in each tourism zone (RAI_zone). We assessed whether there were significant differences between Chao1_camera and Chao1_zone, and RAI_camera, RAI_guild and RAI_zone using ANOVA and Kruskal–Wallis H tests where applicable. When a Kruskal–Wallis test indicated a significant overall difference, we applied a Dunn’s post-hoc test with a Bonferroni correction for multiple comparisons to identify which pairs differed.
Diel activity pattern analysis
We analysed species’ diel activity patterns by treating the time stamp of each independent sighting as a continuous circular variable on a 24 h scale. Only the species with ≥ 75 total independent sightings and ≥ 10 sightings per tourism zone were included in this analysis. Using the activity package in R (Rowcliffe et al., Reference Rowcliffe, Kays, Kranstauber, Carbone and Jansen2014), we generated kernel density plots to visualize activity patterns. We calculated the coefficient of overlap (D̂4) as recommended by Rovero & Zimmermann (Reference Rovero and Zimmermann2016) to quantify the similarity between activity patterns in each pair of tourism zones. We used the compareCkern function with 1,000 bootstrapped replicates (Rowcliffe et al., Reference Rowcliffe, Kays, Kranstauber, Carbone and Jansen2014) to test for significant differences between activity patterns.
For the interpretation of significant shifts in activity, we used the following descriptive categories to typify outcomes; ‘activity’ refers to the timing of sighting, which serves as an index of species presence and relative activity levels. We defined temporal categories as nocturnal (detections occurring primarily during night-time hours, c. 19.00–05.59); diurnal (detections primarily during daytime hours, c. 06.00–18.59); crepuscular (detections concentrated around dawn, c. 05.00–07.00, and dusk, c. 18.00–20.00). A statistically significant shift towards nocturnal activity, for example, would be interpreted as a lower coefficient of overlap between zones, driven by a greater proportion of night-time detections in one zone compared to the other.
Juvenile presence and activity analysis
To assess the impact of tourism on the presence and activity of juveniles, we first quantified juvenile presence by counting the total number of independent sightings of juveniles for each species within each tourism zone. For species with sufficient juvenile detections (≥ 20), we then compared their diel activity patterns to those of adults from the same tourism zone. This comparison used the coefficient of overlap (D̂1), recommended for sample sizes < 75 (Rovero & Zimmermann, Reference Rovero and Zimmermann2016).
Results
Survey effort and species detection
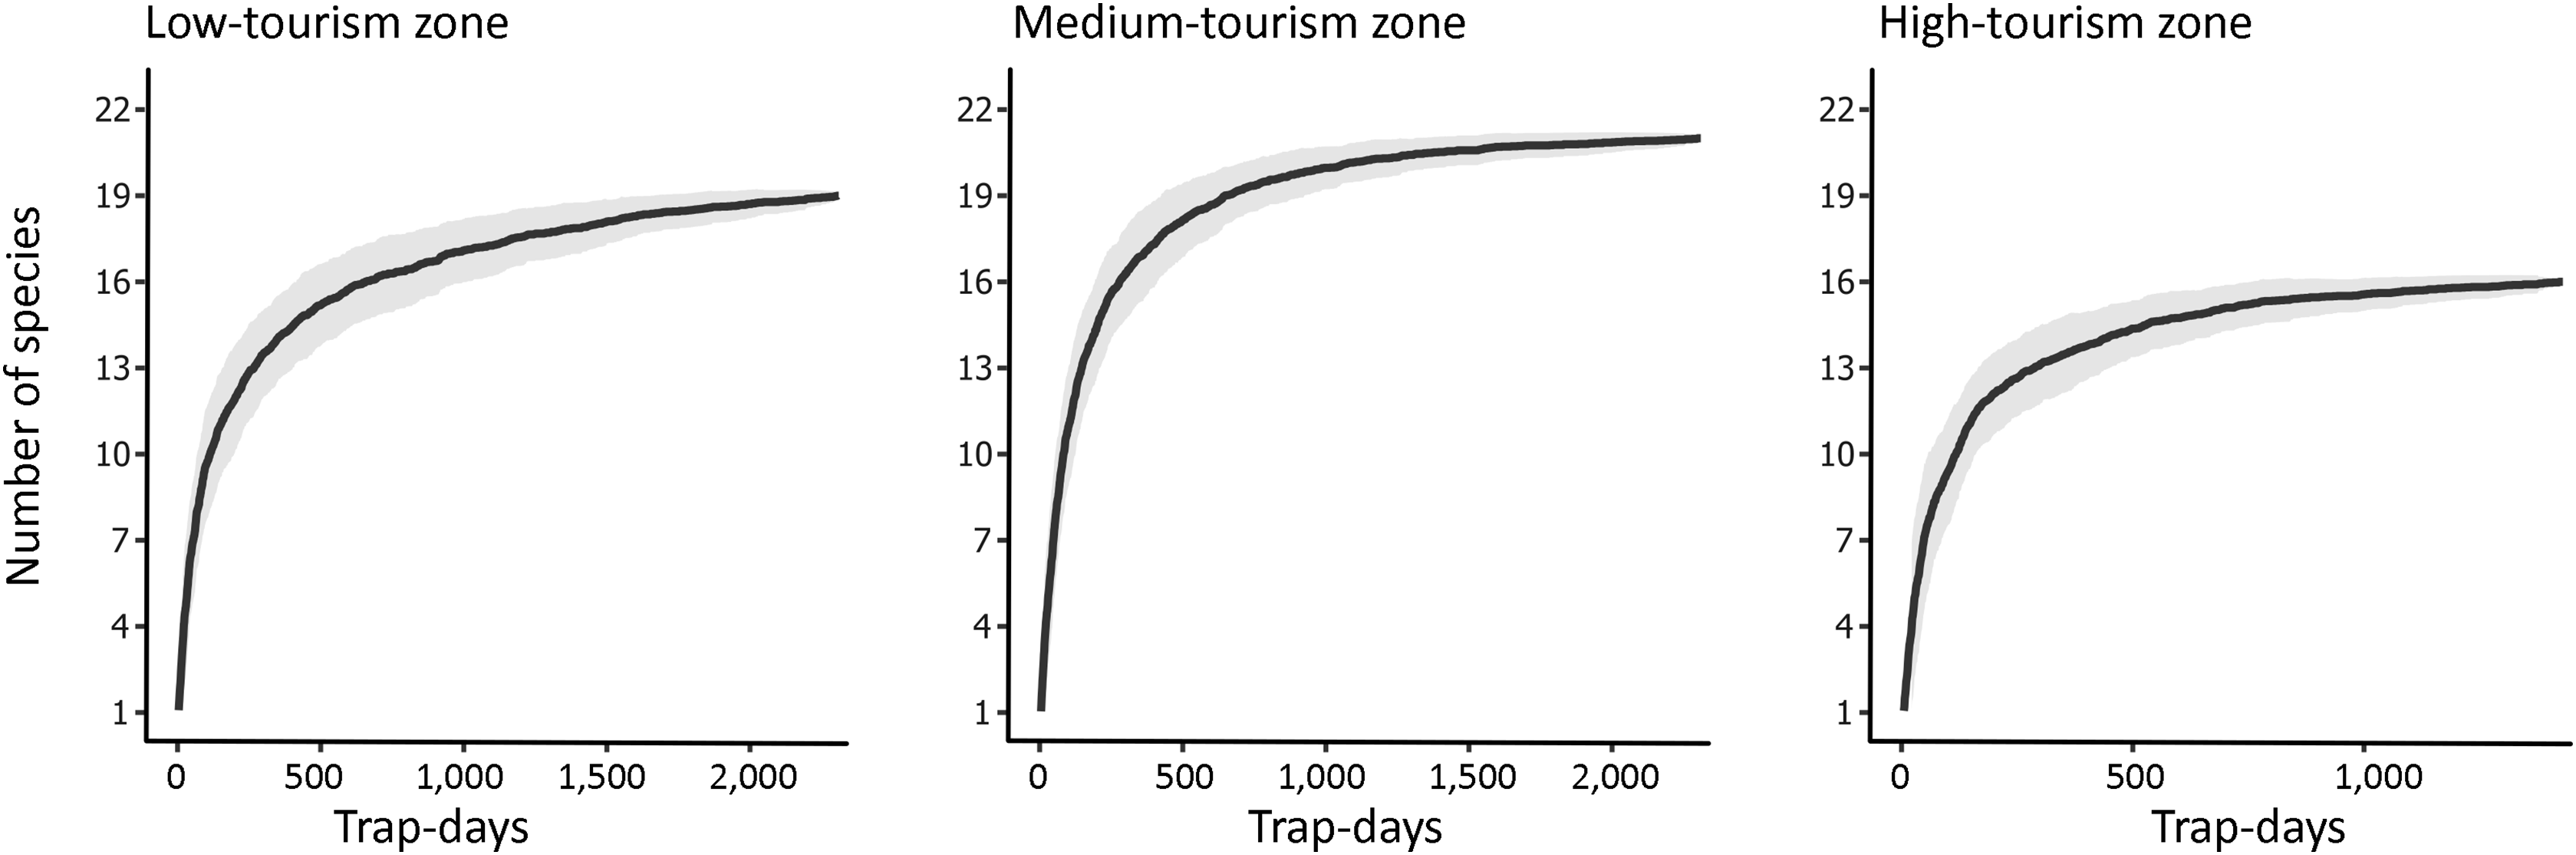
Of the 23 camera traps deployed, data from three were lost to rain damage, animal damage (spotted hyaena Crocuta crocuta) and SD card theft, leaving 20 cameras distributed amongst five high-, six medium- and nine low-tourism zones. These accumulated 6,050 trap-days (2,310 each in low- and medium-tourism zones, 1,430 in high-tourism zones) and yielded 2,593 independent sightings of 24 mammal species (Fig. 2). Accumulation curves (Fig. 3) showed balanced and adequate sampling effort, with all zones approaching an asymptote at c. 400 trap-days. We also recorded eight potential poachers in low-tourism zones, and 98 tourists and 24 wildlife guards in high- and medium-tourism zones. We found no significant difference in species detection rates across zones (χ 2, H2 = 0.68, P = 0.71).
Relative abundance index (RAI, log-transformed) of mammal species observed across zones with different tourism levels (high, medium, low) in Mole National Park, Ghana. Species are grouped by guild along the x-axis. Species with statistically significant differences in RAI across tourism levels (P < 0.005) are denoted by a star.

Species richness and relative abundance
Overall estimated species richness (Chao1_total) throughout the study area was 24.5 ± SD 1.29. Zone-level estimates (Chao1_zone) were 19.5 (low tourism), 21.0 (medium tourism) and 16.0 (high tourism). We found no significant difference in species richness (Chao1_camera) across tourism zones (ANOVA, F2,17 = 1.62, P = 0.23). Similarly, RAI_camera did not differ significantly between zones (Kruskal–Wallis, H = 0.27, df = 19, P = 0.874). The RAI for the high-, medium- and low-tourism zones were 100.5, 56.6 and 90.7, respectively. The RAI_camera mean was 82.89± SD 95.55 (range 3.50–358.74).
However, clear patterns emerged between guilds (RAI_guild). The RAI for ungulates was significantly higher than for carnivores across all tourism zones (ANOVA, F1,33 = 10.00, P = 0.003). In addition, bushbuck Tragelaphus scriptus (RAI 14.69), waterbuck Kobus ellipsiprymnus (8.88), kob Kobus kob (8.11), African buffalo Syncerus caffer (7.55) and roan antelope Hippotragus equinus (5.45) were more common in the high-tourism zones. In contrast, spotted hyaena (2.64), western hartebeest Alcelaphus buselaphus major (10.30) and African savannah elephant Loxodonta africana (2.55) were more common in low-tourism zones. In general, we found species such as common warthog, olive baboon, spotted hyaena and African savannah elephant in all zones, but their numbers varied (Fig. 2). Eight (33%) of the 24 species detected were rare across all zones: the leopard Panthera pardus, scrub hare Lepus saxatilis, striped ground squirrel Xerus erythropus, side-striped jackal Canis adustus, caracal Caracal caracal, African civet Civettictis civetta, long-snouted mongoose Xenogale naso and patas monkey Erythrocebus patas (Fig. 2).
Diel activity pattern analysis
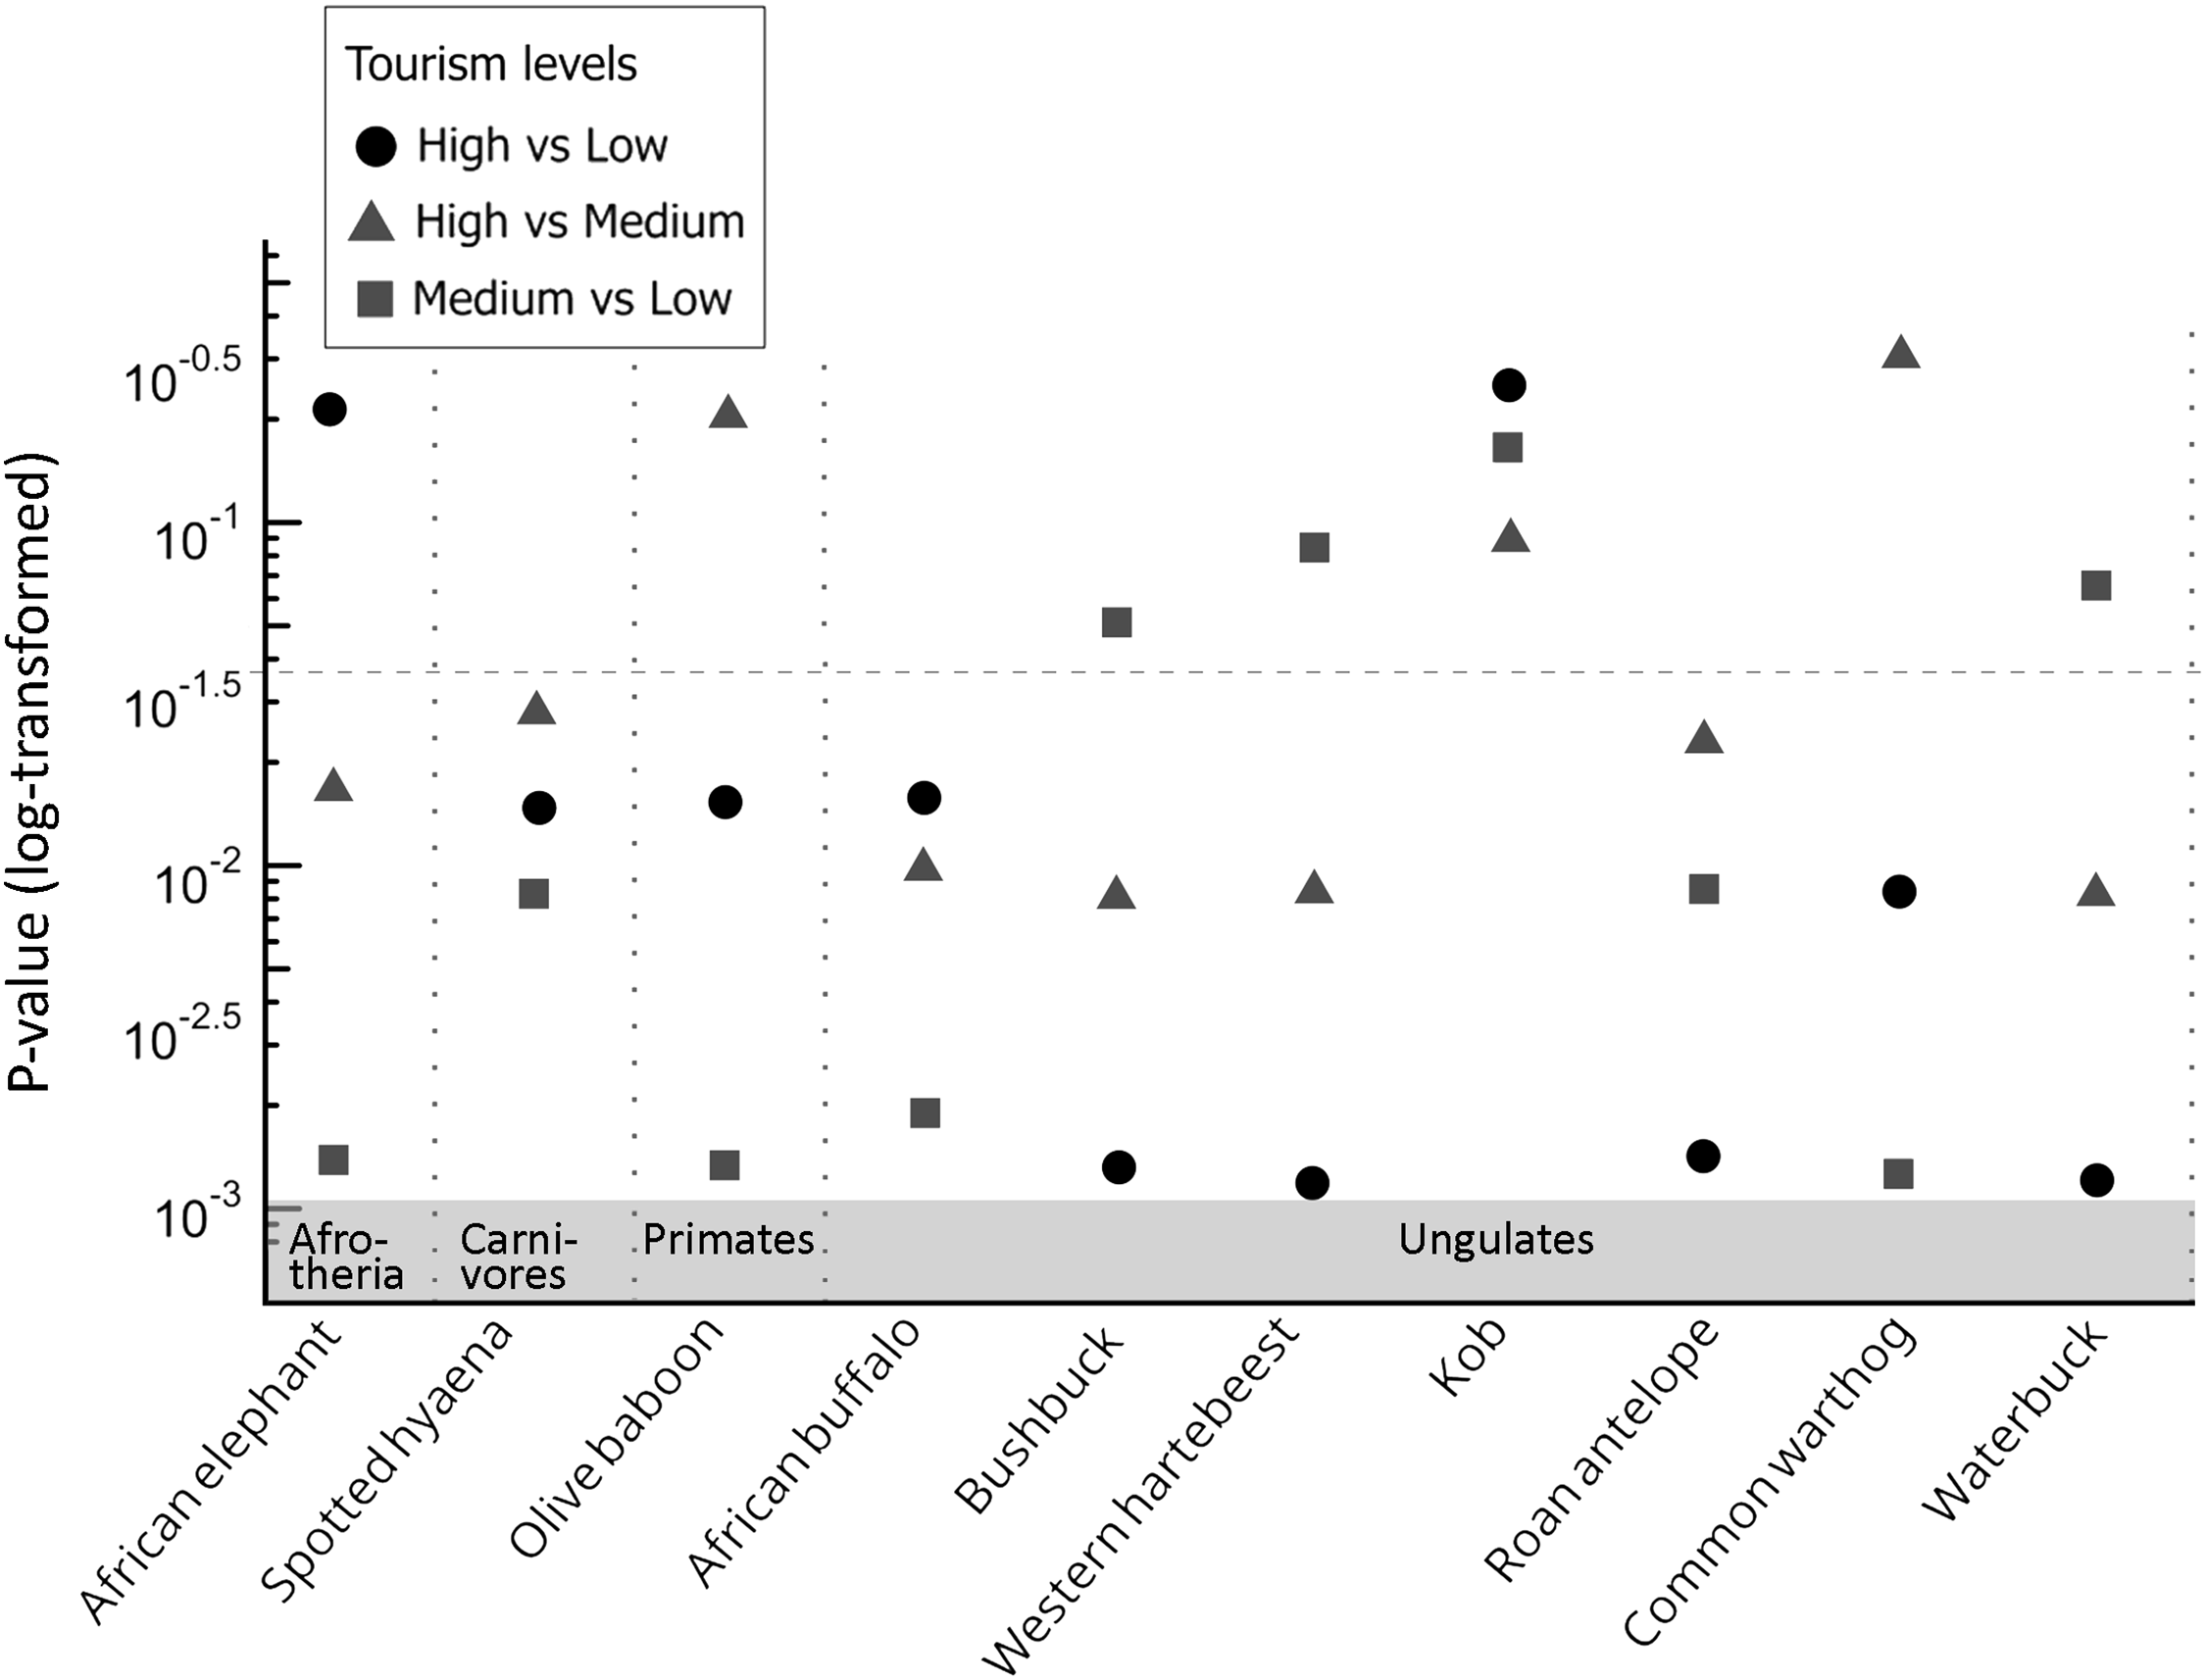
Ten species (n ≥ 75 total sightings, ≥ 10 per zone) were included in the activity pattern analysis: bushbuck (410), western hartebeest (358), African buffalo (309), waterbuck (292), common warthog (289), kob (231), olive baboon (160), roan antelope (145), spotted hyaena (104) and African savannah elephant (99). All species except kob (P ≥ 0.130, permutation test using compareCkern from the activity package) showed significant differences in daily activity patterns between tourism zones (Fig. 4; Supplementary Fig. 1). Of the species analysed, 78% exhibited more diurnal activity in low-tourism zones and shifted to more nocturnal activity in high-tourism zones (Fig. 5). We observed this shift in bushbuck, African buffalo, African savannah elephant, waterbuck, roan antelope, spotted hyaena and western hartebeest (Supplementary Figs 1, 2, 3). The remaining 22% displayed a different pattern, with activity peaks occurring at midday in high-tourism zones (Fig. 5; Supplementary Fig. 2).
Species accumulation curves showing camera-trapping effort (trap-days) and the cumulative number of species recorded in each tourism zone in Mole National Park, Ghana, throughout the study. The dark solid line indicates the mean number of species accumulated, and the grey shaded area depicts 95% confidence intervals of the standard deviations computed from 1,000 random replications.

Statistical significance (log-transformed P-values) of differences in daily activity patterns of mammal species across high-, medium- and low-tourism zones in Mole National Park, Ghana. Pairwise comparisons are shown for each species: high vs low, high vs medium, and medium vs low. Species are grouped by guild along the x-axis. The dashed horizontal line marks the P = 0.05 significance threshold.

Fig. 4 Long description
Panel A: A scatter plot representing the statistical significance of differences in daily activity patterns of mammal species across high-, medium-, and low-tourism zones in Mole National Park, Ghana. The x-axis lists mammal species grouped by guild, including Afrotheria, Carnivores, Primates, and Ungulates. The y-axis shows the log-transformed P-values. Data points are represented by circles, triangles, and squares, indicating comparisons between high vs low, high vs medium, and medium vs low tourism levels, respectively. A dashed horizontal line marks the P = 0.05 significance threshold. Notable patterns include clusters of data points below the significance threshold for certain species, indicating significant differences in activity patterns across tourism levels.
Activity overlap plots showing the temporal activity patterns of six species: (a) bushbuck Tragelaphus scriptus, (b) roan antelope Hippotragus equinus, (c) spotted hyaena Crocuta crocuta, (d) waterbuck Kobus ellipsiprymnus, (e) kob and Kobus kob (f) olive baboon Papio anubis. The y-axis in each plot represents the kernel-density estimate of activity intensity across the 24 h cycle, where the area under the curve equals 1, with different lines representing high-, medium- and low-tourism areas. The plots demonstrate how tourism intensity influences the activity patterns of these species, with bushbuck, roan antelope, spotted hyaena and waterbuck exhibiting shifts from diurnal to more crepuscular or nocturnal behaviours in high-tourism areas, whereas kob and olive baboon showed a consistent activity peak around midday regardless of tourism levels.

Juvenile presence and activity analysis
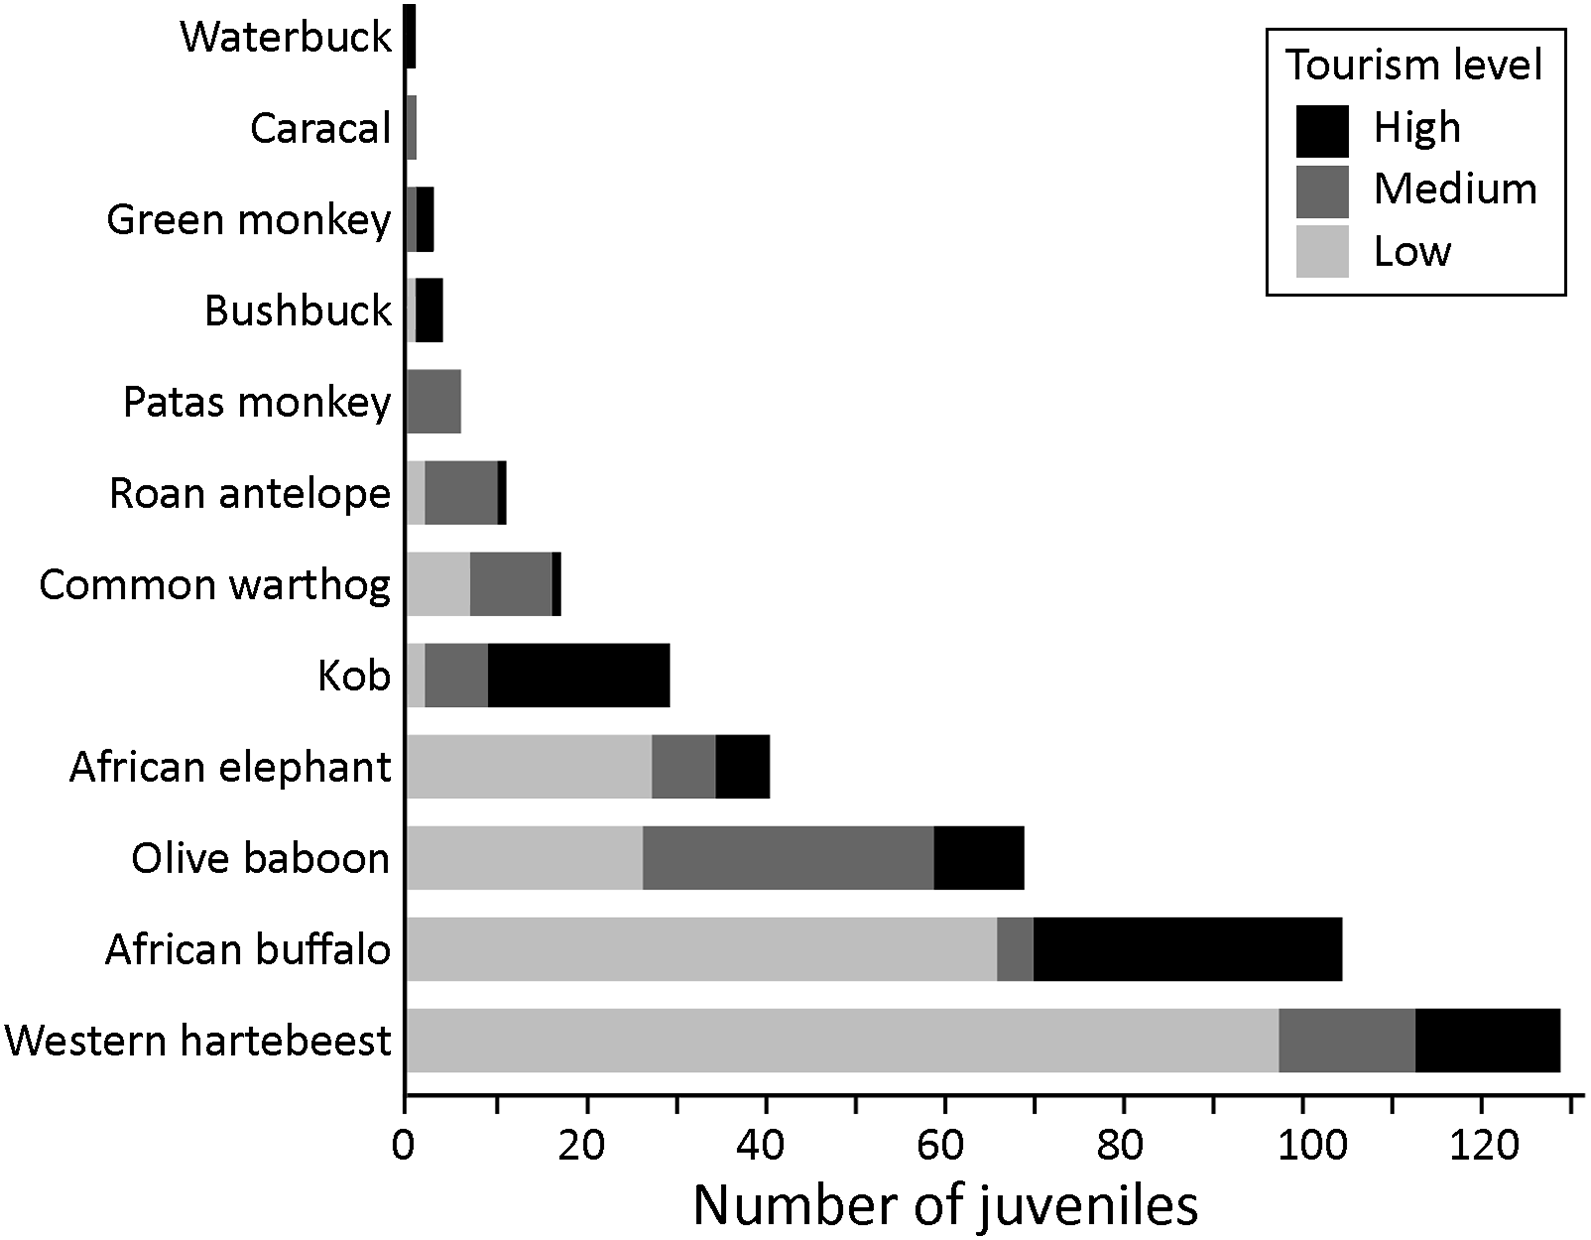
We recorded juveniles from 12 mammal species: western hartebeest, African buffalo, olive baboon, African savannah elephant, kob, common warthog, roan antelope, patas monkey, bushbuck, green monkey Chlorocebus sabaeus, caracal and waterbuck (Fig. 6). The total number of juvenile sightings differed significantly across tourism zones (Kruskal–Wallis, H = 7.857, df = 2, P = 0.020). Juvenile sightings were highest in low-tourism zones (n = 226), which was significantly higher than in medium-tourism zones (n = 90; Dunn’s test, P = 0.030). The high-tourism zone had a similar count to the medium-tourism zone, with 94 sightings (Fig. 6).
Total counts of juveniles of medium-sized to large mammals recorded in Mole National Park, Ghana, across high-, medium- and low-tourism zones.

For the five most common juvenile species (western hartebeest, olive baboon, African savannah elephant, African buffalo and kob), activity patterns largely mirrored those of adults within each zone. However, significant differences emerged when comparing patterns between zones. Juvenile western hartebeest and African buffalo were more nocturnal in high-tourism zones compared to low-tourism zones (P < 0.03 and P < 0.01, respectively). For African savannah elephants, activity was significantly higher in high-tourism than in medium-tourism zones (P = 0.001), with a clear shift towards late evening and night-time activity (Fig. 5; Supplementary Figs 4, 5). No significant difference was observed in juvenile kob activity between tourism zones (P > 0.23).
Discussion
Our analysis supports the hypothesis that most species adjust their behaviour in response to tourism intensity. Nine of the 10 species analysed showed significant shifts in daily activity between tourism zones. Notably, 78 % of species were more nocturnal in high-tourism zones, most probably to avoid peak human activity. This pattern is consistent with findings from studies on mammal behaviour elsewhere, including American black bears Ursus americanus and coyotes Canis latrans in Colorado, USA (Lewis et al., Reference Lewis, Spaulding, Swanson, Keeley, Gramza, VandeWoude and Crooks2021), and several other species in Brownsberg Nature Park, Suriname (Ouboter et al., Reference Ouboter, Kadosoe and Ouboter2021), where increased levels of nocturnal activity were linked to human disturbance.
Although our study coincided with the Covid-19 pandemic, which led to movement restrictions and a significant drop in the number of tourist visitors to the Park (2019: 18,740 tourists; 2020: 8,554 tourists; 2021: 13,043 tourists), there remained a consistent human presence in the high-tourism zone. Management activities, ranger patrols and research centred around the Park headquarters and recreational facilities persisted throughout the study period. Therefore, the observed behavioural shifts in high-tourism zones, even with temporarily lower tourist numbers, most probably reflected a long-term response to human presence and habitat modification rather than an acute response to current tourist numbers. Most species not only altered their activity patterns to avoid people but many avoided these areas entirely, with significantly lower RAI compared to the low-tourism zone.
Overall, our results indicate that the Park’s medium-sized to large mammals in high-tourism zones have adapted to human presence by shifting their activity patterns, a response that persisted despite reduced tourism during the Covid-19 period, indicating a long-term, learnt avoidance of human-dominated zones. This behavioural adjustment allows mammals to access critical resources such as water during times of low human activity rather than abandoning these areas entirely. Notably, juveniles in high-tourism zones mirrored the nocturnal behaviour of adults and were less abundant compared to low- and medium-tourism zones (Supplementary Fig. 5). Adults may also avoid bringing young into high-tourism zones, as observed by Szott et al. (Reference Szott, Pretorius and Koyama2019) who recorded African savannah elephants with calves avoiding waterholes heavily visited by tourists. Consequently, we argue that these ingrained behavioural changes are likely to persist for generations, irrespective of fluctuations in tourism levels, and may not reverse quickly even if tourist numbers decline significantly.
The observed temporal niche partitioning may enable species in the Park to reduce encounters with people whilst still utilizing key resources in these zones, a strategy also identified by for black bears and coyotes in high-use recreational areas in North America. Although this plasticity allows access to critical resources such as waterholes in high-tourism zones, it may also increase the risk of predation, as species congregating around these limited resources are more likely to encounter the few predators in the Park. For example, carnivores such as spotted hyaenas, which were abundant in high-tourism areas, may exploit these aggregations. In addition, altered activity patterns may affect energy budgets, foraging efficiency and interspecific interactions, and could lead to long-term effects on health and reproductive success that warrant further examination. For instance, consistent avoidance of people can result in chronic stress and increased energy expenditure, potentially leading to physiological imbalances and suppressed immune function. Furthermore, displacement to sub-optimal habitats or altered foraging patterns to minimize interactions with people can reduce nutritional intake. This can impact body condition and ultimately lower reproductive rates or offspring survival, as Di Nicola et al. (Reference Di Nicola, Mols and Smit2023) observed with ungulates in Dutch forests where foraging success was affected as vigilance increased.
The midday activity peak exhibited by olive baboons and common warthogs in high-tourism zones suggests habituation to human presence. Both species are omnivores with high behavioural flexibility. Baboons are particularly synanthropic and well adapted to human-modified environments, and warthogs are highly adaptable and often found near human settlements. In Mole National Park both species are frequently observed near Park infrastructure, most likely benefiting from food waste discarded by people. This affinity for densely peopled areas has been reported previously (Ukkola, Reference Ukkola, Helle, Huhta, Jokimäki and Kaisanlahti2007) and linked to increased access to food. In addition to ecological flexibility, a close association between wildlife and people has been linked to human health concerns. A study in the Park found that baboons and warthogs often interacted with people near staff residences and carried high loads of intestinal parasites, including species implicated in zoonotic diseases such as Strongyloides spp. and Schistosoma mansoni (Larbi et al., Reference Larbi, Akyeampong, Addo, Dakwa, Boampong and Opoku-Nketiah2020). Similarly, kob displayed a consistent midday activity peak across all zones, probably reflecting reduced sensitivity to human disturbance and the Park’s low predator and poacher presence. These patterns mirror the human shield hypothesis, also observed in impala Aepyceros melampus in Kruger National Park and in prey species elsewhere (Mulero-Pázmány et al., Reference Mulero-Pázmány, D’Amico and González-Suárez2016; Cifuentes-Ibarra et al., Reference Cifuentes-Ibarra, Mark Elbroch, Ohrens, Infante and Bonacic2023; Fennell et al., Reference Fennell, Ford, Martin and Burton2023).
African savannah elephants, however, showed increased diurnal activity in medium-tourism zones compared to low- and high-tourism zones (Supplementary Fig. 3). This may be a result of the habitat structure in these zones, which provides a balance of vegetation cover for refuge and access to water sources. Similar behaviour has been observed previously, with higher tourist pressure altering elephant activity times and increasing their vigilance near waterholes (Szott et al., Reference Szott, Pretorius and Koyama2019). Our findings suggest that elephants in medium-tourism zones forage and seek shelter during the day whilst accessing water during crepuscular hours in high-tourism zones to avoid disturbance from people.
Although our analysis showed no significant variation in relative abundance indices across zones, ungulates were consistently more abundant than carnivores. This pattern reflects the expected trophic structure, with herbivores naturally more abundant than predators. The low abundance of carnivores was consistent across all zones and aligns with previous studies in the Park (Burton et al., Reference Burton, Sam, Kpelle, Balangtaa, Buedi and Brashares2011; Awini et al., Reference Awini, Goded and Annorbah2021; Drouilly et al., Reference Drouilly, Hurrion and Pryce-Fitch2022). For instance, leopard, caracal and side-striped jackal had lower RAI in all zones than ungulates such as bushbuck, western hartebeest, waterbuck and kob.
For juveniles, abundance was significantly higher in low-tourism zones compared to medium- and high-tourism zones for all species. Similar patterns were reported by Behera et al. (Reference Behera, Kumar, Priya, Ramesh and Kalle2022) and Hubbard et al. (Reference Hubbard, Cove and Lafferty2022) who found reduced juvenile presence in areas with high anthropogenic activity from recreational disturbance. Adults may favour low-tourism areas for breeding and nurturing young, perceiving these as safer, less disturbed environments. In support of our findings in Mole National Park’s low-tourism zones, low-impact zones elsewhere have been identified as crucial for wildlife species that nurture their young (McClung et al., Reference McClung, Seddon, Massaro and Setiawan2004; Jacobson et al., Reference Jacobson, Riggio, Tait and Baillie2019). Expanding tourism and persistent human presence in such zones could threaten reproductive success, leading to long-term declines in population recruitment. The higher juvenile abundance in low-tourism zones suggests these areas may act as source populations for subpopulations in medium- and high-tourism zones, as less disturbed areas have been reported to support greater reproductive success, potentially sustaining populations in more disturbed regions (Baudains & Lloyd, Reference Baudains and Lloyd2007; Lowe et al., Reference Lowe, Rogers and Durrant2014). Future research should examine seasonal movements and home range patterns within the Park to confirm potential source–sink dynamics.
We estimated medium-sized to large mammal species richness to be 24 across the three tourism zones, slightly lower than the 28 and 36 species reported by Awini et al. (Reference Awini, Goded and Annorbah2021) and Drouilly et al. (Reference Drouilly, Hurrion and Pryce-Fitch2022), respectively. This difference may reflect our limited spatial coverage, sampling during the wet season only and reduced detectability in dense vegetation (Kays et al., Reference Kays, Hody, Jachowski and Parsons2021; Wearn et al., Reference Wearn, Bell, Bolitho, Durrant, Haysom and Nijhawan2022). Unlike Drouilly et al. (Reference Drouilly, Hurrion and Pryce-Fitch2022), who recorded honey badgers Mellivora capensis and Senegal galagos Galago senegalensis in low numbers, we did not capture these species. Lions Panthera leo and wild dogs Lycaon pictus were not detected in our study nor in several earlier studies, suggesting they may be extirpated or extremely rare in the Park. Our study focused on tourism impacts on behaviour rather than conducting a full species inventory, which may also explain the lower species richness. The indication from species accumulation curves is that increased survey effort, expanding surveillance into the dry season or increasing spatial coverage of camera traps could improve the detection of rare or cryptic species.
We recorded eight non-uniformed armed individuals in low-tourism areas, presumed to be poachers. Poaching appeared low overall, probably as a result of regular anti-poaching patrols and the presence of rangers and tourists in medium- and high-tourism zones. Whilst our cameras occasionally captured images of tourists and staff, these detections are not reliable indicators of visitation rates as the cameras were placed to monitor wildlife activity.
The Park’s current management plan (Wildlife Division, 2023), which seeks to expand tourism into under-utilized low-tourism zones, warrants careful reconsideration. Although it assumes increased tourism poses no overcrowding or ecological risks, our findings suggest that species may already be responding to existing tourism pressure. Proposed activities such as night safaris could intensify the disturbance of species showing increased nocturnal activity, potentially leading to stress or behavioural shifts. Moreover, increased human presence in low-tourism zones, which are critical for juvenile survival, could further disrupt these habitats and affect population recruitment. While tourism development is important for the Park’s long-term strategy, it must be balanced with ecological, conservation and sustainability priorities to avoid unintended consequences for wildlife.
Conclusions and recommendations
Based on our findings, we recommend a number of measures to guide tourism management and future development in the Park, which have been reviewed and endorsed by the Park’s management. Firstly, we recommend that Park authorities should prioritize the protection and expansion of areas with minimal human disturbance, especially those important for breeding and juvenile development. We recommend restrictions on tourist access during peak breeding periods and in sensitive wildlife areas. Tourism activities should be confined to daylight hours and night-time tours should be discouraged. Guidelines that encourage respectful distances and species-sensitive wildlife viewing should be promoted. We recommend that Park managers establish a monitoring system to track changes in species behaviour and abundance over time, and develop conservation strategies tailored to vulnerable species and those showing signs of sensitivity to the presence of people.
Although our study offers critical insights, further research should incorporate direct data on tourist numbers, activities, and their spatial and temporal patterns to refine tourism-level designations. Long-term studies that consider seasonal shifts in wildlife abundance and tourism levels are also needed, alongside habitat analyses to isolate tourism effects from broader environmental variation. Closer attention to predator declines and ungulate increases could clarify ecological trends, whilst assessments of wildlife stress responses may reveal health impacts of tourism.
In conclusion, our study highlights complex, species-specific responses to tourism in Mole National Park, Ghana. Although overall mammal richness appears resilient to current tourism levels, marked differences in juvenile abundance and activity patterns reflect the effects of human disturbance. These findings underscore the need to protect undisturbed areas and adopt a cautious, research-informed approach to future development. Adaptive strategies based on continued monitoring and research can help the Park balance its dual roles as a wildlife sanctuary and an ecotourism destination. These insights contribute to our understanding of wildlife–tourism interactions and provide guidance for managing similar ecosystems where conservation and tourism intersect.
Supplementary material
The supplementary material for this article is available at doi.org/10.1017/S0030605325102500
Author contributions
Study design, fieldwork: SA, SG, AM, NNDA; image processing: SA; data analysis: SA, MC; writing, revisions: SA, MC, SG, NNDA.
Acknowledgements
We thank the wildlife guards at Mole National Park for their invaluable fieldwork assistance, and all reviewers for their constructive feedback. Fieldwork costs were funded by The Explorers Club (USA). The International Birds Conservation Partnership and the Wildlife Division of Ghana provided field assistance and equipment, including camera traps. The Finnish National Agency for Education (EDUFI Fellowship) through the University of Helsinki, Finland, provided funding for data analysis training and manuscript preparation.
Conflicts of interest
None.
Ethical standards
This research abided by the Oryx guidelines on ethical standards. No formal permit for fieldwork was required, as researchers affiliated with the University for Development Studies (UDS), where SA and NNDA were based at the commencement of the study, may conduct research in Mole National Park under a Memorandum of Understanding between UDS and the Park. No human subjects were involved and no experimentation with animals was conducted. Although some camera-trap photographs inadvertently included people (tourists, researchers, wildlife guards, potential poachers), these images were separated and processed in strict confidentiality. Only the number of individuals, their category (tourist, researcher, etc.), date, time and location were recorded. All original images containing human subjects were discarded immediately following data extraction.
Data availability
The data that support the findings of this study are available from the corresponding author upon reasonable request.





 Open access

